lehman brothers 9th annual global healthcare conference march 8, 2006
DESCRIPTION
Lehman Brothers 9th Annual Global Healthcare Conference March 8, 2006. Forward-Looking Statements. - PowerPoint PPT PresentationTRANSCRIPT

Lehman Brothers9th Annual Global Healthcare
ConferenceMarch 8, 2006

2
Statements included in this presentation or in the oral comments made as part of this presentation may contain forward-looking statements, including but not limited to statements of the Company’s plans, objectives, expectations or intentions, that involve risk and uncertainties.
The Company’s actual results may differ significantly from those projected or suggested in any forward-looking statement due to a variety of factors, which are discussed in detail in the Company’s filings with the Securities and Exchange Commission.
Forward-Looking Statements

3
Today’s Challenging Environment:
Maintaining Access to Safe and Affordable Drugs

4
% Increase in Unmanaged PMPY Cost
11.311.211.612.011.810.6
15.5
18.5
0
4
8
12
16
20
2002 2003 2004 2005 2006 2007 2008 2009
Perc
ent
Rx's Cost
Unmanaged Prescription Drug Trend
Plan Sponsors Will Likely Increase the Use of PBM Tools to Manage Drug Spend
Source: 2004 Drug Trend Report

5
Our Value Proposition: Complete Alignment
To reduce pharmacy costs, without compromising health
outcomes, while maximizing patient satisfaction

6
Ability to
manage trend
2-tier
3-tier
Step Therapy
Exclusive Home Delivery
As Plan Sponsors Take Advantage of Our Tools
to Better Mange Trend, The Better We Perform
The Art of Trend Management -- Alignment
High Performance Formulary
Restricted Retail Network
Generic Utilization Programs
Specialty Pharmacy
Plan sponsor appetite for innovative clinical tools

7
1. Evaluate relative clinical value
Cost per prescription
Alignment - Building a Formulary
Drug A
Drug B
Drug C
$60$50 $70 $80
Rela
tive c
linic
al
valu
e

8
1. Evaluate relative clinical value
2. Determine net cost
Cost per prescription
Alignment - Building a Formulary
Drug A
Drug B
Drug C
$60$50 $70 $80
Rela
tive c
linic
al
valu
e

9
Cost per prescription
Drug A
Drug B
Drug C
Most cost effective
Rela
tive c
linic
al
valu
e
$50 $60 $70 $80
Alignment - Building a Formulary
1. Evaluate relative clinical value
2. Determine net cost
3. Account for market share
AA BB
CC

10
1. Evaluate relative clinical value
2. Determine net cost
3. Account for market share
4. Account for rebates
Cost per prescription
Rela
tive c
linic
al
valu
e
$50 $60 $70 $80
Drug A
Drug B
Drug C
Most cost effective
Alignment - Building a Formulary
AA BB
CC
AA BB

11
1. Evaluate relative clinical value
2. Determine net cost
3. Account for market share
4. Account for rebates
5. Select formulary products
Cost per prescription
Rela
tive c
linic
al
valu
e
$50 $60 $70 $80
Drug A
Drug B
Drug C
Most cost effective
Drug C
Drug ADrug B
Most cost effective
Alignment - Building a Formulary
Exceptions: * Market dynamics can trump net
cost* High Performance Formulary
AA BB
CC

12
More Number of Drugs Fewer
Ben
efi
t O
pti
on
s
Impact on Client
Impact on Patient
Impact on ESI
Lower drug cost
More choice
Lower co payment
More choice
Higher Profit/Rx
More Flexibility
Alignment – Formulary Management
Therapy Class
We Provide Flexible Formulary Management
1. Select number of drugs in therapy class 2. Determine formulary control 3. Drive towards lowest overall cost
# ofdrugs
# ofdrugs
# ofdrugs
Open
DifferentialCo-pay
ClosedLowestOverall
Cost

13
Alignment – Generic Utilization
Generic Utilization Rate
38%40%42%44%46%48%50%52%54%56%
Q1 0
2
Q2 0
2
Q3 0
2
Q4 0
2
Q1 0
3
Q2 0
3
Q3 0
3
Q4 0
3
Q1 0
4
Q2 0
4
Q3 0
4
Q4 0
4
Q1 0
5
Q2 0
5
Q3 0
5
Q4 0
5
ESI PBM B PBM CImpact on
ClientImpact on
PatientImpact on
ESI
Lowest drug cost
Lowest co payment
Highest profit/Rx
Source: From public filings
Express Scripts Leads in Generic Utilization

14
ESI Analysis
Our Clients and Members Will Benefit From a Growing Generic Opportunity
Alignment – Growing Generic Opportunity

15
Impact on Client
Impact on Patient
Impact on ESI
Lower drug cost
Lower co payment
Higher Profit/Rx
Alignment – Clinical Programs
0
2
4
6
8
10
12
14
16
Mil
lio
ns
Q1 2003 Q4 2004 2006E
Members in Step Therapy Programs
Clients using step therapy realize on average a
2 percentage point increase in generic utilization
Plan Designs Encourage Greater Use of
Generics and Preferred Low-cost Brands

16
Alignment – Specialty Pharmacy
Sources:IMS Data through November 2004Wall Street Equity Research, 2004CMS National Healthcare Expenditure Projection: 2003 – 2013Data on file: CuraScript.
2004 Total Outpatient Pharmacy Spend $190 Billion
2008 Projected Outpatient Pharmacy Spend $283 Billion
26%26%18%18%
Traditional SpendTraditional Spend$210 Billion$210 Billion
Specialty SpendSpecialty Spend$73 Billion$73 Billion
Specialty SpendSpecialty Spend$35 Billion$35 Billion
Traditional SpendTraditional Spend$155 Billion$155 Billion
Impact on Client
Impact on Patient
Impact on ESI
Lower drug cost
Lower co payment
Higher profit/Rx
Improved reporting
Improved quality of
care
Higher client
satisfaction
Clients are Seeking Solutions for High-cost
Specialty Drugs
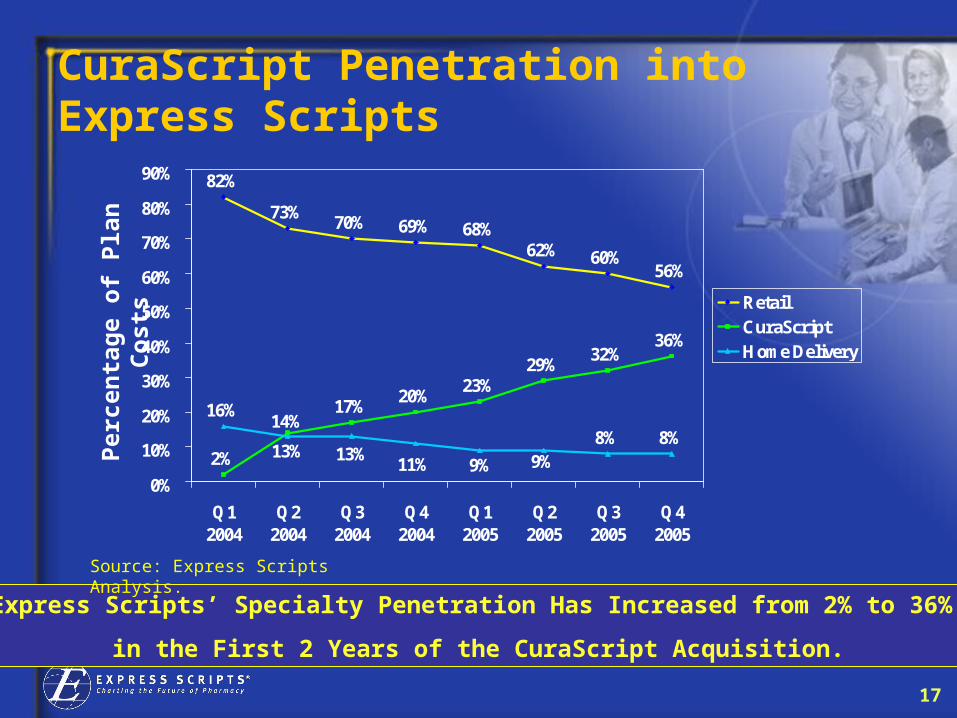
17
Express Scripts’ Specialty Penetration Has Increased from 2% to 36%
in the First 2 Years of the CuraScript Acquisition.
Per
cent
age
of P
lan
Cos
ts
Source: Express Scripts Analysis.
82%
73%70% 69% 68%
62% 60%56%
2%
17%20%
23%29%
32%36%
16%
8% 8%14%
9%9%11%13%13%
0%
10%
20%
30%
40%
50%
60%
70%
80%
90%
Q12004
Q22004
Q32004
Q42004
Q12005
Q22005
Q32005
Q42005
RetailCuraScriptHome Delivery
CuraScript Penetration intoExpress Scripts

18
Alignment – Home Delivery
Impact on Client
Impact on Patient
Impact on ESI
Lower drug cost
Choice
Lower co paymentChoice
Higher profit/Rx
We Offer Highly Efficient, Cost-effective
Home Delivery

19
16.4%
18.5%
21.6%
25%-26%
22.3%
20.2%
17.2%
13.8%12.6%
15.8%
13.1%
0
100
200
300
400
500
600
Ad
just
ed C
laim
s* (
mill
ion
s)
12.0%13.0%14.0%15.0%16.0%17.0%18.0%19.0%20.0%21.0%22.0%23.0%24.0%25.0%26.0%
% m
ail p
enet
ratio
n
Total Adjusted Claims Home Delivery Penetration
* Represents network claims plus 3 times home delivery claims –home delivery claims are 90 days vs. 30 days in the network.
D IVERSIFIED®
Increased home delivery penetration
Home Delivery Helps Manage the Cost of Maintenance Drugs
Alignment – Growing Demand for Home Delivery
Excludes UHC claims
20
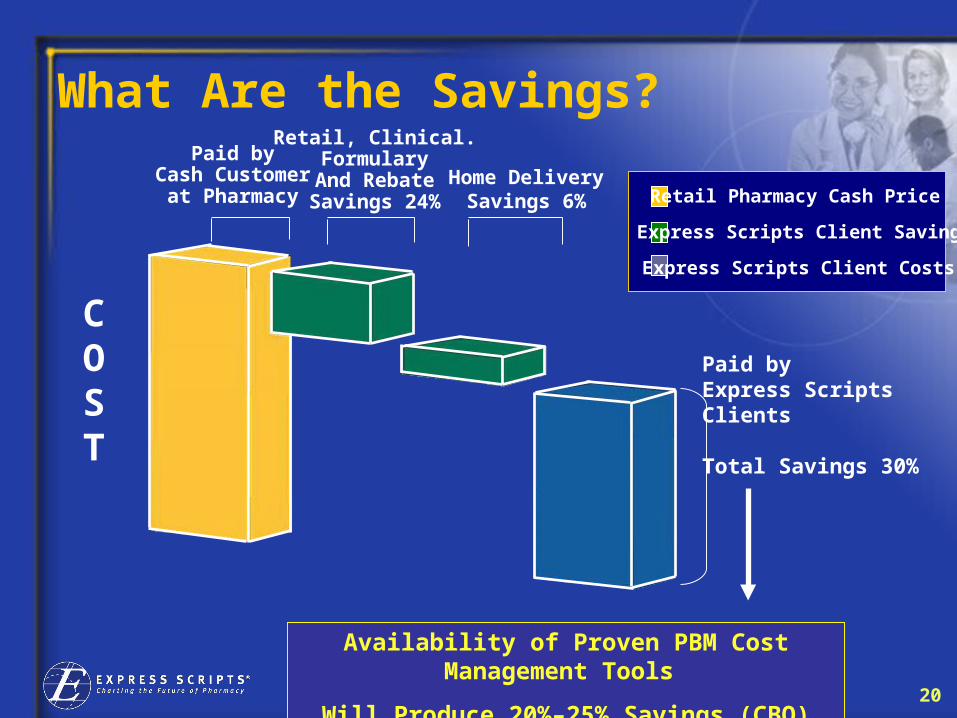
What Are the Savings?
Availability of Proven PBM Cost Management Tools
Will Produce 20%–25% Savings (CBO)
Paid byCash Customer
at Pharmacy
Retail, Clinical.Formulary
And RebateSavings 24%
Home Delivery
Savings 6%
Paid byExpress ScriptsClients
Total Savings 30%
COST
Retail Pharmacy Cash Price
Express Scripts Client Savings
Express Scripts Client Costs

21
Alignment – A Win-Win-Win Proposition
Retail Non-pref. Brand
Retail Pref.
BrandGenerics
Mail Pharma
cy
Increased Savings
Opportunities:
Client
Member
Increased
Profit
Opportunities:
Express Scripts
Moving to preferred brands, home delivery and generics
We Make Money by Saving Clients and Members Money
Moving to preferred brands, home delivery and generics
Moving to preferred brands, home delivery and generics

22
We Deliver Against Client and Patient Expectations:
To make the use of prescription drugs safer and
more affordable

23
Client/Patient Focus
Commercial24%
Canada12%
Managed Care40%
Public Sector24%
By membership
Health Plan Sponsors Recognize Express Scripts Single
Focus on Making Prescription Drugs More Affordable
Why Express Scripts?• Alignment With Clients• Trend management tools• Generics• Specialty

24
Client Satisfaction continues to improve..
Increases Were Recognized in All Categories With
Likelihood to Renew Showing the Largest Increase
78%80%82%84%86%88%90%92%94%96%98%
ESI Performance ExceedsExpectations
Likelihood toRecommend
2003 2004 2005

25
Our Financial Results
Express Scripts has demonstrated a proven track
record

26
Q4 2005 Highlights
– Adjusted EPS of $0.77*, up 45% from $0.53 last year
• For 2005, adjusted EPS of $2.60*, up 34% from 2004
– Cash flow from operations of $262 M vs. $193 M last year
• For 2005, cash flow of $793 M vs. $496M in 2004
– Gross profit of $364 million, up 38%• Gross profit per adjusted claim was $2.54, up 34%
– EBITDA of $220 M, up 42% • EBITDA per adjusted claim was $1.53, up 37%
* Reconciliation of reported EPS to adjusted EPS is included in Table 4 of the 4Q 2005 earnings release
27
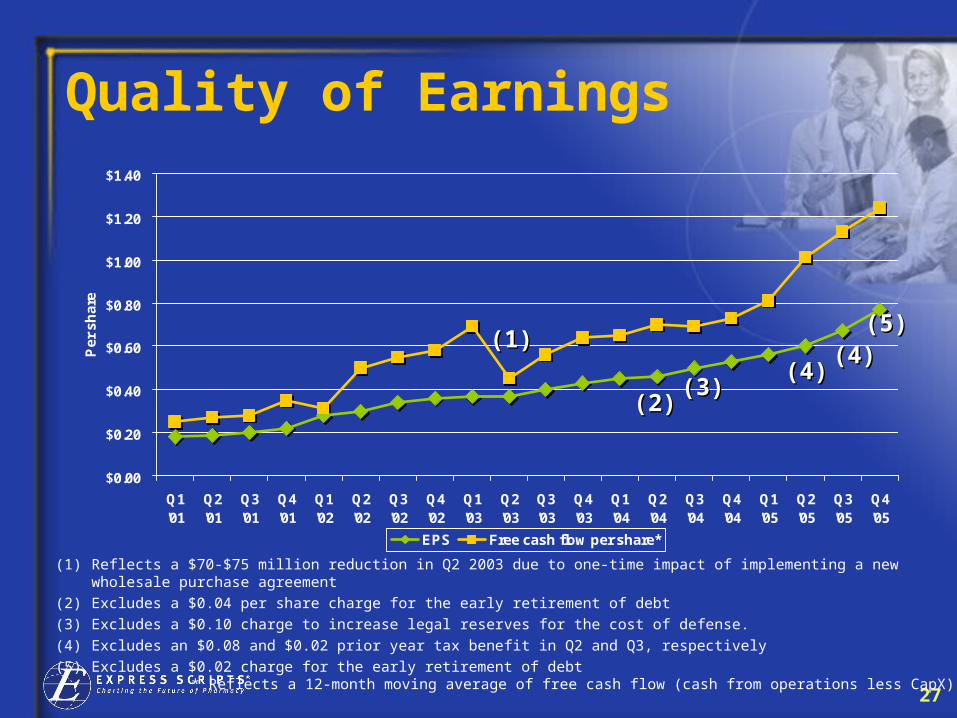
Quality of Earnings
$0.00
$0.20
$0.40
$0.60
$0.80
$1.00
$1.20
$1.40
Q1'01
Q2'01
Q3'01
Q4'01
Q1'02
Q2'02
Q3'02
Q4'02
Q1'03
Q2'03
Q3'03
Q4'03
Q1'04
Q2'04
Q3'04
Q4'04
Q1'05
Q2'05
Q3'05
Q4'05
Pe
r s
ha
re
EPS Free cash flow per share*
(1) Reflects a $70-$75 million reduction in Q2 2003 due to one-time impact of implementing a new wholesale purchase agreement
(2) Excludes a $0.04 per share charge for the early retirement of debt(3) Excludes a $0.10 charge to increase legal reserves for the cost of defense.(4) Excludes an $0.08 and $0.02 prior year tax benefit in Q2 and Q3, respectively(5) Excludes a $0.02 charge for the early retirement of debt
(1)(1)
(2)(2)
* Reflects a 12-month moving average of free cash flow (cash from operations less CapX)
(3)(3)(4)(4)
(4)(4)(5)(5)

28
Components Of EPS Growth
9% 10%5%
7%
15%
38%
5%
9%
2%
0%
5%
10%
15%
20%
25%
30%
35%
40%
45%
50%
2004 2005 4Q 2005
Rx Growth EBITDA/ Rx Growth Cap Structure/ Other

29
-10%
-5%
0%
5%
10%
15%
20%
1999 2000 2001 2002 2003 2004 2005
Adju
sted C
laim
s G
row
th
ESI Medco Caremark
Major PBM Prescription Growth
Note: Rx growth for Medco, Caremark reflect as configured today

30
Claims Volume Vs. EPS Growth
0%
5%
10%
15%
20%
25%
30%
35%
40%
45%
Q3 '04 Q4 '04 Q1 '05 Q2 '05 Q3 '05 Q4 '05
EPS growth Adj. claim growth
(1) Excludes a $0.10 charge to increase legal reserves (4) Reflects the June 1st anniversary of the DoD retail contract
(2) Excludes an $0.08 prior year tax benefit (5) Excludes a $0.02 charge for early retirement of debt(3) Excludes a $0.02 prior year tax benefit
(2)(2)(3)(3)
(1)(1)
Expanding Margins Supports Strong EPS Growth on More Modest Claims Growth
(4)(4)
(5)(5)

31
Profits Per Claim Growth
$1.32
$1.53
$1.13 $1.12
$1.05$1.03
$0.88$0.81
$1.19
$0.60
$0.80
$1.00
$1.20
$1.40
$1.60
2000 2001 2002 2003 2004** Q1 '05 Q2 '05 Q3 '05 Q4 '05
EBITDA* per adjusted claim
* A reconciliation of EBITDA to net income and to net cash provided by operating activities can be found in the Investor Relations
section of Express Scripts’ Web site, www.express-scripts.com under Presentations.
** Excluding $25 million charge to increase legal reserves for the cost of defense and $5.5 million termination payment received.
*** Based on 2005 average EBITDA per adjusted Rx of $1.29
Pricing can be lowered as clients tighten formulary compliance, increase home delivery, utilize generics and restrict retail networks. These changes result in lower prices to our clients and greater profits to Express Scripts.
10% CAGR***

32
Gross Profit* / SG&A* / EBITDA per Adj. Rx
Future EBITDA per Adj. Rx Must Come From Gross Profit per Adj. Rx
* Before depreciation and amortization** Excluding $25 million charge to increase legal reserves for the cost of defense and $5.5 million termination payment received. Source: Express Scripts Analysis.
$1.32$1.53
$2.20
$2.61
$0.78 $0.83 $0.90$0.80 $0.74 $0.82 $0.83 $0.88
$1.08
$1.13 $1.12$1.05$1.03
$0.88$0.81
$1.19
$1.59$1.71
$1.93 $1.85$1.87 $1.94
$2.02
$0.50$0.70$0.90$1.10$1.30$1.50$1.70$1.90$2.10$2.30$2.50$2.70
2000 2001 2002 2003 2004** Q1 2005 Q2 2005 Q3 2005 Q4 2005
EBITDA per Adj Rx Gross profit per Adj. Rx SGA per Adj Rx
``

33
Focus on Return on Invested Capital (ROIC)
Express Scripts ROIC*
0%2%
4%6%
8%10%
12%14%
16%18%
20%20
00
2001
2002
2003
2004
**
2005
ROIC is our Preferred Performance Metric
* Reflects operating income less tax divided by average invested capital, which consists of stockholder’s equity, plus interest
bearing liabilities plus long-term deferred income taxes, net. ** Excludes $25 million charge to increase legal reserves for the cost of defense and 5.5 million termination payment received

34
Peer Group Total Return - 2005
ESI’s 119% Return Was More than 3.5 Times Our Peer Group
41.2% 38.8%
3.0%
51.2%
15.9%
31.4%
17.9%
37.1% 34.1%
119.3%
0%
20%
40%
60%
80%
100%
120%
Peer group avg.
32.4%

35
S&P Total Return – 2005
41
142
179
84
35
114 4
0
25
50
75
100
125
150
175
200
Total Return
# of
Com
pani
es
Only 2 Companies in the S&P 500 Exceeded ESI’s
Total Return to Stockholders of 119% in 2005
Note: Returns reflect stock price increase plus dividend yield

36
Our Value Proposition Will Continue to Drive Growth
• Making the use of drugs safer and more affordable is more important than ever
• Plan sponsors will increasingly deploy our tools
• Express Scripts is well-positioned for sustainable growth
• Strong market fundamentals/new business opportunities • Increased use of home delivery and generic drugs• Growth in management of specialty pharmacy• Productivity and capital structure improvements
• We have taken a different approach• Alignment -- we make money by saving our clients money
• Strategic acquisitions have enhanced our value proposition
