len thomas, armando jaramillo-legorreta, gustavo …jasa).pdf · last call: passive acoustic...
TRANSCRIPT

Last call: Passive acoustic monitoring shows continued rapid decline of criticallyendangered vaquitaLen Thomas, Armando Jaramillo-Legorreta, Gustavo Cardenas-Hinojosa, Edwyna Nieto-Garcia, Lorenzo Rojas-Bracho, Jay M. Ver Hoef, Jeffrey Moore, Barbara Taylor, Jay Barlow, and Nicholas Tregenza
Citation: The Journal of the Acoustical Society of America 142, EL512 (2017);View online: https://doi.org/10.1121/1.5011673View Table of Contents: http://asa.scitation.org/toc/jas/142/5Published by the Acoustical Society of America
Articles you may be interested in Categorizing click trains to increase taxonomic precision in echolocation click loggersThe Journal of the Acoustical Society of America 142, 863 (2017); 10.1121/1.4996000
Broadband ship noise and its potential impacts on Indo-Pacific humpback dolphins: Implications forconservation and managementThe Journal of the Acoustical Society of America 142, 2766 (2017); 10.1121/1.5009444
Stochastic sediment property inversion in Shallow Water 06The Journal of the Acoustical Society of America 142, EL495 (2017); 10.1121/1.5009898
Cochlear implant simulator with independent representation of the full spiral ganglionThe Journal of the Acoustical Society of America 142, EL484 (2017); 10.1121/1.5009602
Extracting the time domain Green's function from ocean ambient noise using acoustic vector sensorsThe Journal of the Acoustical Society of America 142, EL507 (2017); 10.1121/1.5011377
Ambient noise forecasting with a large acoustic array in a complex shallow water environmentThe Journal of the Acoustical Society of America 142, EL473 (2017); 10.1121/1.5010764

Last call: Passive acoustic monitoring showscontinued rapid decline of critically endangered
vaquitaLen Thomasa)
Centre for Research into Ecological and Environmental Modelling, University of StAndrews, The Observatory, Buchanan Gardens, St Andrews, Fife, KY16 9LZ,
United [email protected]
Armando Jaramillo-Legorreta, Gustavo Cardenas-Hinojosa,b)
Edwyna Nieto-Garcia, and Lorenzo Rojas-BrachoInstituto Nacional de Ecologia y Cambio Climatico/SEMARNAT, Coordinacion de
Investigacion y Conservacion de Mamiferos Marinos, CICESE Camper 10, CarreteraEnsenada-Tijuana 3918, Zona Playitas, Ensenada, Baja California 22860, Mexico
[email protected], [email protected], [email protected],[email protected]
Jay M. Ver HoefAlaska Fisheries Science Center, NOAA Fisheries, Marine Mammal Laboratory, Seattle,
Washington 98115, [email protected]
Jeffrey Moore, Barbara Taylor, and Jay BarlowNOAA Southwest Fisheries Science Center, Marine Mammal and Turtle Division, 8901 La
Jolla Shores Drive, La Jolla, California 92037, [email protected], [email protected], [email protected]
Nicholas TregenzaChelonia Limited, The Barkhouse, Mousehole, TR196PH, United Kingdom
Abstract: The vaquita is a critically endangered species of porpoise. Itproduces echolocation clicks, making it a good candidate for passiveacoustic monitoring. A systematic grid of sensors has been deployed for3 months annually since 2011; results from 2016 are reported here.Statistical models (to compensate for non-uniform data loss) show anoverall decline in the acoustic detection rate between 2015 and 2016 of49% (95% credible interval 82% decline to 8% increase), and totaldecline between 2011 and 2016 of over 90%. Assuming the acousticdetection rate is proportional to population size, approximately 30vaquita (95% credible interval 8–96) remained in November 2016.
[WJL]Date Received: June 18, 2017 Date Accepted: October 29, 2017
1. Introduction
The vaquita (Phocoena sinus) is a critically endangered species of porpoise endemic tothe northern Gulf of California, Mexico. Vaquitas have been subject to a long historyof unsustainable bycatch in gillnets set by small-boat fishers targeting shrimp and fin-fish (Rojas-Bracho and Reeves, 2013). Recently, there has been a resurgence of an ille-gal gillnet fishery for an endangered fish, the totoaba (Totoaba macdonaldi), fueled bya lucrative illegal trade with China for totoaba swim bladders. This has raised concernsabout increased levels of vaquita bycatch. Vaquita are difficult to monitor using stan-dard visual survey methods (line transects or mark-recapture based on photo-identifica-tion) because they are small and visually cryptic, and now are very rare. However,they produce echolocation clicks almost continually, making passive acoustic monitor-ing of population trends possible. An acoustic monitoring program at a grid of
a)Author to whom correspondence should be addressed.b)Also at: Departamento de Biolog�ıa de la Conservaci�on, Centro de Investigaci�on Cient�ıfica y Educaci�on
Superior de Ensenada, Carretera Ensenada-Tijuana 3918, Zona Playitas, Ensenada, Baja California, CP22860, Mexico.
EL512 J. Acoust. Soc. Am. 142 (5), November 2017
Thomas et al.: JASA Express Letters https://doi.org/10.1121/1.5011673 Published Online 28 November 2017

locations throughout the core range of the vaquita was started in 2011; analysis ofdata to 2015 showed an estimated annual decline of 34% [95% credible interval (CRI)21%–48%] (Jaramillo-Legorreta et al., 2017). Based on preliminary results through2014, the government of Mexico enacted an emergency ban on gillnets, which began in2015. However, despite extensive enforcement efforts, there is evidence that illegal fish-ing and bycatch continue (CIRVA, 2017). Here we report results from the 2016 acous-tic monitoring.
2. Methods
Hardware deployment, acoustic processing, and trend analysis methods followed thosedescribed in detail by Jaramillo-Legorreta et al. (2017), and are outlined below.
2.1 Acoustic data collection and processing
Forty-six autonomous acoustic loggers were deployed between June and August eachyear from 2011 to 2016 in a systematic grid within the vaquita refuge, an area of corehabitat designated in 2005 [Fig. 1(A)]. Because vaquita now number far fewer thanwhen acoustic monitoring began, 47 additional loggers were added mid July 2016within the same area to improve precision in future trend monitoring [Fig. 1(B)]. Theloggers were C-PODs (Tregenza et al., 2016): autonomous passive acoustic monitoringinstruments designed to detect echo-location clicks of toothed whales and store salientfeatures for offline classification. Upon retrieval, proprietary software (C-POD soft-ware version 2.044 with KERNO algorithm) was used to detect coherent sequences(“trains”) of approximately regularly spaced clicks and classify them as possiblevaquita click trains; all possible vaquita click trains were then manually validated.Data were summarized as the number of vaquita clicks detected per sampling locationper day—the “click rate.”
2.2 Trend analysis
Only data from the original 46 sampling locations were used for trend analysis.Although this grid of locations was designed to give equal coverage in space and time,in practice sampling was uneven due to shifts in annual deployment dates, equipmentfailure, and loss. The data set was further truncated to a core sampling period duringwhich at least 50% of the detectors were operating across all 6 years: June 19 toAugust 19, inclusive (62 days). Nevertheless, the sampling effort was still somewhatuneven, and so trend analysis was based on two Bayesian statistical models developedby Jaramillo-Legorreta et al. (2017): a geostatistical model and a non-spatial mixturemodel. They are described briefly here; full details are given in Jaramillo-Legorretaet al. (2017). Both models estimate average click rate per sampling location and year;the mean of these over locations is the average annual click rate. Between-year changein acoustic activity, denoted k, is estimated as the ratio of the average annual clickrates in successive pairs of years.
Fig. 1. (Color online) Summary of raw data for 2016. Mean click rate (clicks/day), indicated by shading (notelog scale), and days of sampling, indicated by circle size, for (A) the 46 sampling sites grid during the core sam-pling period (June 19 to August 19), and (B) the augmented 93 sampling sites grid during the part of the coresampling period when additional sensors were deployed (July 11 to August 19).
Thomas et al.: JASA Express Letters https://doi.org/10.1121/1.5011673 Published Online 28 November 2017
J. Acoust. Soc. Am. 142 (5), November 2017 Thomas et al. EL513

The geostatistical model compensates for locations with missing data by“borrowing strength” from those around it: the model assumes the average click ratevaries smoothly over space, with a separate smooth surface fit to each year of data butwith the amount of smoothness (the spatial autocorrelation) the same across years (i.e.,autocorrelation parameters estimated from all years’ data). It further accounts for vari-ation in sampling by assuming locations with more sampling days give more preciseestimates of the average click rate than those with fewer days.
The post-stratification mixture model probabilistically assigns individual sam-pling locations to one of three strata. A sampling location is permanently assigned tothe same stratum for all years (which is justified based on spatial stability of the data),but each stratum mean click rate is estimated independently for each year. The pur-pose of stratification is to statistically account for much of the inter-site variance in thenumber of clicks recorded; the number of strata was chosen subjectively, after explor-atory data analysis.
Uninformative prior distributions were used for all model parameters. Foreach model, inference was performed using Markov chain Monte Carlo methods: asingle chain was run for 1 010 000 iterations using the WinBUGS (geostatistical model)and OpenBUGS (mixture model) software packages (Lunn et al., 2012), the first10 000 samples were discarded and thereafter every 100th sample was retained for pos-terior distribution summaries, yielding 10 000 samples for each model. Results arereported separately for each model, but also combining samples from both to form amodel-averaged estimate. Each model has equal weight in the model averaging.
2.3 Checking acoustic metric
For annual change in acoustic activity to represent change in abundance, there mustbe no systematic change in animal vocal behavior or range-specific click detection.Data were not available to measure these directly (e.g., through animal-borne record-ing tags); however, we searched for changes in the number of detected vaquita clicks inminutes when animals were known to be present (a measure of acoustic behavior), fortrends in temperature (known to affect propagation) and a proxy for backgroundnoise. Details are given in the supplementary material.1
2.4 Abundance estimate for 2016
Vaquita population abundance was estimated from Bayesian analysis of a combinedvisual and acoustic survey, conducted in the fall of 2015, by Taylor et al. (2016). Theposterior distribution for population size was well approximated by a lognormal distri-bution with mean 66 and standard deviation 33. To project the population forwardfrom 2015 to 2016, 20 000 random samples were drawn from this lognormal distribu-tion, and each sample was multiplied by a sample from the distribution of annualchange in acoustic activity, k2015�2016 from the trend models. Using November 2, 2015(the midpoint of the visual survey) as the survey abundance date, the projected esti-mate represents population size on November 2, 2016.
3. Results
The sampling effort in 2016 was high for the 46 original sampling locations, with mostC-PODs being operational for the entire core period [Fig. 1(A)]. As in earlier years,vaquita detections were restricted to only some portion of the refuge, with the highestclick rates close to the southwest boundary; the additional 47 locations monitored forthe first time in 2016 [Fig. 1(B)] make it clear that detections decline to almost zero onthis boundary (and most other boundaries).
The recorded number of vaquita clicks per day in the 46 original locationsdecreased by 44% from 2015 to 2016 (k2015�2016 ¼ 0:56). However, this statistic doesnot account for unequal sampling effort across sites. Results from the statistical mod-els, which do account for an unequal effort, and give estimates of statistical uncer-tainty, are summarized in Fig. 2 (see also the supplementary material1). The values for2011–2015 are very similar to those reported by Jaramillo-Legorreta et al. (2017), aswould be expected since the addition of a sixth year of data should not change sub-stantially results from the previous five. The estimated change in acoustic activitybetween 2015 and 2016 differs somewhat between the two models and has wide poste-rior CRIs; combining results from the two produces a model averaged posterior meanestimate of k2015�2016 ¼ 0:51 with 95% posterior CRI 0.18 to 1.08. Although this inter-val includes the “no change” value of 1.0, the posterior probability that acoustic activ-ity decreased between 2015 and 2016 [i.e., pðk2015�2016Þ < 1:0] is 0.96 (Fig. 3).
Another way to express the estimated change in acoustic activity is as a per-centage rate of decline or increase ðk� 1Þ � 100 (Fig. 2). The estimated model averaged
Thomas et al.: JASA Express Letters https://doi.org/10.1121/1.5011673 Published Online 28 November 2017
EL514 J. Acoust. Soc. Am. 142 (5), November 2017 Thomas et al.
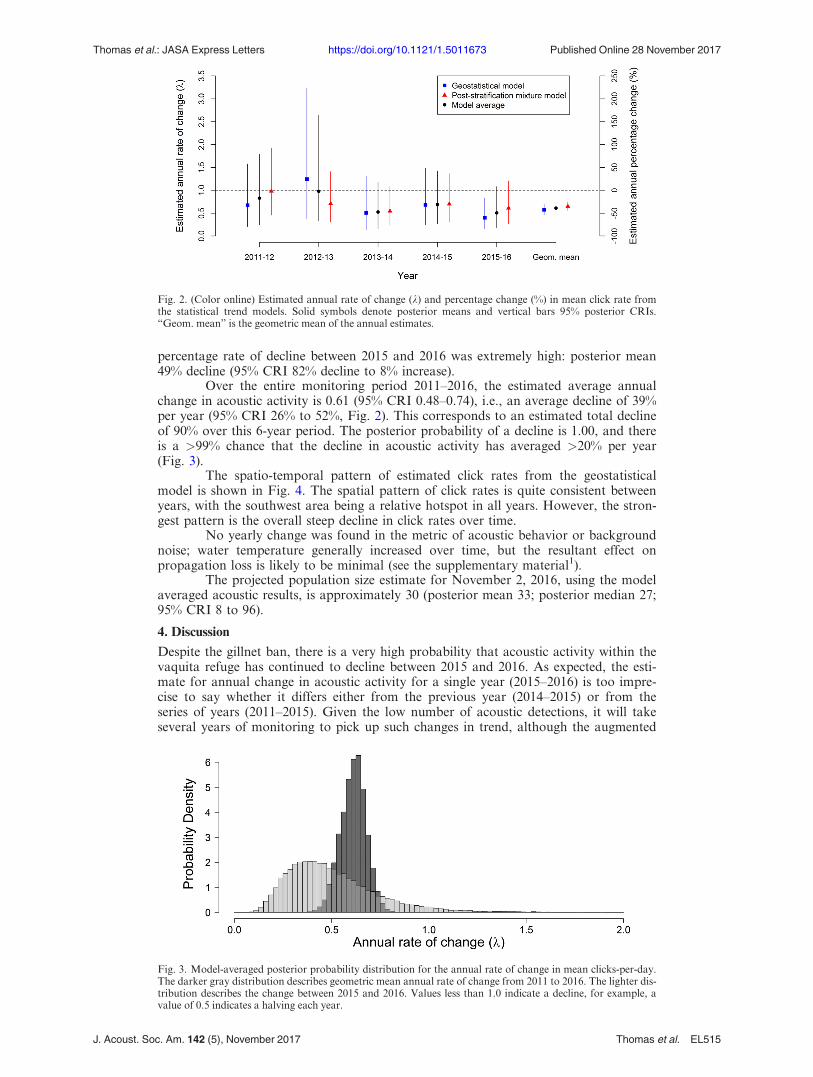
percentage rate of decline between 2015 and 2016 was extremely high: posterior mean49% decline (95% CRI 82% decline to 8% increase).
Over the entire monitoring period 2011–2016, the estimated average annualchange in acoustic activity is 0.61 (95% CRI 0.48–0.74), i.e., an average decline of 39%per year (95% CRI 26% to 52%, Fig. 2). This corresponds to an estimated total declineof 90% over this 6-year period. The posterior probability of a decline is 1.00, and thereis a >99% chance that the decline in acoustic activity has averaged >20% per year(Fig. 3).
The spatio-temporal pattern of estimated click rates from the geostatisticalmodel is shown in Fig. 4. The spatial pattern of click rates is quite consistent betweenyears, with the southwest area being a relative hotspot in all years. However, the stron-gest pattern is the overall steep decline in click rates over time.
No yearly change was found in the metric of acoustic behavior or backgroundnoise; water temperature generally increased over time, but the resultant effect onpropagation loss is likely to be minimal (see the supplementary material1).
The projected population size estimate for November 2, 2016, using the modelaveraged acoustic results, is approximately 30 (posterior mean 33; posterior median 27;95% CRI 8 to 96).
4. Discussion
Despite the gillnet ban, there is a very high probability that acoustic activity within thevaquita refuge has continued to decline between 2015 and 2016. As expected, the esti-mate for annual change in acoustic activity for a single year (2015–2016) is too impre-cise to say whether it differs either from the previous year (2014–2015) or from theseries of years (2011–2015). Given the low number of acoustic detections, it will takeseveral years of monitoring to pick up such changes in trend, although the augmented
Fig. 2. (Color online) Estimated annual rate of change (k) and percentage change (%) in mean click rate fromthe statistical trend models. Solid symbols denote posterior means and vertical bars 95% posterior CRIs.“Geom. mean” is the geometric mean of the annual estimates.
Fig. 3. Model-averaged posterior probability distribution for the annual rate of change in mean clicks-per-day.The darker gray distribution describes geometric mean annual rate of change from 2011 to 2016. The lighter dis-tribution describes the change between 2015 and 2016. Values less than 1.0 indicate a decline, for example, avalue of 0.5 indicates a halving each year.
Thomas et al.: JASA Express Letters https://doi.org/10.1121/1.5011673 Published Online 28 November 2017
J. Acoust. Soc. Am. 142 (5), November 2017 Thomas et al. EL515

monitoring design will help improve precision. There is little doubt, however, that thedecline continues and is rapid.
Relating this decline in acoustic activity to a decline in population size requiresthe assumption that the acoustic behavior of vaquita and detection performance hasnot changed; our investigations (see the supplementary material1) provide partial vali-dation of this. Another important assumption in extrapolating the trend observed inthe vaquita refuge from acoustic data to total population trend is that population trendoutside the refuge is the same as that inside. The combined visual-acoustic survey ofTaylor et al. (2016) estimated that, in 2015, approximately 20% (12 of the estimated59) of the vaquita population were outside the refuge. Hence, if the population changeoutside the refuge is different from that inside, it will have only a small effect on theoverall trend, because it is only a small proportion of the total population. It is possi-ble that animal distribution has changed radically between 2015 and 2016, with ani-mals moving out of the refuge causing the observed decline. However, this seems veryunlikely given low detections on the periphery of the range from the augmented grid[Fig. 1(B)] and the relative paucity of detections outside the refuge on previous synop-tic surveys (e.g., Fig. 1 of Rojas-Bracho and Reeves, 2013).
If the acoustic change between 2015 and 2016 represents a population change,then we estimate that approximately 30 vaquita remained as of November 2, 2016.Only a fraction of these will be reproductive-age females. Given this estimate, and theongoing negative population trend, it seems clear that we are facing the imminentextinction of this species unless radical and effective conservation measures are imme-diately implemented.
Acknowledgments
We thank the following bodies for support and funding: the Mexican Government(through the Mexican Secretar�ıa de Medio Ambiente y Recursos Naturales), especiallyMinister R. Pacchiano and A. Michel; U.S. Marine Mammal Commission, in particularT. Ragen, R. Lent, and P. Thomas; the World Wildlife Fund (WWF) Mexico, inparticular O. Vidal and E. Sanjurjo; Le Equipe Cousteau; The Ocean Foundation; Fondsde Dotation pour la Biodiversit�e; MAAF Assurances (Save Your Logo); WWF-US; OpelProject Earth; Fideicomiso Fondo para la Biodiversidad; Instituto Nacional de Ecolog�ıa yCambio Clim�atico; Comisi�on Nacional de �Areas Naturales Protegidas; and Directorate of
Fig. 4. (Color online) Estimated mean number of clicks per day predicted by the geostatistical model for the 46numbered sampling sites with data for at least 1 year. Values in the legend are posterior medians (note logscale). Some sites, �, were missing in the indicated year. The size of the circles indicate the number of samplingdays on each year (see the legend).
Thomas et al.: JASA Express Letters https://doi.org/10.1121/1.5011673 Published Online 28 November 2017
EL516 J. Acoust. Soc. Am. 142 (5), November 2017 Thomas et al.

the Reserva de la Bi�osfera Alto Golfo de California y Delta del R�ıo Colorado. Manythanks to our field staff J. XXIII Osuna, P. Valverde, and R. Arozamena, all the fisherswho deployed and recovered the equipment, and to two anonymous reviewers.
References and links1See supplementary material at https://doi.org/10.1121/1.5011673 for an investigation of the acoustic metricused and results summary table.
CIRVA. (2017). Ninth Meeting of the Comit�e Internacional para la Recuperaci�on de la Vaquita (April25–26), (CIRVA-9). Report available at http://www.iucn-csg.org/wp-content/uploads/2010/03/CIRVA-9-FINAL-MAY-2017.pdf (Last viewed November 10, 2017).
Jaramillo-Legorreta, A., Cardenas-Hinojosa, G., Nieto-Garcia, E., Rojas-Bracho, L., Ver Hoef, J.,Moore, J., Tregenza, N., Barlow, J., Thomas, L., and Taylor, B. (2017). “Passive acoustic monitoring ofthe decline of Mexico’s critically endangered vaquita,” Conservation Biol. 31, 183–191.
Lunn, D., Jackson, C., Best, N., Thomas, A., and Spiegelhalter, D. (2012). The BUGS Book: A PracticalIntroduction to Bayesian Analysis (Chapman and Hall/CRC, London).
Rojas-Bracho, L., and Reeves, R. R. (2013). “Vaquitas and gillnets: Mexico’s ultimate cetacean conserva-tion challenge,” Endang. Spec. Res. 21, 77–87.
Taylor, B. L., Rojas-Bracho, L., Moore, J., Jaramillo-Legorreta, A., Ver Hoef, J., Cardenas-Hinojosa, G.,Nieto-Garcia, E., Barlow, J., Gerrodette, T., Tregenza, N., Thomas, L., and Hammond, P. S. (2016).“Extinction is imminent for Mexico’s endemic porpoise unless fishery bycatch is eliminated,” Conser.Lett. 10(5), 588–595.
Tregenza, N., Dawson, S., Rayment, W., and Verfuss, U. (2016). “Listening to echolocation clicks withPODs,” in Listening in the Ocean, edited by W. W. L. Au and M. O. Lammers (Springer, New York),pp. 163–206.
Thomas et al.: JASA Express Letters https://doi.org/10.1121/1.5011673 Published Online 28 November 2017
J. Acoust. Soc. Am. 142 (5), November 2017 Thomas et al. EL517