lender effects on gains from mergers and acquisitions
TRANSCRIPT

Lender Effects on Gains from Mergers and Acquisitions
Abstract
This paper employs a new approach to identify merger and acquisition (M&A) transactions
financed by syndicated loans and provides evidence that acquirer announcement returns are higher
in loan-financed M&A deals than in other deals. Utilizing an instrumental variable approach and
a quasi-natural experiment, we provide evidence that lenders contribute to the higher acquirer
announcement returns in loan-financed M&A deals. Lenders’ performance in M&A financing is
persistent over time. Lenders’ participation in the M&A market can resolve uncertainty about
M&A deal quality, improve corporate governance by preventing value-destroying M&A
transactions, and provide long-term monitoring benefits to acquirer shareholders.
Keywords: M&As, syndicated loan, corporate governance, lending relationship, uncertainty
resolution, lender ability, FAS 166/167
JEL Classifications: G14, G34, G21, D82

1
1. INTRODUCTION
When companies undertake mergers and acquisitions (M&As), the impact of the payment
method on acquiring shareholders’ gains is a key consideration and has been investigated
extensively in the M&A literature. However, prior research has primarily focused on differences
between stock and cash payments without differentiating sources of cash.1 A few studies have
examined the relationships between debt financing and M&A outcomes and found mixed results
(Bharadwaj and Shivadasani, 2003; Schlingemann, 2004; Martynova and Renneboog, 2009;
Vladimirov, 2015).2
Two empirical challenges impede complete understanding of the relationship between debt
financing and acquirer gains. First, the difficulty in accurately identifying the sources of cash used
to finance M&A transactions has hindered research on this important topic. Schlingemann (2004),
for example, relies on acquirers’ available financing sources (excess cash, new equity and debt
issuances) before an M&A to infer the source of financing used for the deal.3 Second, any effect
of debt financing on acquirer gains from M&A investments could be attributed to either borrower-
side or lender-side factors. On the borrower side, finance theories suggest that firms might choose
debt financing when managers have favorable private information (Myers and Majluf, 1984) or to
commit themselves to making more efficient investments (Stulz, 1990; Barclay, Smith, and Watts,
1997), which can cause a positive relation between debt financing and acquirer gains. On the lender
1 See Travlos (1987); Franks, Harris and Mayer (1988); Loughran and Vijh (1997); Chang (1998); Shleifer and Vishny
(2003); Bradley and Sundaram (2006); Betton, Eckbo, and Thorburn (2008); and Officer, Poulsen, and Stegemoller
(2009). 2 Bharadwaj and Shivadasani (2003), examine a sample of 115 tender offers and find the announcement return is
higher for deals financed by bank loans. Schlingemann (2004) and Martynova and Renneboog (2009) examine broader
samples of M&As and find an insignificant relation between debt financing and acquirers’ announcement returns.
Vladimirov (2015), on the other hand, finds that deals not financed with debts generate lower acquirers’ announcement
returns than deals financed at least partially with debts. 3 Schlingemann (2004, p. 684) acknowledges a potential issue with this approach: “[u]nfortunately, there is no way to
establish a precise correspondence between a dollar raised in time t and a dollar spent on a takeover in time t+.”

2
side, private lenders can play an important role in monitoring and generating proprietary
information about borrowing firms (Diamond, 1984, 1991; Fama, 1985; Boyd and Prescott, 1986),
which can also result in higher acquirer gains in M&A deals financed with debts. Thus, delineating
the roles of lender- and borrow-side factors is important for a complete understanding of the effects
of debt financing on acquirer gains from M&As.
The extant empirical M&A literature generally treats debt financing as a choice made by
acquirers and focuses on acquirer-side factors. The impacts of lenders on M&A deal outcomes are
largely ignored. We argue that M&As are among the largest and most complex investments for
firms, potential losses caused by value-destroying M&As can be substantial (Loughran & Vijh,
1997; Moeller et al., 2004, 2005). Therefore, the outcome of an M&A often has a significant, long-
term impact on the acquirer’s financial performance and solvency.4 This, in turn, can have a
substantial impact on the lender that provides financing for the deal.5 Accordingly, lenders should
have strong incentives to assess the M&A deal quality before deciding whether to provide
financing and, conditional on providing loans, to monitor the acquirer’s financial condition over
the loan term. The extant literature, however, lacks empirical evidence on (1) whether and (2) the
channels through which lenders impact acquirer gains. This study aims to provide empirical
evidence on these two important open questions.
We primarily focus on the impact of syndicated loan financing on acquirer gains, because
this type of debt is the most significant source of corporate funding. Moreover, the ownership of
private debts including syndicated loans is relatively more concentrated (Amihud, Garbade, and
Kahan, 1999), and private lenders – including banks – play a more important role in information
4 Our untabulated statistics shows that 28% of acquirers in our M&A sample experience a credit rating downgrade
within five years after the M&A deal completion (source: Capital IQ S&P Credit Ratings). 5 The average size of syndicated loans for M&A financing in our sample is $797 million, equivalent to 67% of the
M&A deal value.

3
generation and monitoring (Diamond, 1984, 1991; Fama, 1985; Boyd and Prescott, 1986) than
public bondholders. Therefore, lender effects, if any, are likely to be stronger in M&As financed
by syndicated loans than in M&As financed by public debts.
As discussed above, identifying sources of financing for M&A investments is difficult. This
study uses a new approach that allows us to accurately identify M&A deals that are financed with
syndicated loans. For an M&A sample from the SDC Platinum database, we first identify deals in
which the acquirer initiates syndicated loans with the purpose of financing an acquisition during
the period from 90 days before to 180 days after the M&A announcement or to the deal completion
date, whichever comes first. Then, we read the M&A announcements for those identified deals to
verify whether the acquirer explicitly states that the M&A deal is financed with syndicated
loan(s).6 As an example, on November 26, 2012, ConAgra Foods Inc. (listed on NASDAQ: CAG)
announced its acquisition of Ralcorp Holdings Inc. In the acquisition announcement, CAG stated
explicitly that $1.5 billion (30% of deal value) would be financed by a new senior unsecured term
loan from Bank of America and JPMorgan Chase Bank. This M&A deal is therefore recorded as
a loan-financed M&A in our sample.
Using this new approach, for the period from January 1990 to December 2015 for the US
takeover market, we identify 745 M&A deals that were financed by newly issued syndicated loans
out of 7,681 M&A deals paid for with cash or a mix of stock and cash. Our univariate tests show
that, on average, acquirers’ 3-day cumulative abnormal returns around M&A announcements
(acquirer CAR) is 1.1% higher for M&A deals financed with syndicated loans than for other M&A
deals in our sample, and this difference is both economically and statistically significant. This
6 We obtain M&A announcements using Factiva and SEC filings (form 8-K). We acknowledge that our approach
might still misclassify some loan-financed M&As as non-loan-financed M&As if the loans were initiated outside the
aforementioned [-90, +180] window.

4
result remains intact when we restrict the sample to cash-only M&A deals or a matched sample
formed using a propensity score matching method. To provide preliminary evidence of lender-side
effects on acquirers’ gains, we conduct multivariate regression tests that control for various
acquirer-side factors, M&A deal characteristics and target credit risk, and find similar results.
Next, we use three methods to provide direct evidence on lenders’ role in explaining
acquirer CAR. We first use an instrumental variable (IV) method. Since lenders’ activities tend to
concentrate in their local captive markets (Guiso, Sapienza, and Zingales, 2004; Degryse and
Ongena, 2005) and the degree of bank competition affects firms’ access to bank credit (Cetorelli
and Strahan, 2006), the likelihood that an acquirer receives loans to finance an M&A should
increase with the degree of competition among local banks. Thus, we use Bank Density, the number
of local banks scaled by the number of local public firms (excluding the acquirer), as the
instrument. We find that the relation between loan financing and acquirer CAR remains
statistically significant in the IV analysis.
Second, we use a change in accounting standards that affects banks’ lending behaviors as
a quasi-natural experiment and examine how this shock on the lender side influences the
relationship between loan financing and acquirer CAR. Specifically, the adoption of Financial
Accounting Standards (FAS) 166 and 167 in 2010 caused banks to recognize a large amount of
securitized assets on their balance sheets, which forced them to tighten lending standards and
reduce credit supply (Dou, Ryan, and Xie, 2018). We expect that the lender-side effect of loan
financing strengthens after FAS 166/167. Consistent with this expectation, we find that the positive
association between loan financing and acquirer CAR becomes stronger after this regulatory
shock.

5
The third piece of evidence on lenders’ role in explaining acquirer CAR is the persistence
in lead lender’s performance in M&A lending. Private lenders differ in their ability or skills in
screening and monitoring borrowing firms (Fama, 1985; Chemmanur and Fulghieri, 1994). If
lenders’ skills contribute to the higher acquirer CAR in loan-financed M&As, we should observe
that lender performance in M&A lending is persistent over time. We measure a lead lender’s past
(future) performance as the average acquirer CAR of M&A deals financed by the same lead lender
over one, two and three years in the past (future). We find that lead lenders with high M&A lending
performance in the past tend to also have high M&A lending performance in the future.
The results from our previous tests suggest that lenders contribute to higher acquirer CAR
in loan-financed M&As. Our subsequent tests explore possible channels through which lenders
affect M&A announcement returns and create value for acquirer shareholders. First, a private
lender’s decision to finance an M&A could be viewed by investors as a positive signal of the
acquirer’s stand-alone value (Barraclough et al., 2013; Wang, 2016), thus leading to a higher
acquirer CAR (the acquirer revaluation effect). Our test results, however, suggest that the relation
between loan financing and acquirer CAR is not driven by the acquirer revaluation effect.
Specifically, we find that the association between loan financing and acquirer CAR is not stronger
when there is a higher degree of uncertainty about the acquirer’s stand-alone value (as proxied by
acquirer stock return volatility and the dispersion of financial analysts’ earnings forecasts), or
when the lead lender has a prior lending relationship with the acquirer. We also find no evidence
that association between loan financing and acquirer CAR is weaker when the acquirer has already
had outstanding loans at the time of M&A announcement, which diminishes the acquirer
revaluation effect of new loans.

6
Second, a private lender’s decision to finance an M&A deal might reduce the uncertainty
about the M&A deal quality faced by external investors, causing higher acquirer CAR (the deal
quality certification channel). The deal quality certification channel implies that the association
between loan financing and acquirer CAR should be stronger when uncertainty about the M&A
deal quality is higher and weaker when other signals about the M&A deal quality already exist.
M&A deal quality, from acquirer shareholders’ perspective, depends on both expected synergy
and target stand-alone value. We argue that both expected synergy and target stand-alone value
are more difficult to assess in deals with private targets than in deals with public targets since the
former tend to have lower financial reporting quality (Hope, Thomas, and Vyas, 2013).
Additionally, the presence of multiple bidders sends an alternative positive signal of the target’s
stand-alone value. Therefore, we expect the relationship between loan financing and acquirer CAR
to be weaker for deals with public targets and for deals with multiple bidders. On the other hand,
lead lenders that have a prior lending relationship with the M&A target likely have informational
advantages that allow more accurate assessment of the M&A deal quality. We therefore expect the
deal quality certification effect of loan financing to be stronger when the lead lender has a prior
lending relationship with the target. We find that the association between loan financing and
acquirer CAR is significantly weaker when there are multiple bidders, and significantly stronger
when the lead lender has a prior lending relationship with the target firm. Our results generally
support the deal quality certification channel.
Third, a lender’s decision not to finance a low-quality M&A deal might help prevent a
value-destroying M&A (the ex-ante monitoring channel). The ex-ante monitoring channel is
difficult to verify directly, because we do not observe declined loan applications by acquirers.
However, we find some indirect evidence of this channel by examining boundary conditions that

7
attenuate or strengthen lenders’ role in preventing value-destroying M&A deals. Specifically,
lenders’ ability to deter value-destroying acquisitions should be less important when the acquirer
already has strong corporate governance. We focus on two sources of corporate governance: the
market for corporate control (Masuli, Wang, and Xie, 2007) and dedicated institutional investors
(Chen, Harford, and Li, 2007). We find that the relationship between acquirer CAR and loan
financing is significantly stronger when the acquirer has weaker corporate governance (having
more anti-takeover provisions or lower dedicated institutional ownership).
Fourth, once a bank has financed an M&A, it will monitor the acquirer over the term of the
loan ex post. This can create a positive spillover to the acquirer’s shareholders (the ex-post
monitoring channel). We argue that the benefit of lenders’ ex-post monitoring should be larger if
lenders monitor the acquirer for a longer period. Indeed, we find that the relationship between loan
financing and acquirer CAR is most prominent when the loans used to finance the M&A have the
longest terms to maturity.7 Additionally, we find a positive and marginally statistically significant
relationship between loan financing and acquirer 3-year buy-and-hold abnormal returns.8 These
findings together provide some support for the ex-post monitoring channel.
This paper makes several contributions to the literature. First, we provide evidence on the
direct link between acquirer gains and syndicated loan financing in a general M&A setting.
Schlingemann (2004), Martynova and Renneboog (2009), and Vladimirov (2015) examine the role
of debt financing in general without differentiating types of debts. Bharadwaj and Shivadasani
(2003) examine the effects of bank financing for tender offers, which account for only a small
fraction of M&As.9 Our approach allows us to accurately identify loan-financed M&As and study
7We acknowledge that there are alternative explanations for this finding. For example, it is possible that lenders are
willing to accept a longer loan term when the perceived M&A deal quality is higher. 8 This finding can be interpreted as the market underreacting to the benefit of private lenders’ ex-post monitoring. 9 In our sample, for example, tender offers only account for 8% of all M&A deals.

8
the roles of lenders in determining acquirer gains in a more general M&A setting. More
importantly, prior studies either only consider acquirer-side factors (Schlingemann, 2004;
Martynova and Renneboog, 2009; Vladimirov 2015) or provide results that can be attributed to
either acquirer or lender-side factors (Bharadwaj and Shivadasani, 2003). In contrast, our study
provides direct evidence of lender-side effects on acquirer gains and the channels through which
lenders impact acquirer shareholders’ value.
Our findings also complement the literature on the impacts of stock versus cash payment
methods on acquirer gains (e.g. Travlos, 1987; Amihud, Lev, and Travlos, 1990; Martin, 1996;
Loughran and Vijh, 1997; Akbulut, 2013). This strand of literature generally finds that acquirer
gains are higher in cash deals and attributes this result to the signaling effect of payment methods
(i.e. acquirers use their overvalued stocks to pay target shareholders). Our study suggests that
lenders contribute to the higher acquirer gains in cash deals. Finally, to the best of our knowledge,
our study is the first that shows the interplay between lenders and other corporate governance
mechanisms in determining M&A gains.
The remainder of this paper proceeds as follows. In section 2, we describe the sample and
main variables. Section 3 presents our methodology and the baseline empirical results. Section 4
presents evidence of lender-side effects on acquirer gains. In section 5 we explore some channels
through which lenders can benefit acquirer shareholders. Section 6 concludes the paper.
2. DATA AND RESEARCH DESIGN
2.1. M&A sample construction
Our initial sample includes all M&A deals from the SDC Platinum Database over 1990–
2015 that satisfy the following criteria: (1) both the acquirer and the target are U.S. firms; (2) the
acquirer is a public firm; (3) the deal is classified as a merger, acquisition or acquisition of major

9
interest; (4) M&A deal value is non-missing; and (5) the acquirer owns less than 50% of the
target’s shares before the deal announcement and seeks to own 100% of the target’s shares after
the deal. We merge this initial sample with CRSP and Compustat to obtain stock returns and
financial data, respectively. To focus on economically meaningful transactions, we drop deals
smaller than 1% of the acquirer’s market value of equity measured at the end of the most recent
fiscal year before the acquisition announcement. Finally, we exclude pure stock-for-stock
acquisitions, since loan financing is not an option in those transactions.10 Our final sample includes
7,681 M&As. Panels A and B of Table 1 present our sample distribution over time and by Fama–
French’s 30 industry categories, respectively. Overall our sample is well represented across time
and industry.
<Insert Table 1 here>
2.2. Identification of M&A transactions financed with syndicated loans and bonds
We use a two-step process to identify M&A transactions that are financed with syndicated
loans. First, starting with the sample of M&As described earlier, we use information from the
DealScan syndicated loan database to identify acquirers that initiate loans with “Takeover” or
“Acquisition Line” being the primary or secondary purpose during the period from 90 days before
to 180 days after the M&A announcement (or to the M&A completion date if it comes first).11 We
only consider term loans and revolving facilities. In our sample, there are 985 M&A deals in which
the acquirer initiates syndicated loan(s) for M&A purposes during the aforementioned window.
Second, for these 985 potentially loan-financed M&A deals identified in the first step, we search
for M&A announcements using Factiva and SEC filings (form 8-K) and read the announcements
10 The main results of this study remain intact if we also include pure stock-for-stock acquisitions. 11 We merge our SDC/CRSP/Compustat sample with DealScan using the Compustat/Dealscan link table provided by
Chava and Roberts (2008).

10
to verify sources of financing. An M&A deal is categorized as being financed with syndicated
loans only if the acquirer explicitly states so in the M&A announcement. Our two-step approach
identifies 745 loan-financed M&A deals out of 7,681 deals in our sample. We construct a dummy
variable (Loan Finance) equal to one for the 745 syndicated-loan-financed M&A deals and zero
otherwise, and a continuous variable (Loan Finance Ratio) equal to the amount of loan(s)
borrowed to finance the M&A scaled by the M&A deal value. These are two key independent
variables in our analyses.
We identify M&A transactions financed with bond issuances using a similar approach. First,
we use the Mergent FISD bond issuance database to identify acquirers that issue bonds during the
period from 90 days before to 180 days after the M&A announcement (or to the M&A competition
date if it comes first). For M&A deals identified as potential bond-financed deals in the first step,
we then read acquisition announcements, obtained from Factiva and SEC filings (form 8-K), to
verify if they are indeed financed with proceeds from new bond issuances. Table 2 presents
summary statistics for the variables used in this study. On average, 9.7% of the M&A transactions
in our sample are financed with newly borrowed syndicated loans, while 2% of the M&A
transactions are financed with newly issued bonds. Figure 1 plots the average ratio of loan amount
to M&A deal value by year.
<Insert Table 2 here>
<Insert Figure 1 here>
2.3. Measure of acquirer gains
Following previous studies (e.g., Moeller et al. 2005), we use acquirers’ CAR over a 3-day
window centered on the acquisition announcement date (Acquirer CAR) as the measure of gains
to acquirer shareholders. Abnormal stock returns are estimated using a Carhart’s 4-factor model

11
(Carhart, 1997).12 The model is estimated for individual firms over the period from the 273rd
trading day to the 21st trading day prior to the M&A announcement. Firms with fewer than 60
trading days available over the estimation window are excluded. As shown in Table 2, the mean
and median of Acquirer CAR are 1.2% and 0.4%, respectively.
2.4. Control variables
Myers and Majluf’s (1984) pecking order theory suggests that, in the presence of information
asymmetry, firms should rely on their cash on hand first and prefer debt to equity if external
financing is needed. Additionally, firms with inadequate financial slack and limited access to debt
financing might refuse to issue equity and forgo some investment opportunities. To control for
these borrower-side factors, we construct Acquirer Cash (acquirer’s cash scaled by total assets)
and Acquirer Leverage (acquirer’s total long-term and short-term debts scaled by total assets) as
proxies for acquirers’ financial slack, and Acquirer Tobin Q (the sum of market value of equity
and book value of liabilities scaled by total assets) as a proxy for acquirers’ growth opportunities.
We also construct other common control variables used in the M&A literature, including
acquirers’ market capitalization (Acquirer Size) and profitability (Acquirer ROA), M&A deal value
scaled by the acquirer’s market value of equity (Deal Size), whether the target is a private firm
(Private Target), whether the takeover is friendly (Friendly), whether the takeover is a tender offer
(Tender), whether there are multiple bidders involved (Multiple Bidder), whether the acquirer and
the target are in the same industry based on two-digit SIC codes (Same Industry), whether the
acquirer already owns some shares of the target before the deal announcement (Toehold), and
whether the deal payment is fully in cash (Cash Only). Additionally, Fu, Guay, and Zhang (2016)
show that bidders have incentives to construct M&A deals to maintain new equity issues at slightly
12 Our results remain robust if we use alternatives models including CAPM and Fama-French 3 factor model (Fama
and French, 1993) or a (-2, +2) event window using the 4-factor model

12
less than 20% to avoid triggering shareholder approval. We construct a dummy variable indicating
whether the deal value is at least 20% of the acquirer’s market value (Large Deal), since deal size
beyond this threshold might have an impact on bidders’ financing choice. All acquirer
characteristics are measured using data for the most recent fiscal year before the M&A
announcement. The complete definitions of all variables are in Appendix A.
3. LOAN FINANCING AND ACQUIRER CAR
3.1. Univariate analysis
Our main objective in this section is to compare the mean and median of the Acquirer CAR
for the treatment group (M&A deals financed with syndicated loans) and the control group (other
M&A deals). Since prior literature finds that acquirer announcement return tends to be higher for
cash deals than for stock and mixed deals (Travlos, 1987; Loughran and Vijh, 1997), we also
conduct univariate tests on a restricted sample that includes cash-only M&A deals. Additionally,
we use a propensity score matching approach to select, for each loan-financed M&A deal, a
matched M&A deal that has similar acquirer and M&A deal characteristics but is not financed
with loans. Propensity scores are estimated using a probit regression (the estimation result is
reported in Appendix B). We then test if there is a difference in Acquirer CAR between M&A
deals financed with loans and other deals within this matched sample.
The univariate test results for the full sample, cash-only sample and matched sample are
presented in Table 3. We find that the mean and median Acquirer CAR are significantly higher for
loan-financed M&A deals than for other deals. Specifically, for the full sample, the mean Acquirer
CAR for loan-financed M&A deals is 2.2%, while it is only 1.1% for other deals. The difference
in Acquirer CAR between the two groups is statistically significant at the 1% level and
economically significant (for comparison, the mean Acquirer CAR for our full sample is 1.2%).

13
The results are qualitatively similar for the of cash-only M&A sample and the propensity score
matched sample.
<Insert Table 3 here>
3.2. Multivariate analysis
To formally test the relationship between loan financing and acquirer gains, we estimate the
following baseline multivariate regression model:
𝐴𝑐𝑞𝑢𝑖𝑟𝑒𝑟 𝐶𝐴𝑅 = 𝛽0 + 𝛽1𝐿𝑜𝑎𝑛 𝐹𝑖𝑛𝑎𝑛𝑐𝑒 (𝐿𝑜𝑎𝑛 𝐹𝑖𝑛𝑎𝑛𝑐𝑒 𝑅𝑎𝑡𝑖𝑜) + 𝛽2𝐴𝑐𝑞𝑢𝑖𝑟𝑒𝑟 𝑆𝑖𝑧𝑒
+ 𝛽3𝐴𝑐𝑞𝑢𝑖𝑟𝑒𝑟 𝑅𝑂𝐴 + 𝛽4𝐴𝑐𝑞𝑢𝑖𝑟𝑒𝑟 𝐶𝑎𝑠ℎ + 𝛽5𝐴𝑐𝑞𝑢𝑖𝑟𝑒𝑟 𝐿𝑒𝑣𝑒𝑟𝑎𝑔𝑒
+ 𝛽6𝐴𝑐𝑞𝑢𝑖𝑟𝑒𝑟 𝑇𝑜𝑏𝑖𝑛′𝑠 𝑄 + 𝛽7𝐷𝑒𝑎𝑙 𝑆𝑖𝑧𝑒 + 𝛽8𝑃𝑟𝑖𝑣𝑎𝑡𝑒 𝑇𝑎𝑟𝑔𝑒𝑡 + 𝛽9𝐹𝑟𝑖𝑒𝑛𝑑𝑙𝑦
+ 𝛽10𝑇𝑒𝑛𝑑𝑒𝑟 + 𝛽11𝑀𝑢𝑙𝑡𝑖𝑝𝑙𝑒 𝐵𝑖𝑑𝑑𝑒𝑟 + 𝛽12𝑆𝑎𝑚𝑒 𝐼𝑛𝑑𝑢𝑠𝑡𝑟𝑦 + 𝛽13𝑇𝑜𝑒ℎ𝑜𝑙𝑑
+ 𝛽14𝐿𝑎𝑟𝑔𝑒 𝐷𝑒𝑎𝑙 + 𝛽15𝐶𝑎𝑠ℎ 𝑂𝑛𝑙𝑦 + 𝜀 (1)
The dependent variable is Acquirer CAR. The main explanatory variable of interest is alternatively
Loan Finance dummy and Loan Finance Ratio. The baseline regression model controls for
borrower-side factors, deal characteristics and industry and year fixed effects.13 Standard errors
are clustered by industry.
The results of our multivariate analyses are reported in Table 4. In Panel A our key
explanatory variable is the Loan Finance dummy. Column (1) presents the regression results for a
reduced form of the baseline regression that includes only Loan Finance and year and industry
dummies. Column (2) presents the results for the baseline regression estimated on the full sample.
Column (3) presents the baseline regression results estimated on cash-only M&A deals. Overall,
the coefficient on Loan Finance is positive and statistically significant at the 5% level or lower in
all regressions. The magnitude of the coefficient is economically significant. For example, in the
13 Industries are defined based on Fama–French’s 30 industry categories.

14
baseline regression for the full sample, the coefficient on Loan Finance is 0.013, suggesting that
Acquirer CAR is 1.3% higher for M&As financed with syndicated loans than for deals not financed
with syndicated loans. Moreover, given that the coefficient on Loan Finance remains statistically
significant even in the subsample of cash-only M&A deals, our results are unlikely to be driven
by the impact of payment method.
Table 4, Panel B presents regression results when the key explanatory variable is Loan
Finance Ratio.14 The coefficient on Loan Finance Ratio is positive and statistically significant at
the 5% level or lower. Overall, the estimation results in Panels A and B of Table 4 confirm that
acquirer CAR is significantly higher in M&A deals financed with syndicated loans than in M&A
deals not financed with syndicated loans.
<Insert Table 4 here>
3.3. Alternative explanations for the association between loan financing and acquirer CAR
In this section we conduct additional tests to rule out alternative explanations for a positive
relation between acquirer’s use of loan financing and announcement returns (other than lender
effects). First, the pecking order theory of Myers and Majluf (1984) suggests that debt financing
is viewed by external investors as a signal that managers have favorable private information about
the firm’s investments. If this explains the higher acquirer CAR in loan-financed M&A deals, we
would expect to observe similar result for M&A loans financed with public debts (bond issuances).
Lender-side factors, however, suggest that the same effect is unlikely to hold for public debt
financing. This is because private lenders generally play a more important role in monitoring and
information generation (Diamond, 1984, 1991; Fama, 1985; Boyd and Prescott, 1986) than public
debt holders. To examine whether the results also hold for M&A deals financed with public debts,
14 Loan Finance Ratio equals zero for deals that are not financed with loans.

15
we add to regression model (1) a dummy variable indicating whether the acquirer issues bonds to
finance the M&A deal (Bond Finance) and report the estimation results in column (1) of Table 5,
Panel A. The coefficient on Bond Finance is not statistically different from zero, whereas that on
Loan Finance remains statistically significant. This finding suggests that the higher Acquirer CAR
in loan-financed M&As is not driven by the market inferring positive managerial private
information when loans are used as a financing source.
Second, Yook (2003) argues that an increase in financial leverage might be associated with
greater acquirer CAR because acquirers with higher leverage should be more diligent in choosing
their target firms and structuring M&A deals, leading to more profitable deals. To control for this
disciplinary effect of debts, we add the change in leverage from the year before the M&A
announcement to the year after the M&A completion (∆ Acquirer Leverage) to model (1) and
present the estimation results in column (2) of Table 5, Panel A. We find that the positive
association between Loan Finance and Acquirer CAR remains statistically significant with a
similar economic magnitude, suggesting that our previous results are not driven by the disciplinary
effect of leverage. In column (3) of the same table, we add both Bond Finance and ∆ Acquirer
Leverage to the baseline regression, and the statistical and economic significances of the
coefficient on Loan Finance remain intact.
<Insert Table 5 here>
Third, Ivashina et al. (2009) show that lenders might have an incentive to get rid of
borrowers with bad credit quality through M&A transactions. To investigate whether our results
are driven by M&A deals in which the target has poor credit quality, we add to our regression
model two additional variables: Target Leverage and Target Altman’s Z score. The estimation
results are reported in Table 5, Panel B. Since these two measures are only available for public

16
targets, our sample size reduces by more than two thirds. The coefficient on the Loan Finance
dummy, however, remains statistically significant, suggesting that our results are unlikely to be
driven by lenders’ incentive to turn risky borrowers into M&A targets.
Last, the model in Vladimirov (2015) suggests that, in bidding contests, acquiring firms
with lower cost of debt can offer higher premiums to the target and enjoy greater gains from M&A
investments. To test if our results are driven by differences in cost of debt financing, we construct
Cost of Debt as the average of interest rate spread (all-in-spread-drawn) of all syndicated loans
borrowed by the acquirer over the past five years before the M&A announcement and include it as
a control variable in model (1). The results are reported in Table 5, Panel C. Even though the
sample size reduces by more than one half due to the unavailability of cost of debt data, the
coefficient on Loan Finance dummy remains statistically significant. Cost of Debt, on the other
hand, is not significantly related to Acquirer CAR. In column (2) of Table 5, Panel C, we further
add the interaction term Loan Finance × Cost of Debt. If the effect of loan financing is driven by
firms with low cost of debt, the coefficient on the interaction term should be negative. We find
that the coefficient on the interaction term is significantly positive, suggesting that cost of debt
does not explain our main findings.
Vladimirov’s model (2015) also implies that target announcement returns should be higher
for debt-financed M&A deals, since acquirers with a cost advantage in debt financing should pay
a higher offer premium to the target in order to win the bidding contest. Although it is not our
focus, we also examine the relationship between loan financing and Offer Premium and Target
CAR. The results are reported in Table 5, Panel D. We find that Loan Finance has statistically
insignificant relationships with Target CAR and Offer Premium. These results are again
inconsistent with Vladimirov’s (2015) prediction.

17
4. DIRECT EVIDENCE OF LENDER-SIDE FACTORS
4.1 Instrumental variable (IV) analysis
In this section, we use an IV approach to provide direct evidence of lender-side effects on
acquirer CAR. Given our purpose, the instrument needs to be a lender-side variable that (1) affects
the likelihood that an M&A deal is financed with syndicated loans (the relevance condition) and
(2) does not directly affect M&A announcement returns (the exclusion restriction).
Prior banking literature suggests that private lenders such as banks tend to concentrate their
lending activities in their local captive markets (Guiso et al., 2004; Degryse and Ongena, 2005).
This is because lenders’ ability to obtain borrower-specific information decreases with lender-
borrower distance (e.g. Almazan, 2002; Agarwal and Hauswald, 2010; Knyazeva and Knyazeva,
2012; Hollander and Verriest, 2016). Additionally, Cetorelli and Strahan (2006) suggest that the
degree of bank competition affects firms’ access to bank credit. Accordingly, the likelihood that
an acquirer receives syndicated loans to finance an M&A deal should increase with the degree of
competition among local banks. Therefore, we use Bank Density, defined as the number of local
banks divided by the number of local public firms (excluding the acquirer), as our instrument. We
obtain bank location from Reports of Condition and Income (Call Reports), which contain all US
commercial banks registered with the Federal Deposit Insurance Corporation.15 We obtain public
firms’ headquarters location from the Compustat database.16 For each acquirer in the sample, we
compute the ratio of the numbers of banks to the number of public firms (excluding the acquirer)
located within 200, 500 and 1000 kilometers from the acquirer’s headquarters in the fiscal year
prior to the M&A announcement17.
15 We do not use lender location in the Dealscan database because most ZIP codes in Dealscan are missing. 16 Note that the location of a firm’s headquarters is not necessarily where the firm is incorporated. 17 The spherical distance between two places, X and Y, is calculated as follows: Distance =
6,371×Arcos[Sin(LatitudeX)*Sin(LatitudeY) + Cos(LatitudeX)*Cos(LatitudeY)*Cos(LongitudeX-LongitudeY)].
18
Since our endogenous regressor, Loan Finance, is a binary variable, we follow the
approach suggested by Wooldridge (2002) in conducting our instrumental analysis. This approach
has been implemented in prior empirical studies, such as Faulkender and Peterson (2006) and
Bharath et al. (2011). Specifically, in the first stage we estimate a probit regression with Loan
Finance as the dependent variable. The independent variables are Bank Density and all other
control variables from model (1). We then use the predicted probability from the first-stage
regression as an instrumental variable in the second stage of analysis. The results for this test are
presented in Table 6, Panels A and B. Panel A presents the estimation results for the first-stage
regression. The coefficient on Bank Density has the predicted signs and is statistically significant.
The first-stage F-statistic shows that the instrument is a significant explanatory variable of Loan
Finance, suggesting that the relevance condition is satisfied. Results for the second-stage
regression are presented in Panel B, confirming a positive relationship between Loan Finance and
Acquirer CAR. Overall, the results in Table 6 provide direct evidence that the relationship between
loan financing and acquirer CAR is at least partially attributable to lender-side factors.
<Insert Table 6 here>
4.2. FAS 166/167 and the relationship between loan financing and acquirer CAR
FAS 166/167, which became effective at the beginning of 2010, requires banks to
consolidate a large number of variable interest entities that had previously been kept off banks’
balance sheet. This regulatory change led to a significant increase in banks’ assets and hence
effectively increased their regulatory capital requirement.18 Prior studies find that on average
banks tighten lending standard and increase loan quality after FAS 166/167 (Tian and Zhang, 2016;
Dou, 2017; Dou, Ryan, and Xie, 2018). Therefore, we use FAS 166/167 as a quasi-natural
18 Banks can respond to an increase in regulatory capital by either reducing assets or raising more capital. It is likely
that they employ both solutions.

19
experiment to examine the impact of lender monitoring and screening effects on acquirer gains. If
lenders’ monitoring and screening explain the association between loan financing and Acquirer
CAR, then this association should become stronger after FAS 166/167.
To provide evidence on this prediction, we add Post FAS and its interaction with Loan
Finance into the baseline regression (1). Post FAS is a dummy variable that equals one for
acquisitions announced in 2010 or later and zero otherwise. We expect the coefficient on the
interaction term Loan Finance × Post FAS to be positive, consistent with the relationship between
loan financing and acquirer gains becoming stronger after FAS 166/167. The estimation results
are presented in Table 7, Panel A. The first column presents the estimation results using the full
sample period. As predicted, the coefficient on the interaction term Loan Finance × Post FAS is
positive and statistically significant at the 5-percent level, suggesting that the association between
Loan Finance and Acquirer CAR is more positive when lenders have incentives to tighten lending
standards.
<Insert Table 7 here>
Since the implementation of FAS 166/167 in 2010 was adjacent to the 2007–08 GFC, to
mitigate the concern that the regression results for the full sample are confounded by the unusual
market conditions around the GFC, we exclude M&As announced in 2007 and 2008 and re-
estimate the regression. The coefficient on the interaction term remains significantly positive (see
the second column in Table 7, Panel A). In the last column in Table 7 (Panel A), we present the
estimation results using only M&As announced in 2009–10 (the two years immediately before and
after FAS 166/167); the sample size drops to only 342 observations after this restriction. However,
the coefficient on the interaction term Loan Finance × Post FAS remains positive and statistically

20
significant at the 5-percent level. Since our results still hold in this much smaller subsample of
only two years surrounding FAS 166/167, they are unlikely to be driven by trend effects.
To further rule out the possibility that our previous results were driven by trend effects, we
conduct two placebo tests. Specifically, we define two placebo regulatory changes, one before and
one after FAS 166/167 became effective, and repeat our analysis using these placebo changes. In
the first test, the placebo regulatory change is defined as the beginning of 2012 and we restrict the
sample to the 2011–12 period. We present the results in the first column of Table 7, Panel B. The
coefficient on the interaction of the term Loan Finance ×Post FAS dummy becomes statistically
insignificant. In the second test, the placebo regulatory change is defined as the beginning of 2006
and we restrict the sample to the 2005–06 period.19 The coefficient on the interaction term remains
statistically insignificant (see the second column in Table 7, Panel B). These placebo tests provide
more confidence that our results in Table 7, Panel A are driven by the shock in lenders’ monitoring
and screening incentives caused by FAS 166/167.
4.3. Persistence in lead lender’s M&A lending performance
Fama (1985) and Chemmanur and Fulghieri (1994) suggest that lenders differ in their skills
in screening and monitoring borrowers. Assuming that lenders indeed vary in their skills and lender
skills are persistent, we expect that lenders that perform well in the past, on average, will continue
to perform well in the future. We follow an approach similar to Bao and Edmans (2011) and
Golubov and Zhang (2015) to test this prediction. Specifically, we first identify 122 lead lenders20
that have provided financing to at least two M&A deals in our sample. We calculate the mean
acquirer CAR for M&A deals financed by each lead lender at the beginning of each year over one,
19 We choose the beginning of 2006 as the second placebo regulatory change to make sure the sample period for our
second placebo test does not overlap with the 2007–08 GFC. 20 We use lender company ID provided by the DealScan database to define lenders.

21
two and three years in the past (past performance) and over one, two and three years in the future
(future performance). As discussed before, we expect a positive relation between lenders’ past
performance and future performance.
We sort the lender-year observations in our sample into quartiles based on historical
performance and compare the average future performance for each quartile. Table 8, Panels A, B
and C present the results when past performance is calculated over one year, two years, and three
years, respectively. In general, we find that lead lenders’ performance is indeed persistent. In Panel
A, for example, when lender-year observations are sorted on one-year past performance, the
average Acquirer CAR over two years in the future in the top quartile is 4.4%, while that of the
bottom quartile is only 1.5%. The difference in Acquirer CAR between the two groups (2.9%) is
statistically significant at the 5-percent level. The results in Panels B and C again suggest that
lender performance is persistent. This finding provides additional evidence that the higher acquirer
CAR of loan-financed M&A deals can be attributed to lender-side factors.
<Insert Table 8 here>
5. CHANNELS THROUGH WHICH LENDERS AFFECT ACQUIRER
ANNOUNCEMENT RETURNS
Our previous analyses establish that syndicated loan lenders contribute to the higher
acquirer CAR in loan-financed M&A deals. In this section we explore possible channels through
which lenders affect acquirer CAR.
5.1. The acquirer revaluation effect
M&A announcement may induce external investors to reassess the acquirer and the target’s
stand-alone values (e.g. Barraclough et al., 2013; Wang, 2016). Therefore, the higher acquirer
CAR in loan-financed M&A deals may also reflect the market’s updated assessment of the

22
acquirer’s stand-alone value (the acquirer revaluation effect). In the context of this study, a private
lender’s decision to provide a loan to finance an M&A could be viewed as a favorable signal of
the stand-alone value of the borrower (Diamond, 1984; Ramakrishnan and Thakor, 1984; Fama,
1985) rather than the quality of the M&A deal, therefore leading to higher acquirer announcement
returns. Thus, we conduct several tests to examine whether our results are driven by the acquirer
revaluation effect.
First, the acquirer revaluation effect implies that the association between Loan Finance and
Acquirer CAR results should be stronger when the information asymmetry or uncertainty about
the acquirer’s stand-alone value is higher. We utilize two measures of the acquirer’s information
asymmetry: the acquirer’s stock return volatility measured prior to M&A announcement and
financial analysts’ earnings forecast dispersion. Higher acquirer stock volatility or analyst forecast
dispersion indicates higher information asymmetry between the acquirer and external investors.
We add these two alternative measures of acquirer information asymmetry and their interactions
with Loan Finance into the baseline regression. The estimation results, reported in columns (1)
and (2) of Table 9, show that the coefficients on the two interaction terms are statistically
indistinguishable from zero. These results are inconsistent with the acquirer revaluation effect.
<Insert Table 9 here>
Second, we argue that the acquirer revaluation effect of loan financing in M&A deals should
be weaker if other indicators of acquirers’ stand-alone value already exist. The presence of the
acquirer’s previously borrowed outstanding loans (other than the loan used to finance the focal
M&A deal) is one such alternative indicator. To test this conjecture, we construct Existing Loan,
a dummy variable equal to one if an acquirer has at least one previously borrowed outstanding
loan at the time of the M&A announcement. In column (3) of Table 9, we add Existing Loan and

23
its interaction with Loan Finance into the baseline regression. If the acquirer revaluation effect
drives the relation between loan financing and acquirer CAR, we expect the coefficient on the
interaction term to be significantly negative. However, we find that the coefficient is statistically
indistinguishable from zero, again inconsistent with the acquirer revaluation effect.
Third, prior studies such as Boot (2000) and Bharath et al. (2011) suggest that banks can
gain reusable proprietary information about a borrower through a repeated lending relationship.
Lenders that have a prior lending relationship with the acquirer likely have access to more
proprietary information about the acquirer’s stand-alone value. The revaluation effect, if any,
should be stronger in such cases. To test this prediction, we construct Acquirer-Lender Relation
as a dummy variable equal to one if the lead lender(s) had lent any loan to the acquirer over the
three years before the M&A. In column (4) of Table 9, we restrict the sample to loan-financed
M&A deals only and test the relation between Acquirer-Lender Relation and acquirer CAR. The
coefficient on Acquirer-Lender Relation is negative and statistically insignificant. In sum, all the
results presented in Table 9 are inconsistent with the hypothesis that the higher acquirer CAR in
loan-financed M&As is driven by the acquirer revaluation effect.
5.2 The deal quality certification effect
Uncertainty about the M&A deal quality may cause external investors to apply a higher
discount rate when valuing an M&A transaction, leading to a value loss for acquirer shareholders.
Since syndicated loan lenders likely have access to private information about the acquirer and the
M&A deal, lenders’ decision to finance an M&A deal may help reduce the uncertainty about the
M&A deal quality faced by external investors and, therefore, at least partially unlocks the lost
value (the deal quality certification effect). This deal quality certification effect suggests that the
association between loan financing and acquirer gains should be stronger if information

24
asymmetry or uncertainty about the M&A deal quality is higher and weaker if other indicators of
the M&A deal quality already exist.21
To examine the deal quality certification effect, we construct several measures of
information asymmetry with regard to the M&A deal quality. From the acquirer shareholders’
perspective, M&A deal quality depends on multiple factors including potential synergy and the
target stand-alone value. We argue that both potential synergy and target stand-alone value are
more difficult to assess for deals with private targets than deals with public targets due to less
stringent disclosure requirements for private firms (Officer, Poulsen, and Stegemoller, 2009). The
presence of multiple bidders, on the other hand, could serve as a positive indicator of the target’s
stand-alone value. Also, bidding contests that involve multiple bidders can reveal more
information about the potential synergy to external investors, thereby reducing the uncertainty
about the perceived M&A deal quality. Accordingly, we expect the effect of loan financing on
acquirer CAR to be stronger for deals with private targets and weaker for deals with multiple
bidders. In column (1) and (2) of Table 10, we add the interaction terms of Loan Finance with
Private Target and Multiple Bidder, respectively. The coefficient on the interaction term of Loan
Finance and Private Target is positive but insignificant, while the coefficient on the interaction
term between Loan Finance and Multiple Bidder is significantly negative.22 Thus, we find some
evidence consistent with the deal quality certification effect.
<Insert Table 10 here>
21 It is possible that both lenders and external investors rely on the same source of information to assess the M&A
deal quality. In this case, lenders do not create value for acquiring shareholders even though loan-financed M&As are
associated with higher acquirer CAR. Under this scenario, the relationship between loan financing and acquirer CAR
should not be affected by information asymmetry or uncertainty about the M&A deal quality. 22 The coefficient on the interaction term of Loan Finance and Private Target is significantly positive when we restrict
the sample to cash-only M&A deals.

25
Finally, if the lead lender that provides loan financing to the acquirer also has a prior lending
relationship with the target, it can gain access to proprietary information on the target side. Under
such a scenario, the lead lender should have a better ability to assess the target’s stand-alone value
and the potential synergy gains from the M&A deal. In this case, lenders’ decision to loan money
to finance an M&A deal helps reduce uncertainty about the deal quality, thus leading to a higher
acquirer CAR. To test this conjecture, we construct Target-Lender Relation based on whether the
lead lender that finances the M&A deal has lent any loan to the M&A target over the three years
before the M&A announcement. In column (3) of Table 10, we restrict the sample to syndicated
loan-financed M&A deals, with the Target-Lender Relation dummy as the explanatory variable of
interest. We find that acquirer CAR is significantly higher when the lead lender has a prior
relationship with the target (p<0.01). In sum, these findings are generally consistent with the deal
quality certification effect of loan financing in M&As.
5.3 The ex-ante monitoring effect
Assuming lenders have informational advantages that allow them to better assess M&A
deal quality relative to shareholders, by refusing to provide financing to value-destroying M&As
lenders can prevent at least some of those bad M&As from happening, thus preserving shareholder
value (the ex-ante monitoring channel). This ex-ante channel is difficult to verify directly, because
we do not observe cases where the acquirer requests a loan but is declined by the lender. Therefore,
we attempt to provide indirect evidence of the ex-ante monitoring channel by exploring the
boundary conditions where private lenders’ role in preventing value-destroying M&A deals are
potentially more prominent. Specifically, we argue that the role of private lenders in preventing
value-destroying M&A deals should be less significant for acquirers that already have strong

26
corporate governance in place. Thus, we expect that the relationship between loan financing and
acquirer CAR is attenuated by alternative corporate mechanisms.
Following Bebchuk, Cohen, and Ferrell (2009) and Masulis et al. (2007), we create an
acquirer management entrenchment index (Acquirer E-index) based on the six most important anti-
takeover provisions, using the ISS Governance database.23 A greater Acquirer E-index indicates
weaker acquirer corporate governance from the market for corporate control (Masulis et al., 2007);
therefore, we expect the coefficient on the interaction of Loan Finance and Acquirer E-index to be
positive. Additionally, we follow the approach in Bushee and Noe (2000) and Bushee (2001) to
construct the percentage of shares outstanding held by dedicated institutional shareholders
(Acquirer Dedicated IO) and use it as a proxy for shareholder monitoring. We expect the
coefficient on the interaction of Loan Finance and Acquirer Dedicated IO to be negative, since a
high percentage of dedicated institutional holding indicates that the acquirer already has strong
corporate governance in place (Chen et al., 2007). The estimation results are reported in Table 11.
We find that the relationship between Loan Finance and Acquirer CAR is significantly stronger
for acquirers that have higher management entrenchment index (i.e., weaker governance) and
significantly weaker for acquirers that have higher dedicated institutional ownership (i.e., stronger
governance). Thus, the results presented in Table 11 provide evidence consistent with the ex-ante
monitoring channel.
<Insert Table 11 here>
5.4 The ex-post monitoring effect
23 An alternative corporate governance measure is the G-index based on 24 antitakeover provisions developed by
Gompers, Ishii, and Metrick (2003). However, the G-index data is unavailable for the period after 2006. As a result,
we use the E-index instead because it is available for most of our sample period.

27
The fourth possible channel through which syndicated loan financing benefits acquirer
shareholders is ex-post monitoring. Specifically, once private lenders have loaned money to
finance an M&A deal, they will monitor the acquirer over the term of the loan ex post. Lenders’
ex-post monitoring activities can create a positive spillover effect for acquirer shareholders. We
reason that the ex-post monitoring effect should be stronger if lenders monitor the acquirer for a
longer period. To test this prediction, we sort the loan-financed M&A deals into three groups
(short, medium and long maturity) based on the term to maturity of loans used for M&A
financing24. We then re-estimate model (1) replacing the key explanatory variable Loan Finance
with three dummies variables corresponding to the three term-to-maturity groups and report the
results in Table 12, Panel A. Consistent with the ex-post monitoring channel, we find that the effect
of loan financing is strongest for the group with the longest terms to maturity. We acknowledge
that there might be alternative explanations for this finding; for example, private lenders are willing
to offer loans with longer terms to maturity if the perceived M&A deal quality is higher.
<Insert Table 12 here>
In addition to acquirer CAR around the M&A announcement, we examine acquirer post-
merger long-run stock performance. If the ex-post monitoring effect is gradually realized by the
market over time, we might observe a positive relation between loan financing and acquirers’ long-
run stock performance. We adopt the method in Barber and Lyon (1997) and Mitchell and Stafford
(2000) to construct buy-and-hold long-run abnormal returns (BHAR) for acquirers. More
specifically, we first merge the CRSP monthly stock return universe with Compustat to acquire
firms’ book value of equity. Then, for the merged CRSP/Compustat universe we create 5-by-5
portfolios formed by firm size (as measured by market value of equity at the end of June) and
24 If an M&A deal is financed by more than one loan facility, we choose the longest term to maturity.

28
book-to-market quintiles using NYSE breakpoints. Each acquirer is assigned to a portfolio, and
we use the equal-weighted buy-and-hold return with monthly rebalancing of the corresponding
portfolio as the performance benchmark for the acquirer. Acquirer BHAR is the difference between
the acquirer’s post-acquisition buy-and-hold return and the benchmark portfolio’s buy-and-hold
return over one, two, and three years after the acquisition announcement month. If a stock in the
M&A sample is delisted during the holding period, we include the delisting return in the delisting
month and replace the missing stock returns in the subsequent months with the benchmark
portfolio’s returns. In Table 12, Panel B, we estimate a modified version of the regression model
(1) with 1-year, 2-year and 3-year BHAR as the dependent variables. We find a positive and
marginally significant relationship between Loan Finance and 3-year BHAR. Loan Finance, on
the other hand, does not have a statistically significant relation with 1-year or 2-year BHAR. In
sum, our results provide some support for the ex-post monitoring channel.
6. CONCLUSION
This paper makes four main contributions to the M&A literature. First, we employ a new
approach to identify M&A transactions financed by syndicated loans and provide evidence that
acquirer gains are higher in loan-financed M&A deals than in other deals. Most prior studies rely
on firms’ financing sources that exist before the M&A announcement date without being able to
verify that those existing sources are actually used to finance the M&A deal. To address this
limitation, we use a two-step approach that involves manually checking M&A announcements to
correctly identify M&A deals financed with syndicated loans.
Second, this study provides direct evidence of lender-side effects on acquirer gains, which
are largely ignored in prior literature. In particular, we use two identification strategies including
an instrumental variable approach and a quasi-natural experiment to accentuate the lender-side

29
factors while controlling for acquirer-side factors. Additionally, we demonstrate that lender
performance in M&A lending is persistent over time.
Third, we establish the channels through which syndicated loan financing can affect
acquirer shareholders’ value. Specifically, we show that lenders’ participation in the M&A market
can resolve uncertainty about the M&A deal quality, prevent acquirers from undertaking value-
destroying M&A transactions, and provide long-term monitoring that is beneficial to acquirer
shareholders. Our study also examines the interplay between lenders and other corporate
governance mechanisms.
Fourth, our study complements the empirical literature on the impacts of payment methods
on acquirer gains. In addition to the signaling effects of payment methods documented in prior
M&A studies, our results suggest that lenders’ participation in M&A deals also contributes to
higher acquirer gains in cash deals.

30
REFERENCES
Agarwal, S., Hauswald, I., 2010. Distance and private information in lending. Review of Financial Studies
23 (7), 2757-2788.
Akbulut, M. 2013. Do overvaluation-driven stock acquisitions really benefit acquirer shareholders? The
Journal of Financial and Quantitative Analysis 48(4), 1025-1055.
Almazan, A., 2002. A model of competition in banking: bank capital versus expertise. Journal of Financial
Intermediation 11(1), 87–121.
Amihud, Y., Garbade, K., Kahan, M., 1999. A new governance structure for corporate bonds. Stanford Law
Review 51(3), 447–492.
Amihud, Y., Lev, B., Travlos, N.G., 1990. Corporate control and the choice of investment financing: the
case of corporate acquisitions. Journal of Finance 45(2), 603-616.
Bao, J., Edmans, A., 2011. Do investment banks matter for M&A returns? The Review of Financial Studies
24(7), 2286-2315.
Barclay, M.J., Smith, C.W., Watts, R.L., 1997. The determinants of corporate leverage and dividend
policies. Journal of Financial Education 23, 1-15.
Barber, B.M., Lyon, J.D., 1997. Detecting long-run abnormal stock returns: The empirical power and
specification of test statistics. Journal of Financial Economics 43(3), 341-372.
Barraclough, K., Robinson, D.T., Smith, T., Whaley, R.E., 2013. Using option prices to infer overpayments
and synergies in M&A transactions. Review of Financial Studies 26(3), 695-722.
Bebchuk, L., Cohen. A., Ferrell A., 2009. What matters in corporate governance? The Review of Financial
Studies 22(2),783–827.
Betton, S., Eckbo, B.E., Thorburn, K.S., 2008. Corporate takeovers. In Eckbo, B.E. (Ed.), Handbook of
Corporate Finance: Empirical Corporate Finance. Elsevier/North-Holland, Amsterdam, pp. 291-430.
Bharadwaj, A., Shivadasani, A., 2003. Valuation effects of bank financing in acquisitions. Journal of
Financial Economics 67(1), 113-148
Bharath, S.T., Dahiya, S., Saunders, A., Srinivasan, A., 2011. Lending relationships and loan contract terms.
The Review of Financial Studies 24(4), 1141–1203.
Boot, A., 2000. Relationship banking: what do we know? Journal of Financial Intermediation 9(1), 7-25.
Boyd, J.H., Prescott, E.C., 1986. Financial intermediary-coalitions. Journal of Economic Theory 38(2),
211–232.
Bradley, M., Sundaram, A., 2006. Acquisitions and performance: a reassessment of the evidence. Working
Paper, Duke University, Durham NC.
Bushee, B.J., 2001. Do institutional investors prefer tear-term earnings over long-run value? Contemporary
Accounting Research 18(2): 207-246.

31
Bushee, B.J., Noe, C.F., 2000. Corporate disclosure practices, institutional investors, and stock return
volatility. Journal of Accounting Research 38, 171-202.
Carhart, M., 1997. On persistence in mutual fund performance. Journal of Finance 52(1), 57-82.
Cetorelli, N., Strahan, P.E., 2006. Finance as a barrier to entry: bank competition and industry structure in
local U.S. markets. The Journal of Finance 61(1), 437-461.
Chang, S., 1998. Takeovers of privately held targets, method of payment, and bidder returns. Journal of
Finance 53(2), 773-784.
Chava, S., Roberts, M.R., 2008. How does financing impact investment? The role of debt covenants.
Journal of Finance 63(5), 2085-2121.
Chemmanur, T.J., Fulghieri, P., 1994. Reputation, renegotiation, and the choice between bank loans and
publicly traded debt. The Review of Financial Studies 7(3), 475-506.
Chen, X., Harford, J., Li, K., 2007. Monitoring: which institutions matter. Journal of Financial Economics
86(2), 279–305.
Degryse, H., Ongena, S., 2005. Distance, lending relationship, and competition. The Journal of Finance
60(1), 231-266.
Diamond, D.W., 1984. Financial intermediation and delegated monitoring. The Review of Economic
Studies 51(3), 393-414.
———. 1991. Monitoring and reputation: The choice between bank loans and directly placed debt. Journal
of Political Economy 99(4), 689–721.
Dou, Y., 2017. The spillover effect of consolidating securitization entities on small business lending.
Working Paper, New York University, New York NY.
Dou, Y., Ryan, S.G., Xie, B., 2018. The real effects of FAS 166/167 on banks’ mortgage approval and sale
decisions. Journal of Accounting Research 56(3), 843-882.
Fama, E., 1985. What’s different about banks? Journal of Monetary Economics 15(1), 29-39.
Fama, E., French, K., 1993. Common risk factors in the returns on bonds and stocks. Journal of Financial
Economics 33(1), 3-53.
Faulkender, M., Petersen, M., 2006. Does the source of capital affect capital structure? Review of Financial
Studies 19(1), 45-79.
Franks, J.R., Harris, R.S., Mayer, C., 1988. Means of payment in takeovers: results for the U.K. and the
U.S. In Auerbach, A. (Ed.), Corporate Takeovers, University of Chicago Press, Chicago IL
Fu, F., Guay, W.R., Zhang, W., 2016. Costly corporate governance: evidence from shareholder approval in
mergers and acquisitions. SSRN working paper.
Golubov, A., Zhang, H., 2015. Extraordinary acquirers. Journal of Financial Economics 116(2), 314-330.

32
Gompers, P.A., Ishii, J.L., Metrick, A., 2003. Corporate governance and equity prices. Quarterly Journal of
Economics 118(1), 107–55.
Guiso, L., Sapienza, P., Zingales, L., 2004. Does local financial development matter? Quarterly Journal of
Economics 119(3), 929-969.
Hollander, S., Verriest, A., 2016. Bridging the gap: the design of bank loan contracts and distance. Journal
of Financial Economics 119(2), 399-419.
Hope, O.K., Thomas, W., Vyas, D. 2013. Financial reporting quality of U.S. private and public firms. The
Accounting Review 88(5), 1715-1742.
Ivashina, V., Nair, V.B., Saunders, A., Massoud, N., 2009. Bank debt and corporate governance. The
Review of Financial Studies 22(1), 41-77.
Knyazeva, A., Knyazeva, D., 2012. Does being your bank’s neighbor matter? Journal of Banking & Finance
36(4), 1194-209.
Loughran, T., Vijh, A.M., 1997. Do long-term shareholders benefit from corporate acquisitions? Journal of
Finance 52(5), 1765-1790.
Martin, K.J., 1996. The method of payment in corporate acquisitions, investment opportunities, and
management ownership. Journal of Finance 51(4), 1227-1246.
Masulis, R.W., Wang, C., Xie, F., 2007. Corporate governance and acquirer returns. The Journal of Finance
62(4), 1851-1889.
Martynova, M., Renneboog, L., 2009. What determines the financing decision in corporate takeovers: Cost
of capital, agency problems, or the means of payment? Journal of Corporate Finance 15(3), 290-
315.
Mitchell, M.L., Stafford, E., 2000. Managerial decisions and long-term stock price performance. Journal of
Business 73(3), 287-329.
Moeller, S.B., Schlingemann, F.P., Stulz, R.M., 2004. Firm size and the gains from acquisitions. Journal of
Financial Economics 73(2), 201-228.
———., 2005. Wealth destruction on a massive scale? A study of acquiring firm returns in the recent
merger wave. Journal of Finance 60(2), 757–782.
Myers, S., Majluf, N., 1984. Corporate financing and investment decisions when firms have information
that investors do not have. Journal of Financial Economics 13(2), 187-221.
Officer M.S., Poulsen, A.B., Stegemoller, M., 2009. Target-firm information asymmetry and acquirer
returns. Review of Finance 13(3), 467–493.
Ramakrishnan, R.T.S., Thakor, A.V., 1984. Information reliability and a theory of financial intermediation.
Review of Economic Studies 51(3), 415-432.

33
Schenone, C., 2010. Lending relationships and information rents: Do banks exploit their information
advantages? The Review of Financial Studies 23(3), 1149-1199.
Schlingemann, F.P., 2004. Financing decisions and acquirer gains. Journal of Corporate Finance 10(5),
683-701.
Shleifer, A. Vishny, R.W., 2003. Stock market driven acquisitions. Journal of Financial Economics 70(3),
295-311.
Stulz, R.M., 1990. Managerial discretion and optimal financing policies. Journal of Financial Economics
26(1), 3– 27.
Tian, X., Zhang, H., 2016. Impact of FAS 166/167 on credit card securitization. Working Paper, Ohio
State University, Columbus OH.
Travlos, N.G., 1987. Corporate takeover bids, method of payment, and bidding firms’ stock returns.
Journal of Finance 42(4), 943-963.
Vladimirov, V., 2015. Financing acquirers in takeover contests. Journal of Financial Economics 117(3),
534-557.
Wang, W., 2018. Bid anticipation, information revelation, and merger gains. Journal of Financial
Economics 128 (2), 320-343.
Wooldridge, J.M., 2002. Econometric analysis of cross section and panel data. The MIT Press, Cambridge
MA.
Yook, K.C., 2003. Larger returns to cash acquisitions: Signaling effect or leverage effect? Journal of
Business 76(3), 477–498.

34
Appendix A: Variable definitions Variable Definition
Loan Finance An indicator that equals one if an M&A deal is financed by syndicated
loan(s) and zero otherwise. To identify loan-financed M&A deals, we first
identify M&A deals in which the acquirer has borrowed any loans with
“Acquisition line” or “Takeover” as the primary or secondary purpose
initiated during the periods from 90 days prior to the M&A announcement
to 180 days following the announcement, or the completion date of the deal
if this comes first. For potential loan-financed M&As, we manually search
the M&A announcement through Factiva, and SEC filings (form 8-K) to
verify whether the acquirer explicitly states that the M&A deal is financed
with bank loans.
Loan Finance Ratio The amount of M&A loan(s) scaled by the M&A deal value. If an M&A
deal is not financed with loans, then the value of this variable is zero.
Bond Finance
A dummy variable that equals 1 if an M&A deal is financed by a new bond
issuance. We first check whether the acquirer of an M&A deal has issued
any new bond issued during the periods from 90 days prior to the M&A
announcement to 180 days following the announcement, or the completion
date of the deal if this comes first. For potential bond-financed M&As, we
manually search the M&A announcement through Factiva and SEC filings
(form 8-K) to verify whether the acquirer explicitly states that the M&A
deal is financed with a new bond issuance.
Acquirer CAR
The three-day CAR to the acquirer’s stock over the three-day window (-1,
+1) around the M&A announcement date. Abnormal stock returns are
estimated using Fama-French-Carhart 4-factor model over the trading days
(-272, -21) before the deal announcement. Firms with less than 60 trading
days available to estimate the model are excluded.
Offer Premium The premium of the offer price over the target share price 4 weeks prior to
M&A announcement.
Target CAR The CAR to the target’s stock over window (-1, +1). Abnormal returns are
estimated using the same method as for the acquirer.
Acquirer Size The natural logarithm of the acquirer’s market value of equity in million
dollars measured at the fiscal year end prior to M&A announcement.
Acquirer ROA The acquirer’s return on assets for the last fiscal year prior to M&A
announcement.
Acquirer Cash The acquirer’s cash holding scaled by total assets measured at the fiscal year
end prior to M&A announcement.
Acquirer Leverage The acquirer’s total long-term and short-term debts scaled by total assets
measured at the fiscal year end prior to M&A announcement.
∆ Acquirer Leverage
Change in acquirer’s leverage ratio from the last year before the deal
announcement to the first year after the deal completion.
Acquirer Tobin Q
The acquirer’s Tobin’s Q, which is defined as the sum of market value of
equity and book value of liabilities scaled by book value of total assets at
the most recent fiscal year end prior to M&A announcement.
Deal Size The M&A transaction value scaled by acquirer’s market value of equity.
Private Target A dummy variable equal to one if the target is a private company and zero
otherwise.
Friendly A dummy variable equal to one if the M&A deal is a friendly takeover and
zero otherwise.

35
Tender A dummy variable equal to one if the M&A deal is a tender offer and zero
otherwise.
Multiple Bidder A dummy variable equal to one if there are multiple bidders involved in the
deal and zero otherwise.
Same Industry A dummy variable equal to one if the acquirer and the target are in the same
two-digit industry and zero otherwise.
Toehold A dummy variable equal to one if the acquirer held any shares of the target
before the deal announcement, zero otherwise.
Cash Only An indicator that equals 1 if the payment is 100% in cash and zero
otherwise.
Large Deal A dummy variable equal to one if the M&A deal value is equal to or larger
than 20% of the acquirer’s market value, zero otherwise.
Bank Density
(200, 500 and 1000 km)
The number of banks divided by the number of public firms located within
200, 500 and 1000 kilometers of the acquirer’s headquarters in the prior
fiscal year.
Post FAS A dummy variable equal to one for years 2010 (FAS166/167) and after,
zero otherwise.
Target Leverage The target’s total long-term and short-term debts scaled by total assets
measured at the fiscal year end prior to M&A announcement.
Target Altman’s Z The target’s Altman’s Z score defined as defined in (Altman and Hotchkiss,
2006) measured at the fiscal year end prior to M&A announcement.
Past (future) lender
performance
(1, 2 and 3 years)
The average historical Acquirer CAR of M&A loans in which a lead
lender(s) has participated in over 1, 2 and 3 years in the past (future).
Acquirer Volatility Standard deviation of acquirer’s stock return over the trading days (-210, -
60) before the M&A announcement date.
Forecast Dispersion
Standard deviation of financial analysts’ earnings forecasts for the acquirer
scaled by the share price of the acquirer for the last year before the M&A
announcement.
Existing Loan
An indicator equal to 1 if the acquirer has any other outstanding syndicated
loan (not for M&A financing) that has been initiated at least 90 days prior to
M&A announcement and matures after the M&A announcement.
Acquirer-Lender
Relation
A dummy variable equal to one if the lead lender(s) of the M&A loan had
lent any other loan to the acquirer over the past three years prior to the
M&A announcement.
Target-Lender Relation
A dummy variable equal to one if the lead lender(s) of the M&A loan had
lent any other loan to the target over the past three years prior to the M&A
announcement.
Acquirer E-Index
The acquirer’s managerial entrench index based on 6 antitakeover
provisions (Bebchuk, Cohen, and Ferrell, 2004) measured in the prior fiscal
year.
Acquirer Dedicated IO The percentage of the acquirer’s shares held by dedicated institutional
investors (Bushee, 2001) measured in the prior quarter end.
Maturity The term to maturity of the loan for M&A financing in number of years.
BHAR
(1, 2 and 3 years)
The acquirer’s buy-and-hold abnormal return (BHAR) over 1, 2 and 3 years
after M&A announcement. BHAR is defined as the difference between the
acquirer’s post-M&A buy-and-hold return minus an equal-weighted
benchmark portfolio matched on size and book-to-market.
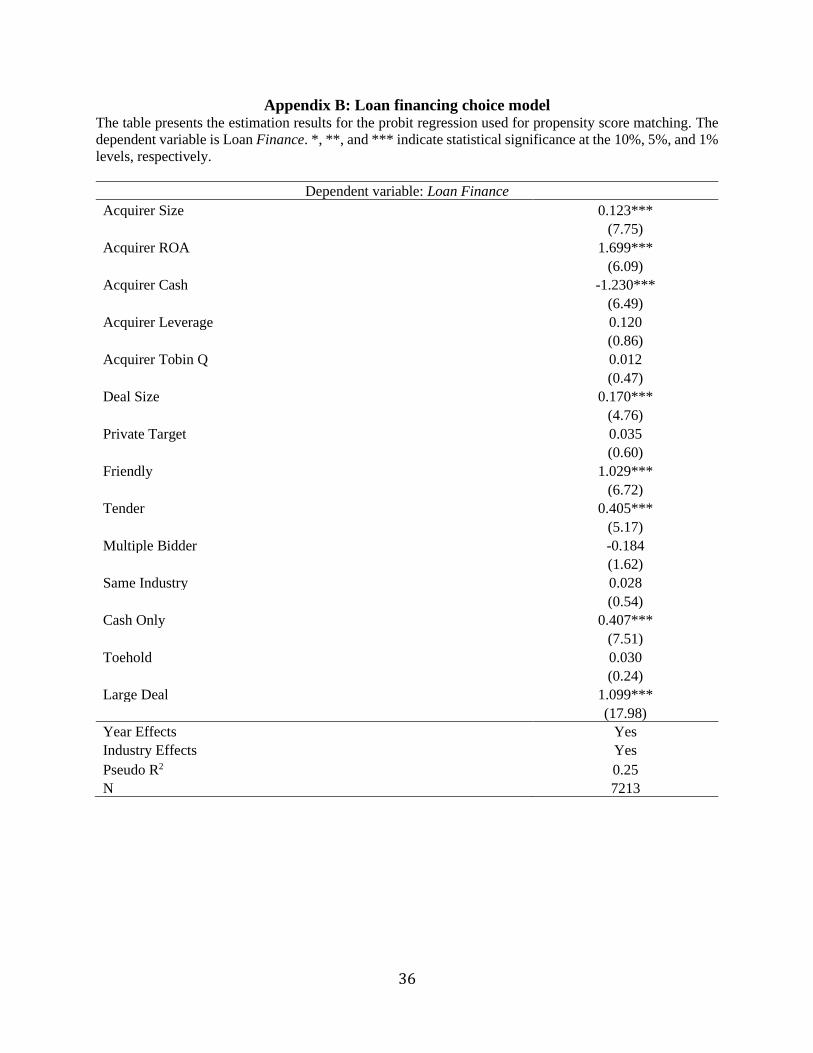
36
Appendix B: Loan financing choice model The table presents the estimation results for the probit regression used for propensity score matching. The
dependent variable is Loan Finance. *, **, and *** indicate statistical significance at the 10%, 5%, and 1%
levels, respectively.
Dependent variable: Loan Finance
Acquirer Size 0.123***
(7.75)
Acquirer ROA 1.699***
(6.09)
Acquirer Cash -1.230***
(6.49)
Acquirer Leverage 0.120
(0.86)
Acquirer Tobin Q 0.012
(0.47)
Deal Size 0.170***
(4.76)
Private Target 0.035
(0.60)
Friendly 1.029***
(6.72)
Tender 0.405***
(5.17)
Multiple Bidder -0.184
(1.62)
Same Industry 0.028
(0.54)
Cash Only 0.407***
(7.51)
Toehold 0.030
(0.24)
Large Deal 1.099***
(17.98)
Year Effects Yes
Industry Effects Yes
Pseudo R2 0.25
N 7213

37
Figure 1: Average Loan Finance Ratio This figure presents the ratio of M&A loan amount scaled by transaction value (Loan Finance Ratio) by
year over our sample period.
0%
10%
20%
30%
40%
50%
60%
70%
80%
90%
19
90
19
92
19
94
19
96
19
98
20
00
20
02
20
04
20
06
20
08
20
10
20
12
20
14
20
16
Loan Finance Ratio

38
Table 1: Sample distribution
Our sample consists of 7,681 M&A deals over the period 1990–2015. Panel A reports the
distribution of our sample by year. Panel B reports the distribution of the sample by industry
(Fama–French’s 30 industry categories).
Panel A: Sample distribution by year
Year N
1990 124
1991 171
1992 214
1993 306
1994 379
1995 383
1996 397
1997 468
1998 445
1999 358
2000 379
2001 281
2002 242
2003 299
2004 347
2005 362
2006 336
2007 350
2008 231
2009 162
2010 189
2011 200
2012 213
2013 233
2014 279
2015 333
Total 7,681

39
Table 1 (continued)
Panel B: Sample distribution by industry
Industry N
Food Products 104
Beer & Liquor 6
Tobacco Products 6
Recreation 141
Printing and Publishing 65
Consumer Goods 66
Apparel 61
Healthcare, Medical Equipment, Pharmaceutical Products 716
Chemicals 99
Textiles 25
Construction and Construction Materials 186
Steel Works etc. 111
Fabricated Products and Machinery 199
Electrical Equipment 66
Automobiles and Trucks 56
Aircraft, ships, and railroad equipment 52
Precious Metals, Non-Metallic, and Industrial Metal Mining 22
Coal 10
Petroleum and Natural Gas 274
Utilities 197
Communication 326
Personal and Business Services 1,141
Business Equipment 828
Business Supplies and Shipping Containers 72
Transportation 140
Wholesale 228
Retail 213
Restaurants, Hotels, Motels 97
Banking, Insurance, Real Estate, Trading 2,049
Others 125
Total 7,681
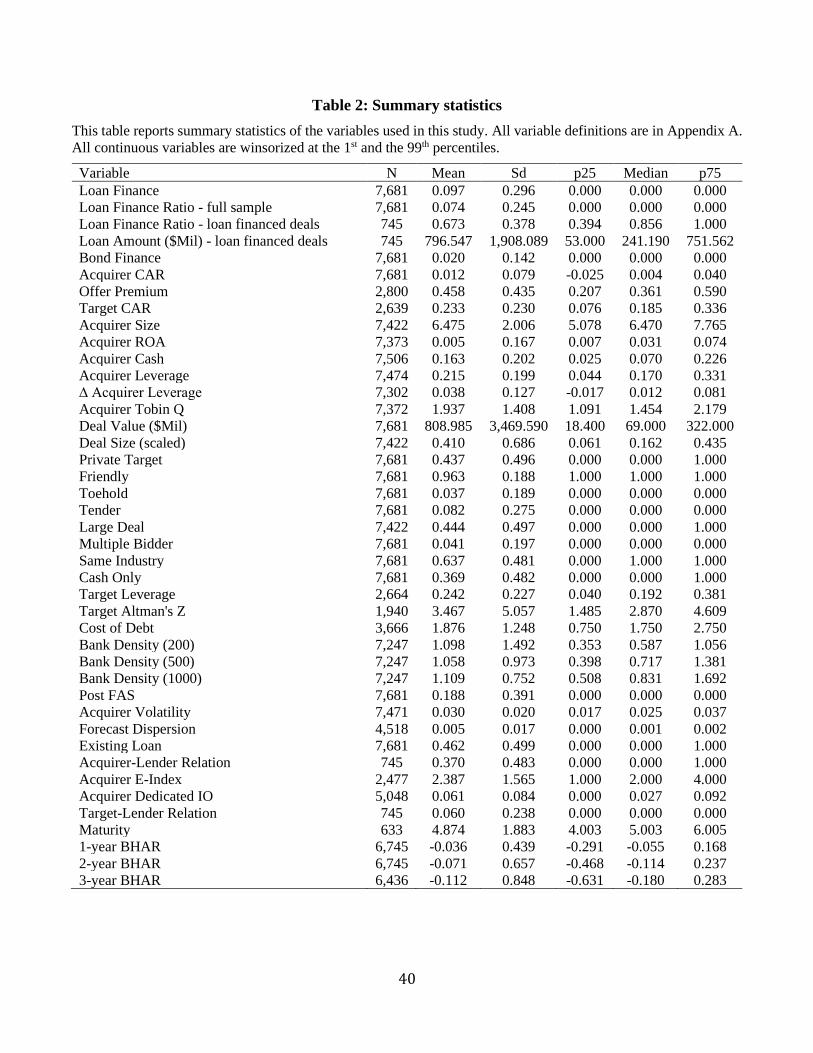
40
Table 2: Summary statistics
This table reports summary statistics of the variables used in this study. All variable definitions are in Appendix A.
All continuous variables are winsorized at the 1st and the 99th percentiles.
Variable N Mean Sd p25 Median p75
Loan Finance 7,681 0.097 0.296 0.000 0.000 0.000
Loan Finance Ratio - full sample 7,681 0.074 0.245 0.000 0.000 0.000
Loan Finance Ratio - loan financed deals 745 0.673 0.378 0.394 0.856 1.000
Loan Amount ($Mil) - loan financed deals 745 796.547 1,908.089 53.000 241.190 751.562
Bond Finance 7,681 0.020 0.142 0.000 0.000 0.000
Acquirer CAR 7,681 0.012 0.079 -0.025 0.004 0.040
Offer Premium 2,800 0.458 0.435 0.207 0.361 0.590
Target CAR 2,639 0.233 0.230 0.076 0.185 0.336
Acquirer Size 7,422 6.475 2.006 5.078 6.470 7.765
Acquirer ROA 7,373 0.005 0.167 0.007 0.031 0.074
Acquirer Cash 7,506 0.163 0.202 0.025 0.070 0.226
Acquirer Leverage 7,474 0.215 0.199 0.044 0.170 0.331
∆ Acquirer Leverage 7,302 0.038 0.127 -0.017 0.012 0.081
Acquirer Tobin Q 7,372 1.937 1.408 1.091 1.454 2.179
Deal Value ($Mil) 7,681 808.985 3,469.590 18.400 69.000 322.000
Deal Size (scaled) 7,422 0.410 0.686 0.061 0.162 0.435
Private Target 7,681 0.437 0.496 0.000 0.000 1.000
Friendly 7,681 0.963 0.188 1.000 1.000 1.000
Toehold 7,681 0.037 0.189 0.000 0.000 0.000
Tender 7,681 0.082 0.275 0.000 0.000 0.000
Large Deal 7,422 0.444 0.497 0.000 0.000 1.000
Multiple Bidder 7,681 0.041 0.197 0.000 0.000 0.000
Same Industry 7,681 0.637 0.481 0.000 1.000 1.000
Cash Only 7,681 0.369 0.482 0.000 0.000 1.000
Target Leverage 2,664 0.242 0.227 0.040 0.192 0.381
Target Altman's Z 1,940 3.467 5.057 1.485 2.870 4.609
Cost of Debt 3,666 1.876 1.248 0.750 1.750 2.750
Bank Density (200) 7,247 1.098 1.492 0.353 0.587 1.056
Bank Density (500) 7,247 1.058 0.973 0.398 0.717 1.381
Bank Density (1000) 7,247 1.109 0.752 0.508 0.831 1.692
Post FAS 7,681 0.188 0.391 0.000 0.000 0.000
Acquirer Volatility 7,471 0.030 0.020 0.017 0.025 0.037
Forecast Dispersion 4,518 0.005 0.017 0.000 0.001 0.002
Existing Loan 7,681 0.462 0.499 0.000 0.000 1.000
Acquirer-Lender Relation 745 0.370 0.483 0.000 0.000 1.000
Acquirer E-Index 2,477 2.387 1.565 1.000 2.000 4.000
Acquirer Dedicated IO 5,048 0.061 0.084 0.000 0.027 0.092
Target-Lender Relation 745 0.060 0.238 0.000 0.000 0.000
Maturity 633 4.874 1.883 4.003 5.003 6.005
1-year BHAR 6,745 -0.036 0.439 -0.291 -0.055 0.168
2-year BHAR 6,745 -0.071 0.657 -0.468 -0.114 0.237
3-year BHAR 6,436 -0.112 0.848 -0.631 -0.180 0.283

41
Table 3: Univariate analysis of acquirer CAR and loan financing This table presents mean-difference t-tests and non-parametric rank-sum tests of the relationship between loan financing and Acquirer CAR. We
present the tests using our full sample, a subsample that includes cash-only deals, and a matched sample formed using the propensity score matching
method. Propensity scores are calculated by estimating a probit regression of Loan Finance on several variables as specified in Appendix B. For
each loan-financed deal, we select one matched deal with the closest propensity matching score without replacement.
*, **, and *** indicate statistical significance at the 10%, 5%, and 1% levels, respectively.
Full Sample Cash Only M&A Deals Matched Sample
N Mean Median N Mean Median N Mean Median
Loan-financed Deals 745 0.022 0.013 390 0.029 0.019 722 0.023 0.013
Other Deals 6,936 0.011 0.003 2,441 0.009 0.005 722 0.009 0.002
Diff 0.011*** 0.010*** 0.020*** 0.014*** 0.014*** 0.012***
t-stat / z-stat (3.423) (4.262) (4.522) (5.179) (3.120) (3.453)

42
Table 4: Baseline multivariate analysis of acquirer CAR and loan financing This table presents the estimation results for the baseline multivariate analysis of the relation between acquirer CAR
and loan financing. In Panel A, the main independent variable is Loan Finance. In column (1) we only include the
main independent variable plus year and industry effects. Column (2) presents the baseline regression results with
all controls included. In column (3) we restrict the sample to cash-only deals and repeat the baseline regression.
Panel B is similar except that the main independent variable is Loan Finance Ratio. Industry and year fixed effects
are included in all regressions. Standard errors are clustered by industry. Absolute values of t-statistics are in
parentheses. *, **, and *** indicate statistical significance at the 10%, 5%, and 1% levels, respectively.
Panel A: Loan Finance Dummy as the key explanatory variable
Dependent variable: Acquirer CAR
(1) (2) (3)
Full Sample Full Sample Cash Only
Loan Finance 0.010** 0.013*** 0.012**
(2.12) (2.86) (2.25)
Acquirer Size -0.006*** -0.005***
(7.21) (4.55)
Acquirer ROA -0.023** -0.013
(2.67) (1.08)
Acquirer Cash -0.004 -0.015*
(0.37) (1.77)
Acquirer Leverage 0.012* 0.010
(1.82) (1.59)
Acquirer Tobin Q 0.001 0.001
(0.79) (0.90)
Deal Size 0.004* 0.008*
(1.90) (1.81)
Private Target 0.008*** -0.004*
(5.79) (1.95)
Friendly 0.007*** 0.014***
(3.67) (2.90)
Tender 0.001 -0.002
(0.42) (0.39)
Multiple Bidder -0.007 -0.016**
(1.50) (2.73)
Same Industry -0.001 0.002
(0.32) (0.55)
Toehold -0.000 0.001
(0.05) (0.25)
Large Deal 0.003 0.010**
(0.80) (2.38)
Cash Only 0.006**
(2.48) Year Effects Yes Yes Yes
Industry Effects Yes Yes Yes
SE clustered by industry Yes Yes Yes
R2 0.03 0.06 0.09
N 7,681 7,213 2,692

43
Table 4 (continued)
Panel B: Loan Finance Ratio as the key explanatory variable
Dependent variable: Acquirer CAR
(1) (2) (3)
Full Sample Full Sample Cash Only
Loan Finance Ratio 0.014*** 0.016*** 0.014**
(3.05) (3.47) (2.42)
Acquirer Size -0.005*** -0.004***
(7.01) (4.51)
Acquirer ROA -0.023** -0.013
(2.67) (1.07)
Acquirer Cash -0.004 -0.015*
(0.35) (1.75)
Acquirer Leverage 0.012* 0.011
(1.84) (1.61)
Acquirer Tobin Q 0.001 0.001
(0.78) (0.86)
Deal Size 0.005* 0.008*
(1.99) (1.90)
Private Target 0.008*** -0.004**
(5.71) (2.05)
Friendly 0.009*** 0.016***
(4.26) (2.99)
Tender 0.001 -0.002
(0.26) (0.47)
Multiple Bidder -0.007 -0.016***
(1.60) (2.88)
Same Industry -0.001 0.002
(0.32) (0.55)
Toehold -0.000 0.001
(0.14) (0.15)
Large Deal 0.003 0.010**
(0.86) (2.34)
Cash Only 0.006** (2.44)
Year Effects Yes Yes Yes
Industry Effects Yes Yes Yes
SE clustered by industry Yes Yes Yes
R2 0.03 0.06 0.09
N 7,681 7,213 2,692

44
Table 5: Alternative explanations for the relationship between loan financing and acquirer CAR In Panel A of the table we analyze the relationship between Acquirer CAR and loan financing, controlling for bond
financing and change in the acquirer’s leverage. Bond Finance is a dummy variable equal to one if the acquirer
issues bonds to finance the deal and zero otherwise. ∆ Acquirer Leverage is the change in the acquirer’s financial
leverage from the last year before M&A announcement to the first year after the M&A completion. In Panel B, we
add target credit risk as an additional control. Panel C includes Cost of Debt as an additional control. In Panel D the
dependent variables are Offer Premium (column 1) and Target CAR (column 2). All other controls of the baseline
regression are included but not tabulated for brevity. Industry and year fixed effects are included in all regressions.
Standard errors are clustered by industry. Absolute values of t-statistics are in parentheses. *, **, and *** indicate
statistical significance at the 10%, 5%, and 1% levels, respectively.
Panel A: Controlling for bond financing and leverage effects
Dependent variable: Acquirer CAR
(1) (2) (3)
Loan Finance 0.013*** 0.012** 0.012**
(2.81) (2.52) (2.50)
Bond Finance 0.007 0.006
(0.92) (0.87)
∆ Acquirer Leverage 0.007 0.006
(0.50) (0.45)
Control variables Yes Yes Yes
Year & Industry Effects Yes Yes Yes
SE clustered by industry Yes Yes Yes
R2 0.06 0.06 0.06
N 7,213 7,048 7,048
Panel B: Controlling for target credit risk
Dependent variable: Acquirer CAR
(1) (2) (3)
Loan Finance 0.013** 0.012* 0.011*
(2.21) (1.90) (1.83)
Target Leverage 0.005 0.001
(0.92) (0.16)
Target Altman’s Z score -0.000 -0.000
(1.09) (1.15)
Control variables included Yes Yes Yes
Year Effects Yes Yes Yes
Industry Effects Yes Yes Yes
SE clustered by industry Yes Yes Yes
R2 0.11 0.12 0.12
N 2,567 1,891 1,890

45
Panel C: Controlling for acquirer cost of debt
Dependent Variable: Acquirer CAR
(1) (2)
Loan Finance 0.013* -0.000
(1.91) (0.03)
Cost of Debt 0.000 -0.001
(0.22) (0.81)
Loan Finance × Cost of Debt 0.007*
(1.79)
Control variables Yes Yes
Year & Industry Effects Yes Yes
SE clustered by industry Yes Yes
R2 0.07 0.07
N 3,541 3,541
Panel D: Determinants of offer premium and target CAR
Dependent variable: (1) (2)
Offer Premium Target CAR
Loan Finance 0.008 -0.001
(0.40) (0.12)
Control variables included Yes Yes
Year Effects Yes Yes
Industry Effects Yes Yes
SE clustered by industry Yes Yes
R2 0.10 0.17
N 2,680 2,528

46
Table 6: Instrumental variable analysis The table presents the results for the instrumental variable analyses on the relationship between loan financing and
Acquirer CAR based on the method in Wooldridge (2002). In the first stage, we regress Loan Finance on the
instrument and control variables in a probit regression. The instrument is the ratio of number of banks to number of
public firms (Bank Density) located within 200, 500 or 1000 kilometers of the acquirer’s headquarters. We use the
estimated probability from the first stage probit regression as an instrumental variable in the second stage regression
and report the results in Panel B. All controls of the baseline regression are included but not tabulated for brevity.
Industry and year fixed effects are included in all regressions. Standard errors are clustered by industry. Absolute
values of t-statistics are in parentheses. *, **, and *** indicate statistical significance at the 10%, 5%, and 1% levels,
respectively.
Panel A: First stage of instrumental variable analysis
Dependent Variable: Loan Finance
(1) (2) (3)
Bank Density (200 km) 0.032**
(2.33) Bank Density (500 km) 0.052**
(2.54) Bank Density (1000 km) 0.124***
(3.39)
Control variables included Yes Yes Yes
Year Effects Yes Yes Yes
Industry Effects Yes Yes Yes
Pseudo R2 0.25 0.25 0.25
N 6,832 6,832 6,832
First Stage F-statistic 9.37** 6.43** 11.50***
Panel B: Second stage of instrumental variable analysis
Dependent variable: Acquirer CAR
(1) (2) (3)
200 km 500 km 1000 km
Loan Finance 0.032** 0.028* 0.030**
(2.20) (1.91) (2.06)
Control variables included Yes Yes Yes
Year Effects Yes Yes Yes
Industry Effects Yes Yes Yes
R2 0.06 0.06 0.06
N 6,832 6,832 6,832

47
Table 7: The effect of FAS166/167 In Panel A the dependent variable is Acquirer CAR, and the key explanatory variables are Loan Finance, Post FAS
(a dummy variable equals to one for M&A deals announced in 2010 or later and zero otherwise), and their
interaction term. Column (1) presents the regression result using the full sample, column (2) presents the regression
result excluding M&As announced during the GFC period (2007–08), and column (3) presents the estimation result
using only one year before and one year after FAS 166/167. In Panel B we conduct placebo tests using two
arbitrarily selected event years. In regression (1), the placebo event is the beginning of 2012 and the sample is
restricted to M&As announced in 2011 (the year right before the placebo event) and 2012. In regression (2), the
placebo event is the beginning of 2006 and the sample is restricted to 2005 (the year right before the placebo event)
and 2006. All controls of the baseline regression are included but not tabulated for brevity. Industry and year fixed
effects are included in all regressions. Standard errors are clustered by industry. Absolute values of t-statistics are
in parentheses. *, **, and *** indicate statistical significance at the 10%, 5%, and 1% levels, respectively.
Panel A: The effect of FAS 166/167 on the relationship between loan financing and acquirer CAR
Dependent variable: Acquirer CAR
(1) (2) (3)
Full Sample Excluding GFC (2007–08) Restricted to 2009–10
Loan Finance 0.008 0.009* -0.041
(1.63) (1.70) (1.22)
Post FAS 0.009 0.008 -0.007
(0.95) (0.93) (0.69)
Loan Finance × Post FAS 0.025** 0.023** 0.080**
(2.71) (2.51) (2.31)
Control variables included Yes Yes Yes
Year Effects Yes Yes Yes
Industry Effects Yes Yes Yes
SE clustered by industry Yes Yes Yes
R2 0.07 0.07 0.24
N 7,213 6,653 342
Panel B: Placebo tests
Dependent variable: Acquirer CAR
(1) (2)
Restricted to 2011–12 Restricted to 2005–06
Loan Finance 0.021 0.024*
(0.86) (1.92)
Post 2011 0.008
(1.25) Loan Finance × Post 2011 0.017
(0.48) Post 2005 0.007
(1.20)
Loan Finance × Post 2005 -0.004
(0.30)
Control variables included Yes Yes
Year Effects Yes Yes
Industry Effects Yes Yes
SE clustered by industry Yes Yes
R2 0.16 0.15
N 389 673

48
Table 8: Persistence in lead lender’s performance The table presents the results on whether lead lenders’ performance is persistent overtime. At the beginning of each
year, we calculate each lead lender’s past and future performances using the average acquirers’ abnormal
announcement returns of M&A deals financed by the lead lender over the past 1, 2 and 3 years and over the future
1, 2 and 3 years, respectively. In Panel A, B and C, we sort the lead lenders into quartiles by their 1, 2 and 3-year
past performances, respectively. Then we report the average 1, 2 and 3-year future performances of the quartiles,
and conduct mean-difference t-tests between the top and bottom quartiles. Absolute values of t-statistics are in
parentheses. *, **, and *** indicate statistical significance at the 10%, 5%, and 1% levels, respectively.
Panel A: Lender past performance measured over past 1 year
Past performance quartiles
Lender future performance measured over
N 1 year 2 years 3 years
Q 1 69 0.020 0.015 0.017
Q 2 69 0.013 0.017 0.025
Q 3 69 0.026 0.027 0.027
Q 4 69 0.047 0.044 0.043
(4) - (1) 0.028* 0.029** 0.026**
t-value (1.92) (2.19) (2.06)
Panel B: Lender past performance measured over past 2 years
Past performance quartiles
Lender future performance measured over
N 1 year 2 years 3 years
Q 1 88 0.010 0.013 0.015
Q 2 88 0.012 0.013 0.014
Q 3 88 0.023 0.029 0.032
Q 4 88 0.037 0.030 0.029
(4) - (1) 0.027** 0.017* 0.014
t-value (2.44) (1.71) (1.54)
Panel C: Lender past performance measured over past 3 years
Past performance quartiles
Lender future performance measured over
N 1 year 2 years 3 years
Q 1 94 0.012 0.016 0.017
Q 2 94 0.020 0.019 0.018
Q 3 94 0.023 0.026 0.029
Q 4 94 0.034 0.029 0.030
(4) - (1) 0.022* 0.014 0.014
t-value (1.91) (1.37) (1.41)
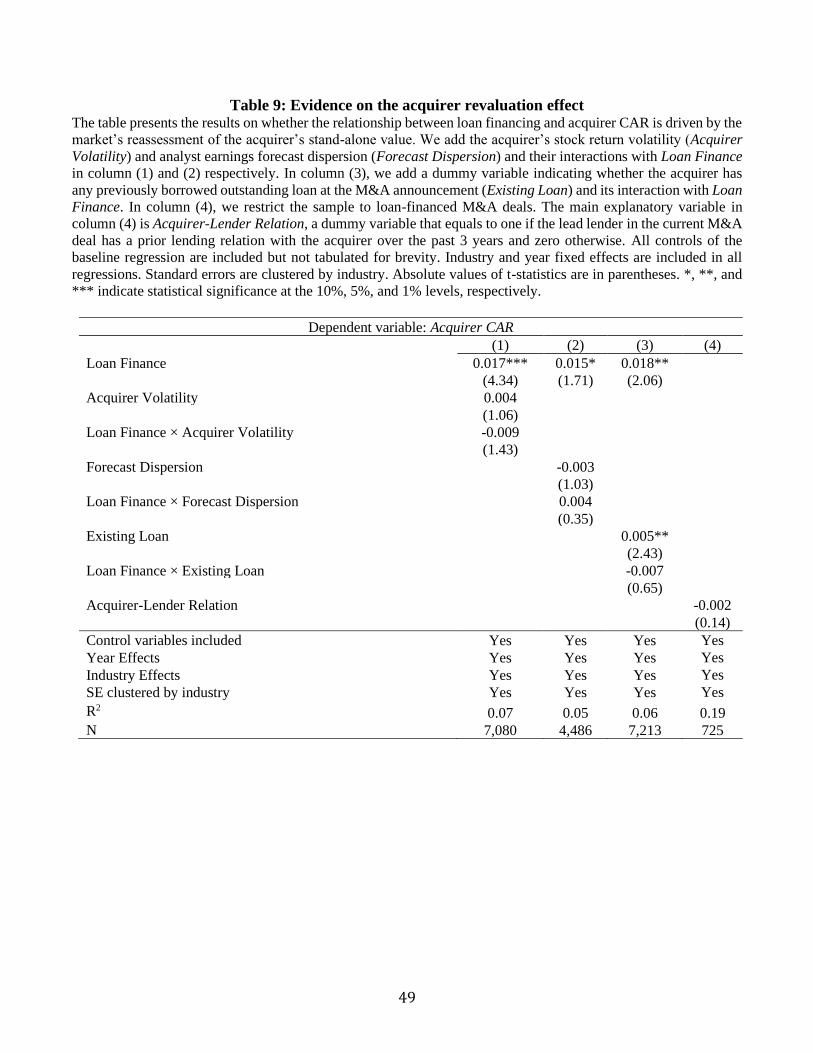
49
Table 9: Evidence on the acquirer revaluation effect The table presents the results on whether the relationship between loan financing and acquirer CAR is driven by the
market’s reassessment of the acquirer’s stand-alone value. We add the acquirer’s stock return volatility (Acquirer
Volatility) and analyst earnings forecast dispersion (Forecast Dispersion) and their interactions with Loan Finance
in column (1) and (2) respectively. In column (3), we add a dummy variable indicating whether the acquirer has
any previously borrowed outstanding loan at the M&A announcement (Existing Loan) and its interaction with Loan
Finance. In column (4), we restrict the sample to loan-financed M&A deals. The main explanatory variable in
column (4) is Acquirer-Lender Relation, a dummy variable that equals to one if the lead lender in the current M&A
deal has a prior lending relation with the acquirer over the past 3 years and zero otherwise. All controls of the
baseline regression are included but not tabulated for brevity. Industry and year fixed effects are included in all
regressions. Standard errors are clustered by industry. Absolute values of t-statistics are in parentheses. *, **, and
*** indicate statistical significance at the 10%, 5%, and 1% levels, respectively.
Dependent variable: Acquirer CAR
(1) (2) (3) (4)
Loan Finance 0.017*** 0.015* 0.018**
(4.34) (1.71) (2.06) Acquirer Volatility 0.004
(1.06) Loan Finance × Acquirer Volatility -0.009
(1.43) Forecast Dispersion -0.003
(1.03) Loan Finance × Forecast Dispersion 0.004
(0.35) Existing Loan 0.005**
(2.43) Loan Finance × Existing Loan -0.007
(0.65) Acquirer-Lender Relation -0.002
(0.14)
Control variables included Yes Yes Yes Yes
Year Effects Yes Yes Yes Yes
Industry Effects Yes Yes Yes Yes
SE clustered by industry Yes Yes Yes Yes
R2 0.07 0.05 0.06 0.19
N 7,080 4,486 7,213 725
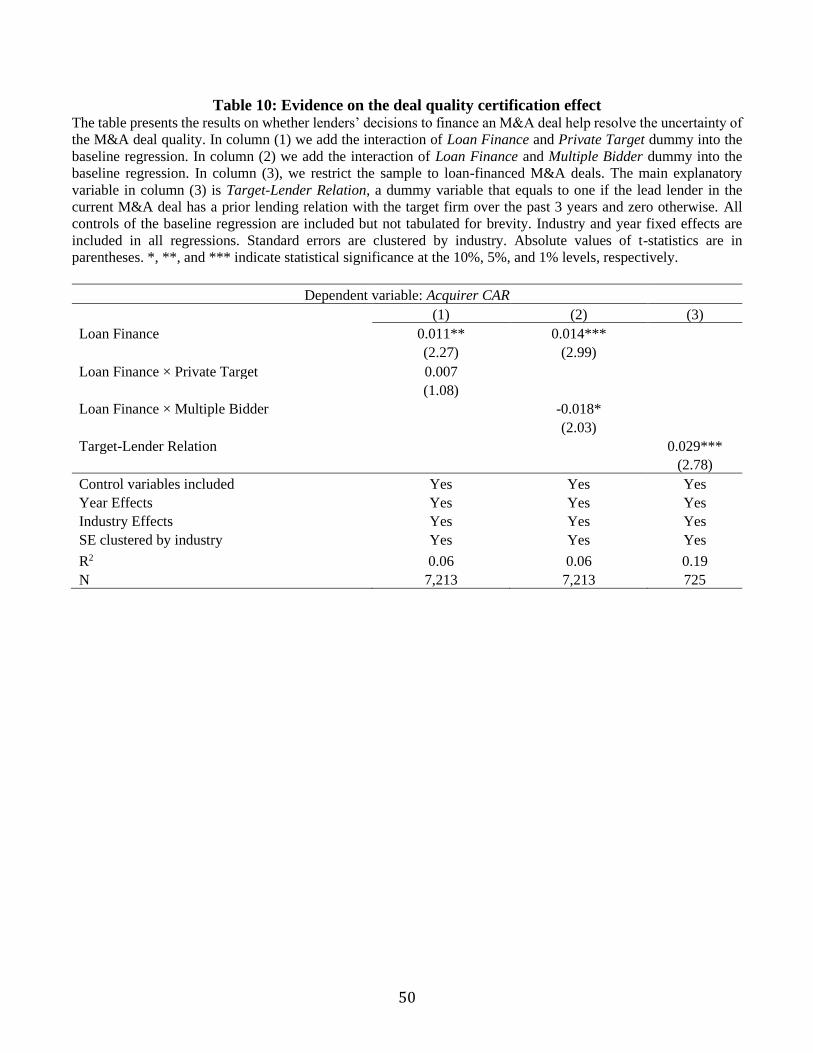
50
Table 10: Evidence on the deal quality certification effect The table presents the results on whether lenders’ decisions to finance an M&A deal help resolve the uncertainty of
the M&A deal quality. In column (1) we add the interaction of Loan Finance and Private Target dummy into the
baseline regression. In column (2) we add the interaction of Loan Finance and Multiple Bidder dummy into the
baseline regression. In column (3), we restrict the sample to loan-financed M&A deals. The main explanatory
variable in column (3) is Target-Lender Relation, a dummy variable that equals to one if the lead lender in the
current M&A deal has a prior lending relation with the target firm over the past 3 years and zero otherwise. All
controls of the baseline regression are included but not tabulated for brevity. Industry and year fixed effects are
included in all regressions. Standard errors are clustered by industry. Absolute values of t-statistics are in
parentheses. *, **, and *** indicate statistical significance at the 10%, 5%, and 1% levels, respectively.
Dependent variable: Acquirer CAR
(1) (2) (3)
Loan Finance 0.011** 0.014***
(2.27) (2.99) Loan Finance × Private Target 0.007
(1.08) Loan Finance × Multiple Bidder -0.018*
(2.03) Target-Lender Relation 0.029***
(2.78)
Control variables included Yes Yes Yes
Year Effects Yes Yes Yes
Industry Effects Yes Yes Yes
SE clustered by industry Yes Yes Yes
R2 0.06 0.06 0.19
N 7,213 7,213 725
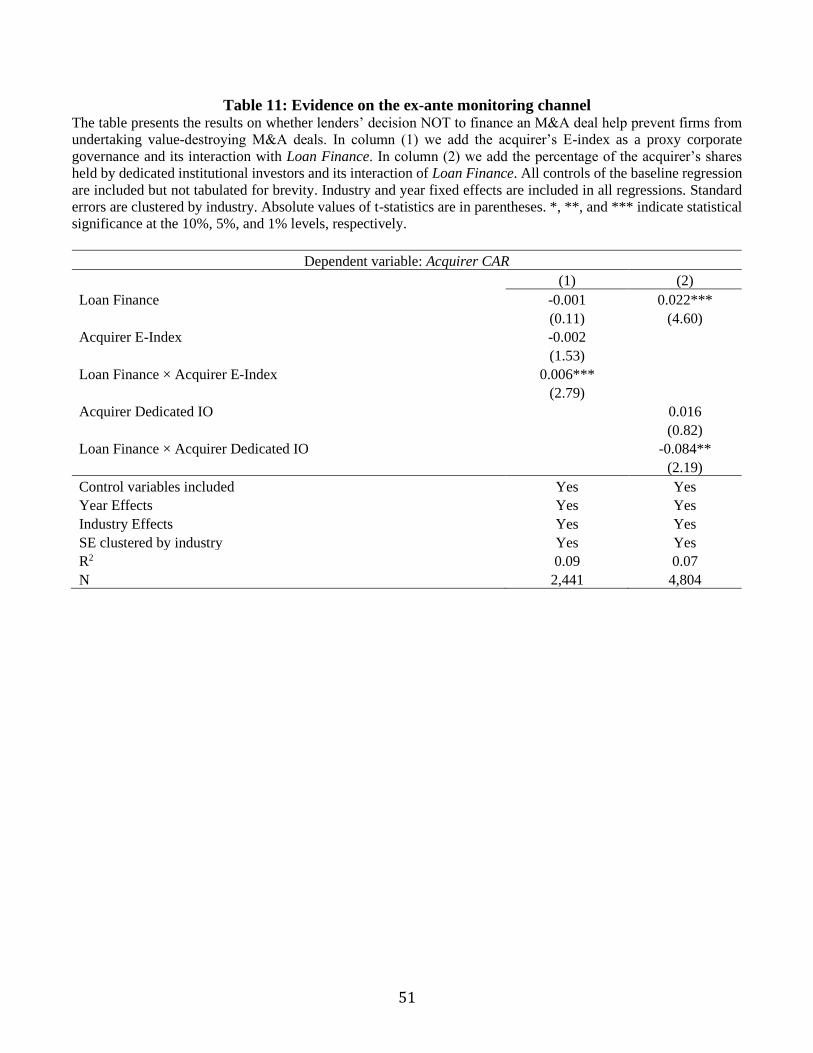
51
Table 11: Evidence on the ex-ante monitoring channel The table presents the results on whether lenders’ decision NOT to finance an M&A deal help prevent firms from
undertaking value-destroying M&A deals. In column (1) we add the acquirer’s E-index as a proxy corporate
governance and its interaction with Loan Finance. In column (2) we add the percentage of the acquirer’s shares
held by dedicated institutional investors and its interaction of Loan Finance. All controls of the baseline regression
are included but not tabulated for brevity. Industry and year fixed effects are included in all regressions. Standard
errors are clustered by industry. Absolute values of t-statistics are in parentheses. *, **, and *** indicate statistical
significance at the 10%, 5%, and 1% levels, respectively.
Dependent variable: Acquirer CAR
(1) (2)
Loan Finance -0.001 0.022***
(0.11) (4.60)
Acquirer E-Index -0.002
(1.53) Loan Finance × Acquirer E-Index 0.006***
(2.79) Acquirer Dedicated IO 0.016
(0.82)
Loan Finance × Acquirer Dedicated IO -0.084**
(2.19)
Control variables included Yes Yes
Year Effects Yes Yes
Industry Effects Yes Yes
SE clustered by industry Yes Yes
R2 0.09 0.07
N 2,441 4,804

52
Table 12: Evidence on the ex-post monitoring channel The table presents the results on whether lenders’ ex-post monitoring of the term of the loan create a positive
spillover to acquirer shareholders. In Panel A of this table, we sort loan-financed M&A deals into terciles by the
term to maturity of the loan for M&A financing. We create a dummy for each of the tercile group. Then we replace
Loan Finance with the 3 dummies as the main explanatory variables in the baseline regression. In Panel B the
dependent variables are acquirer buy-and-hold abnormal returns over 1, 2 and 3 years after M&A announcement.
All controls of the baseline regression are included but not tabulated for brevity. Industry and year fixed effects are
included in all regressions. Standard errors are clustered by industry. Absolute values of t-statistics are in
parentheses. *, **, and *** indicate statistical significance at the 10%, 5%, and 1% levels, respectively.
Panel A: Loan maturity and acquirer CAR
Dependent variable: Acquirer CAR
Loan Finance (short maturity) 0.010
(1.39)
Loan Finance (medium maturity) 0.009
(1.51)
Loan Finance (long maturity) 0.021***
(2.89)
Control variables included Yes
Year Effects Yes
Industry Effects Yes
SE clustered by industry Yes
R2 0.06
N 7,102
Panel B: Acquirer long-term buy-and-hold abnormal returns
(1) (2) (3)
Dependent variable: 1-year BHAR 2-year BHAR 3-year BHAR
Loan Finance 0.014 0.019 0.066*
(0.61) (0.58) (1.72)
Control variables included Yes Yes Yes
Year Effects Yes Yes Yes
Industry Effects Yes Yes Yes
SE clustered by industry Yes Yes Yes
R2 0.04 0.10 0.14
N 6,580 6,580 6,273