lens design techniques to improve satisfaction in free ... · visual exams consisted of a detailed...
TRANSCRIPT
Case ReportVolume 6 Issue 3 - February 2018DOI: 10.19080/JOJO.2018.06.555688
JOJ OphthalCopyright © All rights are reserved by Eva Chamorro
Lens Design Techniques to Improve Satisfaction in Free-Form Progressive Addition Lens Users
Eva Chamorro*, Jose Miguel Cleva, Pablo Concepción, Melisa S Subero and José AlonsoIndizen Optical Technologies, Spain
Submission: January 28, 2018; Published: February 15, 2018
*Corresponding author: Eva Chamorro, Indizen Optical Technologies, C/ Santa Engracia, 6 1º, 28010 Madrid España, Tel: 91-8333786, Email:
JOJ Ophthal 6(3) JOJO.MS.ID.555688 (2018) 001
Introduction
The introduction of Free-Form technology has brought new ways of calculating progressive lens designs, offering a wider range of lenses using different design technologies. Before the appearance of Free-Form, conventional progressive addition lenses were produced by molding and fixing the lens design on the front surface of the lens, which limited the types of designs that could be offered using conventional technology. Also, in the laboratory, conventional production requires keeping a large inventory of semi-finished blanks to support the different combinations of materials, base curves, additions, insets, progression lengths, etc. that are available. With Free-Form technology the back surface of the lens can be generated point-by-point allowing the generation of arbitrary surfaces. Thus, using this production technology allows the design providers to calculate lenses based on the individual needs of each user [1].
In progressive lenses, the continuous increment of power from the top part of the lens used for far vision to the bottom part of the lens used for near vision introduces unwanted astigmatism as explained by the Minkwitz theorem [2]. Although this lateral astigmatism cannot be avoided, it can be distributed in the lateral parts of the lenses according to some geometric rules. The main goal of lens designers is to use this flexibility to improve visual quality, ease of adaptation, etc., or in other words, improve the overall satisfaction of the user.
One of the most well-known ways to improve the experience of users when using their lenses is to personalize the lens according to the actual position of wear parameters for the real frame. The parameters usually considered are pantoscopic tilt, wrapping angle and back vertex distance among others [3-5]. Apart from this personalization calculation, there are other ways
Abstract
Purpose: The goal of this study is to analyze the impact of different techniques for designing Free-Form progressive addition lenses in the overall satisfaction of users. Personalization of Free-Form lenses according to personalization parameters, variations in the characteristics of the base curve and differences in mean power in the lateral areas of the progressive lens were analyzed.
Material and Methods: A comparative study comprised of 3 phases was done to determine differences between 3 pairs of Free-Form progressive lenses: Lens 1A-Basic (non-personalized) & Lens 1B-DRP (personalized), Lens 2A-Spherical (spherical base curve) & Lens 2B-Camber (variable base curve) and Lens 3A-Standard (positive mean power in lateral areas) & Lens 3B-Steady (null mean power in lateral areas). In each phase, a theoretical analysis was carried out of the power distribution maps of the progressive addition lenses based on a model of the lens-eye system to calculating the exact ray tracing for the real positions of wear. Also, a double-blind wearer trial was done in which a group of subjects tested each design for 7 days and rated their general comfort and preference while performing their daily activities.
Results: Theoretical analysis for lenses 1A-Basic and Lens 1B-DRP showed some differences in the values of unwanted astigmatism in the lateral areas of the lenses. When subjects compared the lenses, a clear preference for Lens 1B-DRP was observed: 63% of the users selected the lens 1B-DRP compared to 20% who selected Lens 1A-Basic (p=0.0001). For lenses 2A-Spherical and lenses 2B-Camber, power distribution maps showed identical power distribution maps. However, subjects significantly preferred lens 2B-Camber: 62% preferred the lens 2B-Camber against the 33% who selected the lens 2A-Spherical (p=0.03). Lenses 3A-Standard and 3B-Steady presented similar Sheedy contours for spherical and cylindrical power but vary in mean power in the lateral areas of the lens. Wearer trial results showed that 53% of users preferred Lenses 3B-Steady against 33% of user who preferred Lenses 3A-Standard.
Conclusions: Personalization of Free-Form lenses according to personalization parameters, the use of a variable base curve that increases in curvature from the top to the bottom of the lens and control of mean power in the lateral areas of the progressive lens are good and valid techniques to improve general satisfaction of Free-Form progressive addition lenses users.
Keywords: Free-Form; Progressive addition lenses; Personalization, Variable base curve; Mean power; User power
How to cite this article: Eva Chamorro, Jose Miguel Cleva, Pablo Concepción, Melisa S Subero, José Alonso. Lens Design Techniques to Improve Satisfaction in Free-Form Progressive Addition Lens Users. JOJ Ophthal. 2018; 6(3) : 555688. DOI: 10.19080/JOJO.2018.06.555688002
JOJ Ophthalmology
to improve the satisfaction of users such as the use of variable base curves, controlling the mean sphere distribution of the lens in the lateral parts of the lens, etc. The goal of this study is to analyze the impact of these design techniques in the overall satisfaction of users when using Free-Form progressive lenses including the previously mentioned design technologies.
Material and Methods
Study design
The study is made up of 3 phases in which the different characteristics of progressive lens designs are evaluated. In the first phase, the effect of lens personalization according to position of wear is evaluated, the second phase analyzes the benefits of a variable base curve selection in a progressive lens and the third phase studies the effect of spherical power in the lateral areas of the lens. In each phase, a theoretical analysis of the power distribution maps of the progressive lenses was done. Also, a double blind, observational, comparative and prospective clinical study was carried out to evaluate the general satisfaction and user preference. The study was approved by the Hospital Clínico San Carlos Ethics Committee (Madrid, Spain). All subjects signed the informed consent according to Helsinki declaration.
Tested lenses
2 Free-Form progressive addition lenses were tested in each phase: Lenses 1A-Basic and 1B-DRP were compared in phase 1; lenses 2A-Spherical and 2B-Camber were tested in Phase 2; and
lenses 3A-Standard and 3B-Steady were tested in Phase 3. Each lens design was designed ad-hoc by Indizen Optical Technologies (IOT, Spain) with the following characteristics:
Phase 1: 2 Free-Form progressive addition lenses, 1A-Basic and 1B-DRP, were created to evaluate the effect of personalization according to position of wear in the user satisfaction. Both lenses presented spherical base curves and had similar power distribution maps. However, they were calculated using different optimization methods for reducing oblique aberrations. Lens 1A-Basic was optimized using a basic merit function that does not consider the individual personal parameters of the user. Lens 1B-DRP was optimized using the technology Digital Ray-Path® (IOT, Spain) that personalizes the lens considering the position of wear of the frames according to parameters such as pantoscopic angle, wrap angle and back vertex distance.
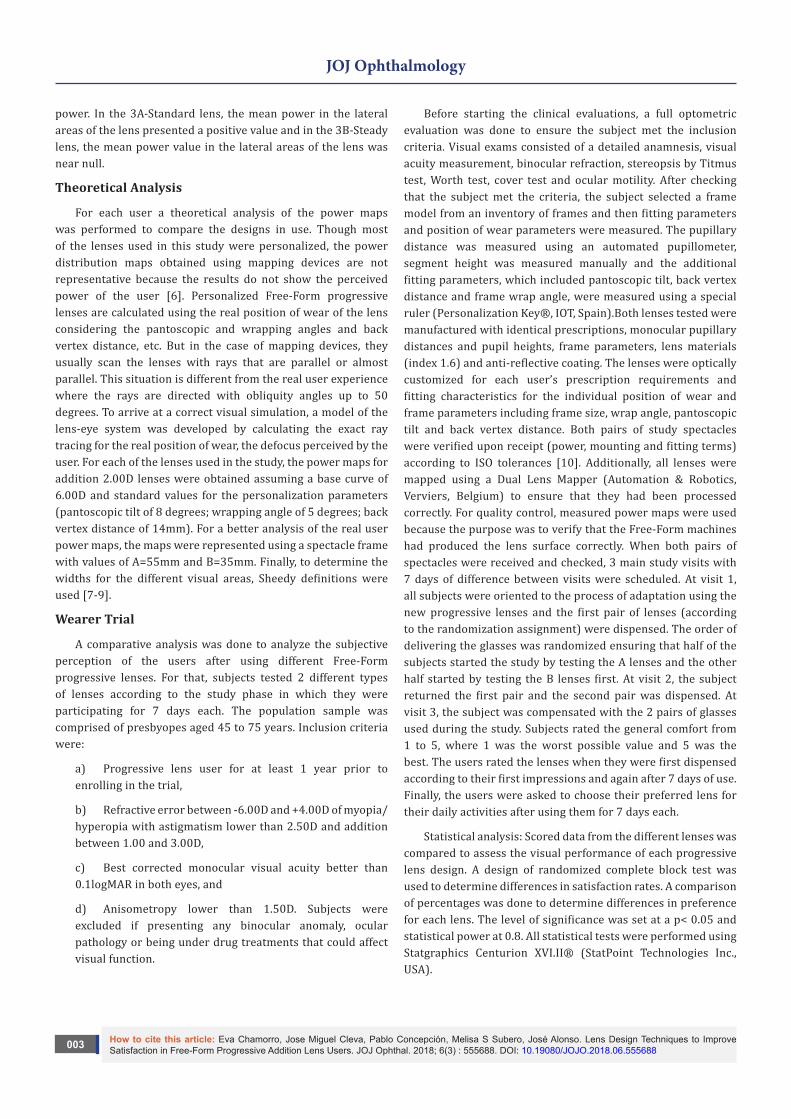
Phase 2: Lenses 2A-Spherical and 2B-Camber were developed to determine the influence of base curve variations in the user visual perception. Both lenses were Free-Form personalized progressive lenses optimized by Digital Ray-Path technology. The lenses presented the same power distribution but were produced using different base curve characteristics. Lens 2A-Spherical was calculated using a simple spherical base curve. Lens 2B-Camber was calculated using a variable base curve semi-finished blank that increased in curvature from the top to the bottom of the lens (Camber®, Younger Optics, USA). In Figure 1, the differences can be seen between both frontal surfaces of the Phase 2 lenses.
Figure 1: Power distribution maps of the frontal surface of a lens with a spherical base curve having constant curvature (left) and a variable base curve that increases the curvature from the top to the bottom of the lens (Camber®, YoungerOptics, USA). Lenses 1A, 1B and 2A from this study were designed with spherical base curves and lenses 2B, 3A and 3B have variable base curves.
Phase 3: 2 Free-Form personalized lenses, 3A-Standard and 3B-Steady, with Digital Ray-Path® technology and calculated with a variable base curve were created to evaluate the effects of
mean power in the lateral areas of the lens. A merit function was used to calculate both lenses to try to get the same distribution of lateral astigmatism but showed variations in the spherical
How to cite this article: Eva Chamorro, Jose Miguel Cleva, Pablo Concepción, Melisa S Subero, José Alonso. Lens Design Techniques to Improve Satisfaction in Free-Form Progressive Addition Lens Users. JOJ Ophthal. 2018; 6(3) : 555688. DOI: 10.19080/JOJO.2018.06.555688003
JOJ Ophthalmology
power. In the 3A-Standard lens, the mean power in the lateral areas of the lens presented a positive value and in the 3B-Steady lens, the mean power value in the lateral areas of the lens was near null.
Theoretical Analysis
For each user a theoretical analysis of the power maps was performed to compare the designs in use. Though most of the lenses used in this study were personalized, the power distribution maps obtained using mapping devices are not representative because the results do not show the perceived power of the user [6]. Personalized Free-Form progressive lenses are calculated using the real position of wear of the lens considering the pantoscopic and wrapping angles and back vertex distance, etc. But in the case of mapping devices, they usually scan the lenses with rays that are parallel or almost parallel. This situation is different from the real user experience where the rays are directed with obliquity angles up to 50 degrees. To arrive at a correct visual simulation, a model of the lens-eye system was developed by calculating the exact ray tracing for the real position of wear, the defocus perceived by the user. For each of the lenses used in the study, the power maps for addition 2.00D lenses were obtained assuming a base curve of 6.00D and standard values for the personalization parameters (pantoscopic tilt of 8 degrees; wrapping angle of 5 degrees; back vertex distance of 14mm). For a better analysis of the real user power maps, the maps were represented using a spectacle frame with values of A=55mm and B=35mm. Finally, to determine the widths for the different visual areas, Sheedy definitions were used [7-9].
Wearer Trial
A comparative analysis was done to analyze the subjective perception of the users after using different Free-Form progressive lenses. For that, subjects tested 2 different types of lenses according to the study phase in which they were participating for 7 days each. The population sample was comprised of presbyopes aged 45 to 75 years. Inclusion criteria were:
a) Progressive lens user for at least 1 year prior to enrolling in the trial,
b) Refractive error between -6.00D and +4.00D of myopia/hyperopia with astigmatism lower than 2.50D and addition between 1.00 and 3.00D,
c) Best corrected monocular visual acuity better than 0.1logMAR in both eyes, and
d) Anisometropy lower than 1.50D. Subjects were excluded if presenting any binocular anomaly, ocular pathology or being under drug treatments that could affect visual function.
Before starting the clinical evaluations, a full optometric evaluation was done to ensure the subject met the inclusion criteria. Visual exams consisted of a detailed anamnesis, visual acuity measurement, binocular refraction, stereopsis by Titmus test, Worth test, cover test and ocular motility. After checking that the subject met the criteria, the subject selected a frame model from an inventory of frames and then fitting parameters and position of wear parameters were measured. The pupillary distance was measured using an automated pupillometer, segment height was measured manually and the additional fitting parameters, which included pantoscopic tilt, back vertex distance and frame wrap angle, were measured using a special ruler (Personalization Key®, IOT, Spain).Both lenses tested were manufactured with identical prescriptions, monocular pupillary distances and pupil heights, frame parameters, lens materials (index 1.6) and anti-reflective coating. The lenses were optically customized for each user’s prescription requirements and fitting characteristics for the individual position of wear and frame parameters including frame size, wrap angle, pantoscopic tilt and back vertex distance. Both pairs of study spectacles were verified upon receipt (power, mounting and fitting terms) according to ISO tolerances [10]. Additionally, all lenses were mapped using a Dual Lens Mapper (Automation & Robotics, Verviers, Belgium) to ensure that they had been processed correctly. For quality control, measured power maps were used because the purpose was to verify that the Free-Form machines had produced the lens surface correctly. When both pairs of spectacles were received and checked, 3 main study visits with 7 days of difference between visits were scheduled. At visit 1, all subjects were oriented to the process of adaptation using the new progressive lenses and the first pair of lenses (according to the randomization assignment) were dispensed. The order of delivering the glasses was randomized ensuring that half of the subjects started the study by testing the A lenses and the other half started by testing the B lenses first. At visit 2, the subject returned the first pair and the second pair was dispensed. At visit 3, the subject was compensated with the 2 pairs of glasses used during the study. Subjects rated the general comfort from 1 to 5, where 1 was the worst possible value and 5 was the best. The users rated the lenses when they were first dispensed according to their first impressions and again after 7 days of use. Finally, the users were asked to choose their preferred lens for their daily activities after using them for 7 days each.
Statistical analysis: Scored data from the different lenses was compared to assess the visual performance of each progressive lens design. A design of randomized complete block test was used to determine differences in satisfaction rates. A comparison of percentages was done to determine differences in preference for each lens. The level of significance was set at a p< 0.05 and statistical power at 0.8. All statistical tests were performed using Statgraphics Centurion XVI.II® (StatPoint Technologies Inc., USA).
How to cite this article: Eva Chamorro, Jose Miguel Cleva, Pablo Concepción, Melisa S Subero, José Alonso. Lens Design Techniques to Improve Satisfaction in Free-Form Progressive Addition Lens Users. JOJ Ophthal. 2018; 6(3) : 555688. DOI: 10.19080/JOJO.2018.06.555688004
JOJ Ophthalmology
Results
Sample characteristics
The sample population was comprised of a total of 96 subjects. Thirty subjects participated in phase 1 testing of lenses 1A and 1B (18 men and 12 women, aged 48 to 71 years old). Twenty-one subjects participated in phase 2 testing of lenses 2A and 2B (6 men and 15 women, aged 50 to 63 years old). Forty-five subjects participated in phase 3 testing of lenses 3A and 3B (23 men and 22 women, aged 47 to 68 years old).
Phase 1: Lens Personalization Analysis
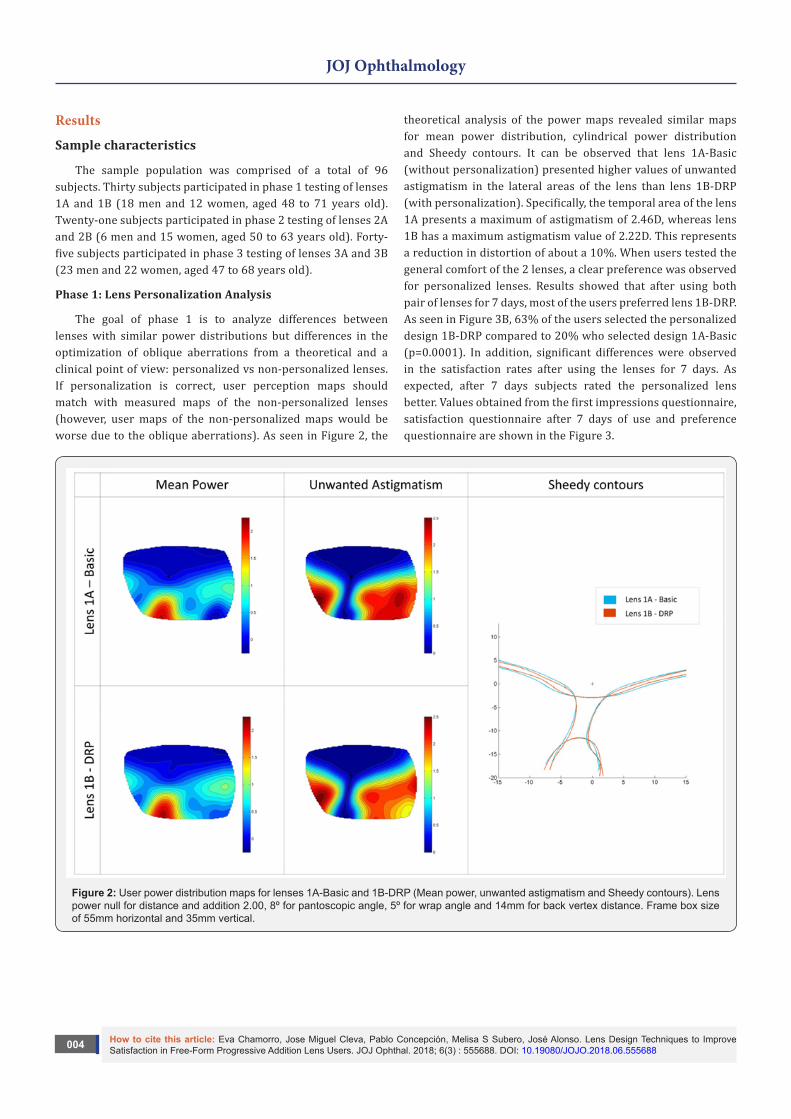
The goal of phase 1 is to analyze differences between lenses with similar power distributions but differences in the optimization of oblique aberrations from a theoretical and a clinical point of view: personalized vs non-personalized lenses. If personalization is correct, user perception maps should match with measured maps of the non-personalized lenses (however, user maps of the non-personalized maps would be worse due to the oblique aberrations). As seen in Figure 2, the
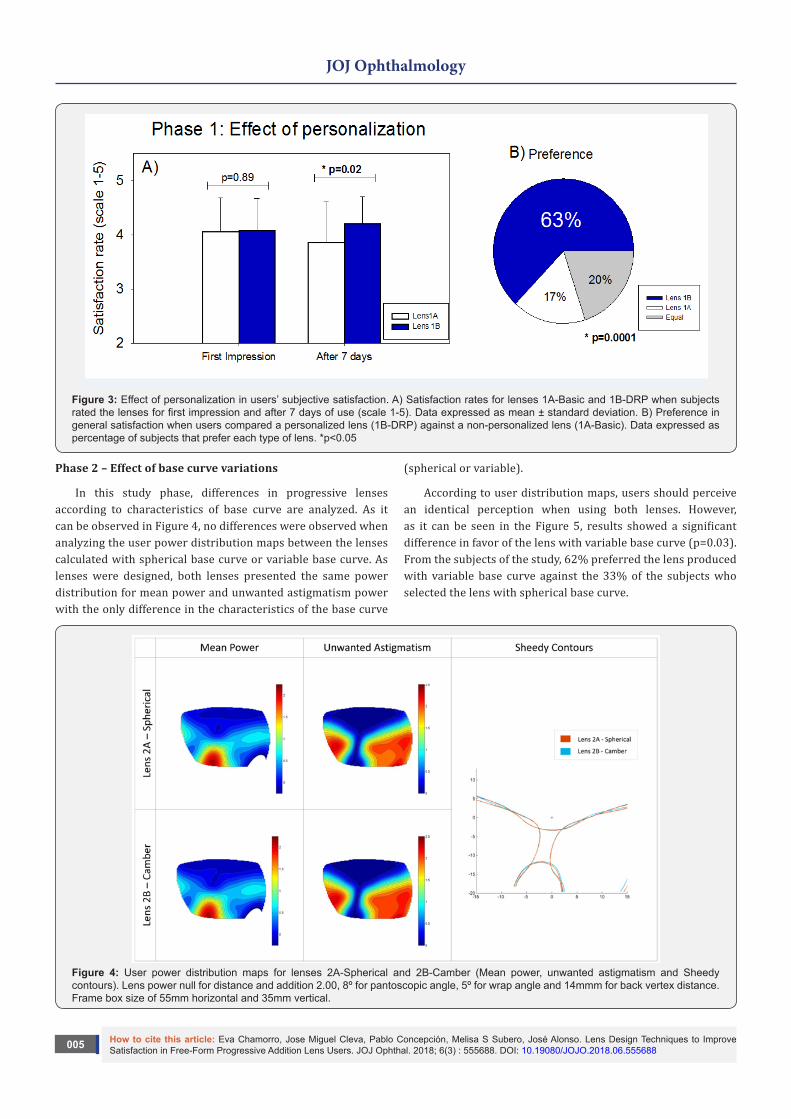
theoretical analysis of the power maps revealed similar maps for mean power distribution, cylindrical power distribution and Sheedy contours. It can be observed that lens 1A-Basic (without personalization) presented higher values of unwanted astigmatism in the lateral areas of the lens than lens 1B-DRP (with personalization). Specifically, the temporal area of the lens 1A presents a maximum of astigmatism of 2.46D, whereas lens 1B has a maximum astigmatism value of 2.22D. This represents a reduction in distortion of about a 10%. When users tested the general comfort of the 2 lenses, a clear preference was observed for personalized lenses. Results showed that after using both pair of lenses for 7 days, most of the users preferred lens 1B-DRP. As seen in Figure 3B, 63% of the users selected the personalized design 1B-DRP compared to 20% who selected design 1A-Basic (p=0.0001). In addition, significant differences were observed in the satisfaction rates after using the lenses for 7 days. As expected, after 7 days subjects rated the personalized lens better. Values obtained from the first impressions questionnaire, satisfaction questionnaire after 7 days of use and preference questionnaire are shown in the Figure 3.
Figure 2: User power distribution maps for lenses 1A-Basic and 1B-DRP (Mean power, unwanted astigmatism and Sheedy contours). Lens power null for distance and addition 2.00, 8º for pantoscopic angle, 5º for wrap angle and 14mm for back vertex distance. Frame box size of 55mm horizontal and 35mm vertical.
How to cite this article: Eva Chamorro, Jose Miguel Cleva, Pablo Concepción, Melisa S Subero, José Alonso. Lens Design Techniques to Improve Satisfaction in Free-Form Progressive Addition Lens Users. JOJ Ophthal. 2018; 6(3) : 555688. DOI: 10.19080/JOJO.2018.06.555688005
JOJ Ophthalmology
Figure 3: Effect of personalization in users’ subjective satisfaction. A) Satisfaction rates for lenses 1A-Basic and 1B-DRP when subjects rated the lenses for first impression and after 7 days of use (scale 1-5). Data expressed as mean ± standard deviation. B) Preference in general satisfaction when users compared a personalized lens (1B-DRP) against a non-personalized lens (1A-Basic). Data expressed as percentage of subjects that prefer each type of lens. *p<0.05
Phase 2 – Effect of base curve variations
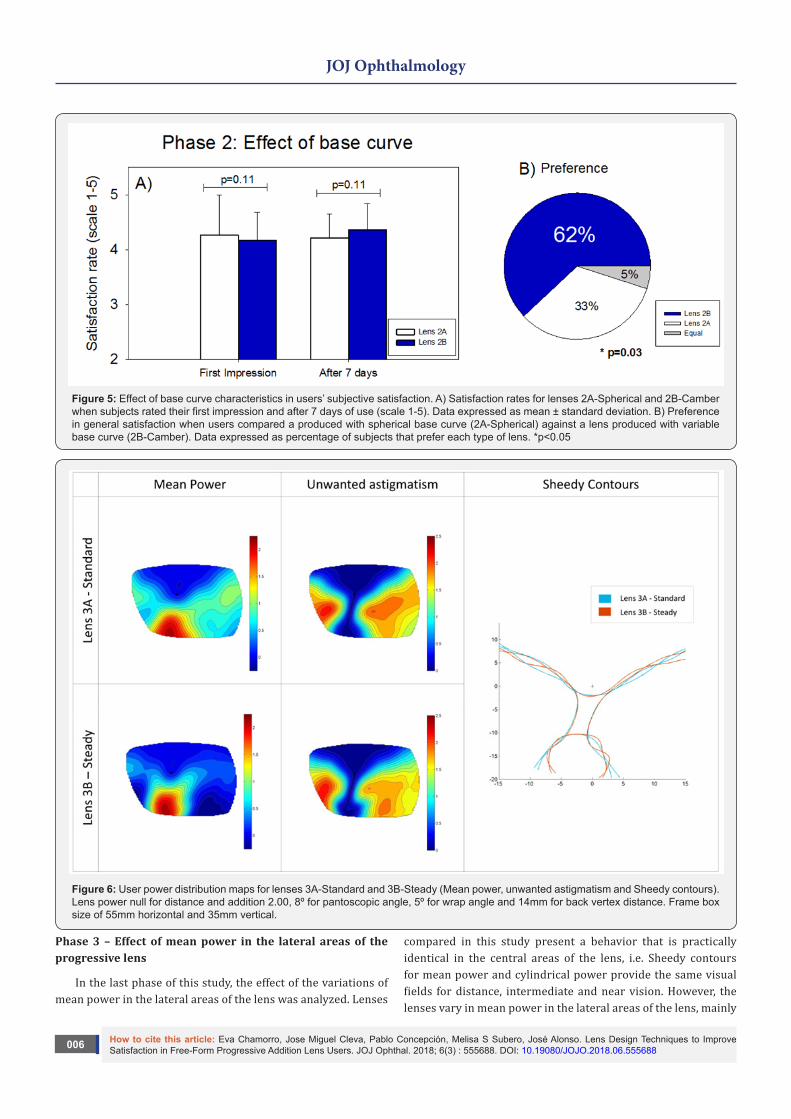
In this study phase, differences in progressive lenses according to characteristics of base curve are analyzed. As it can be observed in Figure 4, no differences were observed when analyzing the user power distribution maps between the lenses calculated with spherical base curve or variable base curve. As lenses were designed, both lenses presented the same power distribution for mean power and unwanted astigmatism power with the only difference in the characteristics of the base curve
(spherical or variable).
According to user distribution maps, users should perceive an identical perception when using both lenses. However, as it can be seen in the Figure 5, results showed a significant difference in favor of the lens with variable base curve (p=0.03). From the subjects of the study, 62% preferred the lens produced with variable base curve against the 33% of the subjects who selected the lens with spherical base curve.
Figure 4: User power distribution maps for lenses 2A-Spherical and 2B-Camber (Mean power, unwanted astigmatism and Sheedy contours). Lens power null for distance and addition 2.00, 8º for pantoscopic angle, 5º for wrap angle and 14mmm for back vertex distance. Frame box size of 55mm horizontal and 35mm vertical.
How to cite this article: Eva Chamorro, Jose Miguel Cleva, Pablo Concepción, Melisa S Subero, José Alonso. Lens Design Techniques to Improve Satisfaction in Free-Form Progressive Addition Lens Users. JOJ Ophthal. 2018; 6(3) : 555688. DOI: 10.19080/JOJO.2018.06.555688006
JOJ Ophthalmology
Figure 5: Effect of base curve characteristics in users’ subjective satisfaction. A) Satisfaction rates for lenses 2A-Spherical and 2B-Camber when subjects rated their first impression and after 7 days of use (scale 1-5). Data expressed as mean ± standard deviation. B) Preference in general satisfaction when users compared a produced with spherical base curve (2A-Spherical) against a lens produced with variable base curve (2B-Camber). Data expressed as percentage of subjects that prefer each type of lens. *p<0.05
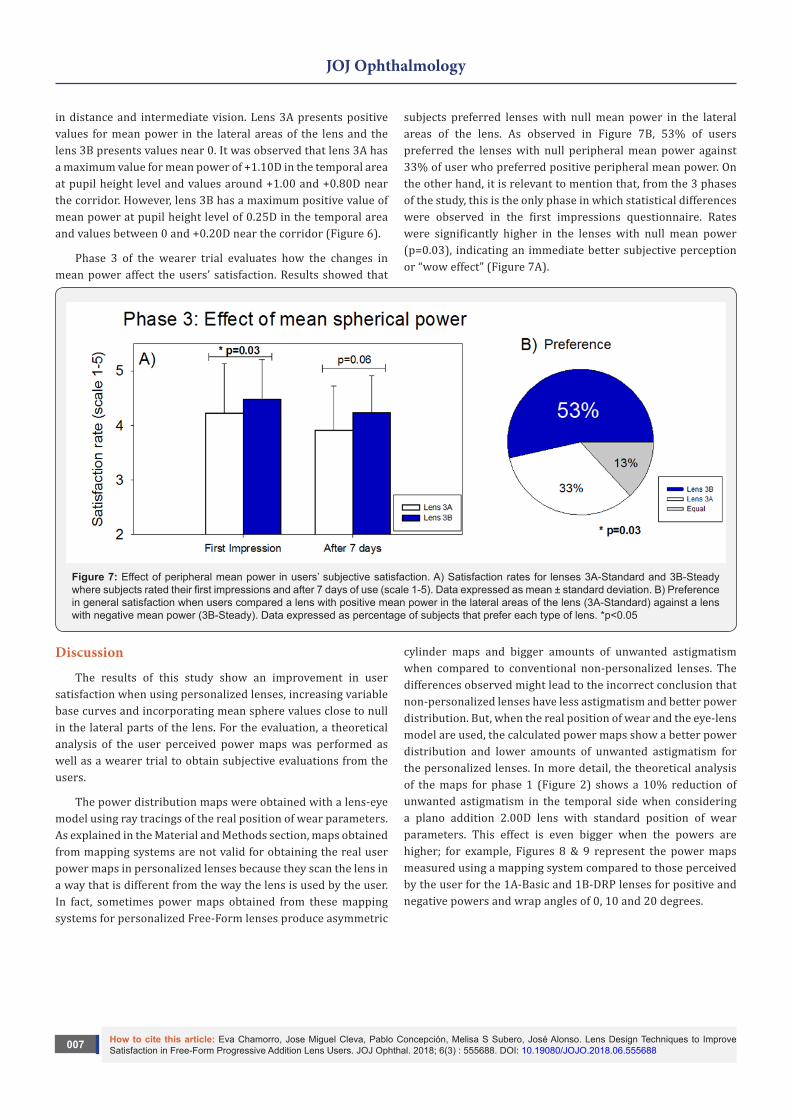
Figure 6: User power distribution maps for lenses 3A-Standard and 3B-Steady (Mean power, unwanted astigmatism and Sheedy contours). Lens power null for distance and addition 2.00, 8º for pantoscopic angle, 5º for wrap angle and 14mm for back vertex distance. Frame box size of 55mm horizontal and 35mm vertical.
Phase 3 – Effect of mean power in the lateral areas of the progressive lens
In the last phase of this study, the effect of the variations of mean power in the lateral areas of the lens was analyzed. Lenses
compared in this study present a behavior that is practically identical in the central areas of the lens, i.e. Sheedy contours for mean power and cylindrical power provide the same visual fields for distance, intermediate and near vision. However, the lenses vary in mean power in the lateral areas of the lens, mainly
How to cite this article: Eva Chamorro, Jose Miguel Cleva, Pablo Concepción, Melisa S Subero, José Alonso. Lens Design Techniques to Improve Satisfaction in Free-Form Progressive Addition Lens Users. JOJ Ophthal. 2018; 6(3) : 555688. DOI: 10.19080/JOJO.2018.06.555688007
JOJ Ophthalmology
in distance and intermediate vision. Lens 3A presents positive values for mean power in the lateral areas of the lens and the lens 3B presents values near 0. It was observed that lens 3A has a maximum value for mean power of +1.10D in the temporal area at pupil height level and values around +1.00 and +0.80D near the corridor. However, lens 3B has a maximum positive value of mean power at pupil height level of 0.25D in the temporal area and values between 0 and +0.20D near the corridor (Figure 6).
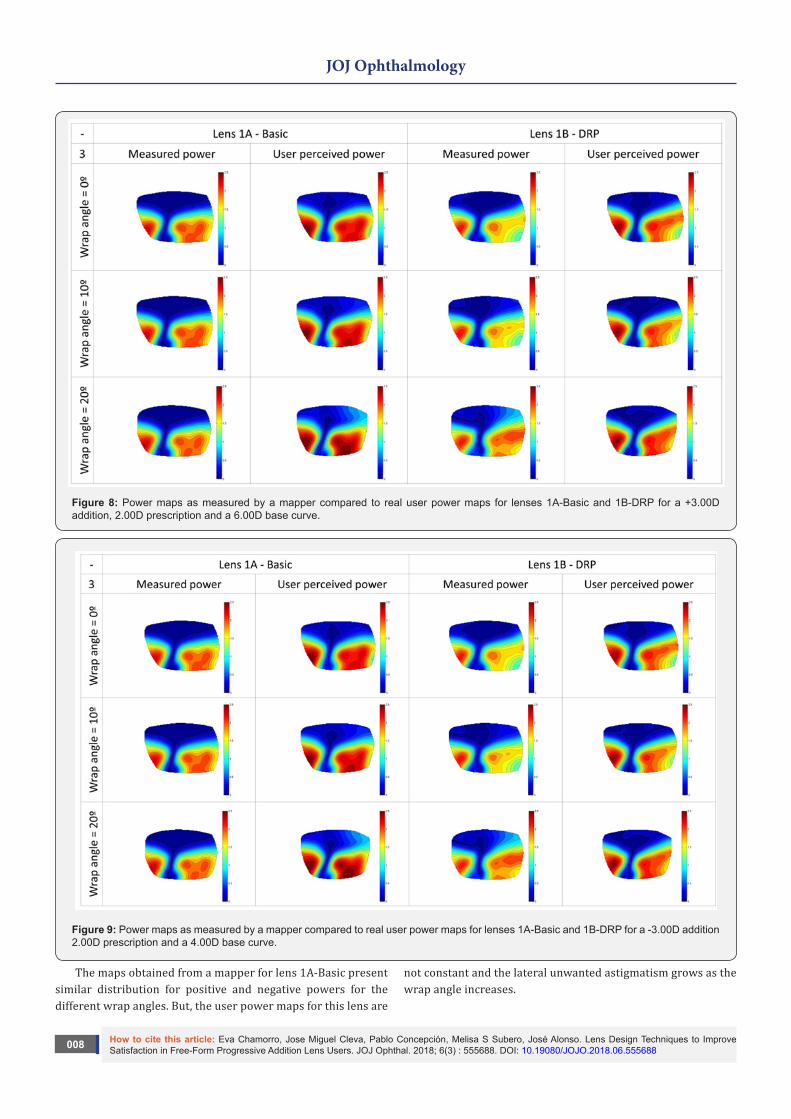
Phase 3 of the wearer trial evaluates how the changes in mean power affect the users’ satisfaction. Results showed that
subjects preferred lenses with null mean power in the lateral areas of the lens. As observed in Figure 7B, 53% of users preferred the lenses with null peripheral mean power against 33% of user who preferred positive peripheral mean power. On the other hand, it is relevant to mention that, from the 3 phases of the study, this is the only phase in which statistical differences were observed in the first impressions questionnaire. Rates were significantly higher in the lenses with null mean power (p=0.03), indicating an immediate better subjective perception or “wow effect” (Figure 7A).
Figure 7: Effect of peripheral mean power in users’ subjective satisfaction. A) Satisfaction rates for lenses 3A-Standard and 3B-Steady where subjects rated their first impressions and after 7 days of use (scale 1-5). Data expressed as mean ± standard deviation. B) Preference in general satisfaction when users compared a lens with positive mean power in the lateral areas of the lens (3A-Standard) against a lens with negative mean power (3B-Steady). Data expressed as percentage of subjects that prefer each type of lens. *p<0.05
Discussion
The results of this study show an improvement in user satisfaction when using personalized lenses, increasing variable base curves and incorporating mean sphere values close to null in the lateral parts of the lens. For the evaluation, a theoretical analysis of the user perceived power maps was performed as well as a wearer trial to obtain subjective evaluations from the users.
The power distribution maps were obtained with a lens-eye model using ray tracings of the real position of wear parameters. As explained in the Material and Methods section, maps obtained from mapping systems are not valid for obtaining the real user power maps in personalized lenses because they scan the lens in a way that is different from the way the lens is used by the user. In fact, sometimes power maps obtained from these mapping systems for personalized Free-Form lenses produce asymmetric
cylinder maps and bigger amounts of unwanted astigmatism when compared to conventional non-personalized lenses. The differences observed might lead to the incorrect conclusion that non-personalized lenses have less astigmatism and better power distribution. But, when the real position of wear and the eye-lens model are used, the calculated power maps show a better power distribution and lower amounts of unwanted astigmatism for the personalized lenses. In more detail, the theoretical analysis of the maps for phase 1 (Figure 2) shows a 10% reduction of unwanted astigmatism in the temporal side when considering a plano addition 2.00D lens with standard position of wear parameters. This effect is even bigger when the powers are higher; for example, Figures 8 & 9 represent the power maps measured using a mapping system compared to those perceived by the user for the 1A-Basic and 1B-DRP lenses for positive and negative powers and wrap angles of 0, 10 and 20 degrees.
How to cite this article: Eva Chamorro, Jose Miguel Cleva, Pablo Concepción, Melisa S Subero, José Alonso. Lens Design Techniques to Improve Satisfaction in Free-Form Progressive Addition Lens Users. JOJ Ophthal. 2018; 6(3) : 555688. DOI: 10.19080/JOJO.2018.06.555688008
JOJ Ophthalmology
Figure 8: Power maps as measured by a mapper compared to real user power maps for lenses 1A-Basic and 1B-DRP for a +3.00D addition, 2.00D prescription and a 6.00D base curve.
Figure 9: Power maps as measured by a mapper compared to real user power maps for lenses 1A-Basic and 1B-DRP for a -3.00D addition 2.00D prescription and a 4.00D base curve.
The maps obtained from a mapper for lens 1A-Basic present similar distribution for positive and negative powers for the different wrap angles. But, the user power maps for this lens are
not constant and the lateral unwanted astigmatism grows as the wrap angle increases.
How to cite this article: Eva Chamorro, Jose Miguel Cleva, Pablo Concepción, Melisa S Subero, José Alonso. Lens Design Techniques to Improve Satisfaction in Free-Form Progressive Addition Lens Users. JOJ Ophthal. 2018; 6(3) : 555688. DOI: 10.19080/JOJO.2018.06.555688009
JOJ Ophthalmology
In the case of lens 1B-DRP, the opposite behavior is found, the mapper power maps vary according to the wrap angle used for the calculation due to the personalization calculation. This is due to the compensation that is done for the oblique aberration compensation calculated for the real position of wear for the individual user. When the eye-lens system is modeled and used for the power calculation, the power distribution obtained is more stable when compared to the lens 1A-Basic. The DRP lens has less unwanted astigmatism and the distortion perceived in the lateral parts of the lens is more symmetric.
The advantages found in the real user power maps are also confirmed in the wearer trial where there is a significant positive effect of the personalization in terms of user satisfaction. The personalized lens was chosen by most of the users with statistically significant values after 7 days of use.
Although mathematically the personalized lens produces better image quality, there are still 20% of users preferring a
basic lens. There are different factors for this preference, one of them is that the advantages of personalization are not the same for all prescriptions and vary depending on the base curve selected for the calculation. When the base curve selected for a basic lens is close to the optimal one, the lens performance is closer to the personalized one. Another factor is the mounting and fitting of the lens; even if the fitting was carefully done, errors in the position of wear have a significant impact on final user perception. Finally, some users are less sensitive to the improvements on the personalized lenses, either because of a low visual acuity or because they are less sensitive to a defocus of the lens. These effects sometimes are combined and make the user not feel any significant differences between the personalized and basic lens, and then the selection of the design is done almost randomly. But when analyzing the preference of the personalized designs, the lens is preferred by most of the users and this is statistically significant pointing that this improvement is real and perceived by the majority of the users.
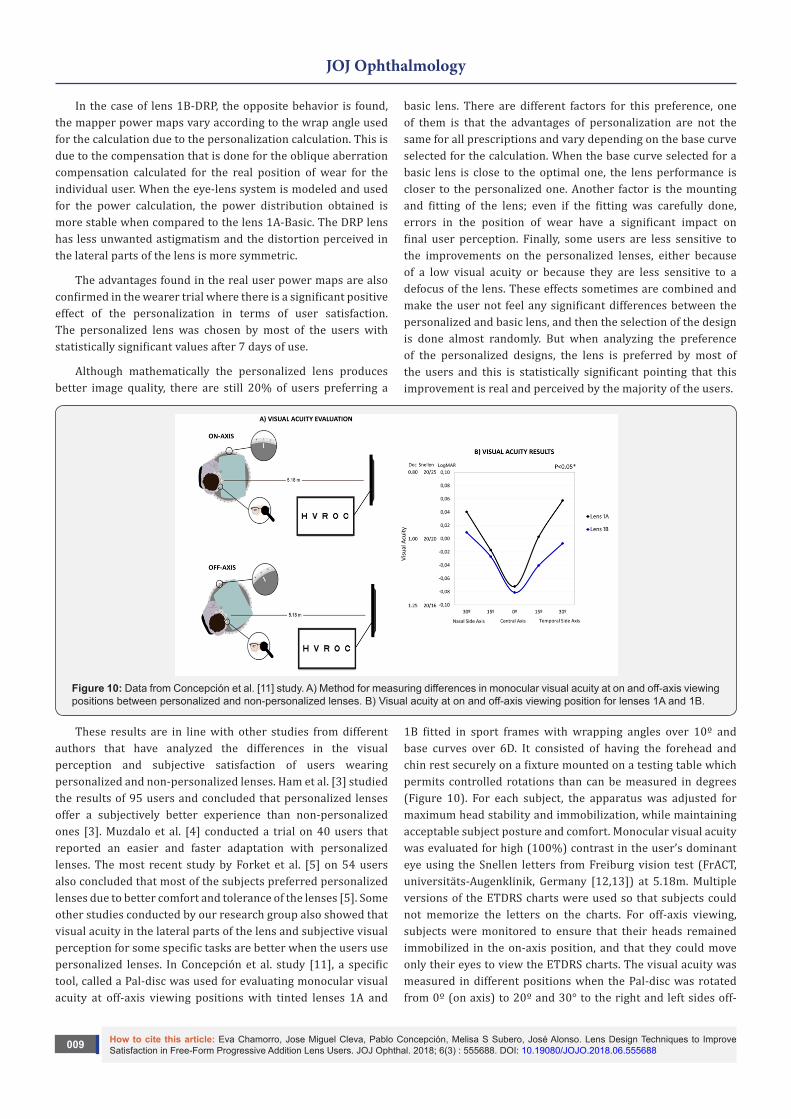
Figure 10: Data from Concepción et al. [11] study. A) Method for measuring differences in monocular visual acuity at on and off-axis viewing positions between personalized and non-personalized lenses. B) Visual acuity at on and off-axis viewing position for lenses 1A and 1B.
These results are in line with other studies from different authors that have analyzed the differences in the visual perception and subjective satisfaction of users wearing personalized and non-personalized lenses. Ham et al. [3] studied the results of 95 users and concluded that personalized lenses offer a subjectively better experience than non-personalized ones [3]. Muzdalo et al. [4] conducted a trial on 40 users that reported an easier and faster adaptation with personalized lenses. The most recent study by Forket et al. [5] on 54 users also concluded that most of the subjects preferred personalized lenses due to better comfort and tolerance of the lenses [5]. Some other studies conducted by our research group also showed that visual acuity in the lateral parts of the lens and subjective visual perception for some specific tasks are better when the users use personalized lenses. In Concepción et al. study [11], a specific tool, called a Pal-disc was used for evaluating monocular visual acuity at off-axis viewing positions with tinted lenses 1A and
1B fitted in sport frames with wrapping angles over 10º and base curves over 6D. It consisted of having the forehead and chin rest securely on a fixture mounted on a testing table which permits controlled rotations than can be measured in degrees (Figure 10). For each subject, the apparatus was adjusted for maximum head stability and immobilization, while maintaining acceptable subject posture and comfort. Monocular visual acuity was evaluated for high (100%) contrast in the user’s dominant eye using the Snellen letters from Freiburg vision test (FrACT, universitäts-Augenklinik, Germany [12,13]) at 5.18m. Multiple versions of the ETDRS charts were used so that subjects could not memorize the letters on the charts. For off-axis viewing, subjects were monitored to ensure that their heads remained immobilized in the on-axis position, and that they could move only their eyes to view the ETDRS charts. The visual acuity was measured in different positions when the Pal-disc was rotated from 0º (on axis) to 20º and 30° to the right and left sides off-
How to cite this article: Eva Chamorro, Jose Miguel Cleva, Pablo Concepción, Melisa S Subero, José Alonso. Lens Design Techniques to Improve Satisfaction in Free-Form Progressive Addition Lens Users. JOJ Ophthal. 2018; 6(3) : 555688. DOI: 10.19080/JOJO.2018.06.5556880010
JOJ Ophthalmology
axis to the periphery (Figure 10A). Results revealed significant differences and significantly better visual acuity for lenses personalized by Digital Ray-Path technology in comparison with non-personalized lenses, more noticeable at off-axis viewing (Figure 10B).
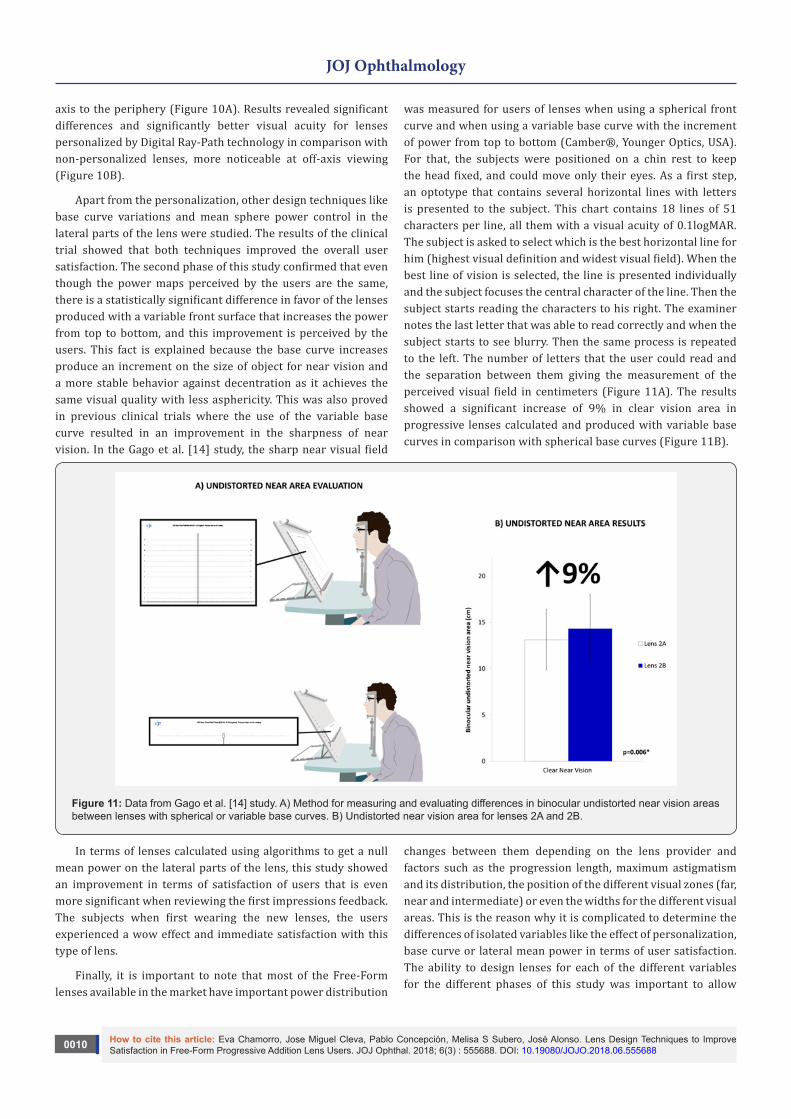
Apart from the personalization, other design techniques like base curve variations and mean sphere power control in the lateral parts of the lens were studied. The results of the clinical trial showed that both techniques improved the overall user satisfaction. The second phase of this study confirmed that even though the power maps perceived by the users are the same, there is a statistically significant difference in favor of the lenses produced with a variable front surface that increases the power from top to bottom, and this improvement is perceived by the users. This fact is explained because the base curve increases produce an increment on the size of object for near vision and a more stable behavior against decentration as it achieves the same visual quality with less asphericity. This was also proved in previous clinical trials where the use of the variable base curve resulted in an improvement in the sharpness of near vision. In the Gago et al. [14] study, the sharp near visual field
was measured for users of lenses when using a spherical front curve and when using a variable base curve with the increment of power from top to bottom (Camber®, Younger Optics, USA). For that, the subjects were positioned on a chin rest to keep the head fixed, and could move only their eyes. As a first step, an optotype that contains several horizontal lines with letters is presented to the subject. This chart contains 18 lines of 51 characters per line, all them with a visual acuity of 0.1logMAR. The subject is asked to select which is the best horizontal line for him (highest visual definition and widest visual field). When the best line of vision is selected, the line is presented individually and the subject focuses the central character of the line. Then the subject starts reading the characters to his right. The examiner notes the last letter that was able to read correctly and when the subject starts to see blurry. Then the same process is repeated to the left. The number of letters that the user could read and the separation between them giving the measurement of the perceived visual field in centimeters (Figure 11A). The results showed a significant increase of 9% in clear vision area in progressive lenses calculated and produced with variable base curves in comparison with spherical base curves (Figure 11B).
Figure 11: Data from Gago et al. [14] study. A) Method for measuring and evaluating differences in binocular undistorted near vision areas between lenses with spherical or variable base curves. B) Undistorted near vision area for lenses 2A and 2B.
In terms of lenses calculated using algorithms to get a null mean power on the lateral parts of the lens, this study showed an improvement in terms of satisfaction of users that is even more significant when reviewing the first impressions feedback. The subjects when first wearing the new lenses, the users experienced a wow effect and immediate satisfaction with this type of lens.
Finally, it is important to note that most of the Free-Form lenses available in the market have important power distribution
changes between them depending on the lens provider and factors such as the progression length, maximum astigmatism and its distribution, the position of the different visual zones (far, near and intermediate) or even the widths for the different visual areas. This is the reason why it is complicated to determine the differences of isolated variables like the effect of personalization, base curve or lateral mean power in terms of user satisfaction. The ability to design lenses for each of the different variables for the different phases of this study was important to allow
How to cite this article: Eva Chamorro, Jose Miguel Cleva, Pablo Concepción, Melisa S Subero, José Alonso. Lens Design Techniques to Improve Satisfaction in Free-Form Progressive Addition Lens Users. JOJ Ophthal. 2018; 6(3) : 555688. DOI: 10.19080/JOJO.2018.06.5556880011
JOJ Ophthalmology
Your next submission with Juniper Publishers will reach you the below assets
• Quality Editorial service• Swift Peer Review• Reprints availability• E-prints Service• Manuscript Podcast for convenient understanding• Global attainment for your research• Manuscript accessibility in different formats
( Pdf, E-pub, Full Text, Audio) • Unceasing customer service
Track the below URL for one-step submission https://juniperpublishers.com/online-submission.php
This work is licensed under CreativeCommons Attribution 4.0 LicensDOI: 10.19080/JOJO.2018.06.555688
the study of each of the techniques individually giving essential information to design new Free-Form progressive lenses that can comply with the market and user needs.
Conclusion
Different Free-Form progressive lens design techniques were analyzed in this clinical trial that were found to be tools to improve progressive users’ satisfaction. The personalization and the selection of a variable base curve with increasing power from top to bottom help to improve the overall satisfaction of users. The calculation method controlling the mean power to a null extent on the lateral parts of the lens also increased the general satisfaction in terms of first impressions pointing to an improvement of the satisfaction from the very beginning of wearing the lenses.
Knowing how each of these techniques affects the overall satisfaction of Free-Form progressive lens users is essential in creating specific products that can increase the satisfaction of users based on their lifestyles and the needs of the market.
Finally, it is shown that power distributions obtained directly by mapping system devices cannot be used for a direct comparison and validation of design performance because the perceived power differs significantly from the measured one and there is even more difference as we move out of the optical center of the lens.
References1. Chamorro E, J Alonso, J Cleva, D Crespo (2017) Free-Form Lenses: Why
My Patient is Not Wearing My Prescription? JOJ Ophthalmology 2(1): 1-4.
2. Minkwitz G (1963) [on the Surface Astigmatism of a Fixed Symmetrical Aspheric Surface]. Opt Acta (Lond) 10: 223-227.
3. Han SC, Graham AD, Lin MC (2011) Clinical assessment of a customized free-form progressive add lens spectacle. Optom Vis Sci 88(2): 234-243.
4. Muzdalo NV, M Mihelcic (2015) Individually designed PALs vs. power optimized PALs adaptation comparison. Coll Antropol 39(1): 55-61.
5. Forkel J, Reiniger JL, Muschielok A, Welk A, Seidemann A, et al. (2017) Personalized Progressive Addition Lenses: Correlation between Performance and Design. Optom Vis Sci 94(2): 208-218.
6. Arroyo R, Crespo D, Alonso J (2012) Scoring of progressive power lenses by means of user power maps. Optom Vis Sci 89(4): E489-E501.
7. Sheedy J, RF Hardy, JR Hayes (2006) Progressive addition lenses--measurements and ratings. Optometry 77(1): 23-39.
8. Sheedy JE (2004) Correlation analysis of the optics of progressive addition lenses. Optom Vis Sci 81(5): 350-361.
9. Sheedy JE (2004) Progressive addition lenses--matching the specific lens to patient needs. Optometry 75(2): 83-102.
10. International Organization for Standardization (2004) Specifications for progressive power lenses. ISO 8980-2:2004. I. O. f. Standardization.
11. Concepcion P, J Cleva, E Chamorro, D Crespo, M Garcia, et al. (2017) Clinical Evaluation of Free-Form PALs: Customized vs Standard Designs. European Academy of Optometry and Optics annual conference. Barcelona, Spain.
12. Bach M (1996) The Freiburg Visual Acuity test--automatic measurement of visual acuity. Optom Vis Sci 73(1): 49-53.
13. Bach M (2007) The Freiburg Visual Acuity Test-variability unchanged by post-hoc re-analysis. Graefes Arch Clin Exp Ophthalmol 245(7): 965-971.
14. Gago C, E Chamorro, E Pascual, M Subero, J Cleva, et al. (2016) Near Vision Area Without Binocular Distortions in Personalized Free-Form Progressive Lenses With An Increasing Curvature Frontal Base Curve. European Academy of Optometry and Optics annual conference. Berlin, Germany.