leo p. grohowski files/leo - pittsburgh... · leo p. grohowski . chief investment officer, bny...
TRANSCRIPT
Leo P. Grohowski Chief Investment Officer, BNY Mellon Wealth Management
May 2015
Economic and Financial Market Outlook

2
1As of 3/31/15
The Investments Company for The World
• Top 10 U.S. wealth manager − Approximately $194 billion in private client assets1
− $15.2 billion in deposits and $11.6 billion in loans outstanding1 • Among nation’s largest family office providers and a leading
provider of charitable gift services
• Two centuries of experience and perspective − Oldest private bank in U.S. history
− Among first to create dedicated family office business • Offices in 18 states and 4 countries
BNY MELLON
BNY MELLON WEALTH
MANAGEMENT
• Leading global provider of securities services
−$28.5 trillion in assets under custody and administration1
• 7th largest global asset manager
−$1.7 trillion under management1 • 7th largest U.S. asset manager

3

4
Historical Bull Markets
As of 4/24/15. Source: StrategasRP.
S&P 500 Historical Bull Markets 1928 to Present
BU
LL M
AR
KE
T A
DVA
NC
E (%
)
BULL MARKET DURATION (MONTHS)
0
50
100
150
200
250
300
350
400
450
0 20 40 60 80 100 120
1966-68 1987-90
1970-73
1962-66 1957-61
1942-46
1932-37
1982-87
2002-07
1974-80
1949-56
1990-00
3/9/09 to Current, 72 Months, 213%
Average 57 Months, 165%

5
2015 Outlook and Strategy
• Further Equity Gains
• Improved Performance − Active vs. Passive − U.S. Small Cap vs. U.S. Large Cap − Non-U.S. vs. U.S.
• Normalization of Interest Rates
• Stronger U.S. Dollar
• Higher Volatility Environment – Diversifiers More Important
• Disciplined Rebalancing and Due Diligence Key to Alpha Generation and Downside Protection

1.9
3.7
1.7
9.2
10.2
1.2
3.8
0.0
2.3 2.6 1.9
0
3
6
9
12
LargeCap
MidCap
Small Cap
Dev. Emerg. Taxable HighYield
Treas. HedgeFunds
GlobalREITs
ManagedFutures
6
YTD Market Returns
As of 4/30/2015 unless noted otherwise. Indices used: Large Cap: S&P 500; Mid Cap: S&P MidCap 400; Small Cap: Russell 2000; Developed International: MSCI EAFE (Net); Emerging Markets: MSCI EMF; Taxable Fixed Income: Barclays Capital U.S. Aggregate; High Yield Fixed Income: Merrill Lynch HY Master II; Treasuries: U.S. 3 Month Treasury; Hedge: HFRX Global Hedge Index; Global Real Estate: FTSE EPRA/NAREIT; Managed Futures: HFRI Macro Index. Sources: Bloomberg L.P. and Morningstar. Past performance is not indicative of future performance.
U.S. Equities International Equities
Fixed Income Diversifiers
PE
RC
EN
T
7
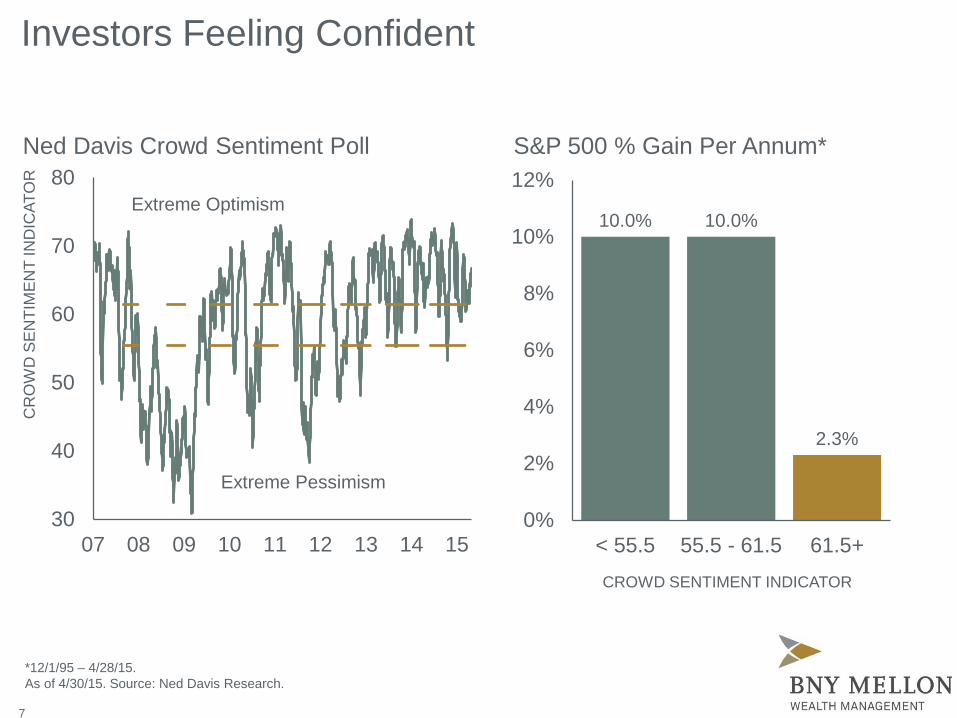
Ned Davis Crowd Sentiment Poll
Extreme Pessimism
Extreme Optimism
Investors Feeling Confident
S&P 500 % Gain Per Annum*
CROWD SENTIMENT INDICATOR
30
40
50
60
70
80
07 08 09 10 11 12 13 14 15
CR
OW
D S
EN
TIM
EN
T IN
DIC
ATO
R
10.0% 10.0%
2.3%
0%
2%
4%
6%
8%
10%
12%
< 55.5 55.5 - 61.5 61.5+
*12/1/95 – 4/28/15. As of 4/30/15. Source: Ned Davis Research.

Improving Confidence
78 82 86 90 94 98 02 06 10 1475
80
85
90
95
100
105
110
IND
EX
NFIB Index ofSmall Business Optimism*
8
71 76 81 86 91 96 00 05 10 1520
40
60
80
100
120
140
160
IND
EX
Conference Board'sConsumer Confidence Index**
*As of 4/30/15. Sources: National Federation of Independent Businesses and Ned Davis Research **As of 4/30/15. Shaded areas represent periods of U.S. recession. Source: The Conference Board

78 80 82 84 86 88 90 92 94 96 98 00 02 04 06 08 10 12 143
6
9
12
15
18
PE
RC
EN
T
As of 4/30/15. Sources: Bureau of Labor Statistics and FactSet.*Includes officially unemployed, those who want a job but stopped looking, and those who need full-time jobs but can only find part-time work, measured as a percentage of the civilian labor force plus all the marginally attached workers.
Unemployment Rate, Seasonally-Adjusted
U.S. Civilian Unemployment Rate U.S. Broader Unemployment Rate*
9
Slow Improvement in Employment
10.8%
5.4%
10
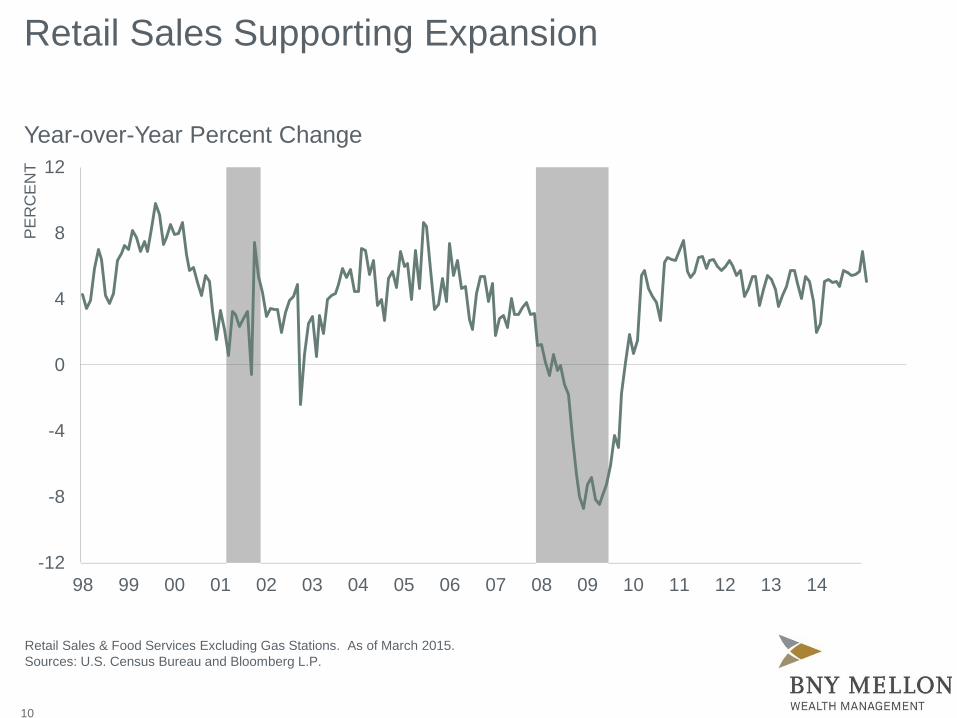
Retail Sales Supporting Expansion
Retail Sales & Food Services Excluding Gas Stations. As of March 2015. Sources: U.S. Census Bureau and Bloomberg L.P.
Year-over-Year Percent Change
-12
-8
-4
0
4
8
12
98 99 00 01 02 03 04 05 06 07 08 09 10 11 12 13 14
PE
RC
EN
T

60
70
80
90
100
110
120
130
81 85 89 93 97 01 05 09 13
Significant Reduction in Household Debt FORCED DELEVERAGING A PARTIAL CONTRIBUTOR
As of 12/31/14. Household debt includes home mortgage and consumer credit. Source: Department of Commerce and FactSet
Household Debt as Percentage of Disposable Personal Income
102.5%
11
3
6
9
12
99 02 05 08 11 14
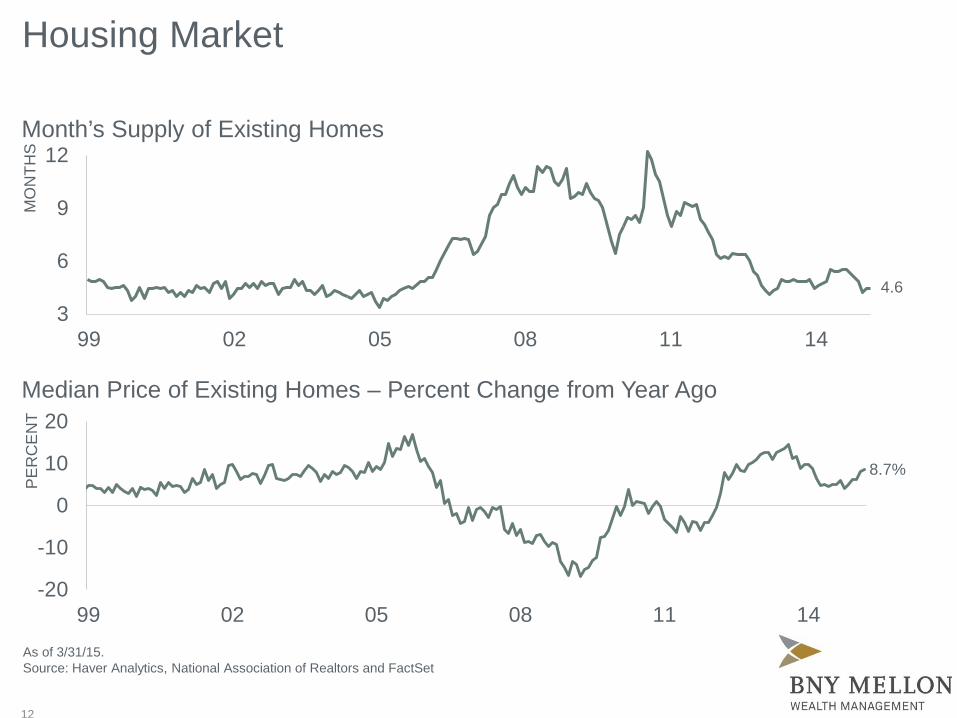
Housing Market
-20
-10
0
10
20
99 02 05 08 11 14
PE
RC
EN
T
As of 3/31/15. Source: Haver Analytics, National Association of Realtors and FactSet
Median Price of Existing Homes – Percent Change from Year Ago
Month’s Supply of Existing Homes
4.6
8.7%
MO
NTH
S
12

13
IND
EX
LEV
EL
U.S. Manufacturing Rebounding
30
40
50
60
70
95 97 99 01 03 05 07 09 11 13 15
ISM Purchasing Managers’ Index
As of 4/30/15. Source: Institute for Supply Management and FactSet

14
1.8
-0.3
-2.8
2.5 1.9
2.3 2.2 2.4 2.5
-4
-2
0
2
4
2007 2008 2009 2010 2011 2012 2013 2014 2015E
PE
RC
EN
T
Sources: 2007-2014: Bureau of Economic Analysis; 2015: BNY Mellon Wealth Management.
Moderate, but Improving U.S. Growth Expectations
BNY Mellon Wealth Management GDP Estimates

15
International Manufacturing
Eurozone vs. China Markit Manufacturing Purchasing Managers' Index
As of 4/30/15. Seasonally adjusted. Source: FactSet
IND
EX
LEV
EL
32
36
40
44
48
52
56
60
09 10 11 12 13 14 15
Eurozone
China

16
2.4 2.6
-0.1
7.4
0.9
2.4
1.3
3.1 2.7
1.0
6.8
1.5
2.7
0.9
-2
0
2
4
6
8
UnitedStates
UnitedKingdom
Japan China EuroArea
Middle Eastand
North Africa
LatinAmerica
PE
RC
EN
T
2014 2015E
Real Gross Domestic Product (GDP)
As of April 2015. Source: International Monetary Fund
Global Outlook

17
Central Banks Maintaining Accommodative Policies EXPECT GREATER DIVERGENCE IN 2015
Central Bank Rates
As of 4/30/15. Source: Bloomberg LP
0
2
4
6
8
10
12
1992 1994 1996 1998 2000 2002 2004 2006 2008 2010 2012 2014
Bank of England U.S. Federal Funds Rate Bank of Japan European Central Bank
PE
RC
EN
T

18

70
80
90
100
110
Data represents the JP Morgan Trade-Weighted U.S. Dollar Index. As of 4/30/15. Source: Bloomberg L.P.
Avg = 90.4 Avg = 89.3
Avg = 85.9
Avg = 83.0
Avg = 87.3
Avg = 83.8
2005 2006 2007 2008 2009 2010
Avg = 79.5
2011 2012
Avg = 81.5
2013 2014
Avg = 83.6 Avg = 86.2
19
Avg = 96.1
2015
IND
EX
Trade-Weighted Dollar
The Dollar

U.S. Inflation Remains Contained
Year-over-Year Percent Change in Consumer Price Index
96 98 00 02 04 06 08 10 12 14YEAR
-3
-2
-1
0
1
2
3
4
5
6
PE
RC
EN
T
As of 03/31/15. Source: U.S. Bureau of Labor Statistics.
Core CPI Headline CPI
20

2.03 1.85
0.37 0.33
4.29 4.57
3.91
1.50
0
1
2
3
4
5
U.S. U.K. Germany Japan
As of 4/30/15. Source: FactSet.
Bond Yields Low by Historical Measures
Global Yields (Current vs. 20-year Average)
21
PE
RC
EN
T
Current 20-year Average

0
2
4
6
8
10
90 95 00 05 10 15
S&P 500 Operating Earnings Yield 10-Year Treasury Note
22
Stocks Attractive Relative to Bonds
Earnings yield is inverse of P/E for 4-quarter trailing operating earnings. As of 3/31/15. Sources: Standard & Poor’s Corp. and Bloomberg L.P.
Internet bubble: Earnings yield of 3.4 = P/E of 29
S&P 500 Earnings Yield vs. 10-Year Treasury Note
PE
RC
EN
T

As of 4/30/15. Indices used: U.S. Large Cap: S&P 500; Non-U.S. Developed: MSCI EAFE; Emerging Markets: MSCI EM. Source: Bloomberg and MSCI
Market Valuations (Forward P/E Ratio)
Global Equities Remain Attractively Valued
23
18.3x 18.5x
14.8x
19.4x 20.8x
15.4x
0
5
10
15
20
25
U.S.Large Cap
Non-U.S.Developed
EmergingMarkets
Current 1996-2015 Mean
P/E
RAT
IO

82.54
49.51 56.86
83.77 96.44 96.82
107.29 113.04
120-125
0
20
40
60
80
100
120
140
2007 2008 2009 2010 2011 2012 2013 2014 2015Estimate
24
S&P 500 Operating Earnings Estimates CONSISTENT WITH SLOW GROWTH SCENARIO
As of 3/31/15. Earnings represent trailing four-quarter earnings per share. Source: Standard & Poor’s and BNY Mellon Wealth Management.
S&P 500 Earnings and BNY Mellon Wealth Management Estimates
$ D
OLL
AR
S
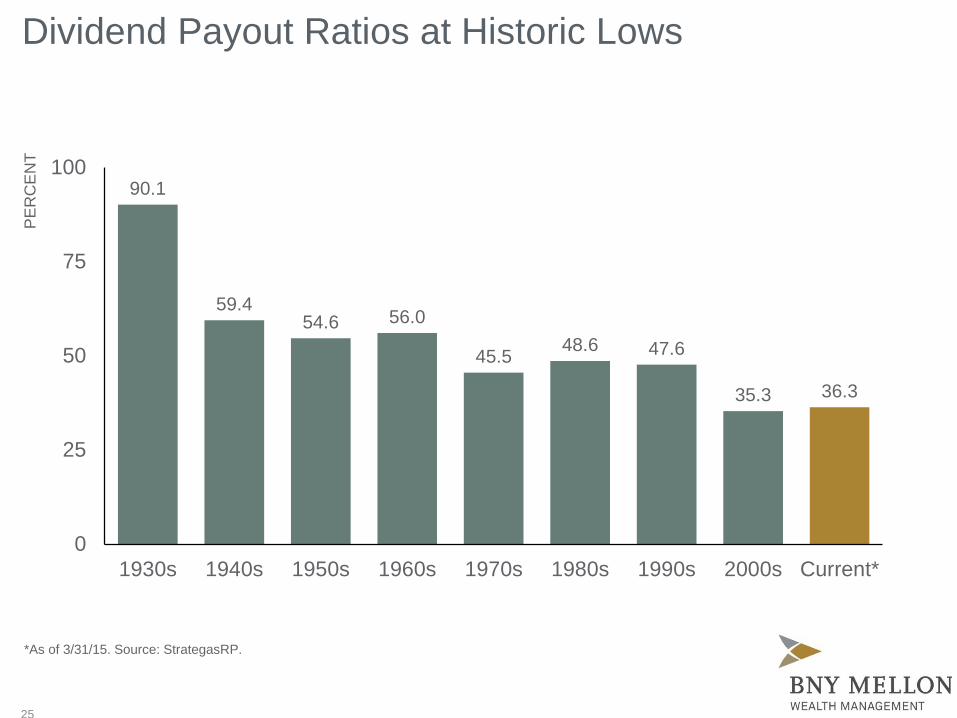
90.1
59.4 54.6 56.0
45.5 48.6 47.6
35.3 36.3
0
25
50
75
100
1930s 1940s 1950s 1960s 1970s 1980s 1990s 2000s Current*
Dividend Payout Ratios at Historic Lows
PE
RC
EN
T
*As of 3/31/15. Source: StrategasRP.
25

26
Number and Value of U.S. M&A Deals, Quarterly
050100150200250300350400450500
0
50
100
150
200
250
300
350
400
98 99 00 01 02 03 04 05 06 07 08 09 10 11 12 13 14 15
Number of Deals (Left Axis) Value of Deals (Right Axis)
$ B
ILLI
ON
S
As of 3/31/15. Source: StrategasRP.
M&A Activity Improving

UNDERWEIGHT SMALL
UNDERWEIGHT NEUTRAL SMALL
OVERWEIGHT OVERWEIGHT
EQUITY Large Cap Mid Cap Small Cap International Developed Large Cap International Developed Small Cap Emerging Markets Private Equity Private Equity-Real Estate
FIXED INCOME Treasuries Investment-grade Corporate Tax-exempt High Yield Emerging Market Debt
DIVERSIFIERS Real Estate (REITs) Long/Short Hedge Absolute Return Hedge Managed Futures Commodities
Asset Class Positioning
As of 4/30/15.

-20%
-10%
0%
10%
20%
30%
40%
50%
Sha
ngha
i AM
SC
I Chi
naJa
pan
Taiw
anS
inga
pore HK
Asi
a x
JA
PA
C x
JK
orea
Mal
aysi
aA
ustra
liaIn
dia
Thai
land
New
Zeal
and
Phi
lippi
nes
Indo
nesi
a
0
5
10
15
20
25
Sha
ngha
i AM
SC
I Chi
naJa
pan
Taiw
anS
inga
pore HK
Asi
a x
JA
PA
C x
JK
orea
Mal
aysi
aA
ustra
liaIn
dia
Thai
land
New
Zeal
and
Phi
lippi
nes
Indo
nesi
a
28
P/E Ratio vs. Long-Term Average P/E Ratio Premium over Long-Term Avg.
12-month forward P/E ratios Source: Nomura
Some Large Markets Trading below Historical P/E Avg.
PE
RAT
IO
29
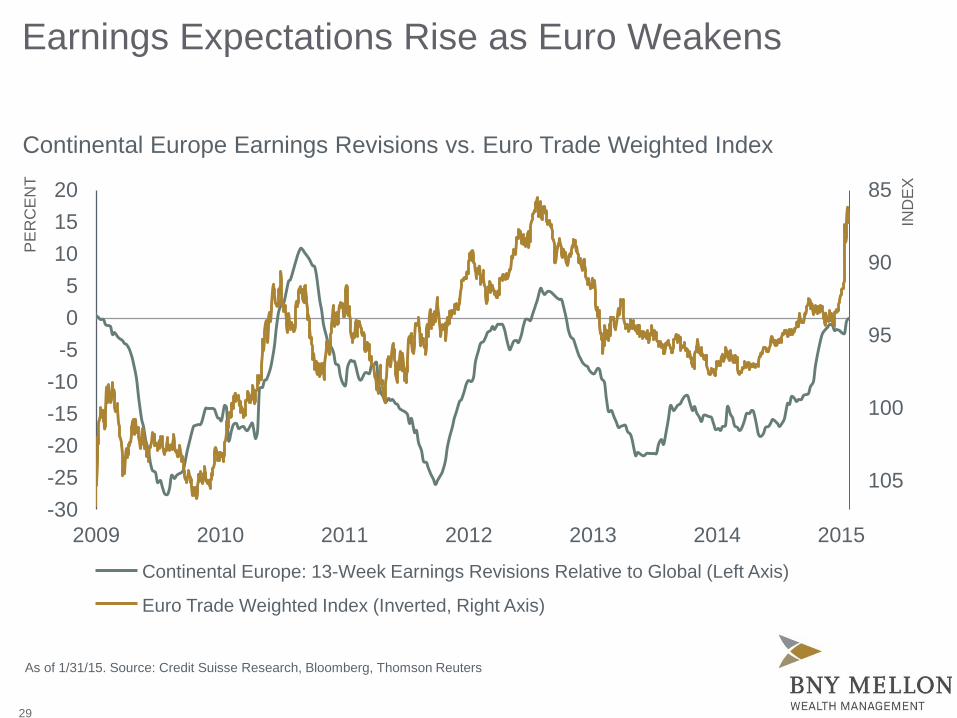
Earnings Expectations Rise as Euro Weakens
85
90
95
100
105-30-25-20-15-10
-505
101520
2009 2010 2011 2012 2013 2014 2015
PE
RC
EN
T
Euro Trade Weighted Index (Inverted, Right Axis)
Continental Europe: 13-Week Earnings Revisions Relative to Global (Left Axis)
IND
EX
As of 1/31/15. Source: Credit Suisse Research, Bloomberg, Thomson Reuters
Continental Europe Earnings Revisions vs. Euro Trade Weighted Index

30
Source: The Economist

31
Abe is Most Stable Government after Koizumi
0
1
2
3
4
5
6
KoizumiApr-'01
|Sep-'06
AbeSep-'06
|Sep-'07
FukudaSep-'07
|Sep-'08
AsoSep-'08
|Sep-'09
HatoyamaSep-'09
|Jun-'10
KanJun-'10
|Sep-'11
NodaSep-'11
|Dec-'12
AbeDec-'12
|Dec-'14
Potential for another 4 years after strong December lower-house election results
Life of Government for Each Prime Minister Since Koizumi
YEA
RS
Source: BNY Mellon Asset Management Japan

32
465,000
470,000
475,000
480,000
485,000
490,000
495,000
Q12012
Q22012
Q32012
Q42012
Q12013
Q22013
Q32013
Q42013
Q12014
Q22014
Q32014
Q42014
Pre-Abenomics Post-Abenomics
Steady Improvement in Japan’s Nominal GDP
Japan Nominal GDP, SAAR
YEN
BIL
LIO
N
As of 1/31/15. Source: Japan’s Cabinet Office, BNY Mellon Investment Management

-60
-40
-20
0
20
40
60
80
100
0
200
400
600
800
1,000
1,200
1,400
1,600
1,800
2,000
02 04 06 08 10 12 140
20
40
60
80
100
120
0
200
400
600
800
1,000
1,200
1,400
1,600
1,800
2,000
02 04 06 08 10 12 14
33
Is Good News Now in Price?
MSCI World vs. Trailing Weighted EPS TOPIX vs. Trailing Weighted EPS
IND
EX
IND
EX
EP
S
EP
S
As of 3/31/15 using 12-month trailing EPS. Source: Bloomberg LP TOPIX: Tokyo Stock Price Index
MSCI World (Left) MSCI EAFE Trailing EPS (Right)
TOPIX (Left Axis) TOPIX Trailing EPS (Right)
0
1
2
3
4
5
6
2007 2008 2009 2010 2011 2012 2013 2014 2015
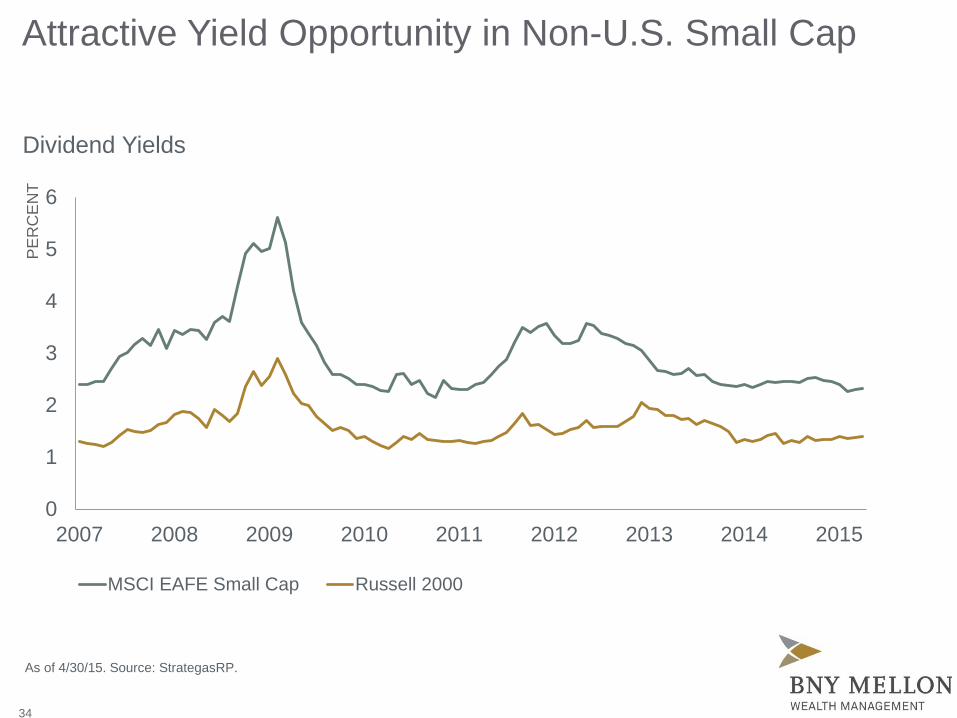
MSCI EAFE Small Cap Russell 2000
34
Attractive Yield Opportunity in Non-U.S. Small Cap
Dividend Yields
PE
RC
EN
T
As of 4/30/15. Source: StrategasRP.
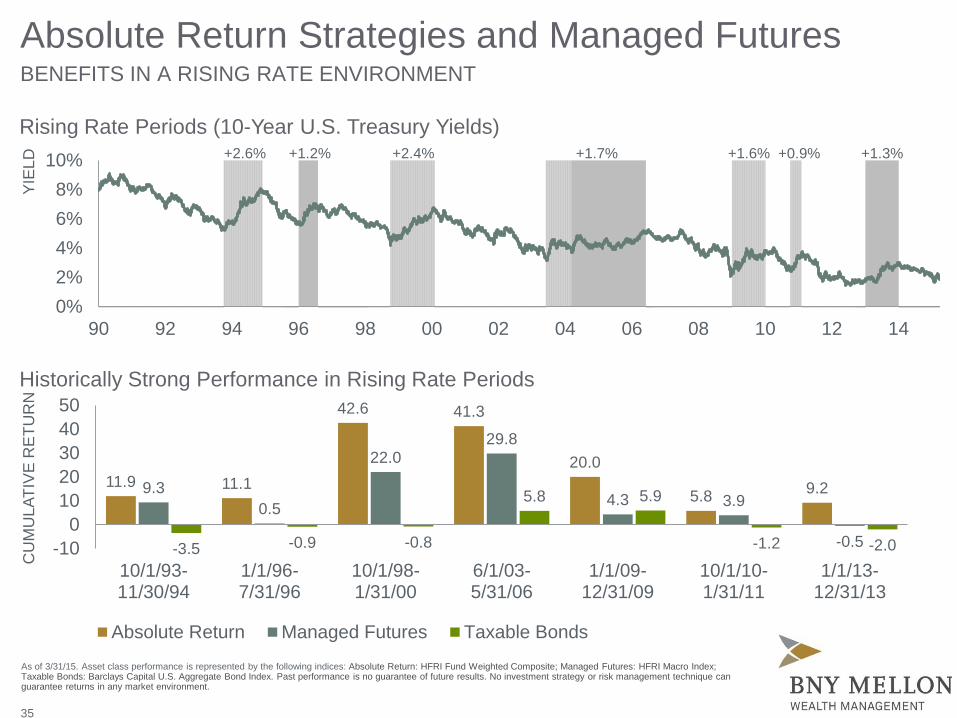
Absolute Return Strategies and Managed Futures BENEFITS IN A RISING RATE ENVIRONMENT
As of 3/31/15. Asset class performance is represented by the following indices: Absolute Return: HFRI Fund Weighted Composite; Managed Futures: HFRI Macro Index; Taxable Bonds: Barclays Capital U.S. Aggregate Bond Index. Past performance is no guarantee of future results. No investment strategy or risk management technique can guarantee returns in any market environment.
11.9 11.1
42.6 41.3
20.0
5.8 9.2 9.3 0.5
22.0 29.8
4.3 3.9
-0.5 -3.5 -0.9 -0.8
5.8 5.9
-1.2 -2.0 -100
1020304050
10/1/93-11/30/94
1/1/96-7/31/96
10/1/98-1/31/00
6/1/03-5/31/06
1/1/09-12/31/09
10/1/10-1/31/11
1/1/13-12/31/13
Absolute Return Managed Futures Taxable Bonds
Rising Rate Periods (10-Year U.S. Treasury Yields)
Historically Strong Performance in Rising Rate Periods
35
0%2%4%6%8%
10%
90 92 94 96 98 00 02 04 06 08 10 12 14
YIE
LD
CU
MU
LATI
VE
RE
TUR
N
+2.6% +1.2% +2.4% +1.7% +1.6% +0.9% +1.3%
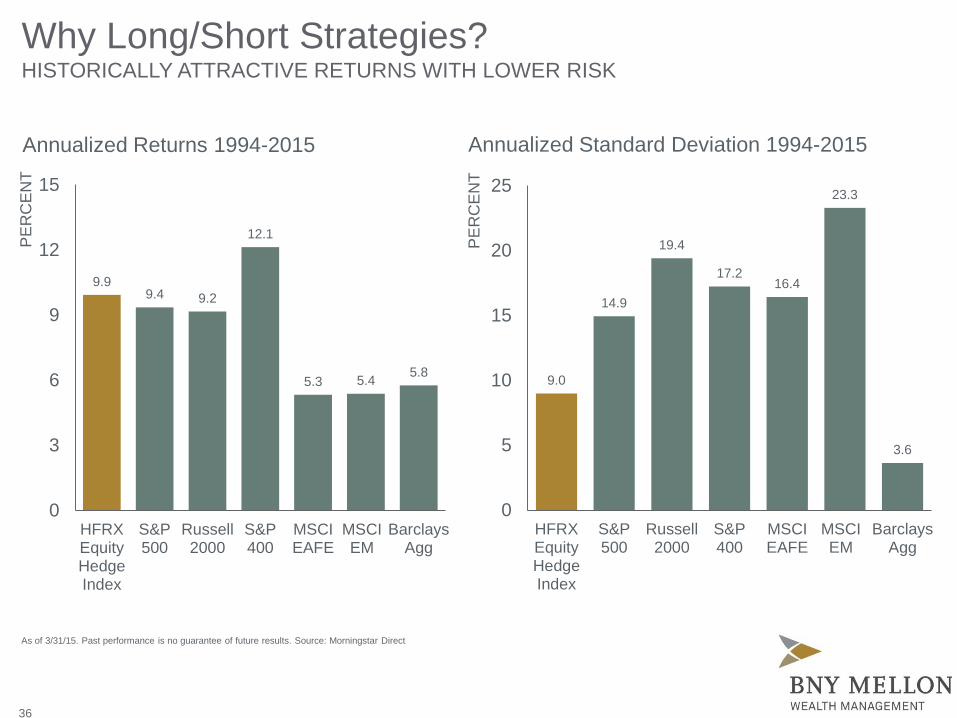
Why Long/Short Strategies? HISTORICALLY ATTRACTIVE RETURNS WITH LOWER RISK
9.9 9.4 9.2
12.1
5.3 5.4 5.8
0
3
6
9
12
15
HFRXEquityHedgeIndex
S&P500
Russell2000
S&P400
MSCIEAFE
MSCIEM
BarclaysAgg
As of 3/31/15. Past performance is no guarantee of future results. Source: Morningstar Direct
PE
RC
EN
T
9.0
14.9
19.4
17.2 16.4
23.3
3.6
0
5
10
15
20
25
HFRXEquityHedgeIndex
S&P500
Russell2000
S&P400
MSCIEAFE
MSCIEM
BarclaysAgg
PE
RC
EN
T
Annualized Returns 1994-2015 Annualized Standard Deviation 1994-2015
36

0
10
20
30
40
50
2009 2010 2011 2012 2013 2014 2015
37
As of 4/30/15. Source: FactSet
IND
EX
LEV
EL
20-YEAR MEAN
Expect Increased Volatility
CBOE Market Volatility Index (VIX)
Leo P. Grohowski Executive Vice President Chief Investment Officer BNY Mellon Wealth Management
Leo Grohowski is chief investment officer of BNY Mellon Wealth Management. He leads all investment strategy and investment management functions for the wealth management organization. Mr. Grohowski joined BNY Mellon in 2007 and has more than 30 years of industry experience. Previously, he was with US Trust, Bank of America, where he was chief investment officer, responsible for investment solutions and the end-to-end investment process, including portfolio management and investment strategy for Private Wealth Management clients. Prior to his role at US Trust, he was the chief investment officer for Deutsche Bank in the Americas, overseeing more than $250 billion in assets. From 1999 to 2002, Mr. Grohowski was chief investment officer of Deutsche Bank Private Banking, serving as chairman of the Global Markets Strategy Committee and Domestic Investment Strategy group, and head of Investment Products and Services for the DB Alex Brown unit. In 1996, Mr. Grohowski joined Bankers Trust where he served as a senior trust investment officer of the Private Bank and head of the U.S. Investment Strategy group. He was with HSBC Asset Management from 1988 to 1996 and was named chief investment officer in 1993, after heading the U.S. Equities group from 1988 to 1993.
Education
• Bachelor’s degree, Drew University • Master of Business Administration,
New York University’s Stern School of Business
Community Involvement • Board of Trustees and Investment Committee chair,
Drew University • Board Member and Vice Chair, Far Hills Country Day School
• Member, Investment Committee, Blair Academy
Executive Responsibilities • Member, BNY Mellon’s Operating Committee
• Benefits Investment Committee • Chair, Wealth Management Investment Policy Committee
• Member, Compliance, Ethics and Conflicts Committee • Member, Investment Ethics Council
38

39
Disclaimer
The information provided is for illustrative/educational purposes only. All investment strategies referenced come with investment risks, including loss of value and/or loss of anticipated income. This material is not intended to constitute investment advice. Effort has been made to ensure that the material presented herein is accurate at the time of publication. However, this material is not intended to be a full and exhaustive explanation of investments options available. The information discussed herein may not be applicable to or appropriate for every investor and should be used only after consultation with professionals who have reviewed your specific situation. ©2015 The Bank of New York Mellon Corporation. All rights reserved.