les case study on pedestrian level ventilation in two neighbourhoods...
TRANSCRIPT

LES case study on pedestrian level ventilation in twoneighbourhoods in Hong Kong
Marcus Oliver Letzel1,2,*
, Carolin Helmke1, Edward Ng
3, Xipo An
3, Alan Lai
3
and Siegfried Raasch1
1Institute of Meteorology and Climatology, Leibniz Universitat Hannover, Herrenhauser Str. 2, 30419 Hannover,Germany
2Current affiliation: Ingenieurburo Lohmeyer GmbH & Co. KG3School of Architecture, Chinese University of Hong Kong, Shatin, NT, Hong Kong
(Manuscript received December 1, 2011; in revised form August 8, 2012; accepted October 22, 2012)
AbstractHong Kong is one of the most densely built-up and populated cities in the world. An adequate air ventilationat pedestrian level would ease the thermal stress in its humid subtropical climate, but the high-density cityseverely reduces the natural ventilation. This case study investigates pedestrian level ventilation in twoneighbourhoods in Kowloon, downtown Hong Kong using the parallelized large-eddy-simulation (LES)model PALM. The LES technique is chosen here for a city quarter scale pedestrian comfort study despite ofits high computational cost. The aims of the paper are a) to get a comprehensive overview of pedestrian levelventilation and a better understanding of the ventilation processes in downtown Hong Kong, b) to test theLES technique on this urban scale compared to the wind tunnel and c) to investigate how numerical/physicalparameters influence ventilation. This case study is restricted to neutral stratification in order to allow a directcomparison with the wind tunnel. A sensitivity study quantifies the dependence of site-averaged ventilationon numerical and physical parameters and determines an appropriate urban LES set-up for two 1 km2
neighbourhoods in Kowloon (Tsim Sha Tsui, Mong Kok) that are investigated for prevailing E and SW wind.The results reveal the critical dependence of ventilation on the urban morphology. Air paths, streetorientations, ground coverage, sites fronting the water, inter connectivity of spaces, building podium size andbuilding heights can all affect the pedestrian wind environment. Isolated tall buildings may have apronounced impact on ventilation both locally and downstream.
Keywords: urban large-eddy simulation, high-density city, wind environment, pedestrian level ventilation,Hong Kong.
1 Introduction
Since 2006, more than 50% of the world’s populationlives in cities. By 2007, 19 cities have a population ofmore than 10 millions. This number is increasing, andby 2025 it is expected that more than 26 cities wouldhave a population of more than 10 millions (UN-HABI-
TAT, 2008). Moreover, in order to cope with the increaseof city dwellers, designers and planners are now design-ing higher density cities of more compact urban forms(NG, 2010). Buildings are taller, streets are narrower,and cities will have smaller and lesser open spaces.The environmental consequences of high density com-pact city, especially in cities in the tropics and sub-tro-pics, are that solar access, daylight, and city ventilationare compromised. On the other hand, the urban heatisland effect is intensified and air pollution is worsened,partly due to the decrease of urban ventilation becauseof the taller, bulkier and more closely packed buildings
of the city. Current and future urban planning needs toconsider urban climate (MILLS et al., 2010; NG, 2012).Urban climatic maps are a tool to assist urban planersand designers with this task (REN et al., 2011).
This world trend towards high density living can beepitomized in the case of Hong Kong, a city of 7.5 mil-lion situated on the south-east coast line of China at thelatitude of 23 degree north. Hong Kong has one of theworld’s highest city population densities of some60,000 persons per square kilometer. In some develop-ment sites in the city core, it is not atypical to have a sitedevelopment density of two to three thousand inhabitantsper hectare (COX, 2011; NG and WONG, 2004).
After Hong Kong was hit by the severe acute respira-tory syndrome (SARS) in 2003, one of the recommenda-tions by TEAM CLEAN (2003) to improve the urbanliving environment was a mandatory air ventilationassessment (AVA) for all future (re)development projectsin Hong Kong. Contrary to planning guidelines for strongwind conditions in other countries, AVA focusses onweak wind conditions that are typical of Hong Kong’shigh building density, following the motto ‘‘the morewind the better’’ (NG, 2009).
*Corresponding author: Marcus Oliver Letzel, current affiliation: Ingenie-urburo Lohmeyer GmbH & Co. KG, An der Roßweid 3, 76229 Karlsruhe,Germany, e-mail: [email protected].
Meteorologische Zeitschrift, Vol. 21, No. 6, 575–589 (December 2012) Open Access Article� by Gebruder Borntraeger 2012
DOI 10.1127/0941-2948/2012/03560941-2948/2012/0356 $ 6.75
� Gebruder Borntraeger, Stuttgart 2012

Outdoor thermal comfort depends mainly on windvelocity, air temperature, radiation and humidity (CHENG
and NG, 2006). As a first step, AVA seeks only toenhance pedestrian level ventilation as the most impor-tant factor for Hong Kong. The wind velocity ratio vris used as a simple ventilation indicator; vr = vp/v1 isdefined as the ratio of the wind velocity vp at pedestrianlevel, 2 m above ground, and v1 at a height well abovethe roof tops where the flow does not ‘‘feel’’ the under-lying city any longer (here: top of model domain). Foroutdoor thermal comfort in summer Hong Kong CHENG
and NG (2006) demand at least vp = 1 m/s, which impliesvr� 0.15 given a typical v1 = 6 to 8 m/s at 500 m aboveground (HONG KONG OBSERVATORY, 2011; YIM et al.,2007). Actually, site-averaged values of vr in Kowloon,Hong Kong range from 0.05-0.1 in streets/congestedquarters to 0.3 near the waterfront/in open spaces (NG,2009). Hence, large parts of the city need to increase theirpedestrian level ventilation.
Assessment tools
City scale wind movement and air ventilation at coarseresolutions of around a hundred meters have been studiedusing various mesoscale and urban canopy models. Thisallows a generic areal average understanding of theeffects of various urban parameters on the urban climateof the city (LIN et al., 2008; ATKINSON, 2003; CIONCO,1997). For more detailed information, classical assess-ment tools are the wind tunnel and standard computa-tional fluid dynamics (CFD) models. The wind tunnelis a robust and reliable tool (NG, 2009), yet it may notbe practical for all future AVA projects due to its cost.Also, it normally cannot capture the complex meso-scalewind field associated with land-sea breeze and mountain-valley breeze circulations in Hong Kong (cf. YAN, 2007).Coupling CFD with mesoscale models may overcomethis (cf. SCHLUNZEN et al., 2011; XIE, 2011).
Reynolds-Averaged Navier-Stokes (RANS) models,standard CFD in wind engineering, are designed forlow computational cost; they filter out and parameterizeall turbulent fluctuations of the air flow. However, thereare known RANS deficiencies in building wakes (e.g.MOCHIDA and LUN, 2008; RODI et al., 1997) and urbanweak wind regions (YOSHIE et al., 2007), i.e. especiallywithin the urban canopy. Yet these are critical for HongKong AVA.
Large-eddy simulation (LES) is an advanced CFDmodel class. First, LES overcomes the RANS deficien-cies (RODI et al., 1995). This is because LES by defini-tion explicitly resolves the large, energy containingturbulent eddies, and only small (subgrid) scale turbu-lence still needs to be parameterized (SAGAUT, 2006).Second, LES delivers additional data that are not avail-able from RANS: since LES explicitly resolves turbulentfluctuations in space and time, peak values (velocities,concentrations) and higher order statistics can be directly
computed from LES data like from wind tunnel data.Third, LES can collect simultaneous 3D data which isstill impossibe in the wind tunnel. The significantlyimproved data quality and quantity of LES come at muchhigher CPU cost (and hardware requirements) thanRANS, but today’s supercomputers and efficient parallelalgorithms make urban LES applications feasible (TAM-
URA, 2008). Given the ever rising computational power(‘‘Moore’s Law’’) and its reducing relative cost, urbanLES assessments may become a standard within a fewyears.
With rapid development, CFD is now widely utilizedfor urban wind field studies (LI et al., 2006; BLOCKEN
et al., 2011). Guidelines for practical applications ofRANS-type CFD are available (TOMINAGA et al.,2008; FRANKE, 2006; FRANKE et al., 2011, 2004a,b;BARTZIS et al., 2004; SCAPERDAS and ATKINS, 2004;AIAA, 1988). There have been numerous CFD studiesof urban ventilation at the city scale using various tech-niques and different simplification schemes (SKOTEet al., 2005; COCEAL and BELCHER, 2005; COCEAL
et al., 2006). Parametric understandings using simplifiedarrays that mimic the urban reality have also been carriedout (HANNA et al., 2002; MACDONALD, 2000; CHU et al.,2005; YANG and LI, 2011).
Increasingly, researchers are now performing localmodelling with realistic urban cases (TOMINAGA et al.,2004; YOSHIE et al., 2007; LIU et al., 2011). TSENGet al. (2006) studied an area with some 30 buildings ofBaltimore, MD, XIE and CASTRO (2009) studied an inter-section in central London using a domain of 1.2 kmÆ0.8kmÆ0.2 km containing some 50 buildings. AKASHI
(2008) conducted CFD studies of 2.5 kmÆ1.5 kmÆ0.5km in central Tokyo. Various scenarios have been tested.The pedestrian level wind velocities and air temperaturesof different designs have been compared so as to identifythe optimized solution.
The most notable recent example has been a largedomain RANS study by ASHIE and KONO (2011) onthe metropolitan area of Tokyo. An area of 33 kmÆ33km covering Tokyo’s 23 wards has been studied with5Æ109 grid points using 300 nodes of the Earth Simulator.The results allow detailed investigation of the horizontaldistribution of 2 m air temperature, wind speed and direc-tion. The information allows focused areas to be definedfor further studies.
Case study
In the present paper, the LES technique is chosen for apedestrian comfort case study on the scale of an entirecity quarter despite of its high computational costbecause it outperforms conventional CFD (RANS) mod-els in building wakes and weak wind regions (KATAOKA
et al., 2007) which are known to dominate the assessmentareas in Hong Kong. The aims of the paper are a) to get acomprehensive overview of pedestrian level ventilation
576 M. O. Letzel et al.: LES case study on pedestrian level ventilation in two neighbourhoods Meteorol. Z., 21, 2012

and a better understanding of the ventilation processes indowntown Hong Kong, b) to test the LES technique onthis urban scale compared to the wind tunnel and c) toinvestigate how numerical/physical parameters influenceventilation. The results contribute to the developmentof guidelines for urban planning practice in Hong Kong,e.g. urban climatic maps.
Some distinct advantages of LES over RANS models,e.g. the ability to directly calculate wind gustiness orother higher-order statistics, are not explored here.
The aims of this study imply two limitations. First,this study is restricted to neutral stratification withoutCoriolis force, which is required for a direct comparisonwith the wind tunnel. I.e., thermal effects on street can-yon circulations (e.g. BOHNENSTENGEL et al., 2004;OFFERLE et al., 2007; LI et al., 2010; CAI, 2012; PARKet al., 2012) in a high-density city due to e.g. radiationeffects and anthropogenic heat release are excluded.From a scientific point of view, this initial approachmay need to be complemented by a consideration ofstratified situations at some later stage. However, fornow, the agreed priorities and methodologies for actualurban planning practice in Hong Kong (NG, 2009) implythis simple, initial approach.
Second, the requested urban LES on a scale as largeas a real-city quarter has a high computational load. Thismakes a case study imperative: only a small number ofselected real-city cases can be simulated. I.e., the resultsof this study are not necessarily generalizable. More gen-eric results can be obtained using generic/idealized geom-etries (e.g. XIE et al., 2008; YOSHIE et al., 2008).According to the classification of generic and appliedCFD studies by GOUSSEAU et al. (2011) this study isan applied CFD study.
The paper is organized as follows. The LES modeland the test sites are briefly described in sections 2 and3, respectively. The results section 4 is divided into a sen-sitivity study (4.1) and case studies (4.2). In section 4.1,the influence of numerical and physical parameters on thesite-averaged ventilation is quantified. Such parametersinclude buffer size around the assessment area, simula-tion/averaging time and vertical grid size, Reynolds num-ber, local roughness length and measurement locations.Section 4.2 presents several case studies. Using theappropriate set-up, two 1 km2 test sites in Kowloon (TsimSha Tsui/TST, Mong Kok/MK) are investigated in sub-section 4.2.1 for annual prevailing E and summer prevail-ing SW wind (HONG KONG OBSERVATORY, 2011), andthe influence of a new, super tall building on Tsim ShaTsui ventilation is assessed. LES results are validatedbased on a cross-comparison between LES and wind tun-nel results for the test sites in subsection 4.2.2, followedby LES vr comparison studies and a comparison of ven-tilation in Hong Kong and Tokyo in subsections 4.2.3and 4.2.4, respectively. Section 5 discusses practicalimplications of this study for urban design, followed bygeneral conclusions in section 6.
2 Model description
This study uses the parallelized LES model PALM(RAASCH and SCHROTER, 2001; LETZEL et al., 2008a).PALM is a model for the atmospheric or oceanic bound-ary layer that is highly parallelized (MPI, OpenMP) withsingle processor optimization for different processorarchitectures, so it is suitable for computational chal-lenges such as urban LES. Solid obstacles are explicitlyresolved on the Cartesian grid by a simplified maskmethod (BRISCOLINI and SANTANGELO, 1989). PALMis validated for urban flow/flow around solid obstacles(LETZEL et al., 2008a; KANDA et al., 2012). PALM hasbeen applied to real urban morphologies of Europeanand Asian type (LETZEL et al., 2008a,b, LETZEL et al.,2012; KANDA et al., 2012; TACK et al., 2012).
PALM is a finite difference model; it calculates thenon-hydrostatic, incompressible Boussinesq equations,the 1st law of thermodynamics and equations for sub-grid-scale (SGS) turbulent kinetic energy (TKE) and sca-lar conservation; the equations are filtered implicitlyfollowing the volume-balance approach (SCHUMANN,1975). Turbulence closure uses the 1½th order DEAR-
DORFF (1980) scheme. The wall model assumes a Prandtllayer at each surface (Monin-Obukhov similarity). Vari-ables are staggered according to the marker-and-cellmethod/Arakawa C grid (HARLOW and WELCH, 1965;ARAKAWA and LAMB, 1977). The second-order advec-tion scheme by PIACSEK and WILLIAMS (1970) is used.The 3rd-order Runge-Kutta scheme is used for time inte-gration. Incompressibility is ensured by the fractionalstep method, and the resulting Poisson equation for theperturbation pressure is solved by the default FFTpressure solver.
In this study, PALM simulates an isothermal, dryurban boundary layer, using cyclic horizontal boundaryconditions (cf. section 4.1), a Prandtl layer as rough wallfunction at the bottom and free-slip conditions at the top.The atmospheric flow is controlled by a direct, externalpressure gradient (no Coriolis force) to maintain a con-stant bulk velocity ub. The bulk velocity ub is definedas the arithmetic average velocity of a vertical cross-sec-tion perpendicular to the mean wind direction. A 1Dwind profile based on a priori information is used for ini-tialization. Digital Elevation Model (DEM) data of 1 mresolution (buildings up to ~210 m, gentle hills up to20~40 m height) are converted into PALM bottom topog-raphy using GRASS GIS (http://grass.osgeo.org/,NETELER and MITASOVA 2007).
3 Site description
Two urban areas (TST & MK) in Hong Kong have beenselected for this study. Both areas are on the Kowloonpeninsula of Hong Kong’s territory (FIG. 1 shows theassessment areas used for the case studies TST E andMK E in section 4.2). The annual prevailing winds are
Meteorol. Z., 21, 2012 M. O. Letzel et al.: LES case study on pedestrian level ventilation in two neighbourhoods 577
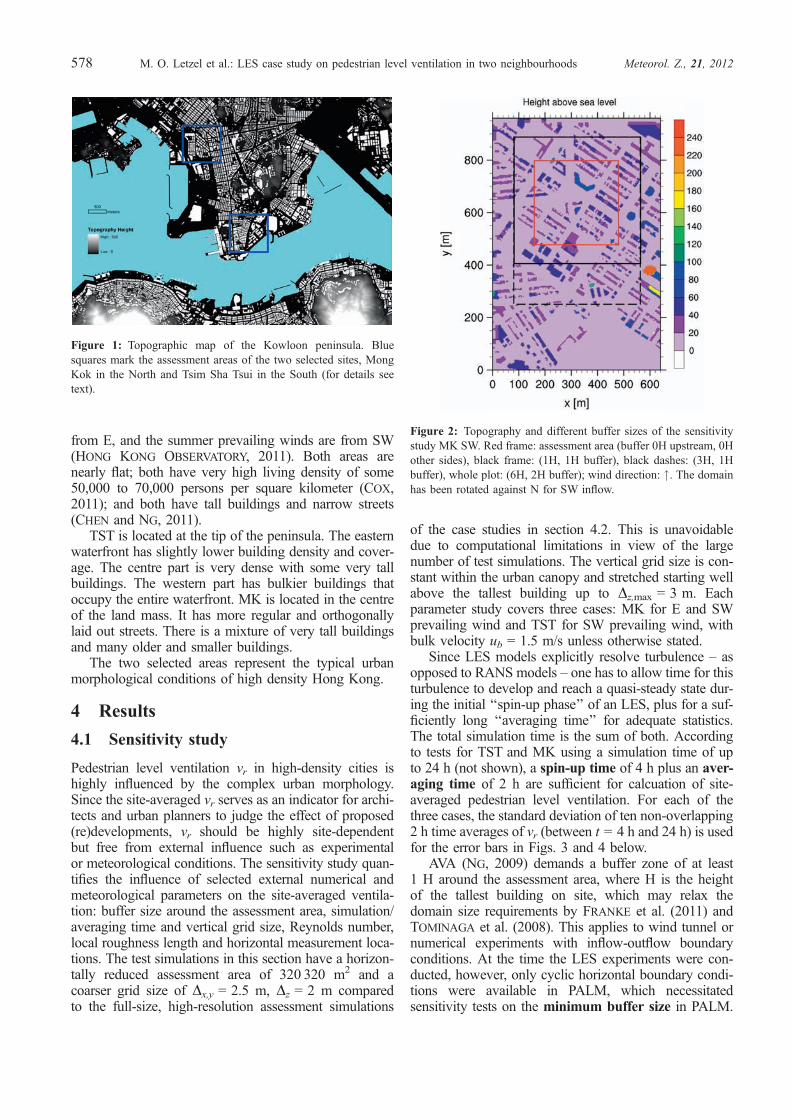
from E, and the summer prevailing winds are from SW(HONG KONG OBSERVATORY, 2011). Both areas arenearly flat; both have very high living density of some50,000 to 70,000 persons per square kilometer (COX,2011); and both have tall buildings and narrow streets(CHEN and NG, 2011).
TST is located at the tip of the peninsula. The easternwaterfront has slightly lower building density and cover-age. The centre part is very dense with some very tallbuildings. The western part has bulkier buildings thatoccupy the entire waterfront. MK is located in the centreof the land mass. It has more regular and orthogonallylaid out streets. There is a mixture of very tall buildingsand many older and smaller buildings.
The two selected areas represent the typical urbanmorphological conditions of high density Hong Kong.
4 Results
4.1 Sensitivity study
Pedestrian level ventilation vr in high-density cities ishighly influenced by the complex urban morphology.Since the site-averaged vr serves as an indicator for archi-tects and urban planners to judge the effect of proposed(re)developments, vr should be highly site-dependentbut free from external influence such as experimentalor meteorological conditions. The sensitivity study quan-tifies the influence of selected external numerical andmeteorological parameters on the site-averaged ventila-tion: buffer size around the assessment area, simulation/averaging time and vertical grid size, Reynolds number,local roughness length and horizontal measurement loca-tions. The test simulations in this section have a horizon-tally reduced assessment area of 320Æ320 m2 and acoarser grid size of Dx,y = 2.5 m, Dz = 2 m comparedto the full-size, high-resolution assessment simulations
of the case studies in section 4.2. This is unavoidabledue to computational limitations in view of the largenumber of test simulations. The vertical grid size is con-stant within the urban canopy and stretched starting wellabove the tallest building up to Dz,max = 3 m. Eachparameter study covers three cases: MK for E and SWprevailing wind and TST for SW prevailing wind, withbulk velocity ub = 1.5 m/s unless otherwise stated.
Since LES models explicitly resolve turbulence – asopposed to RANS models – one has to allow time for thisturbulence to develop and reach a quasi-steady state dur-ing the initial ‘‘spin-up phase’’ of an LES, plus for a suf-ficiently long ‘‘averaging time’’ for adequate statistics.The total simulation time is the sum of both. Accordingto tests for TST and MK using a simulation time of upto 24 h (not shown), a spin-up time of 4 h plus an aver-aging time of 2 h are sufficient for calcuation of site-averaged pedestrian level ventilation. For each of thethree cases, the standard deviation of ten non-overlapping2 h time averages of vr (between t = 4 h and 24 h) is usedfor the error bars in Figs. 3 and 4 below.
AVA (NG, 2009) demands a buffer zone of at least1 H around the assessment area, where H is the heightof the tallest building on site, which may relax thedomain size requirements by FRANKE et al. (2011) andTOMINAGA et al. (2008). This applies to wind tunnel ornumerical experiments with inflow-outflow boundaryconditions. At the time the LES experiments were con-ducted, however, only cyclic horizontal boundary condi-tions were available in PALM, which necessitatedsensitivity tests on the minimum buffer size in PALM.
Figure 2: Topography and different buffer sizes of the sensitivitystudy MK SW. Red frame: assessment area (buffer 0H upstream, 0Hother sides), black frame: (1H, 1H buffer), black dashes: (3H, 1Hbuffer), whole plot: (6H, 2H buffer); wind direction: ". The domainhas been rotated against N for SW inflow.
Figure 1: Topographic map of the Kowloon peninsula. Bluesquares mark the assessment areas of the two selected sites, MongKok in the North and Tsim Sha Tsui in the South (for details seetext).
578 M. O. Letzel et al.: LES case study on pedestrian level ventilation in two neighbourhoods Meteorol. Z., 21, 2012

Four buffer sizes have been tested (upstream buffer/buf-fer at three other sides, in units of H): (0,0), (1,1), (3,1),(6,2). Within the buffer zones, buildings were modelledbased on DEM data just as inside the assessment area.As an example, Fig. 2 shows the location of the bufferzones relative to the assessment area for MK SW. Hereand in the following, the site-averaged vr is the horizontalaverage of vr of the assessment area only (i.e. excludingany buffer zone). Fig. 3 shows that, as expected, a zero(0,0) buffer size is insufficient, since results significantlydeviate from the other buffers. Since the flow quicklyadjusts to the large roughness of the modelled buildingswithin the buffer zone, results using the three other buffersizes agree quite well (within model uncertainty), whichsuggests that the AVA standard (1,1) buffer also appliesto 30 cyclic boundary conditions at these sites. However,there is an exception, MK SW buffer (3,1), where thesite-averaged ventilation vr is significantly enhanceddue to artificial diagonal channeling (cf. Fig. 2). Thisexample demonstrates that such buffers should notblindly be adopted to new sites without careful qualityassurance. However, for the purpose of this investigationthe AVA standard (1,1) buffer is proven sufficient.
PALM’s staggered grid implies a vertical grid size ofDz = 0.8 m in order to measure at the pedestrian levelzp = 2 m in accordance with AVA. Moving thismeasure-ment height to 2.5 m would allow to use Dz = 1 m. Thissaved ~22% of simulation cost in performance tests.
Sensitivity tests (not shown) did not reveal any signifi-cant difference (within numerical uncertainty) betweenzp = 2 m (Dz = 0.8 m) and zp = 2.5 m (Dz = 1 m).Therefore zp = 2.5 m (Dz = 1 m) is used in the followingsections.
Some urban structures may not be included in theDEM data or may be subgrid-scale in PALM, yet theyhave the potential to slow down the flow. For example,Hong Kong’s ubiquitous projecting obstructions are notpart of the DEM dataset. PALM uses rough walls to qual-itatively account for their effect. The same local rough-ness length z0 is applied in each local grid boxadjacent to a horizontal or vertical surface. Three z0 val-ues are considered: 0.1 m: very rough walls due to largevertical projections that are not included in the DEM data(e.g. Fig. 10.18 in NG, 2010), 0.05 m: moderately roughwalls e.g. with air conditioning appliances, 0.01 m: rela-tively smooth walls. As expected, the sensitivity of vr tolocal roughness length z0 (Fig. 4) is significant, but onlyfor TST SW and MK SW, not for MK E. This is likelydue to the skimming flow observed in large parts ofMK E, which leads to a very low ventilation regardlessof the wall roughness. Wind tunnel obstacles need tobe sufficiently aerodynamically rough in order to avoidlocal flow relaminarization, i.e. wind tunnel models alsohave rough walls. The full-scale roughness z0 of woodenwind tunnel obstacles is not negligible. Since AVA doesnot require to quantify z0, CFD and wind tunnel resultsmay not be comparable if their local z0 is unknown.
As expected, in a fully turbulent regime vr does notdepend on Reynolds number Re ¼ ubHav
vm, where Hav is
the average building height and vm is molecular viscosity.This was confirmed by tests comparing Re = 1.7Æ106,3.3Æ106, 1.1Æ107 (not shown). This allows to save simula-tion cost by using v1 � 2 m/s which is lower than theobserved annual mean of 6 to 8 m/s (cf. section 1).
AVA sets no explicit standard on representativenessof measurement locations. However, measurement tech-niques/accuracy often demand wind tunnel measure-ments at canyon centers or open spaces, for example.Yet these locations mainly represent areas with relativelylarge vr. Indeed, Fig. 5 highlights a strong dependency ofvr on horizontal measurement locations (measurementlocated at least ‘‘n’’ grid boxes away from the nearestvertical wall, for details cf. Fig. 5). Without a clear stan-dard on representativeness, different AVA studies maynot be comparable. In order to account for weak andstrong wind regions alike, n = 3 is used in the followingsections. However, the results are expected to underpre-dict those wind tunnel measurements that focus on can-yon centers or open spaces (corresponding to largervalues of n).
4.2 Case Studies
High-resolution assessment simulations are carried outwhich form the basis of the following case studies. Based
Figure 3: Sensitivity of site-averaged ventilation vr to buffer size(H) for TST (SW wind) and MK (E and SW wind). The x-ordinatesof MK E and TST SW are slightly displaced for the sake of bettervisibility.
Figure 4: Sensitivity of site-averaged ventilation vr to localroughness length z0 (m) for TST (SW wind) and MK (E and SWwind). The x-ordinates of MK E and TST SW are slightly displacedfor the sake of better visibility.
Meteorol. Z., 21, 2012 M. O. Letzel et al.: LES case study on pedestrian level ventilation in two neighbourhoods 579

on section 4.1, the high-resolution LES for MK and TSTunder E and SW prevailing wind have the following set-up: spin-up time 4 h plus averaging time 2 h, a buffer sizeof ~ 1 H in all directions, zp = 2.5 m (Dx,y,z = 1 m), localz0 = 0.1 m (estimated based on site inspection),Re = 3.3Æ106, n = 3, and domain size (1.6 km)2Æ400 m(7.2Æ108 grid points).
An exception is the comparison TST SW with versuswithout a recently constructed 210 m super tall building(Fig. 7) which is conducted with a domain size of 1.6kmÆ2 kmÆ960 m (1.6Æ109 grid points).
4.2.1 Exemplary LES results
Figs. 6 & 7 show some exemplary results. As expectedfor E wind, Fig. 6a shows large vr in long, almost E-Woriented streets (channeling) and low vr in streets thatare laid out perpendicular to the ambient wind directionand in other areas without a connecting ventilation path.Interestingly, the rather isolated 110 m tall building aty = 175 m locally also enhances vr. Fig. 6b clearly dem-onstrates that this is due to vertical advection: the largedowndraught upstream/updraught downstream is bal-anced by a strong low (pedestrian) level flow around thisbuilding. Vertical advection induced by the same buildingis also obvious in the passive tracer turbulence animationby LETZEL and GAUS (2008) – for details cf. LETZELet al., 2008a. This example shows that isolated tall build-ings have the potential to locally enhance vr.
However, the downside of isolated tall buildings isthat they reduce wind availability further downstream,which can affect a large wake area (KATAOKA et al.,2007). Fig. 7a shows that for SW wind, the new210 m super tall building leads to a dramatic reduction
of vr in a region as far as 600~700 m (~3H !) downstreambecause its large wake reduces wind availability at rooflevel in that region (z = 100 m, y = 800~850 m, Fig. 7b).
4.2.2 Validation of LES results with wind tunnelmeasurements
Since there are no established guidelines for the valida-tion of turbulence-resolving CFD codes such as LESand DNS, the best possible validation at present usingthe available data is a cross-comparison of vr derivedfrom wind tunnel measurements and vr extracted fromLES.
Wind tunnel (WT) measurements of vr at the pedes-trian level in the same urban areas are conducted usingthe wind tunnel facilities at Hong Kong University ofScience and Technology1. The tests were conducted inaccordance to the international practice requirements(AWES, 2001; ASCE, 1999). Wind velocities were mea-sured at 5 mm from the ground in the 1:400 model. Thiscorresponds to 2 m in reality. Coupled with the readingsat the boundary layer level of 500 m, the wind velocityratio vr of the test points can be computed.
In order to improve representativeness (cf. SCHATZ-MANN and LEITL, 2009, 2011), instead of a point to pointdirect comparison, a zonal comparison is made based onvr of various urban morphologies. The test points werecategorized into several groups, according to their differ-ent surrounding morphologies, as defined in column 1 ofTable 1. The vr of the wind tunnel measurements and thesimulated LES results are as respectively in column 2 and3 of Table 1. Additionally, column 4 displays normalizedLES data (multiply vr (LES) by the average ratio vr (WT)/vr (LES) in the total assessment area). The purpose ofcolumn 4 is to check whether both tools, WT and LES,are equally able to emphasize the relative differencesbetween the different morphology zones. This ability isrequired for a practical planning tool so that urban plan-ners can clearly evaluate different planning scenarios ascompared to the current state. Column 5 specifies thezonal test points.
The correlation between the two sets of results isshown in Fig. 8, and R2 = 0.91 (column 2 vs. column3, before normalization) and R2 = 0.93 (column 2 vs.column 4, after normalization) are obtained.
Bothwind tunnel and LES studies report vr in the rangeof 0.14 to 0.35. The difference between the unobstructedopen spaces and the more obstructed in-land urban areasis around 3 times. Examining the impact of the street ori-entation, vr in the parallel streets shows a highermagnitudethan that in the perpendicular streets, meaning thatthe channeling flow dominates the ventilation in theassessment area, i.e. air path creation along the most fre-
Figure 5: Sensitivity of site-averaged ventilation vr to horizontalmeasurement locations (calculation of site-average starts at the nth
grid point adjacent to vertical walls, i.e. the first n-1 grid pointsadjacent to vertical walls are excluded from the site-average) forTST (SW wind) and MK (E and SW wind).
1Technical reports are available from http://www.pland.gov.hk/pland_en/p_study/prog_s/ucmapweb/.
580 M. O. Letzel et al.: LES case study on pedestrian level ventilation in two neighbourhoods Meteorol. Z., 21, 2012

quent incoming flow direction is an important consider-ation in urban planning. Table 1 also shows that the differ-ences betweennarrowandmain streets flows are not big. Inview of the J40 m tall buildings that form most of thestreet canyons considered here, the increase in canyonwidth from ~10 m (narrow streets) to ~15 m (main streets)
is only slight and hence cannot substantially improve thedeep canyon flow regime.
Overall, the validation shows a good correlationbetween LES results and WT measurements for the samesites based on a local, zonal comparison.
Figure 6: Time-averaged ventilation pattern for TST E, zoomed into part of the assessment area. (a) Horizontal cross-section of vr atpedestrian level (vr: green-red colour scale; building heights: white-blue colour scale). Wind direction: . (b) Vertical (xz) cross-section ofvertical velocity w at y = 175 m with an overlay vector plot of the velocity components (u,w) in that sectional plane. Wind direction: .
Figure 7: Difference in time-averaged ventilation pattern for the 1 km2 assessment area of TST SW with (TB) minus without (STD) arecently constructed 210 m super tall building (visible in black at x = 500 m, y = 150 m). (a) Horizontal cross-section of ventilationdifference vr,TB � vr,STD at pedestrian level in blue-red colour scale (building heights in greyscale). Wind direction: ". (b) Vertical (yz)cross-section of absolute velocity difference |v|TB � |v|STD at x = 500 m. Wind direction: !.
Meteorol. Z., 21, 2012 M. O. Letzel et al.: LES case study on pedestrian level ventilation in two neighbourhoods 581

4.2.3 LES vr comparison studies
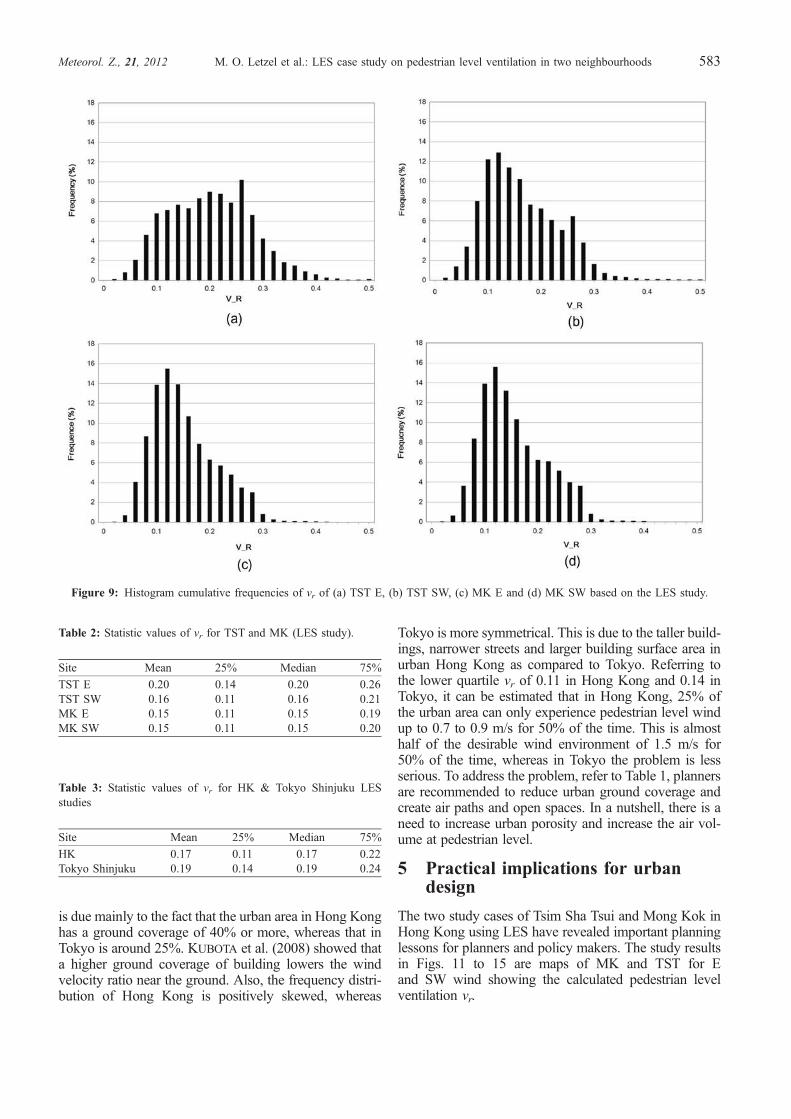
The LES study result can report a continuous two-dimen-sional distribution of vr of the whole assessment area; thefrequency distribution of vr in each assessment area canalso be calculated. This gives a quantitative understand-ing of the air ventilation performance of the areas. Thevr frequency histograms of TST and MK under E andSW wind are plotted in Fig. 9. The mean, median, upperand lower quantiles of vr are presented in Table 2.
Note that for TST, for E wind, the vr found is notice-ably larger than for SW wind; the mean vr is 0.20 forTST E versus 0.15 and 0.16 for the other cases. This isdue to the unobstructed waterfront of TST in the East.
For TST, when wind comes from SW it has to travel overa long stretch of urban areas before arriving at the studyarea. For MK, the reported vr for E and SW wind are sim-ilar. This is due to the homogenous urban surroundings.The reported mean vr of 0.15 is comparable to the meanvr of TST for SW wind. It is of interest to note that thestreet grid of MK is north-south orientated. One wouldtherefore expect to see a larger mean vr, or a more pro-found difference of vr for streets parallel and perpendicu-lar to the wind direction for the East wind simulation ascompared to the vr results for SW wind. This appears notto be the case. It may be due to the very high roughnessof the city areas where flows are highly mixed and turbu-lent. The traditional way of examining wind flow basedon the simple canyon flow schema may not thereforebe the most appropriate. A different understanding maybe demanded here.
All in all, for inland urban areas in Hong Kong, theLES study suggests a median vr on the order of 0.15.Allowing a typical v1 = 6 to 8 m/s at 500 m aboveground in Hong Kong, a median vr of 0.15 can translateto wind speeds of around 1 m/s for 50% of the time.However, an urban thermal comfort study by CHENG
and NG (2006) states the need for 1.5 m/s wind for50% of the time for human urban thermal comfort intropical cities. Therefore, the LES results indicate thatin urban Hong Kong, the wind environment needs tobe improved by better urban planning and buildingdesign.
4.2.4 A comparison study of vr between urbanHong Kong and Metropolitan Tokyo
A comparative study of the distribution of vr of HongKong, Tsim Sha Tsui and Tokyo, Shinjuku is made. Bothare typical of areas of high building density in Hong Kongand Tokyo, respectively. The Tokyo data is taken fromLETZEL (2007). Statistical values of vr in Hong Kongand Tokyo are listed in Table 3, and a histogram showingthe frequency distribution of vr is presented in Fig. 10.The vr of Hong Kong is lower than that of Tokyo. This
Table 1: A zonal comparison of vr between LES results and WT results. Main streets refer to streets with width approximately equal to orlarger than 15 meters, and narrow streets refer to those with width less than 10 meters. High ground coverage (GC) refers to areas with GClarger than 60% and low GC refers to areas with GC lower than 20%, while mid GC refers to those in between. Test points are labelledaccording to their definition in HONG KONG PLANNING DEPARTMENT (2008, pp. 41-46).
Zones of urban morphology vr (WT) vr (LES) vr (LES, normalized) Test points
Narrow streets (canyon flow) 0.14 0.11 0.14 TSA26, TSC19, TSC24Main streets (canyon flow) 0.15 0.12 0.15 TSA01, TSA03, TSA05, TSA06, TSA10,TSB16, TSC29Narrow streets (parallel flow) 0.22 0.20 0.25 TSA09, TSA11Main streets (parallel flow) 0.24 0.22 0.28 TSA25, TSA29, TSA30, TSB08High ground coverage 0.13 0.11 0.14 TSA04, TSA14, TSA20, TSA26, TSA27Mid ground coverage 0.23 0.21 0.27 TSB05, TSB09, TSB13, TSB15, TSB23, TSB24, TSB25Low ground coverage 0.34 0.24 0.32 TSB19, TSC26, TSC31, TSC33Waterfront/open spaces 0.33 0.28 0.35 TSC34Total assessment area 0.22 0.18 0.22 All
Figure 8: (a) A correlation between vr of LES and WT. (b) Acorrelation between vr of LES and WT. The WT and the LES dataare normalized using the average vr of the assessment area.
582 M. O. Letzel et al.: LES case study on pedestrian level ventilation in two neighbourhoods Meteorol. Z., 21, 2012
is due mainly to the fact that the urban area in Hong Konghas a ground coverage of 40% or more, whereas that inTokyo is around 25%. KUBOTA et al. (2008) showed thata higher ground coverage of building lowers the windvelocity ratio near the ground. Also, the frequency distri-bution of Hong Kong is positively skewed, whereas
Tokyo is more symmetrical. This is due to the taller build-ings, narrower streets and larger building surface area inurban Hong Kong as compared to Tokyo. Referring tothe lower quartile vr of 0.11 in Hong Kong and 0.14 inTokyo, it can be estimated that in Hong Kong, 25% ofthe urban area can only experience pedestrian level windup to 0.7 to 0.9 m/s for 50% of the time. This is almosthalf of the desirable wind environment of 1.5 m/s for50% of the time, whereas in Tokyo the problem is lessserious. To address the problem, refer to Table 1, plannersare recommended to reduce urban ground coverage andcreate air paths and open spaces. In a nutshell, there is aneed to increase urban porosity and increase the air vol-ume at pedestrian level.
5 Practical implications for urbandesign
The two study cases of Tsim Sha Tsui and Mong Kok inHong Kong using LES have revealed important planninglessons for planners and policy makers. The study resultsin Figs. 11 to 15 are maps of MK and TST for Eand SW wind showing the calculated pedestrian levelventilation vr.
Figure 9: Histogram cumulative frequencies of vr of (a) TST E, (b) TST SW, (c) MK E and (d) MK SW based on the LES study.
Table 2: Statistic values of vr for TST and MK (LES study).
Site Mean 25% Median 75%
TST E 0.20 0.14 0.20 0.26TST SW 0.16 0.11 0.16 0.21MK E 0.15 0.11 0.15 0.19MK SW 0.15 0.11 0.15 0.20
Table 3: Statistic values of vr for HK & Tokyo Shinjuku LESstudies
Site Mean 25% Median 75%
HK 0.17 0.11 0.17 0.22Tokyo Shinjuku 0.19 0.14 0.19 0.24
Meteorol. Z., 21, 2012 M. O. Letzel et al.: LES case study on pedestrian level ventilation in two neighbourhoods 583

The Government of Hong Kong has, since 2006, pub-lished a set of urban planning guidelines (HONG KONG
PLANNING DEPARTMENT, 2009). Best practice sugges-tions have been developed for different district levelsand different site levels (Table 4). It is possible to elabo-rate some of these best practices based on the LESstudies.
Regarding breezeways and air paths, the LES simula-tion results reveal that wide breezeways in the directionof the winds have higher vr in the order of 0.2 to 0.3. Nar-rower air paths can still have vr in the range of 0.1 to 0.2.Interconnected breezeways and air paths are particularlyconducive to urban air ventilation. Dead ends and cornerswith low vr of 0.05 or less should be avoided. The impor-tance of the width of the air path can be noted in the num-
ber of narrow streets (x = 450 m, y = 450 m; x = 470 m,y = 550 m) in Fig. 13. It can be noted that wind from theEast has difficulties penetrating the narrow streetseffectively even though the streets are parallel to theincoming wind. The same can also be observed atx = 900 m, y = 250 m of Fig. 12. vr along thestreet also quickly decreases and vr near the exit of thestreets is low.
Regarding the street orientation, the results show thatnarrow streets perpendicular to the wind direction havelow vr of 0.1 or less. Whereas, streets that are parallelto the wind can mostly enjoy vr of 0.1 and above. Theobservation is not straight forward and can depend onthe width of the street as well as the building heights
Figure 10: Histograms of vr frequencies of Tokyo (Shinjuku) andHong Kong. The Hong Kong data includes vr of TST E, TST SW,MK E and MK SW.
Figure 11: Pedestrian level vr at Mong Kok for East wind.
Figure 12: Pedestrian level vr at Mong Kok for Southwest wind.
Figure 13: Pedestrian level vr at Tsim Sha Tsui for East wind.
584 M. O. Letzel et al.: LES case study on pedestrian level ventilation in two neighbourhoods Meteorol. Z., 21, 2012
on both sides of the street. For example, for TST underEast wind (Fig. 13), the wide street in the middle has highvr despite the fact that it is perpendicular to the incomingwind. As to the street pattern, it is noted that at x = 950m, y = 850 m of Fig. 12, the dead end has caused vr todecrease way before the street terminates. The low vr, oflower than 0.1, over a length of street 150 m long ishighly undesirable in terms of urban thermal comfort inthe hot and humid summer months of Hong Kong (NG
and CHENG, 2012).Waterfront sites with buildings that are well spaced
can allow the incoming sea breezes coming into theurban areas. This is evident in the TST under East windstudy. vr of up to 0.4 well into the inland areas can benoted (Fig. 13).
As to building height profile, it is noted that a goodvariation of building heights in close proximity is goodfor urban ventilation as it promotes mixing and down-washes. The benefits are particularly noticeable whenthere is an open space in front or even behind the tallbuilding. It seems that wind follows the building andspiral down to the open space before dispersing intothe surrounding narrow 30 sites. This is evident with atall building located at x = 200 m, y = 600 m in Fig.13 (cf. x = 120 m, y = 175 m in Fig. 6).
The importance of interconnected open spaces can beseen at x = 650 m, y = 550 m of Fig. 13. Here a buildingcuts the open space into two and thus greatly reduces thevr at its wakes by 0.05-0.1. In future, such planningshould be avoided.
The effects of large podium structure to urban ventila-tion are most noticeable when the surrounding streets arenarrow. In Mong Kok, the reduced air space has createdvery low vr regardless of the orientation of the streets. Inaddition, it can be noted that urban areas of high groundcoverage generally have lower vr (KUBOTA et al., 2008).
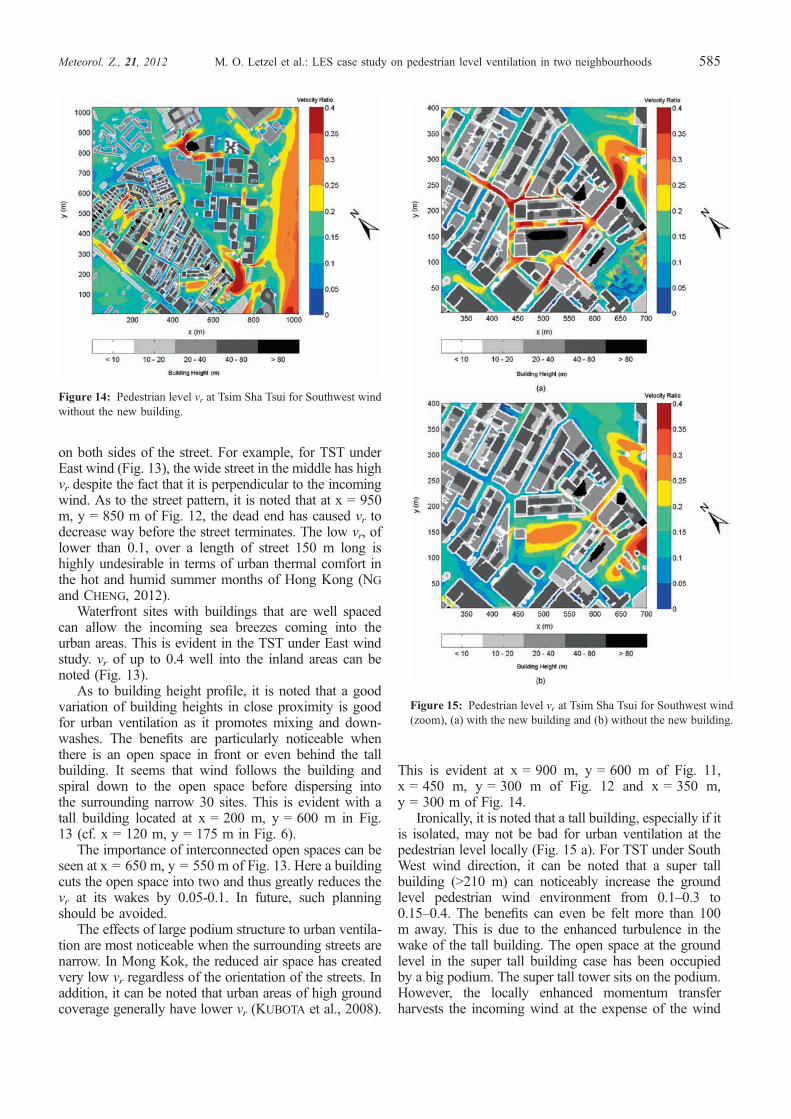
This is evident at x = 900 m, y = 600 m of Fig. 11,x = 450 m, y = 300 m of Fig. 12 and x = 350 m,y = 300 m of Fig. 14.
Ironically, it is noted that a tall building, especially if itis isolated, may not be bad for urban ventilation at thepedestrian level locally (Fig. 15 a). For TST under SouthWest wind direction, it can be noted that a super tallbuilding (>210 m) can noticeably increase the groundlevel pedestrian wind environment from 0.1–0.3 to0.15–0.4. The benefits can even be felt more than 100m away. This is due to the enhanced turbulence in thewake of the tall building. The open space at the groundlevel in the super tall building case has been occupiedby a big podium. The super tall tower sits on the podium.However, the locally enhanced momentum transferharvests the incoming wind at the expense of the wind
Figure 14: Pedestrian level vr at Tsim Sha Tsui for Southwest windwithout the new building.
Figure 15: Pedestrian level vr at Tsim Sha Tsui for Southwest wind(zoom), (a) with the new building and (b) without the new building.
Meteorol. Z., 21, 2012 M. O. Letzel et al.: LES case study on pedestrian level ventilation in two neighbourhoods 585

available further downstream (Fig. 7; see also KATAOKA
et al., 2007).
6 Conclusions
The sensitivity study suggests that cyclic LES with a buf-fer zone of 1H around the assessment area is normallyacceptable to obtain pedestrian level ventilation vr fornearly flat sites, where H the height of the tallest buildingon site. The observed strong dependency of vr on bothlocal wall roughness and measurement locations, forwhich the air ventilation assessment (AVA) sets no clearstandards, points at possible AVA clarifications, other-wise CFD and wind tunnel studies may not becomparable.
Case studies revealed the ambivalent character of iso-lated tall buildings: locally they may enhance vr, but theycan reduce wind availability as far as 3H downstream. Toaccount for these adverse downstream effects, therequired AVA assessment area (currently: radius �1H)could be enlarged. It can be noted that the wind environ-ment depends greatly on the urban morphology of thecity. Air paths, street orientations, ground coverage, sitesfronting the water, inter connectivity of spaces, buildingpodium size and building heights can all affect the pedes-trian wind environment. For planners, getting some ofthese parameters right is very important. It is useful infurther parametric studies to understand them beyondwhat can be deduced from results of this study.
Finally, it should be noted that this urban LES casestudy only used a very limited number of test sites andapproach wind conditions. Therefore, any implied AVAimprovements must be considered tentative until a possi-ble universal validity has been confirmed by further para-metric studies on idealized, generic city quarters. Sincethese were beyond the scope of this feasibility study, theyare recommended for further research.
Acknowledgments
Financial support by a Chinese University of Hong KongSocial Science Panel Direct Grant, by the German
Research Foundation (DFG) under grant RA 617/15-1/2 and by the German National Academic Exchange Ser-vice (DAAD) is gratefully acknowledged. GIS data ofHong Kong were provided by the HKSAR PlanningDepartment under the project ‘‘Urban Climatic Mapand Standards for Wind Environment’’. The simulationsworth 1.4 M€ were performed on the North German su-percomputing center HLRN (www.hlrn.de). The authorsare grateful to two anonymous reviewers who providedvaluable comments.
References
AIAA, 1988: Guide for the verification and validation ofcomputational fluid dynamics simulations. TechnicalReport AIAA G-077–1998.
Akashi, T., 2008: Creating the ‘‘wind paths’’ in the city tomitigate urban heat island effects – a case study in centraldistrict of Tokyo. – In: Proceedings of COBRA 2008 theconstruction and building research conference of the RoyalInstitution of Chartered Surveyors, Sept 2008, DublinInstitute of Technology, Ireland, 1–11.
Arakawa, A., V. R. Lamb, 1977: Computational design ofthe basic dynamical processes of the UCLA generalcirculation model. – In: J. Chang (Ed.), General circula-tion models of the atmosphere, volume 17 of Methods inComputational Physics, Academic Press, 173–265.
ASCE, 1999: Manual and Report on Engineering PracticeNo. 67 for Wind Tunnel Studies of Buildings andStructures. – American Society of Civil Engineers,Virginia, USA.
Ashie, Y., T. Kono, 2011: Urban-scale CFD analysis insupport of a climate-sensitive design for the Tokyo bayarea. – Int. J. Climatol. 31, 174–188. DOI:10.1002/joc.2226
Atkinson, B. W., 2003: Numerical modeling of urban heatisland intensity. – Bound.-Lay. Meteorol. 109, 285–310.DOI:10.1023/A:1025820326672
AWES, 2001: Wind Engineering Studies of Buildings. –Australasian Wind Engineering Society, Australia.
Bartzis, J. G., D. Vlachogiannis, A. Sfetsos, 2004: Bestpractice advice for environmental flows, QNET-CFDnetwork newsletter. – Technical Report 2 (4), QNET-CFD.
Blocken, B., T. Stathopoulos, J. Carmeliet, J. L. M.Hensen, 2011: Application of computational fluid dynam-ics in building performance simulation for the outdoorenvironment: an overview. – Journal of Building Perfor-mance Simulation 4, 157–184. DOI:10.1080/19401493.2010.513740
Bohnenstengel, S., K. H. Schlunzen, D. Grawe, 2004:Influence of thermal effects on street canyon circulations. –Meteorol. Z. 13, 381–386. DOI:10.1127/0941-2948/2004/0013-0381
Briscolini, M., P. Santangelo, 1989: Development of themask method for incompressible unsteady flows. – J.Comput. Phys. 84, 57–75. DOI: 10.1016/0021-9991(89)90181-2
Table 4: District levels and site levels for which best practiceguidelines on urban ventilation are given in the Hong KongPlanning Standards and Guidelines (HONG KONG PLANNINGDEPARTMENT (2009).
District level Site Level
Site Disposition Podium StructureBreezeways/Air Paths Building DispositionStreet Orientation, Patternand Widening
Building Permeability
Waterfront Sites Building Height and FormHeight Profile LandscapingGreening and Disposition of OpenSpace and Pedestrian Area
Projecting Obstructions
586 M. O. Letzel et al.: LES case study on pedestrian level ventilation in two neighbourhoods Meteorol. Z., 21, 2012

Cai, X.-M., 2012: Effects of wall heating on flow charac-teristics in a street canyon. – Bound.-Lay. Meteorol. 142,443–467. DOI:10.1007/s10546-011-9681-6
Chen, L., E. Ng, 2011: Quantitative urban climate mappingbased on a geographical database: a simulation approachusing hong kong as a case study. – Int. J. Appl. Earth Obs.13, 586–594. DOI:10.1016/j.jag.2011.03.003
Cheng, V., E. Ng, 2006: Thermal comfort in urban openspaces for Hong Kong. – Architectural Science Review 49,236–242. DOI:10.3763/asre.2006.4932
Chu, A. K. M., R. C. W. Kwok, K. N. Yu, 2005: Study ofpollution dispersion in urban areas using ComputationalFluid Dynamics (CFD) and Geographic InformationSystem (GIS). – Envion. Modell. Softw. 20, 273–277.DOI:10.1016/j.envsoft.2004.05.007
Cionco, R. M., 1997: High resolution urban morphologydata for urban wind flow modeling. – Atmos. Environment32, 7–17. DOI: 10.1016/S1352-2310(97)00274-4
Coceal, O., S. E. Belcher, 2005: Mean winds through aninhomogeneous urban canopy. – Bound.-Lay. Meteorol.115, 47–68. DOI:10.1007/s10546-004-1591-4
Coceal, O., T. G. Thomas, I. P. Castro, S. E. Belcher,2006: Mean flow and turbulence statistics over groups ofurban-like cubical obstacles. – Bound.-Lay. Meteorol. 121,491–519. DOI:10.1007/s10546-006-9076-2
Cox, W., 2011: Demographia, world urban areas (worldagglomerations). – 7th annual edition. www.demogra-phia.com/db-worldua.pdf, accessed on 1 April 2012.
Deardorff, J. W., 1980: Stratocumulus-capped mixed layersderived from a three-dimensional model. – Bound.-Lay.Meteorol. 18, 495–527. DOI:10.1007/BF00119502
Franke, J., 2006: Recommendations of the COST actionC14 on the use of CFD in predicting pedestrian windenvironment. – In: The Fourth International Symposiumon Computational Wind Engineering, Yokohama, Japan.
Franke, J., C. Hirsch, A. G. Jensen, H. W. Krus, M.Schatzmann, P. S. Westbury, S. D. Miles, J. A. Wisse,N. G. Wright, 2004a: Recommendations on the use ofCFD in predicting pedestrian wind environment. – In: J. P.A. J. van Beeck (Ed.), Proceedings of the InternationalConference on Urban Wind Engineering and BuildingAerodynamics, 5-7 May 2004. von Karman Institute, Sint-Genesius-Rode, Belgium.
Franke, J., C. Hirsch, A. G. Jensen, H. W. Krus, M.Schatzmann, P. S. Westbury, S. D. Miles, J. A. Wisse,N. G. Wright, 2004b: Recommendations on the use ofCFD in wind engineering. – In: J. P. A. J. van Beeck
(Ed.), Proceedings of the International Conference onUrban Wind Engineering and Building Aerodynamics, 5–7May 2004. von Karman Institute, Sint-Genesius-Rode,Belgium. COST Action C14, Impact of Wind and Stormon City Life Built Environment.
Franke, J., A. Hellsten, H. Schlunzen, B. Carissimo,2011: The COST 732 best practice guideline for CFDsimulation of flows in the urban environment: a summary.– Int. J. Environ. Poll. 44, 419–427. DOI:10.1504/IJEP.2011.038443
Gousseau, P., B. Blocken, T. Stathopoulos, van G. J. F.Heijst, 2011: CFD simulation of near- field pollutantdispersion on a high-resolution grid: A case study by LESand RANS for a building group in downtown Montreal. –Atmos. Environment. 45, 428–438. DOI:10.1016/j.atmosenv.2010.09.065
Hanna, S. R., S. Tehranian, B. Carissimo, R. W.MacDonald, R. Lohner, 2002: Comparisons of modelsimulations with observations of mean flow and turbulencewithin simple obstacle arrays. – Atmos. Environment 36,5067–5079. DOI:10.1016/S1352-2310(02)00566-6
Harlow, F. H., J. E. Welch, 1965: Numerical calculation oftime-dependent viscous incompressible flow of fluid withfree surface. – Phys. Fluids. 8, 2182–2189. DOI:10.1063/1.1761178
HONG KONG OBSERVATORY, 2011: Summary of meteoro-logical and tidal observations in Hong Kong 1999-2010.www.weather.gov.hk/publica/pubsmo.htm, accessed on 18April 2012.
HONG KONG PLANNING DEPARTMENT, 2008: Urban climaticmap and standards for wind environment - feasibilitystudy, working paper 2B: Wind tunnel benchmarkingstudies, batch I. Technical report, The Government of theHong Kong Special Administrative Region.
HONG KONG PLANNING DEPARTMENT, 2009: Hong KongPlanning Standards and Guidelines. www.pland.gov.hk/pland_en/tech_doc/hkpsg, accessed on 1 April 2012.
Kanda, M., A. Inagaki, T. Miyamoto, 2012: Newaerodynamic parameterization for real urban surfacesderived from LES. – In: ICUC 8 – 8th InternationalConference on Urban Climates, 6th-10th August, 2012,UCD, Dublin Ireland, number 118.
Kataoka, H., T. Tamura, Y. Okuda, M. Ohashi, 2007:Numerical evaluation of the wake field behind high-risebuildings by RANS and LES. – Cross comparison amongcomputed and wind-tunnel experimental results. – In:Twelfth International Conference on Wind Engineering,Cairns, Australia.
Kubota, T., M. Miura, Y. Tominaga, A. Mochida, 2008:Wind tunnel tests on the relationship between buildingdensity and pedestrian-level wind velocity: Developmentof guidelines for realizing acceptable wind environment inresidential neighborhoods. – Building and Environment43, 1699–1708. DOI:10.1016/j.buildenv.2007.10.015
Letzel, M. O., 2007: Large-Eddy Simulation FeasibilityStudy of Tsim Sha Tsui, Kowloon, Project Report for‘‘Urban Climatic Map and Standards for Wind Environ-ment – Feasibility Study’’. Technical report, Hong KongPlanning Department, The Government of the Hong KongSpecial Administrative Region. 14 pp.
Letzel, M. O., G. Gaus, 2008: Turbulent flow in a denselybuilt-up area in Kowloon, downtown Hong Kong. –Dynamic Visualization in Science (13118) , http://palm.muk.uni-hannover.de/wiki/gallery/movies/city#dyvis_13118,accessed on 18 November 2012.
Letzel, M. O., M. Krane, S. Raasch, 2008a: Highresolution urban large-eddy simulation studies from street
Meteorol. Z., 21, 2012 M. O. Letzel et al.: LES case study on pedestrian level ventilation in two neighbourhoods 587

canyon to neighbourhood scale. – Atmos. Environment 42,8770–8784. DOI:10.1016/j.atmosenv.2008.08.001
Letzel, M. O., G. Gaus, S. Raasch, N. Jensen, M.Kanda, 2008b: Turbulent flow around high-rise officebuildings in downtown Tokyo. – Dynamic Visualization inScience (13110), http://palm.muk.uni-hannover.de/wiki/gallery/movies/city#dyvis_13110, accessed on 18 Novem-ber 2012.
Letzel, M., W. Bachlin, S. Raasch, M. Keck, 2012: LESruns with the model PALM for a model comparison (inGerman). Technical Report Project 61905-11-10, Inge-nieurburo Lohmeyer GmbH & Co. KG, KarlsruheResearch report for the BBK project No. 364 ‘‘Develop-ment of a tool for the optimization of emergency responsein case of hazmat release in urban areas’’ (in German),subcontracted by the University of Hamburg.
Li, X.-X., C.-H. Liu, D. Y. C. Leung, K. M. Lam, 2006:Recent progress in CFD modelling of wind field andpollutant transport in street canyons. – Atmos. Environ-ment 40, 5640–5658. DOI:10.1016/j.atmosenv.2006.04.055
Li, X.-X., R. E. Britter, T. Y. Koh, L. K. Norford, C.-H.Liu, D. Entekhabi, D. Y. C. Leung, 2010: Large-eddysimulation of flow and pollutant transport in urban streetcanyons with ground heating. – Bound.-Lay. Meteorol137, 187–204. DOI:10.1007/s10546-010-9534-8
Lin, C. Y., F. Chen, J. C. Huang, W. C. Chen, Y. A. Liou,W. N. Chen, S. C. Liu, 2008: Urban heat island effect andits impact on boundary layer development and land – seacirculation over northern Taiwan. – Atmos. Environment42, 5635–5649. DOI:10.1016/j.atmosenv.2008.03.015
Liu, Y. S., G. X. Cui, Z. S. Wang, Z. S. Zhang, 2011: Largeeddy simulation of wind field and pollutant dispersion indowntown macao. – Atmos. Environment 45, 2849–2859.DOI: 10.1016/j.atmosenv.2011.03.001
Macdonald, R. W., 2000: Modeling the mean velocityprofile in the urban canopy layer. – Bound.-Lay. Meteorol.97, 25–45. DOI:10.1023/A:1002785830512
Mills, G., H. Cleugh, R. Emmanuel, W. Endlicher, E.Erell, G. McGranahan, E. Ng, A. Nickson, J.Rosenthal, K. Steemer, 2010: Climate information forimproved planning and management of mega cities (needsperspective). – Procedia Environ. Sci. 1, 228–246.DOI:10.1016/j.proenv.2010.09.015
Mochida, A., I. Y. F. Lun, 2008: Prediction of windenvironment and thermal comfort at pedestrian level inurban area. – J. Wind Eng. Ind. Aerodyn. 96, 1498–1527.DOI:10.1016/j.jweia.2008.02.033
Neteler, M., H. Mitasova, 2007: Open Source GIS: AGrass GIS Approach. – Springer, 406 pp. DOI:10.1007/978-0-387-68574-8
Ng, E., 2009: Policies and technical guidelines for urbanplanning of high-density cities – air ventilation assessment(AVA) of Hong Kong. – Building and Environment 44,1478–1488. DOI:10.1016/j.buildenv.2008.06.013
Ng, E., editor, 2010: Designing High-Density Cities forSocial and Environmental Sustainability. – Earthscan,London, 432.
Ng, E., 2012: Towards planning and practical understandingof the need for meteorological and climatic information inthe design of high-density cities: A case-based study ofHong Kong. – Int. J. Climatol. 32, 582–598. DOI:10.1002/joc.2292
Ng, E., V. Cheng, 2012: Urban human thermal comfort inhot and humid Hong Kong. – Energy and Buildings, 55,51–65. DOI:10.1016/j.enbuild.2011.09.025
Ng, E., K. S. Wong, 2004: Efficiency and liveability:Towards sustainable habitation in Hong Kong. – In:International Housing Conference in Hong Kong. HongKong Housing Authority.
Offerle, B., I. Eliasson, C. S. B. Grimmond, B. Holmer,2007: Surface heating in relation to air temperature, windand turbulence in an urban street canyon. – Bound.-Lay.Meteorol 122, 273–292. DOI: 10.1007/s10546-006-9099-8
Park, S.-B., J.-J. Baik, S. Raasch, M. O. Letzel, 2012: Alarge-eddy simulation study of thermal effects on turbulentflow and dispersion in and above a street canyon. – J.Appl. Meteor. Clim. 51, 829–841, DOI:10.1175/JAMC-D-11-0180.1
Piacsek, S. A., G. P. Williams, 1970: Conservationproperties of convection difference schemes. – J. Comput.Phys. 6, 392–405. DOI:10.1016/0021-9991(70)90038-0
Raasch, S., M. Schroter, 2001: PALM – A large-eddysimulation model performing on massively parallel com-puters. – Meteorol. Z. 10, 363–372. DOI:10.1127/0941-2948/2001/0010-0363
Ren, C., E. Y.-Y. Ng, L. Katzschner, 2011: Urban climaticmap studies: a review. – Int. J. Climatol. 31, 2213–2233.DOI:10.1002/joc.2237
Rodi, W., J. H. Ferziger, M. Breuer, M. Pourquie (Eds.),1995: Workshop on Large Eddy Simulation of Flows pastBluff Bodies, Rottach-Egern, Germany.
Rodi, W., J. H. Ferziger, M. Breuer, M. Pourquie, 1997:Status of Large Eddy Simulation: Results of a workshop. –J. Fluids Eng. 119, 248–262. DOI:10.1115/1.2819128
Sagaut, P., 2006: Large Eddy Simulation for Incompress-ible Flows. – Springer-Verlag, Berlin/Heidelberg/NewYork, 556.
Scaperdas, A., S. G. Atkins, 2004: Best practice advice forcivil construction and HVAC, QNET-CFD network news-letter. – Technical Report 2(4), QNET-CFD.
Schatzmann, M., B. Leitl, 2009: Evaluation of numericalflow and dispersion models for appications in industrialand urban areas. – Chem. Eng. Technol. 32, 241–246.DOI:10.1002/ceat.200800578
Schatzmann, M., B. Leitl, 2011: Issues with validation ofurban flow and dispersion CFD models. – J. Wind Eng.Ind. Aerodyn. 99, 169–186. DOI:10.1016/j.jweia.2011.01.005
Schlunzen, K. H., D. Grawe, S. I. Bohnenstengel, I.Schluter, R. Koppmann, 2011: Joint modelling ofobstacle induced and mesoscale changes – current limitsand challenges. – Energy and Buildings 43, 1139–1148.DOI:10.1016/j.jweia.2011.01.009
Schumann, U., 1975: Subgrid scale model for finitedifference simulations of turbulent flows in plane channels
588 M. O. Letzel et al.: LES case study on pedestrian level ventilation in two neighbourhoods Meteorol. Z., 21, 2012

and annuli. – J. Comput. Phys. 18, 376–404. DOI:10.1016/0021-9991(75)90093-5
Skote, M., M. Sandberg, U. Westerberg, L. Claesson,A. V. Johansson, 2005: Numerical and experimentalstudies of wind environment in an urban morphology. –Atmos. Environment 39, 6147–6158. DOI:10.1016/j.atmosenv.2005.06.052
Tack, A., J. Koskinen, A. Hellsten, P. Sievinen, I. Esau,J. Praks, M. Hallikainen, 2012: Morphological data-base of Paris for atmospheric modeling purposes. – IEEEJournal of Selected Topics in Applied Earth Observationand Remote Sensing Vol. 5, 1803–1810. DOI:10.1109/JSTARS.2012.2201134
Tamura, T., 2008: Towards practical use of LES in windengineering. – J. Wind Eng. Ind. Aerodyn. 96, 1451–1471.DOI:10.1016/j.jweia.2008.02.034
TEAM CLEAN, 2003: Report on measures to improveenvironmental hygiene in Hong Kong. – The Governmentof the Hong Kong Special Administrative Region.
Tominaga, Y., A. Mochida, T. Shirasawa, R. Yoshie, H.Kataoka, K. Harimoto, T. Nozu, 2004: Cross compar-isons of CFD results of wind environment at pedestrianlevel around a high-rise building and within a buildingcomplex. – J. Asian Arch. Build. Eng. 3(1), 63–70.
Tominaga, Y., A. Mochida, R. Yoshie, H. Kataoka, T.Nozu, M. Yoshikawa, T. Shirasawa, 2008: AIJguidelines for practical applications of CFD to pedestrianwind environment around buildings. – J. WindEng. Ind. Aerodyn. 96, 1749–1761. DOI:10.1016/j.jweia.2008.02.058
Tseng, Y.-H., C. Meneveau, M. B. Parlange, 2006:Modeling flow around bluff bodies and predicting urbandispersion using large eddy simulation. – Environ. Sci.Technol. 40, 2653–2662. DOI:10.1021/es051708m
UN-HABITAT, 2008: State of the world’s cities, 2008/2009:harmonious cities. – Earthscan, London, 264.
Xie, Z.-T., 2011: Modelling street-scale flow and dispersionin realistic winds – towards coupling with mesoscalemeteorological models. – Bound.-Lay. Meteorol 141, 53–75. DOI:10.1007/s10546-011-9629-x
Xie, Z. T., I. P. Castro, 2009: Large-eddy simulation forflow and dispersion in urban streets. – Atmos. Environ-ment 43, 2174–2185. DOI:10.1016/j.atmosenv.2009.01.016
Xie, Z.-T., O. Coceal, I. P. Castro, 2008: Large-eddysimulation of flows over random urban-like obstacles. –Bound.-Lay. Meteorol. 129, 1–23. DOI:10.1007/s10546-008-9290-1
Yan, Y. Y., 2007: Surface wind characteristics and variabilityin Hong Kong. – Weather62, 312–316. DOI:10.1002/wea.46
Yang, L., Y. Li, 2011: Thermal conditions and ventilation inan ideal city model of Hong Kong. – Energy and Buildings43, 1139–1148. DOI:10.1016/j.enbuild.2010.06.005
Yim, S. H. L., J. C. H. Fung, A. K. H. Lau, S. C. Kot,2007: Developing a high-resolution wind map for acomplex terrain with a coupled MM5/CALMET system.– J. Geophys. Res. 112(D05106). DOI:10.1029/2006JD007752
Yoshie, R., A. Mochida, Y. Tominaga, H. Kataoka, K.Harimoto, T. Nozu, T. Shirasawa, 2007: Cooperativeproject for CFD prediction of pedestrian wind environmentin the Architectural Institute of Japan. – J. Wind Eng. Ind.Aerodyn. 95, 1551–1578. DOI:10.1016/j.jweia.2007.02.023
Yoshie, R., H. Tanaka, T. Shirasawa, T. Kobayashi,2008: Experimental study on air ventilation in a built-uparea with closely-packed high-rise buildings (in Japanese).– J. Environ. Eng., AIJ 73(627), 661–667.
Meteorol. Z., 21, 2012 M. O. Letzel et al.: LES case study on pedestrian level ventilation in two neighbourhoods 589