lesson 11 plane areas area by integration
TRANSCRIPT

TOPIC
APPLICATIONSAREA BY INTEGRATION
THE AREA UNDER A CURVE
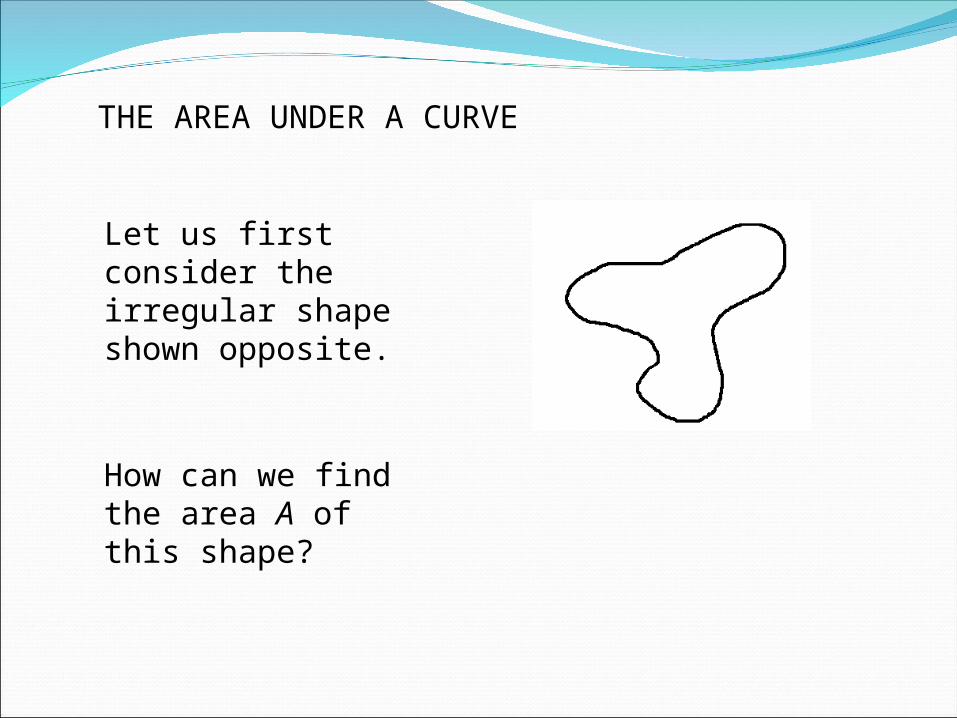
Let us first consider the irregular shape shown opposite.
How can we find the area A of this shape?
THE AREA UNDER A CURVE
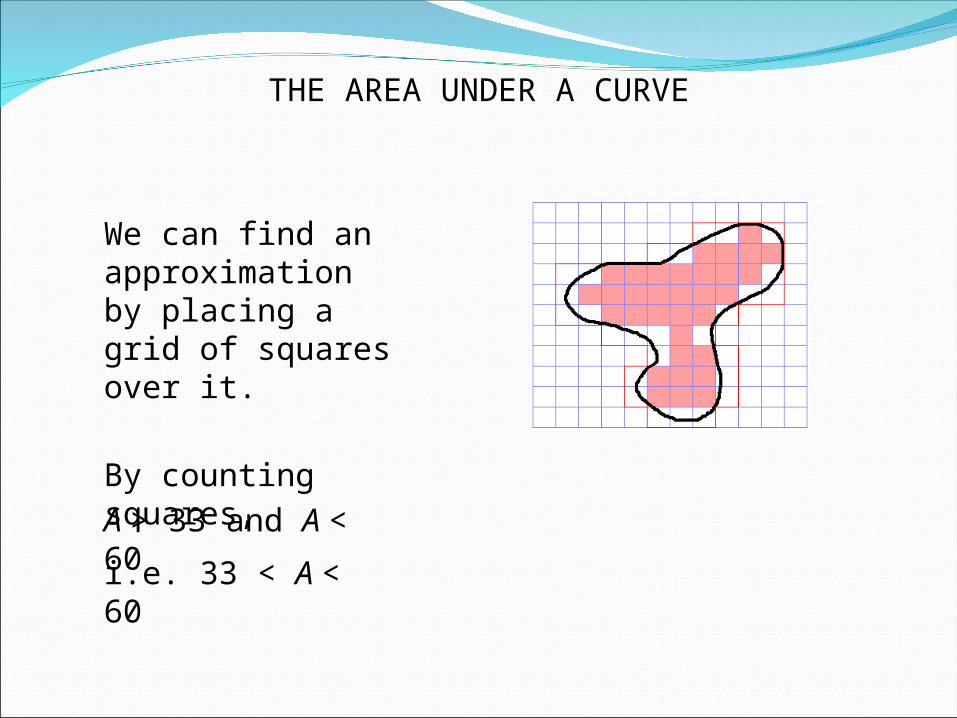
We can find an approximation by placing a grid of squares over it.
By counting squares,
A > 33 and A < 60
i.e. 33 < A < 60

THE AREA UNDER A CURVE
By taking a finer ‘mesh’ of squares we could obtain a better approximation for A.
We now study another way of approximating to A, using rectangles, in which A can be found by a limit process.
THE AREA UNDER A CURVE
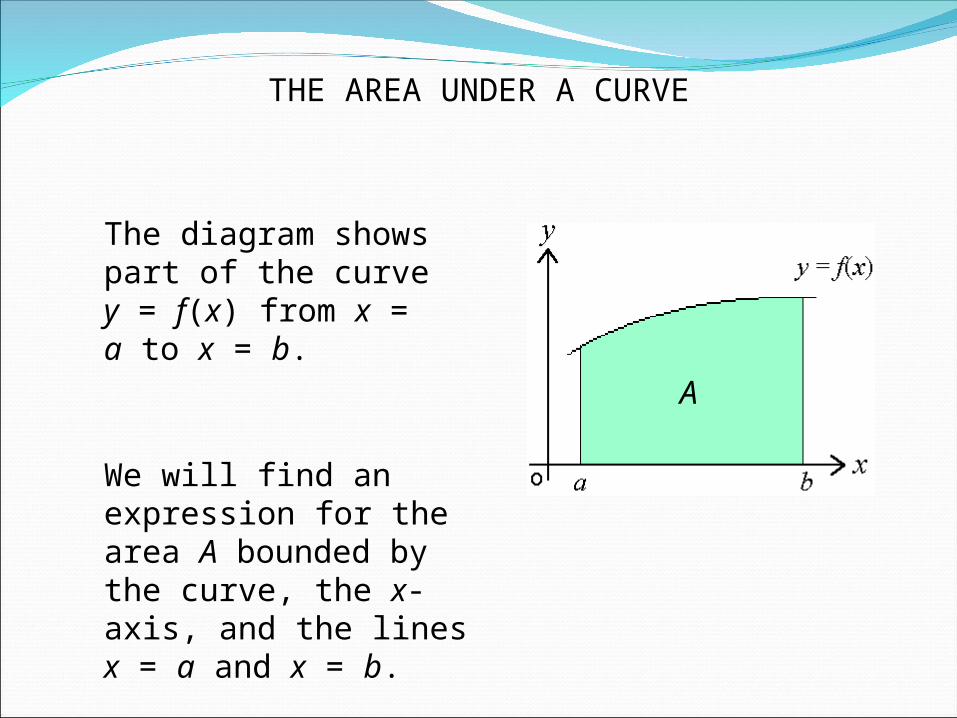
The diagram shows part of the curve y = f(x) from x = a to x = b.
We will find an expression for the area A bounded by the curve, the x-axis, and the lines x = a and x = b.
A

THE AREA UNDER A CURVE
The interval [a,b] is divided into n sections of equal width, Δx.
n rectangles are then drawn to approximate the area A under the curve.
Δx
A

THE AREA UNDER A CURVE
Dashed lines represent the height of each rectangle.
Thus the area of the first rectangle = f(x1).Δx1
f(x1)The first rectangle has height f(x1)and breadth Δx1.
The position of each line is given by an x-coordinate, xn.
x1, x2 , x3, x4 , x5, x6
Δx1
THE AREA UNDER A CURVE
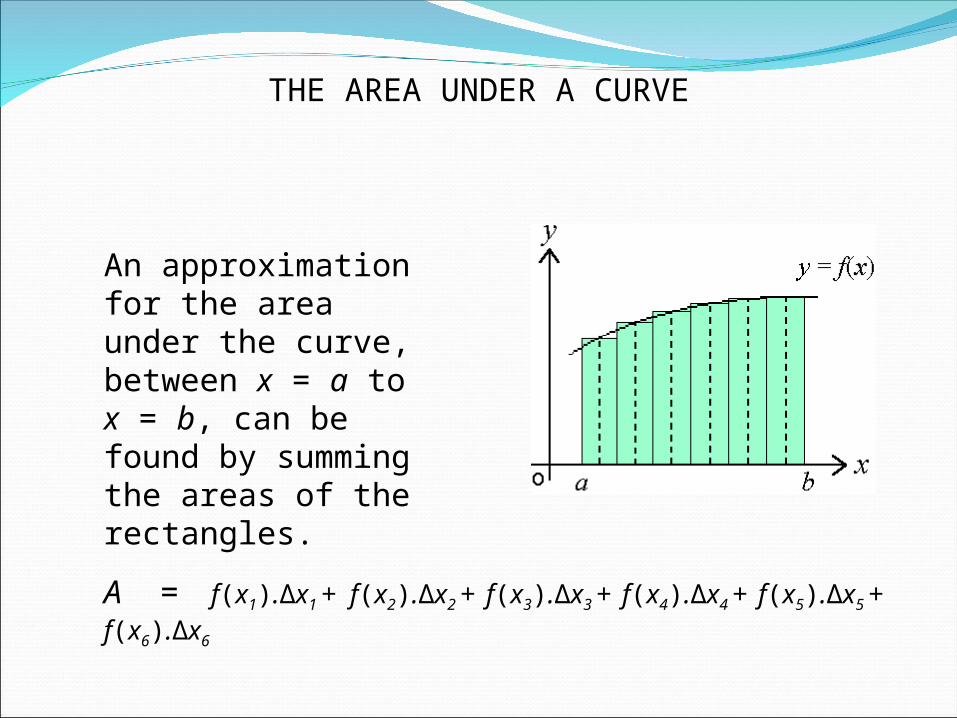
An approximation for the area under the curve, between x = a to x = b, can be found by summing the areas of the rectangles.
A = f(x1).Δx1 + f(x2).Δx2 + f(x3).Δx3 + f(x4).Δx4 + f(x5).Δx5 + f(x6).Δx6

THE AREA UNDER A CURVE
Using the Greek letter Σ (sigma) to denote ‘the sum of’, we have
6
1
).(i
iii xxfA
ni
iii xxfA
1
).(
For any number n rectangles, we then have
bx
ax
x).x(fA
THE AREA UNDER A CURVE
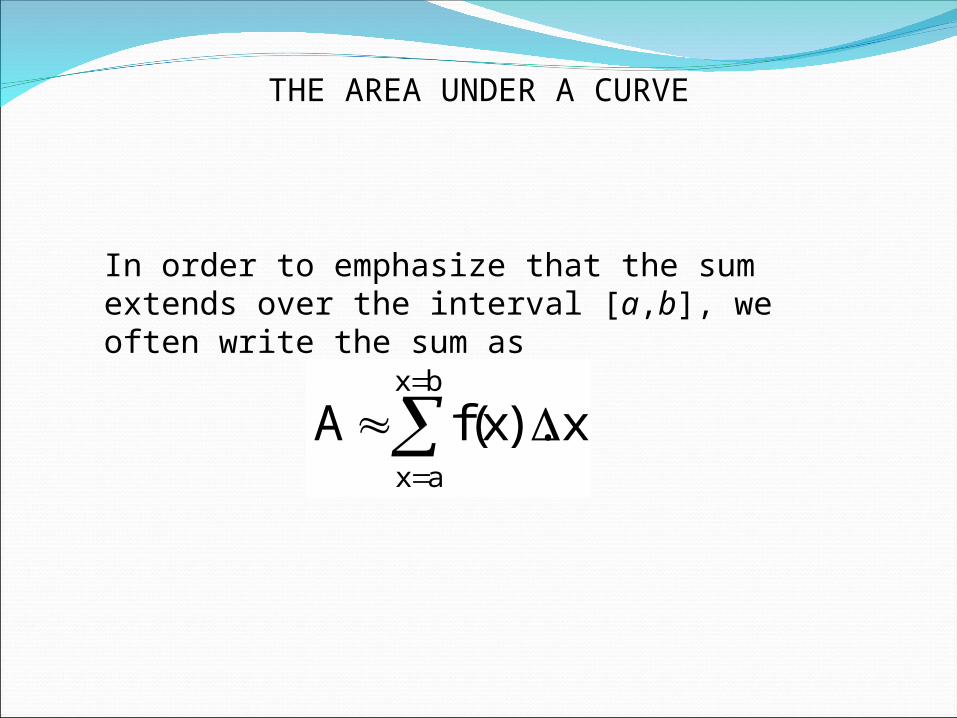
In order to emphasize that the sum extends over the interval [a,b], we often write the sum as
bx
axx
x).x(f limA0
THE AREA UNDER A CURVE
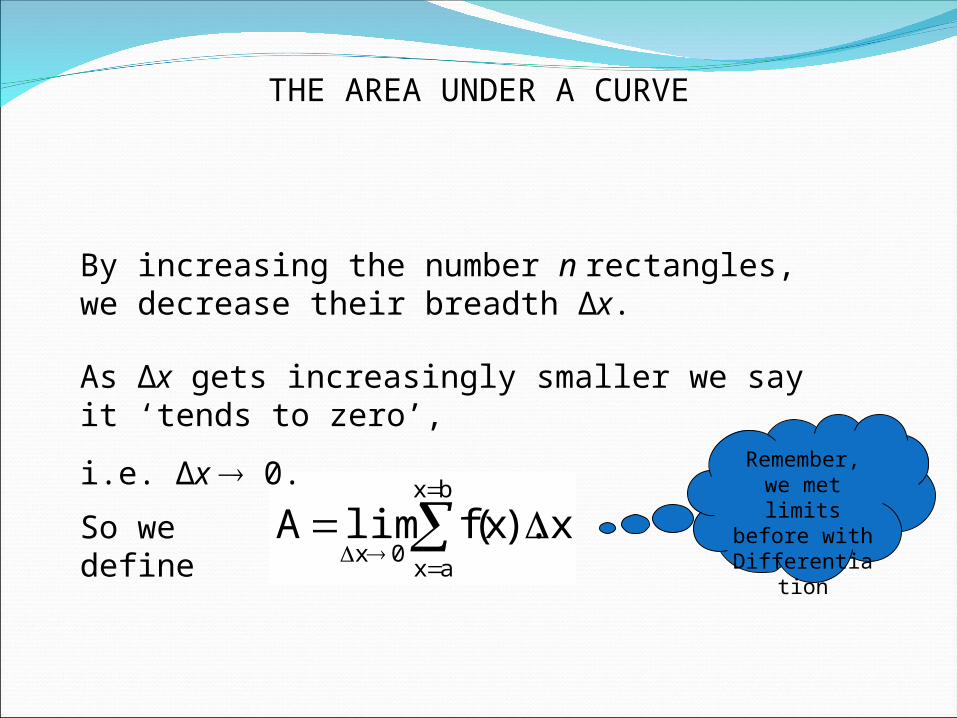
By increasing the number n rectangles, we decrease their breadth Δx.
As Δx gets increasingly smaller we say it ‘tends to zero’,
i.e. Δx 0.
So we define
Remember, we met limits
before with Differentiation
THE AREA UNDER A CURVE
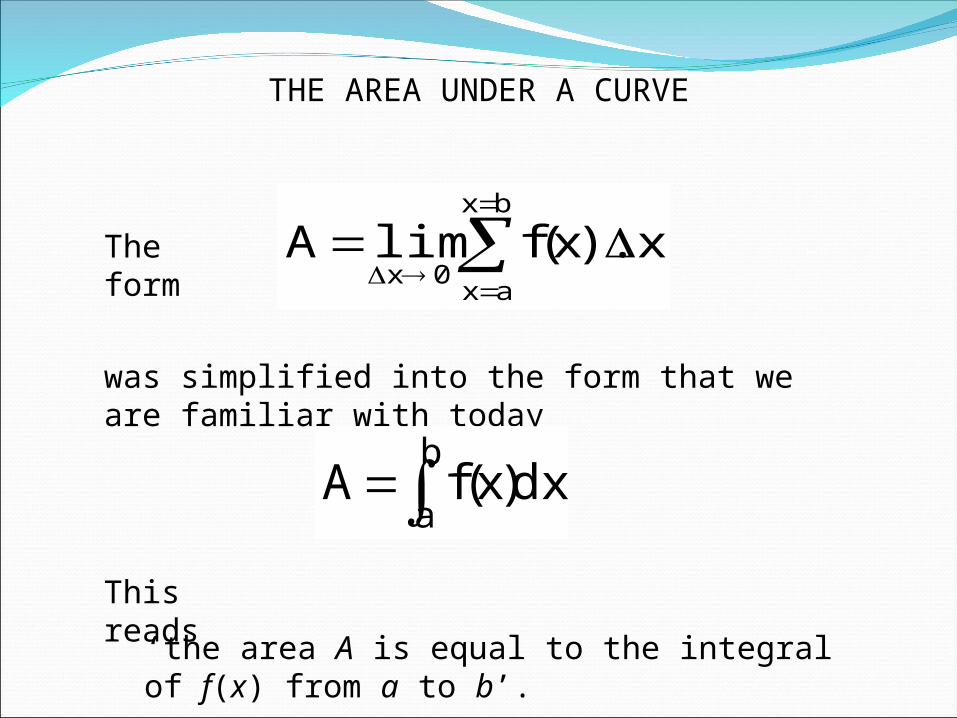
was simplified into the form that we are familiar with today
The form
bx
axx
x).x(f limA0
This reads
‘the area A is equal to the integral of f(x) from a to b’.
b
adx)x(fA

THE AREA UNDER A CURVE
We have derived a method for finding the area under a curve and a formal notation
b
adxxfA )(
We have seen the integration symbol before in connection with anti-differentiation, but we have not yet connected finding the area under a curve with the process of integration.

THE AREA UNDER A CURVE
Let us remind ourselves of where we started.
Can we apply this method to calculate the area under a curve?

THE AREA UNDER A CURVE
In conclusion,
b
adxxf )(
the area A bounded by the x-axis, the lines x = a and x = b and the curve y = f(x) is denoted by,
0 1
23 2 xy
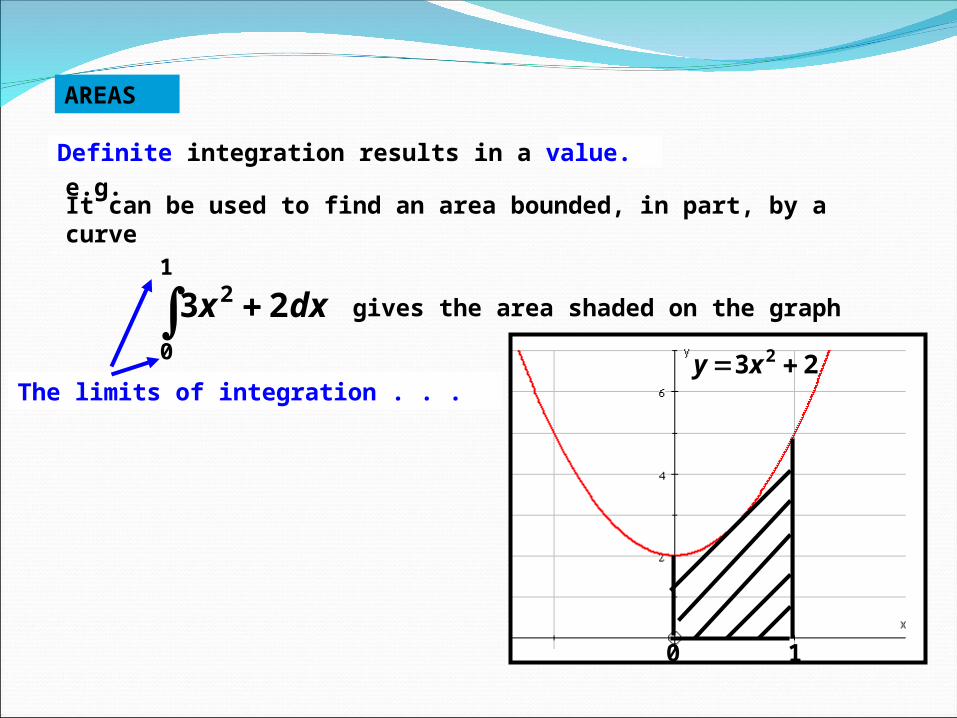
It can be used to find an area bounded, in part, by a curvee.g.
1
0
2 23 dxx gives the area shaded on the graph
The limits of integration . . .
Definite integration results in a value.
AREAS
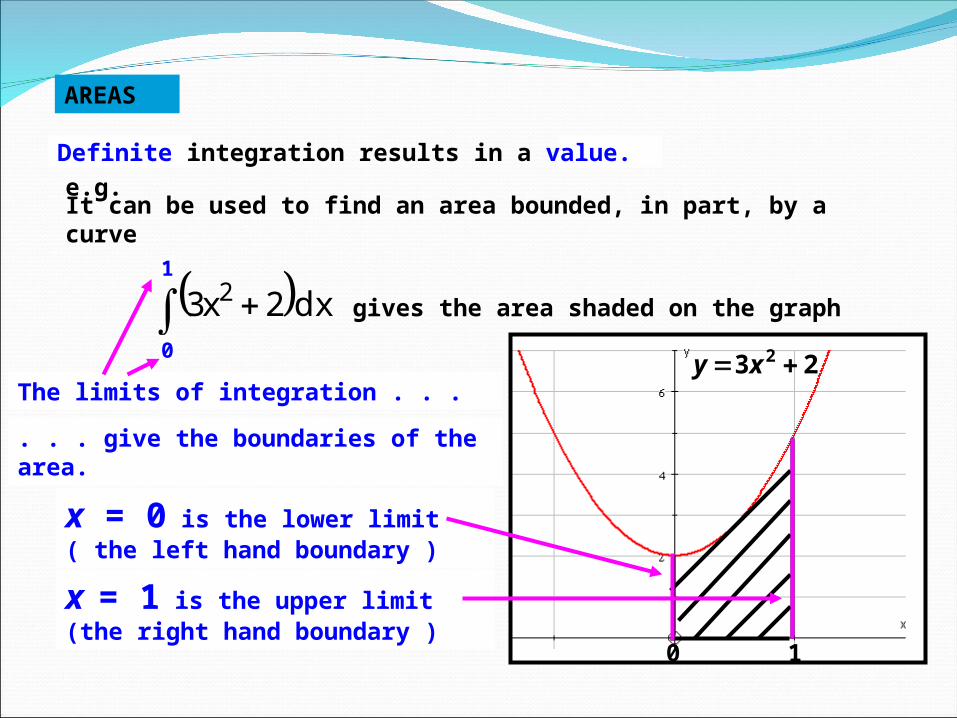
. . . give the boundaries of the area.
The limits of integration . . .
0 1
23 2 xy
It can be used to find an area bounded, in part, by a curve
Definite integration results in a value.
x = 0 is the lower limit( the left hand boundary )
x = 1 is the upper limit(the right hand boundary )
dx x 23 2
0
1e.g.
gives the area shaded on the graph
AREAS
0 1
23 2 xy
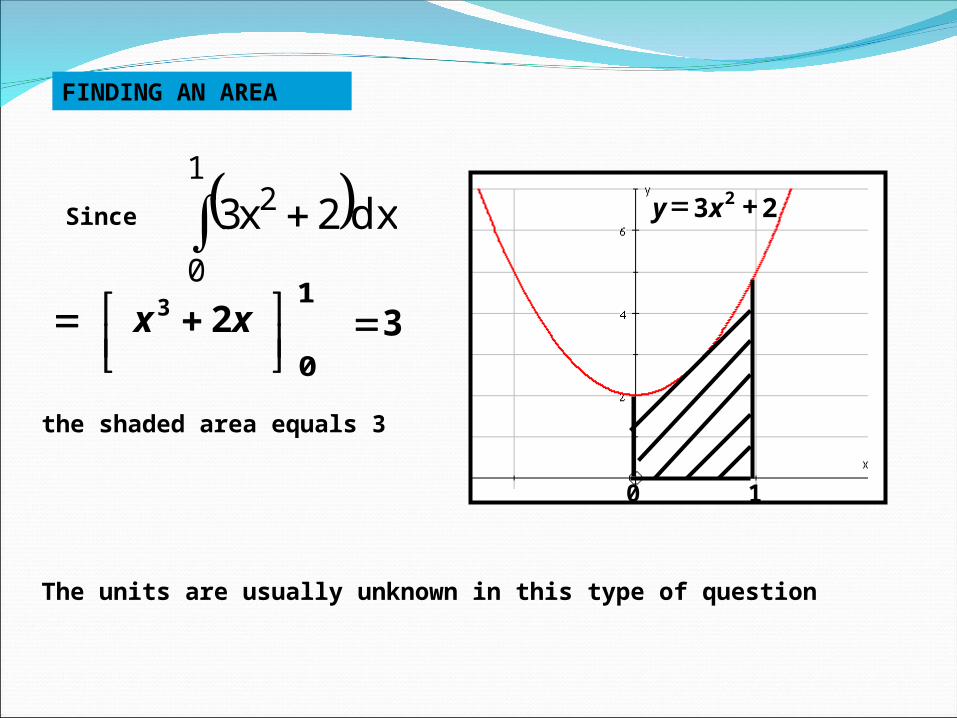
the shaded area equals 3
The units are usually unknown in this type of question
1
0
2 23 dxxSince
31
0
xx 23
FINDING AN AREA

xxy 22 xxy 22
0
1
2 2 dxxxA area
A B
1
0
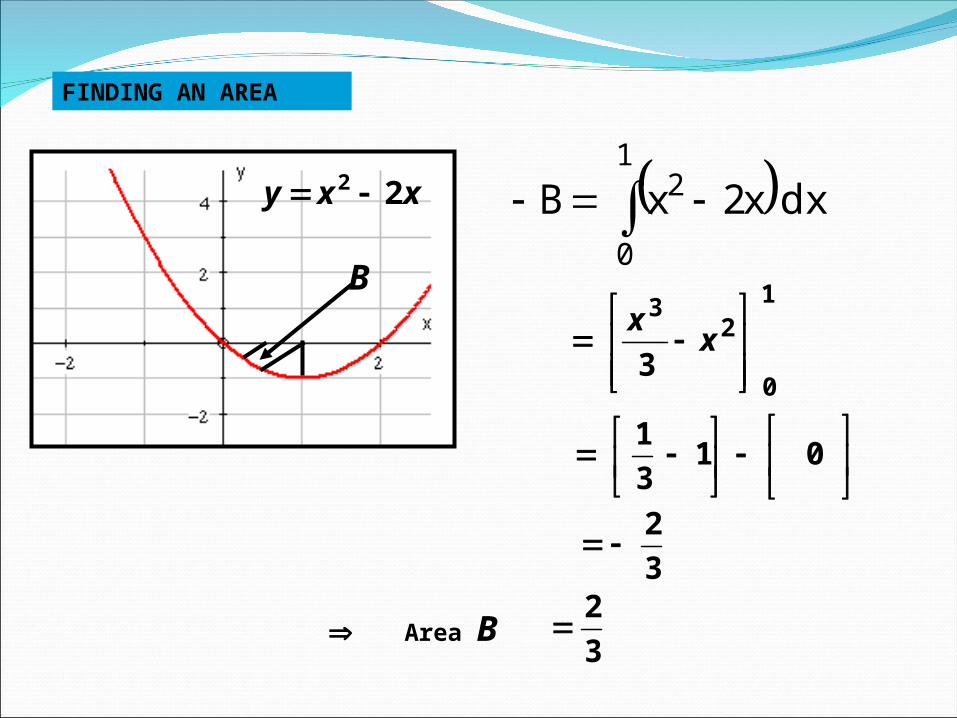
2 2 dxxxB area
For parts of the curve below the x-axis, the definite integral is negative, so
FINDING AN AREA

xxy 22
A
0
1
2 2 dxxxA
2
2
3
23 0
1
xx
2
3
)1(3
)1(0
13
1
1
1
3
4Area A
FINDING AN AREA
xxy 22
B
1
0
2 2 dxxxB
2
3 1
03
xx
013
1
3
2
3
2Area B
FINDING AN AREA

SUGGESTED STEPS TO DETERMINE THE AREA OF A PLANE FIGURE BY INTEGRATION:
1.Determine the intersection points of the given boundaries or equations.
2.Graph the given functions.
3.Shade the area to be determined.
4.Consider a thin rectangle anywhere within the region, horizontal or vertical element, to represent the entire region.
5.Determine the dimensions of the rectangular element and limits of integration. Apply the integral using the extreme points as the limit of integration to determine the total area.
6.Set up the area of the element and evaluate the integral throughout the region.

AREA UNDER THE CURVE
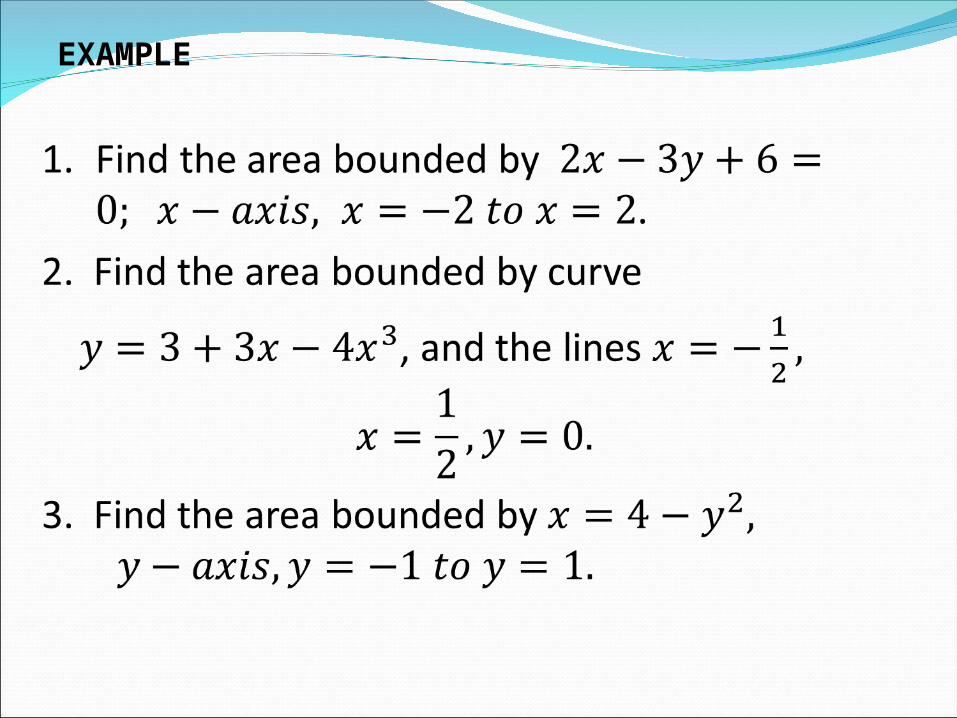
EXAMPLE
AREA BETWEEN TWO CURVES
AREA BETWEEN TWO CURVES
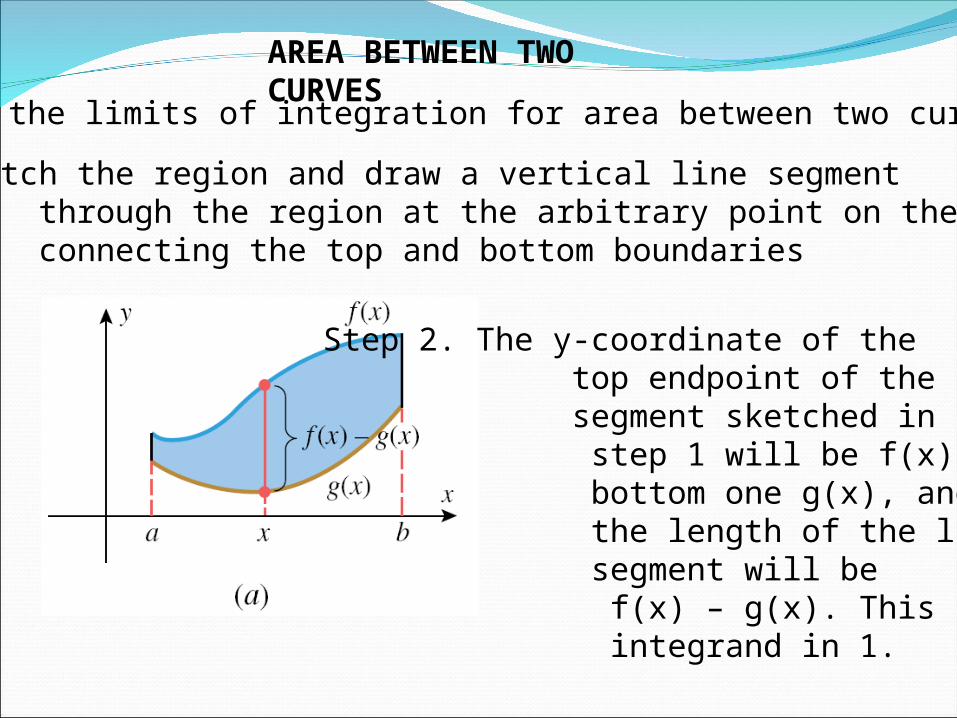
Finding the limits of integration for area between two curves
Step 1: Sketch the region and draw a vertical line segment through the region at the arbitrary point on the x-axis, connecting the top and bottom boundaries
Step 2. The y-coordinate of the top endpoint of the line segment sketched in step 1 will be f(x), the bottom one g(x), and the length of the line segment will be f(x) – g(x). This is the integrand in 1.
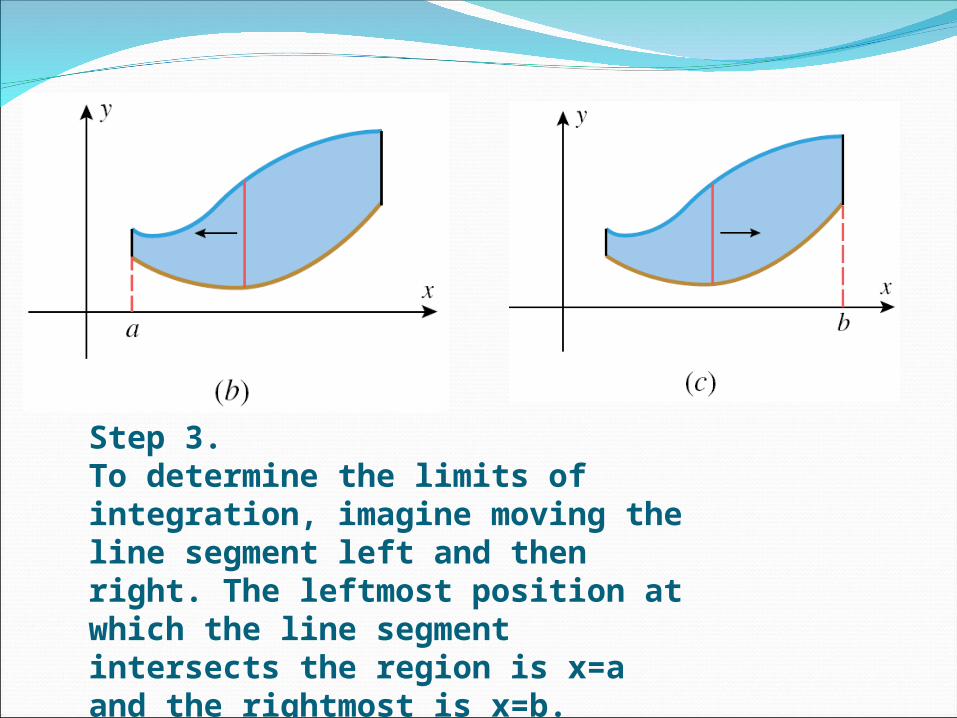
Step 3. To determine the limits of integration, imagine moving the line segment left and then right. The leftmost position at which the line segment intersects the region is x=a and the rightmost is x=b.
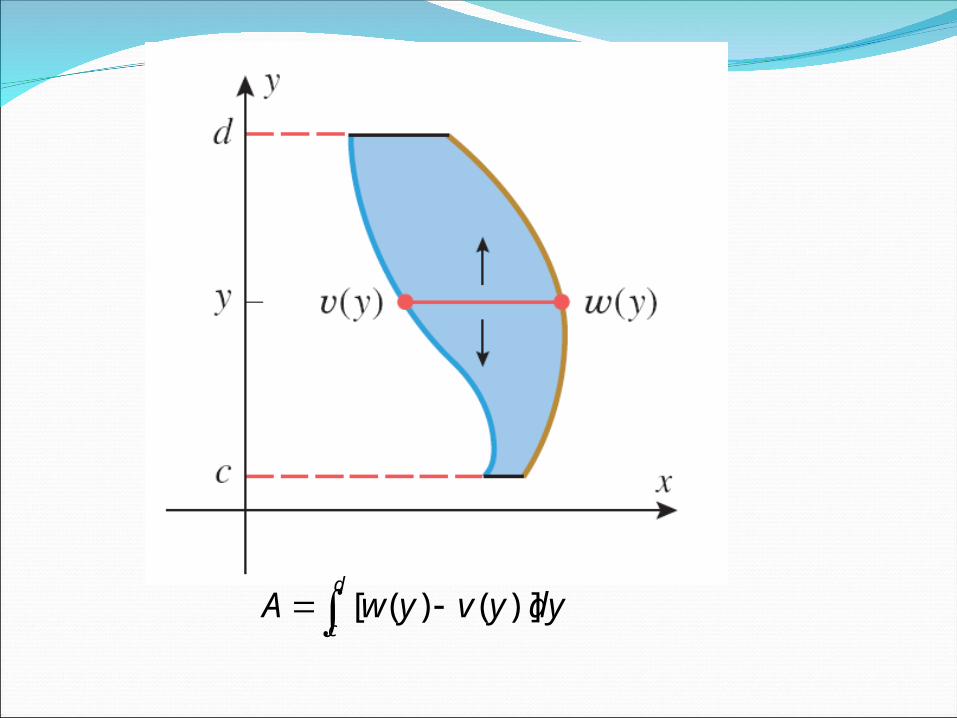
d
cdyyvywA )]()([
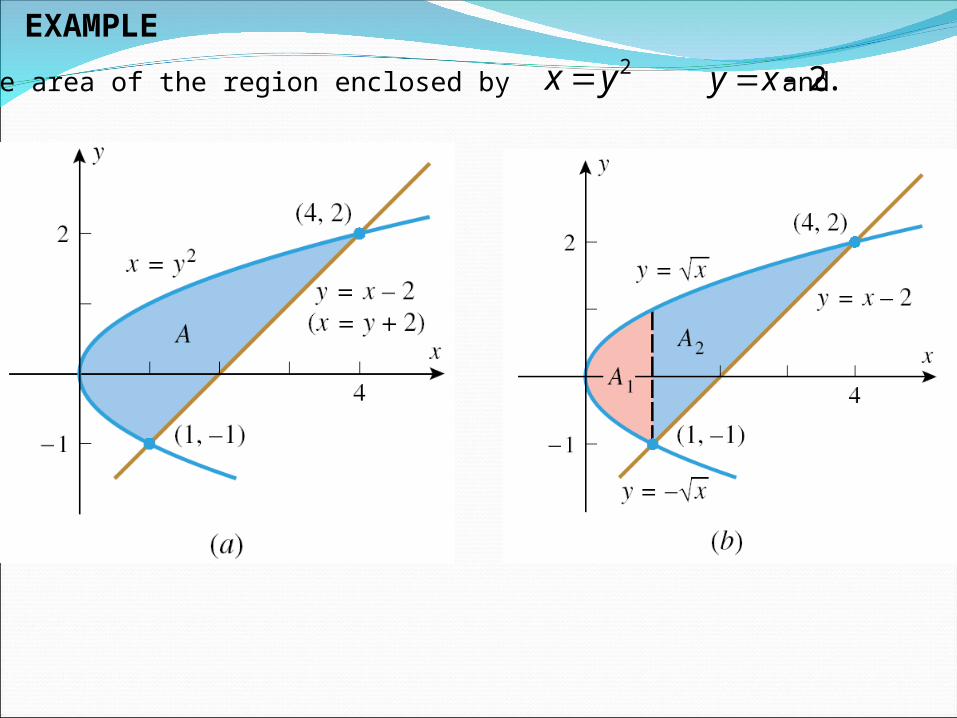
Find the area of the region enclosed by and 2yx .2xy
EXAMPLE

EXERCISES