lesson 3 - math 8thmath8thrsa.weebly.com/.../68022193/3.1_3.2...slope.pdf · in 1870, the french...
TRANSCRIPT
? ESSENTIAL QUESTION
EXPLORE ACTIVITY
How can you use tables, graphs, and equations to represent proportional situations?
L E S S O N
3.1Representing Proportional Relationships
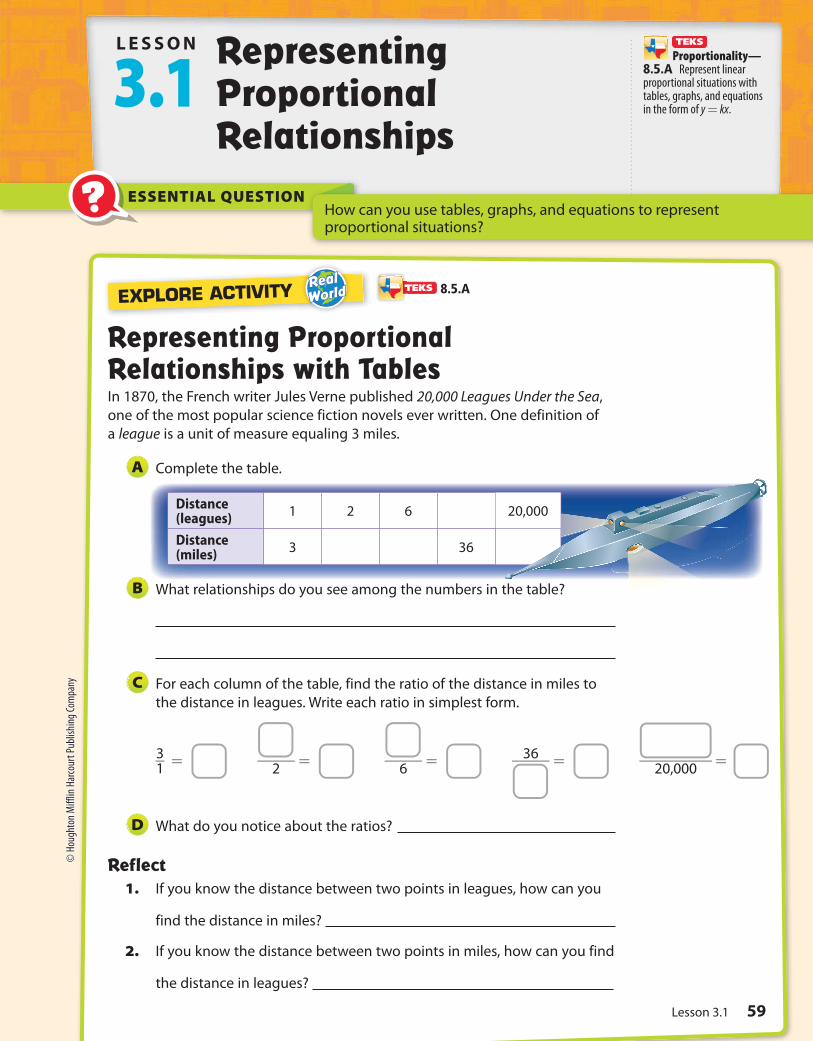
Representing Proportional Relationships with TablesIn 1870, the French writer Jules Verne published 20,000 Leagues Under the Sea,
one of the most popular science fiction novels ever written. One definition of
a league is a unit of measure equaling 3 miles.
Complete the table.
Distance (leagues)
1 2 6
Distance (miles)
3 36
What relationships do you see among the numbers in the table?
For each column of the table, find the ratio of the distance in miles to
the distance in leagues. Write each ratio in simplest form.
What do you notice about the ratios?
Reflect1. If you know the distance between two points in leagues, how can you
find the distance in miles?
2. If you know the distance between two points in miles, how can you find
the distance in leagues?
A
B
C
3 __ 1
= _____ 2
= _____ 6
= 36 _____ = __________ 20,000
=
D
20,000
8.5.A
Proportionality—8.5.A Represent linear proportional situations with tables, graphs, and equations in the form of y = kx.
59Lesson 3.1
© H
ough
ton
Miff
lin H
arco
urt P
ublis
hing
Com
pany
Math Trainer
Online Assessment and Intervention
Personal
my.hrw.com
Math On the Spotmy.hrw.com
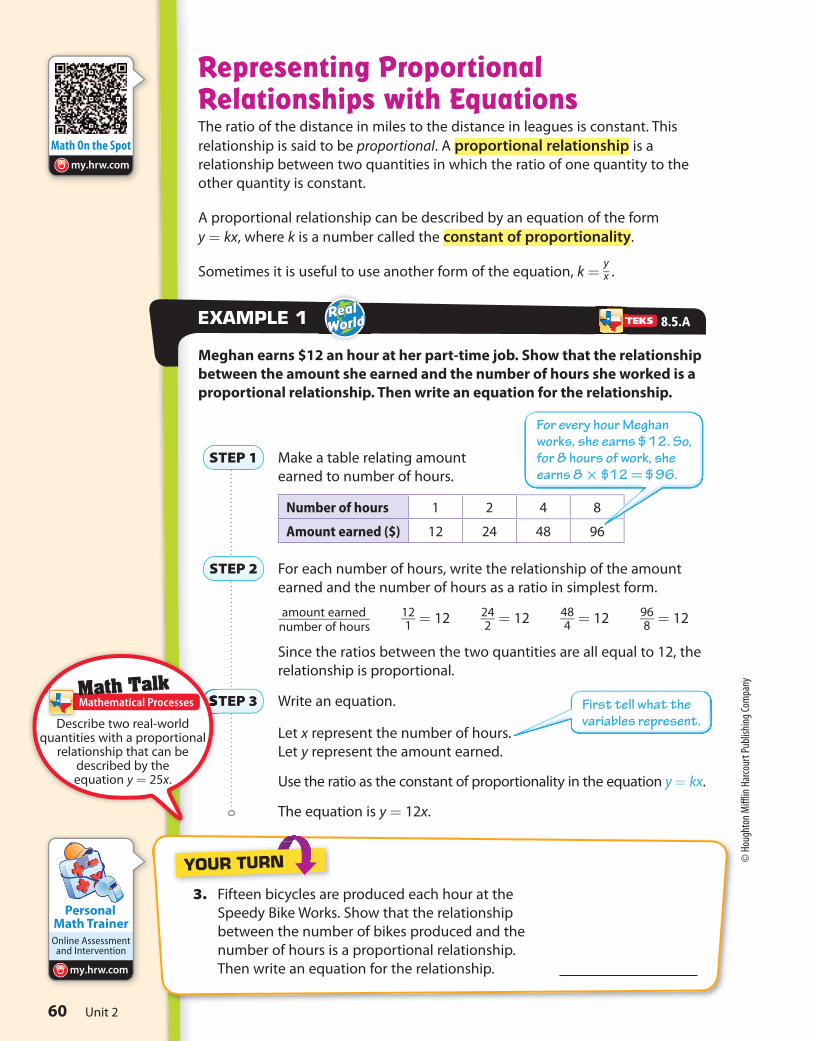
Representing Proportional Relationships with EquationsThe ratio of the distance in miles to the distance in leagues is constant. This
relationship is said to be proportional. A proportional relationship is a
relationship between two quantities in which the ratio of one quantity to the
other quantity is constant.
A proportional relationship can be described by an equation of the form
y = kx, where k is a number called the constant of proportionality.
Sometimes it is useful to use another form of the equation, k = y _ x .
Meghan earns $12 an hour at her part-time job. Show that the relationship
between the amount she earned and the number of hours she worked is a
proportional relationship. Then write an equation for the relationship.
Make a table relating amount
earned to number of hours.
Number of hours 1 2 4 8
Amount earned ($) 12 24 48 96
For each number of hours, write the relationship of the amount
earned and the number of hours as a ratio in simplest form.
Since the ratios between the two quantities are all equal to 12, the
relationship is proportional.
Write an equation.
Let x represent the number of hours.
Let y represent the amount earned.
Use the ratio as the constant of proportionality in the equation y = kx.
The equation is y = 12x.
EXAMPLE 1
STEP 1
STEP 2
amount earned ____________
number of hours 12
__ 1
= 12 24 __
2 = 12 48
__ 4
= 12 96 __
8 = 12
STEP 3
3. Fifteen bicycles are produced each hour at the
Speedy Bike Works. Show that the relationship
between the number of bikes produced and the
number of hours is a proportional relationship.
Then write an equation for the relationship.
YOUR TURN
Math TalkMathematical Processes
8.5.A
Describe two real-world quantities with a proportional
relationship that can be described by the equation y = 25x.
For every hour Meghan works, she earns $12. So, for 8 hours of work, she earns 8 × $12 = $96.
First tell what the variables represent.
Unit 260
© H
ough
ton
Miff
lin H
arco
urt P
ublis
hing
Com
pany
O
5
10
5 10
Leagues
Mile
s
(1,3)
(2,6)
(3,9)
O
2
4
6
8
10
6 12 18 24 30
Earth weight (lb)Moo
n weigh
t (lb
)
O
4
8
12
16
20
5 10 15 20 25
Time (h)
Dis
tance
(mi)
Math Trainer
Online Assessment and Intervention
Personal
my.hrw.com
Math On the Spot
my.hrw.com
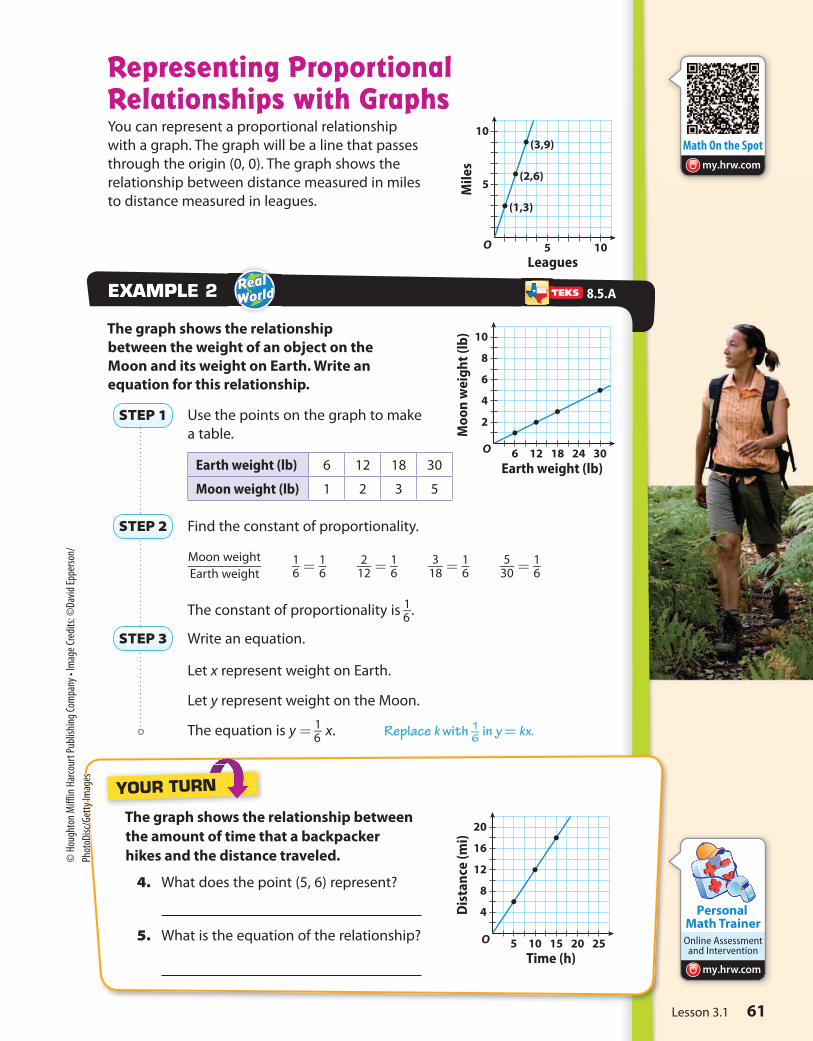
Representing Proportional Relationships with GraphsYou can represent a proportional relationship
with a graph. The graph will be a line that passes
through the origin (0, 0). The graph shows the
relationship between distance measured in miles
to distance measured in leagues.
The graph shows the relationship
between the weight of an object on the
Moon and its weight on Earth. Write an
equation for this relationship.
Use the points on the graph to make
a table.
Earth weight (lb) 6 12 18 30
Moon weight (lb) 1 2 3 5
Find the constant of proportionality.
The constant of proportionality is 1 _ 6
.
Write an equation.
Let x represent weight on Earth.
Let y represent weight on the Moon.
The equation is y = 1 _ 6
x.
EXAMPLEXAMPLE 2
STEP 1
STEP 2
Moon weight __________
Earth weight 1 _
6 = 1 _
6 2 __
12 = 1 _
6 3 __
18 = 1 _
6 5 __
30 = 1 _
6
STEP 3
The graph shows the relationship between
the amount of time that a backpacker
hikes and the distance traveled.
4. What does the point (5, 6) represent?
5. What is the equation of the relationship?
YOUR TURN
8.5.A
Replace k with 1 __ 6 in y = kx.
61Lesson 3.1
© H
ough
ton
Miff
lin H
arco
urt P
ublis
hing
Com
pany
• Im
age C
redi
ts: ©
David
Eppe
rson/
Phot
oDisc
/Get
ty Im
ages

How do you find a rate of change or a slope?????
Math Trainer
Online Assessment and Intervention
Personal
my.hrw.com
Math On the Spot
my.hrw.com
Investigating Rates of ChangeA rate of change is a ratio of the amount of change in the output
to the amount of change in the input.
Eve keeps a record of the number of lawns she has mowed and the money
she has earned. Tell whether the rates of change are constant or variable.
Day 1 Day 2 Day 3 Day 4
Number of lawns 1 3 6 8
Amount earned ($) 15 45 90 120
Identify the input and output variables.
Input variable: number of lawns Output variable: amount earned
Find the rates of change.
Day 1 to Day 2: change in $
____________ change in lawns
= 45 - 15 ______
3 - 1 = 30
__ 2
= 15
Day 2 to Day 3: change in $
____________ change in lawns
= 90 - 45 ______
6 - 3 = 45
__ 3
= 15
Day 3 to Day 4: change in $
____________ change in lawns
= 120 - 90 _______
8 - 6 = 30
__ 2
= 15
The rates of change are constant: $15 per lawn.
EXAMPLEXAMPLE 1
STEP 1
STEP 2
ESSENTIAL QUESTION
L E S S O N
3.2Rate of Change and Slope
ESSENTIAL QUESTION
Time (s) Height (ft)
0 0
0.5 18
1.5 31
2 26
1. The table shows the approximate height of a
football after it is kicked. Tell whether the
rates of change are constant or variable.
Find the rates of change:
The rates of change are constant / variable.
YOUR TURN
Math TalkMathematical Processes
8.4.C
Proportionality—8.4.C Use data from a table or graph to determine the rate of change or slope and y-intercept in mathematical and real-world problems.
Would you expect the rates of change of a car’s speed during a drive through a
city to be constant or variable? Explain.
65Lesson 3.2
© H
ough
ton
Miff
lin H
arco
urt P
ublis
hing
Com
pany
O
10
20
30
40
50
60
2 4 6
Time (h)
Dis
tan
ce (
mi)
(1,15)
(2,30)
(3,45)
(4,60)
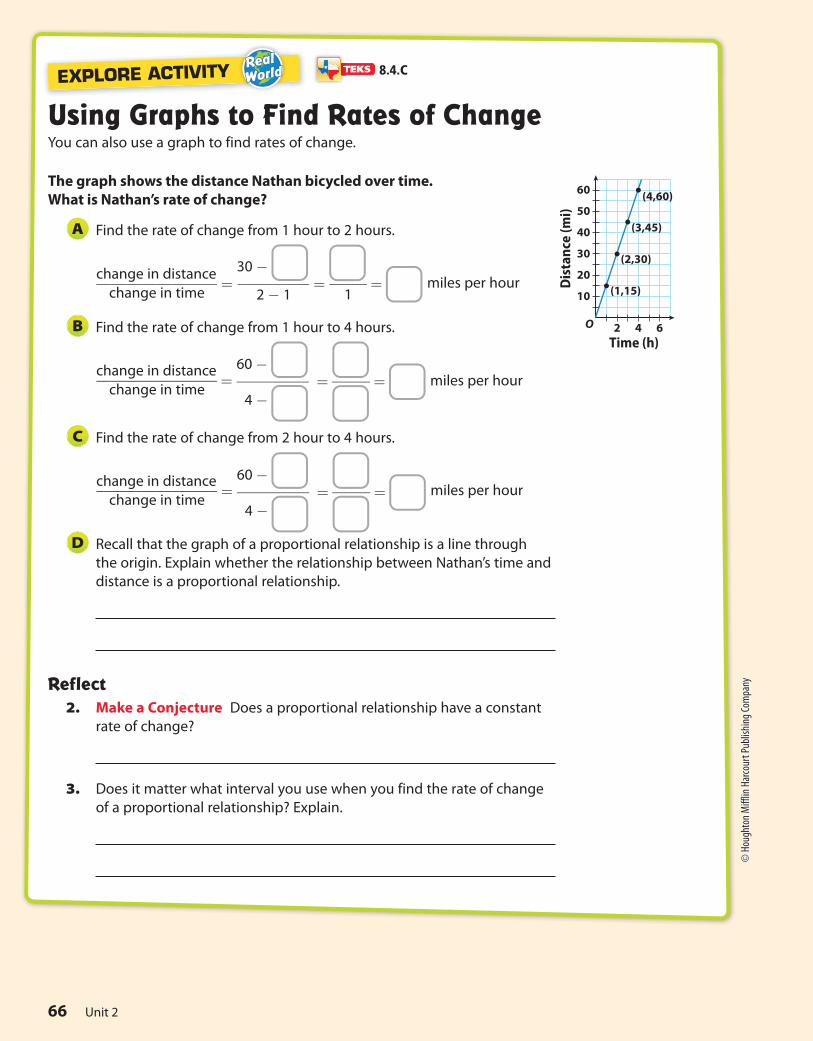
Using Graphs to Find Rates of ChangeYou can also use a graph to find rates of change.
The graph shows the distance Nathan bicycled over time.
What is Nathan’s rate of change?
Find the rate of change from 1 hour to 2 hours.
change in distance ________________
change in time =
30 - __________
2 - 1 = _____
1 = miles per hour
Find the rate of change from 1 hour to 4 hours.
change in distance ________________
change in time =
60 -
__________
4 -
= _____ = miles per hour
Find the rate of change from 2 hour to 4 hours.
change in distance ________________
change in time =
60 -
__________
4 -
= _____ = miles per hour
Recall that the graph of a proportional relationship is a line through
the origin. Explain whether the relationship between Nathan’s time and
distance is a proportional relationship.
Reflect 2. Make a Conjecture Does a proportional relationship have a constant
rate of change?
3. Does it matter what interval you use when you find the rate of change
of a proportional relationship? Explain.
A
B
C
D
EXPLORE ACTIVITY 8.4.C
66 Unit 2
© H
ough
ton
Miff
lin H
arco
urt P
ublis
hing
Com
pany
O 5-5
5
-5
x
y
Rise
Run
Ox
y
Rise
Run
O
5
10
5 10
Time (min)
Am
ou
nt
(ga
l)
Leaking tank
Math Trainer
Online Assessment and Intervention
Personal
my.hrw.com
Math On the Spot
my.hrw.com
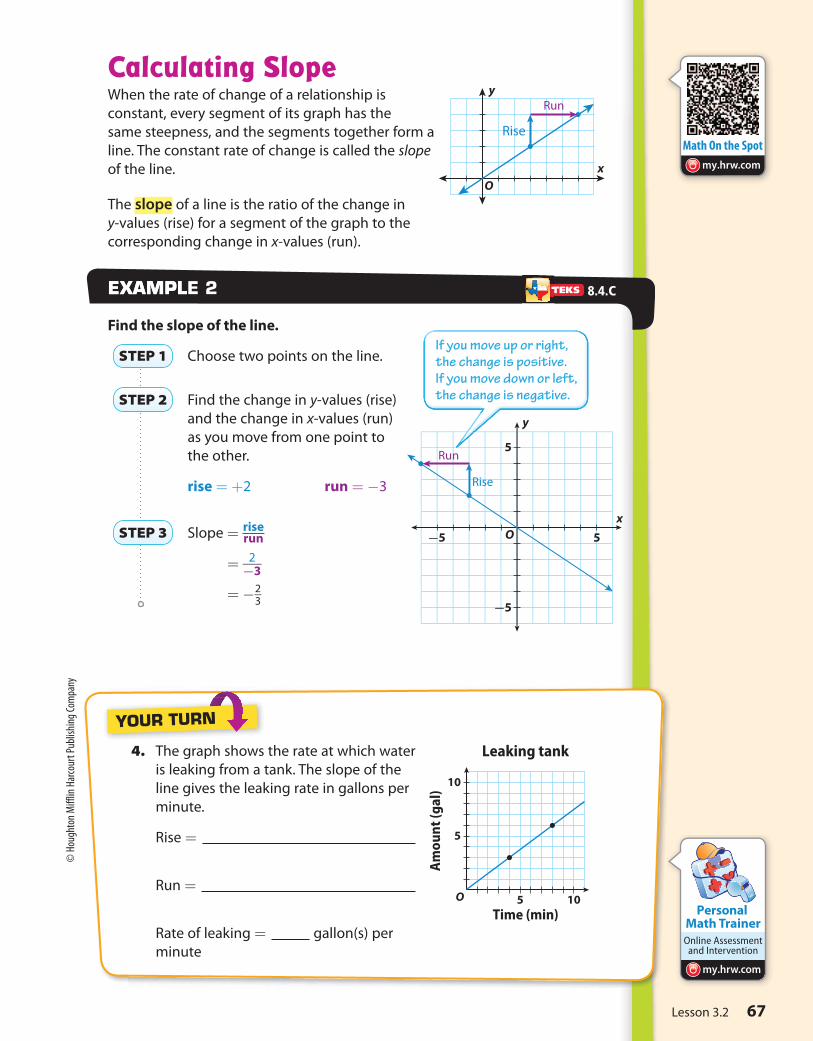
Calculating SlopeWhen the rate of change of a relationship is
constant, every segment of its graph has the
same steepness, and the segments together form a
line. The constant rate of change is called the slope
of the line.
The slope of a line is the ratio of the change in
y-values (rise) for a segment of the graph to the
corresponding change in x-values (run).
Find the slope of the line.
Choose two points on the line.
Find the change in y-values (rise)
and the change in x-values (run)
as you move from one point to
the other.
rise = +2 run = -3
Slope = rise ___ run
= 2 ___
-3
= - 2 _ 3
EXAMPLEXAMPLE 2
STEP 1
STEP 2
STEP 3
4. The graph shows the rate at which water
is leaking from a tank. The slope of the
line gives the leaking rate in gallons per
minute.
Rise =
Run =
Rate of leaking = gallon(s) per
minute
YOUR TURN
8.4.C
If you move up or right, the change is positive. If you move down or left, the change is negative.
67Lesson 3.2
© H
ough
ton
Miff
lin H
arco
urt P
ublis
hing
Com
pany