lesson 3.4 equations and graphs of polynomial functions
TRANSCRIPT
Lesson 3.4 Equations and Graphs of Polynomial Functions
1
sign diagram
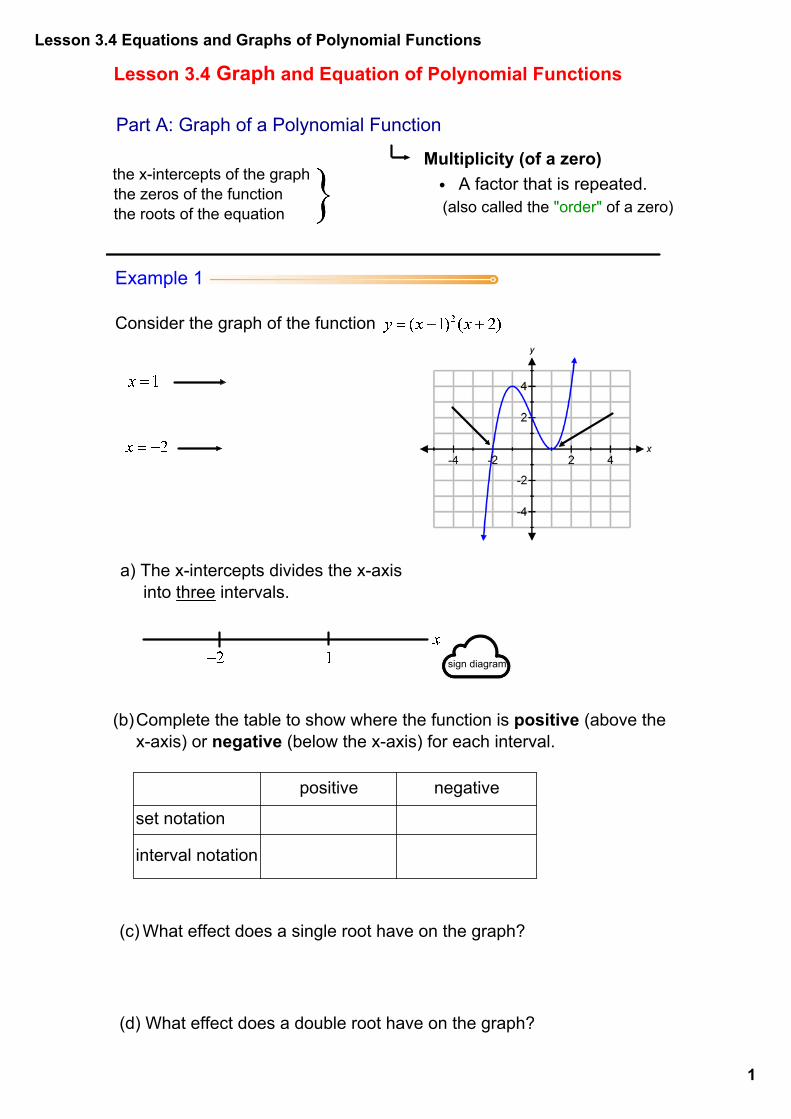
Lesson 3.4 Graph and Equation of Polynomial Functions
Example 1
Consider the graph of the function
the xintercepts of the graph the zeros of the function the roots of the equation
(b)Complete the table to show where the function is positive (above the xaxis) or negative (below the xaxis) for each interval.
(c)What effect does a single root have on the graph?
(d) What effect does a double root have on the graph?
Multiplicity (of a zero)
(also called the "order" of a zero)
positive negative
set notation
interval notation
a) The xintercepts divides the xaxis into three intervals.
• A factor that is repeated.
Part A: Graph of a Polynomial Function
Lesson 3.4 Equations and Graphs of Polynomial Functions
2
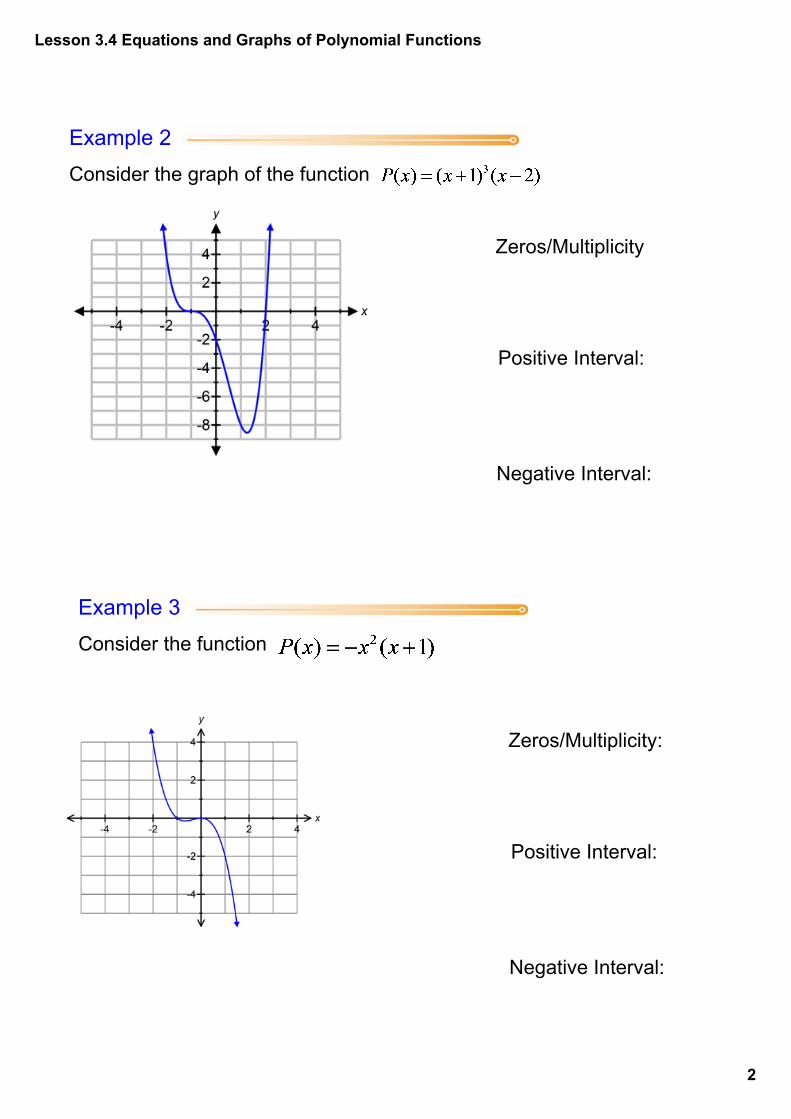
Example 2 Consider the graph of the function
Example 3 Consider the function
Zeros/Multiplicity
Positive Interval:
Negative Interval:
Zeros/Multiplicity:
Positive Interval:
Negative Interval:
Lesson 3.4 Equations and Graphs of Polynomial Functions
3
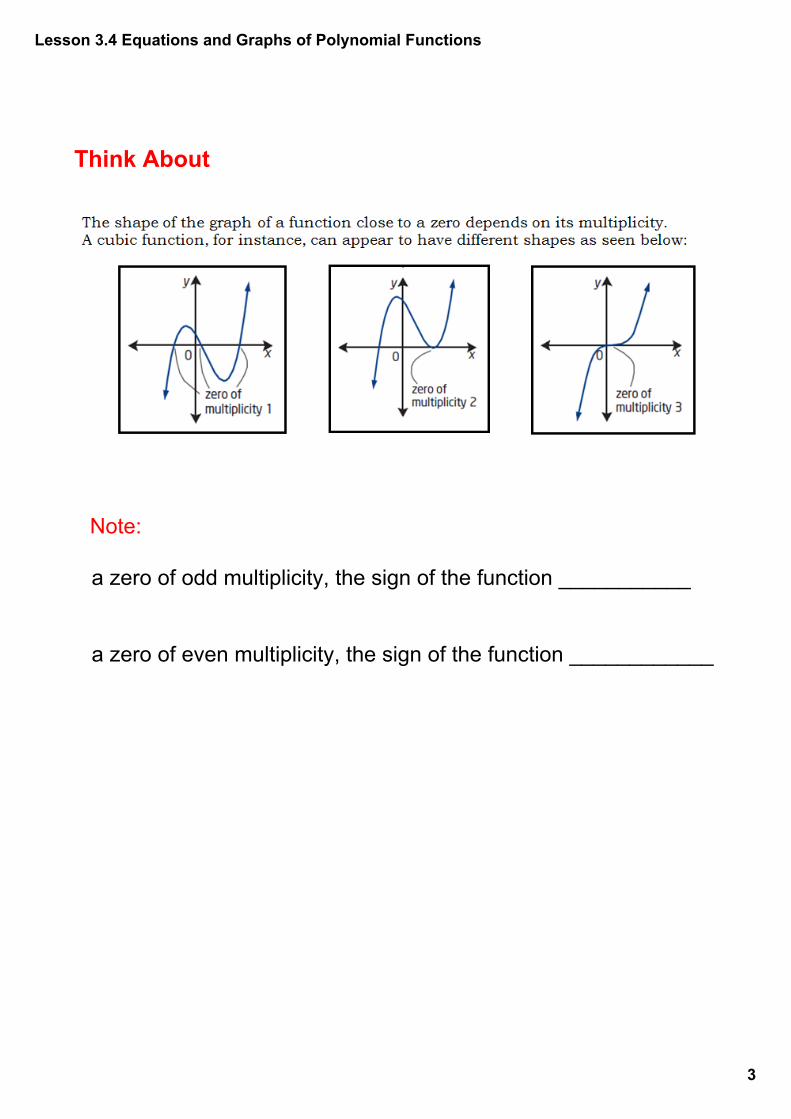
Think About
Note:
a zero of odd multiplicity, the sign of the function ___________
a zero of even multiplicity, the sign of the function ____________
Lesson 3.4 Equations and Graphs of Polynomial Functions
4
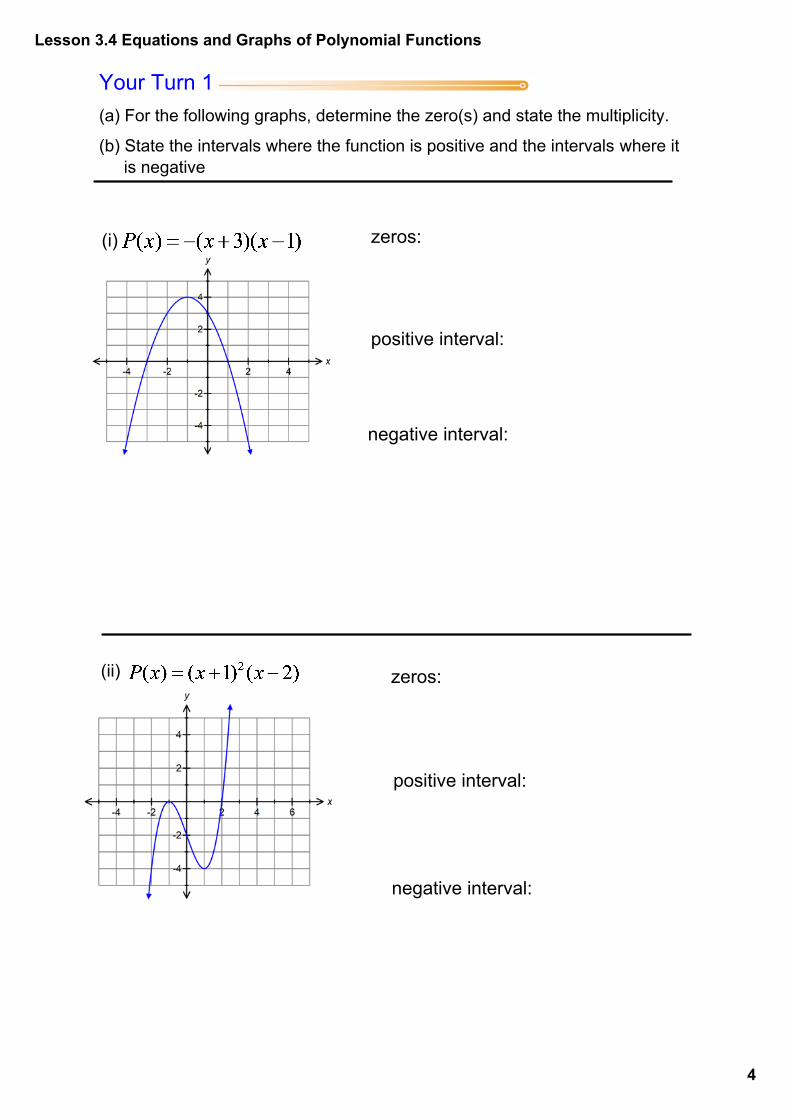
Your Turn 1(a) For the following graphs, determine the zero(s) and state the multiplicity.
(b) State the intervals where the function is positive and the intervals where it is negative
(i) zeros:
positive interval:
negative interval:
(ii) zeros:
positive interval:
negative interval:
Lesson 3.4 Equations and Graphs of Polynomial Functions
5
(iv) zeros:
positive interval:
negative interval:
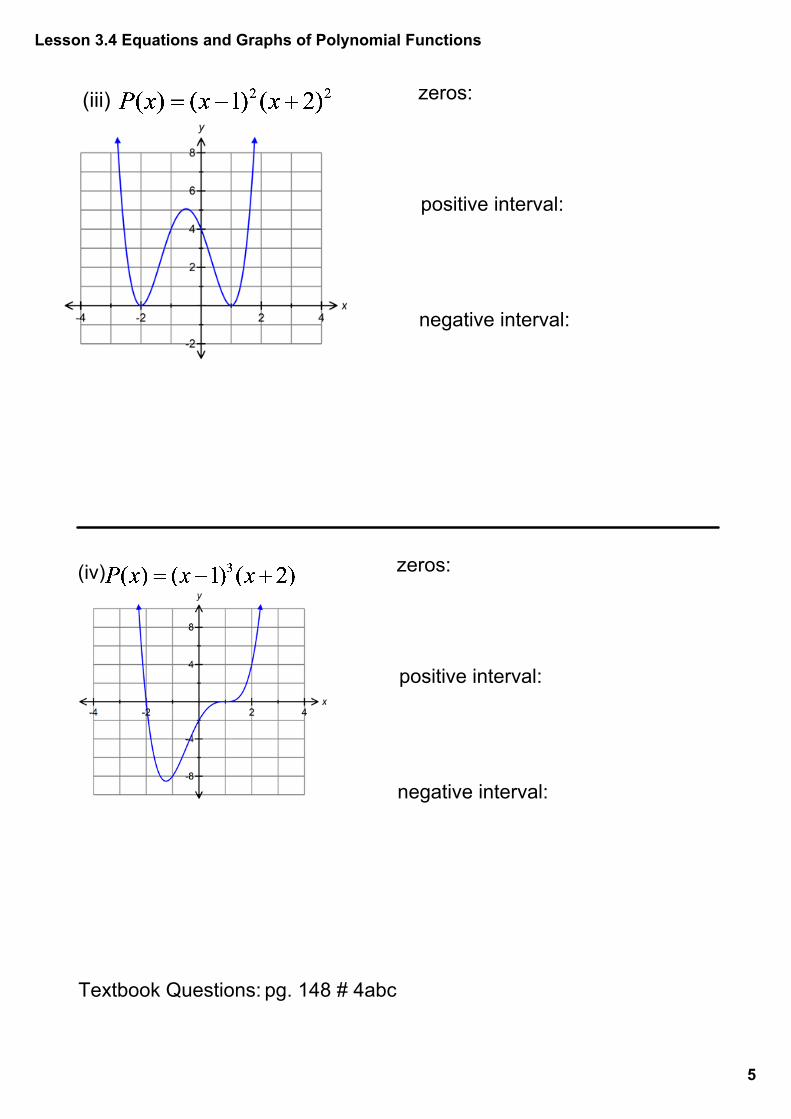
(iii) zeros:
positive interval:
negative interval:
Textbook Questions: pg. 148 # 4abc
Lesson 3.4 Equations and Graphs of Polynomial Functions
6
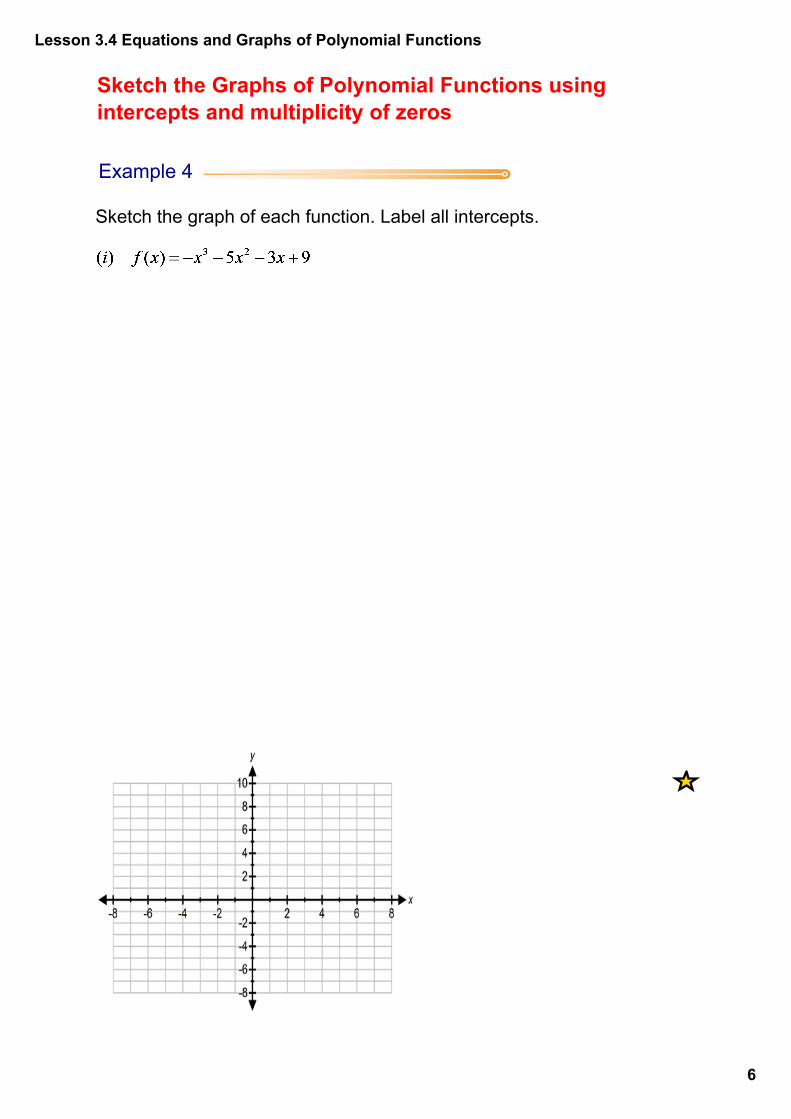
Sketch the Graphs of Polynomial Functions using intercepts and multiplicity of zeros
Example 4
Sketch the graph of each function. Label all intercepts.
Lesson 3.4 Equations and Graphs of Polynomial Functions
7
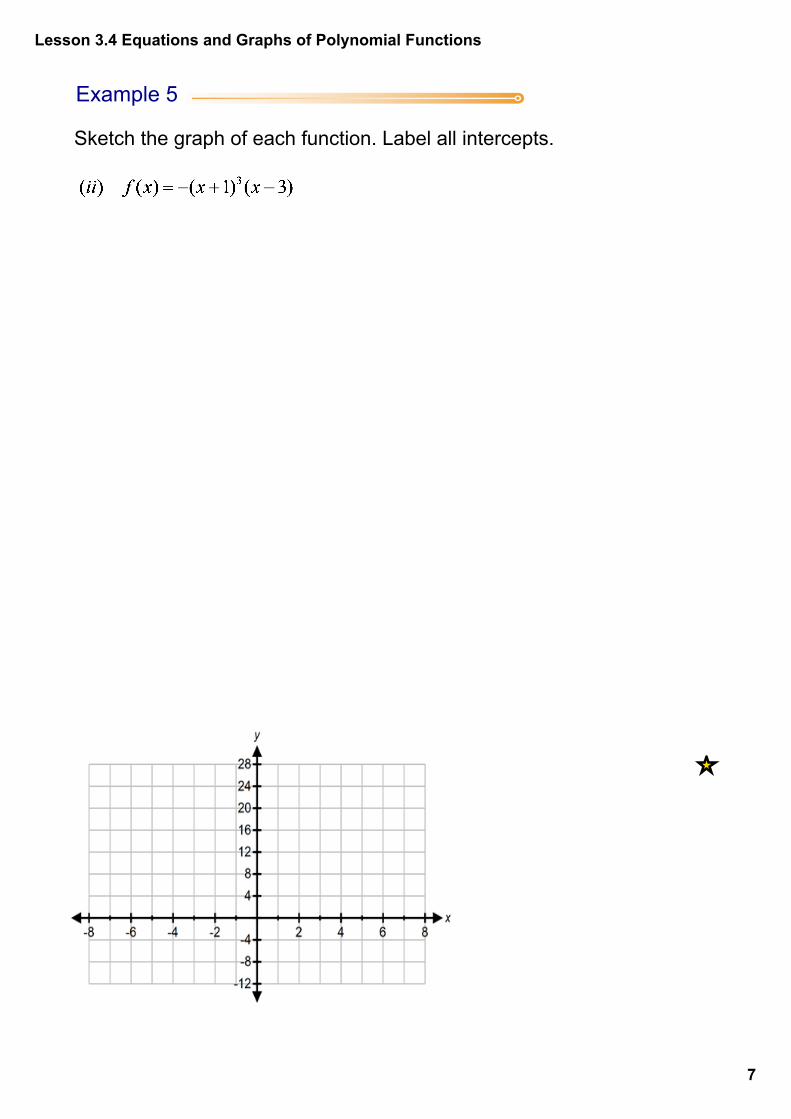
Example 5
Sketch the graph of each function. Label all intercepts.
Lesson 3.4 Equations and Graphs of Polynomial Functions
8
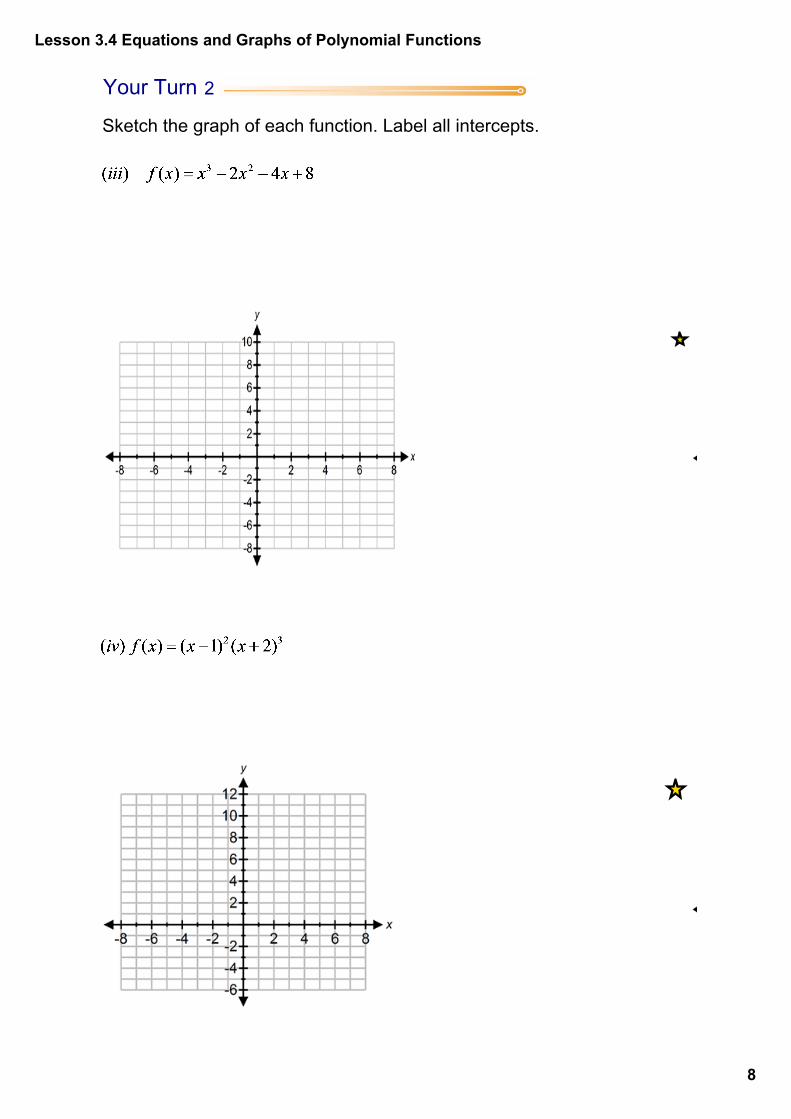
Your Turn 2
Sketch the graph of each function. Label all intercepts.

Lesson 3.4 Equations and Graphs of Polynomial Functions
9
Your Turn 3Draw the graph of a polynomial with the following characteristics:
xintercepts: (1,0) and (3,0)sign of the leading coefficient: positivepolynomial degree: 4relative maximum at (1,8)
Textbook Questions: pg. 147149 #1ab, 2ac, 7cd, 8cd, 9ef
Lesson 3.4 Equations and Graphs of Polynomial Functions
10
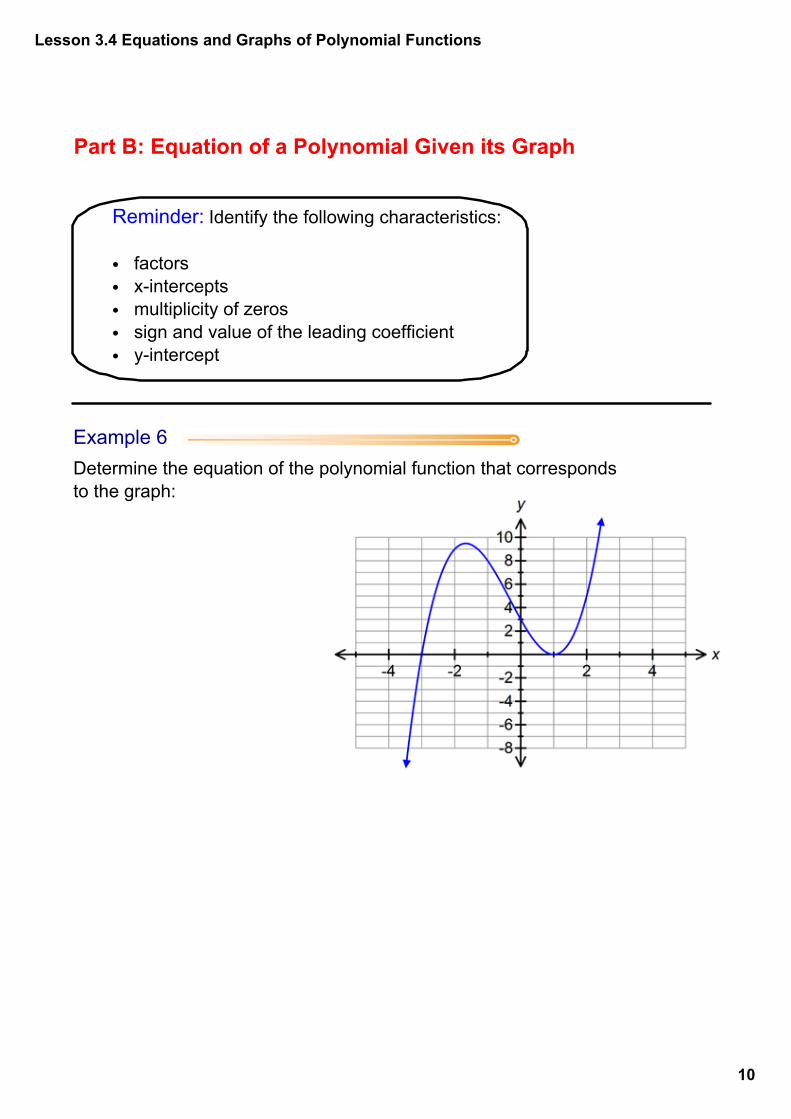
Part B: Equation of a Polynomial Given its Graph
Example 6
Reminder: Identify the following characteristics:
• factors• xintercepts• multiplicity of zeros• sign and value of the leading coefficient• yintercept
Determine the equation of the polynomial function that corresponds to the graph:
Lesson 3.4 Equations and Graphs of Polynomial Functions
11
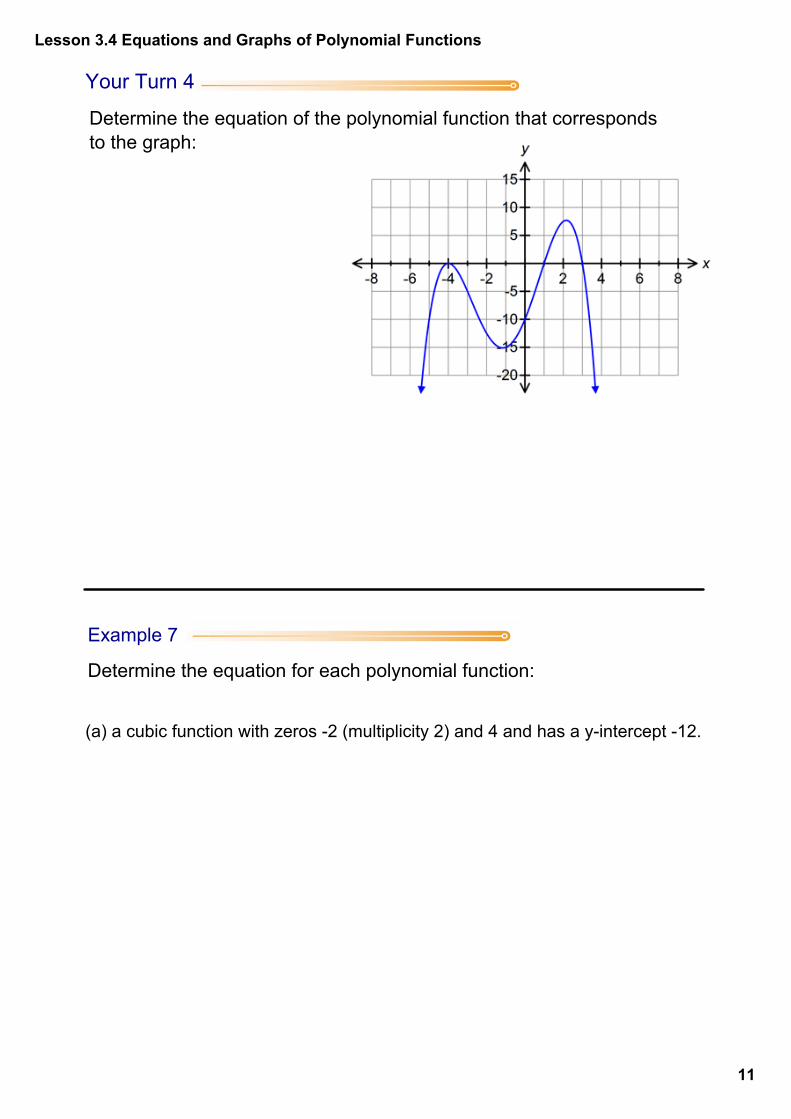
Your Turn 4
Example 7
(a) a cubic function with zeros 2 (multiplicity 2) and 4 and has a yintercept 12.
Determine the equation of the polynomial function that corresponds to the graph:
Determine the equation for each polynomial function:
Lesson 3.4 Equations and Graphs of Polynomial Functions
12
(b) a quintic function with zeros 1 (multiplicity 3) and 4 (multiplicity 2) and has a constant term of 6.
(c) a quartic function with a negative leading coefficient, zeros 3 (multiplicity 2) and 3 (multiplicity 2) and has a yintercept of 5.
Textbook Questions: pg.149 #10abcd, pg.150 #14abc
Lesson 3.4 Equations and Graphs of Polynomial Functions
13
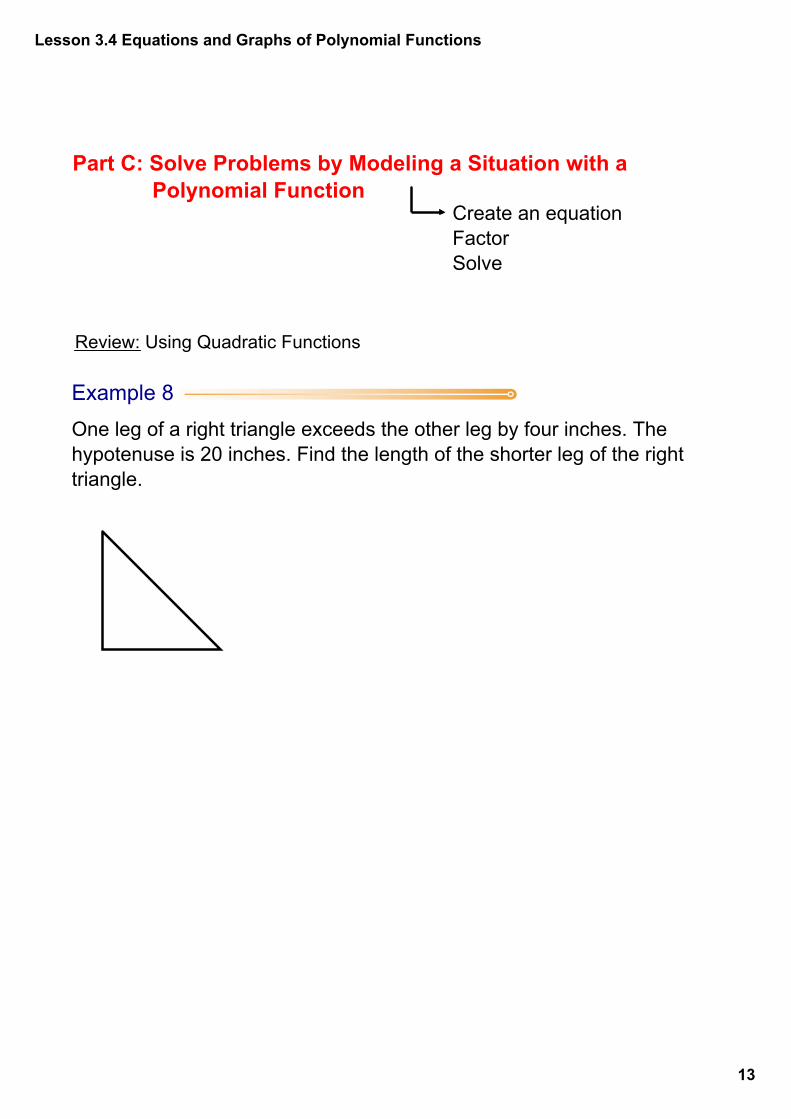
Part C: Solve Problems by Modeling a Situation with a Polynomial Function
Review: Using Quadratic Functions
Example 8 One leg of a right triangle exceeds the other leg by four inches. The hypotenuse is 20 inches. Find the length of the shorter leg of the right triangle.
Create an equationFactorSolve
Lesson 3.4 Equations and Graphs of Polynomial Functions
14
Example 9 Three consecutive odd integers have a product of 315. What are the integers?
Lesson 3.4 Equations and Graphs of Polynomial Functions
15
Example 10The length, width and height of a rectangular box are cm, cm, and
cm respectively. Determine the dimensions of the box if the volume is 132 cm2
Is it necessary to place restrictions on the independent variable?

Lesson 3.4 Equations and Graphs of Polynomial Functions
16
Example 11
An open topped box with a volume of 72 in3 is made from a square piece of cardboard by cutting equal squares from each corner and folding up the sides. If the original dimension of the cardboard is 10 in., find the side length that is cut from each corner.
Lesson 3.4 Equations and Graphs of Polynomial Functions
17
Example 12The actual and projected number, C (in millions), of computers sold for the region between 2010 and 2020 can be modelled by
where represents 2010. During which year are 8.51 million computers projected to be sold?
Textbook Questions pg. 150151 #12, 13, 1519