lesson point-slope form of a 4.3 linear...
TRANSCRIPT
Because we know only one point, we use (x, y) to represent any other point.
Point-Slope Form of aLinear EquationSo far you have worked with linear equations in intercept form, y � a � bx.When you know a line’s slope and y-intercept, you can write its equation directly in intercept form. But what if you don’t know the y-intercept? One method that you might remember from your homework is to work backward with the slopeuntil you find the y-intercept. But you can also use the slope formula to find theequation of a line when you know the slope of the line and the coordinates of onlyone point on the line.
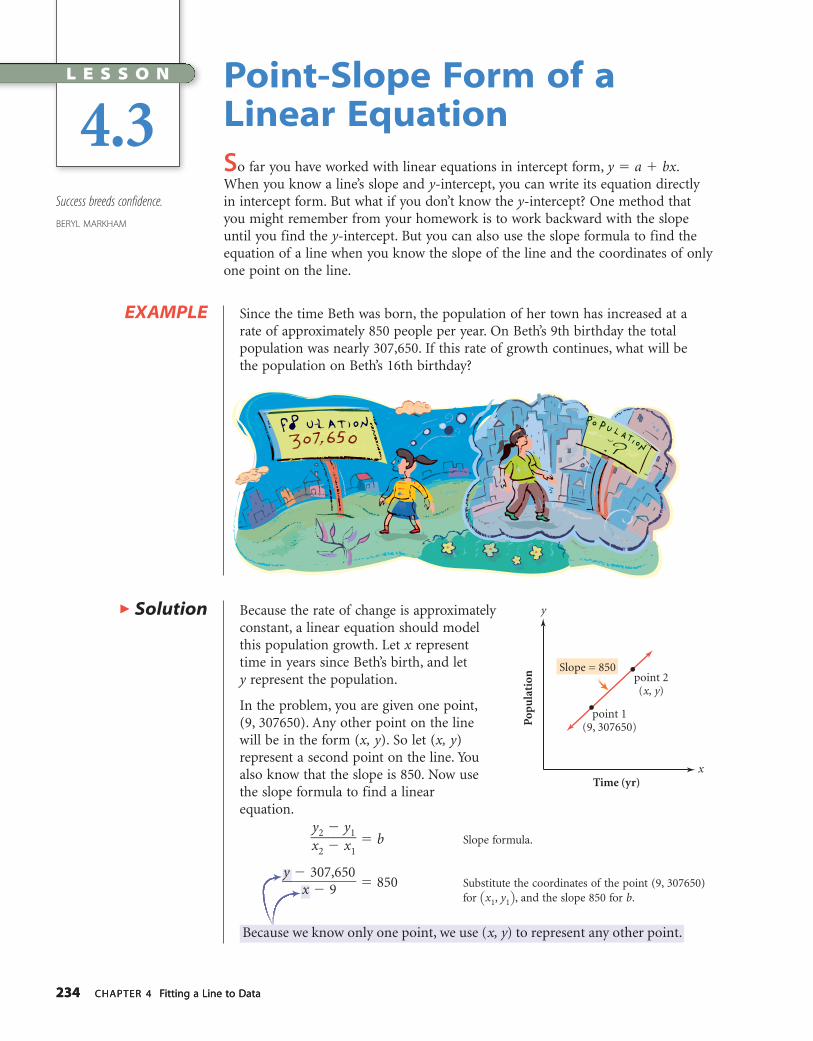
Since the time Beth was born, the population of her town has increased at a rate of approximately 850 people per year. On Beth’s 9th birthday the totalpopulation was nearly 307,650. If this rate of growth continues, what will be the population on Beth’s 16th birthday?
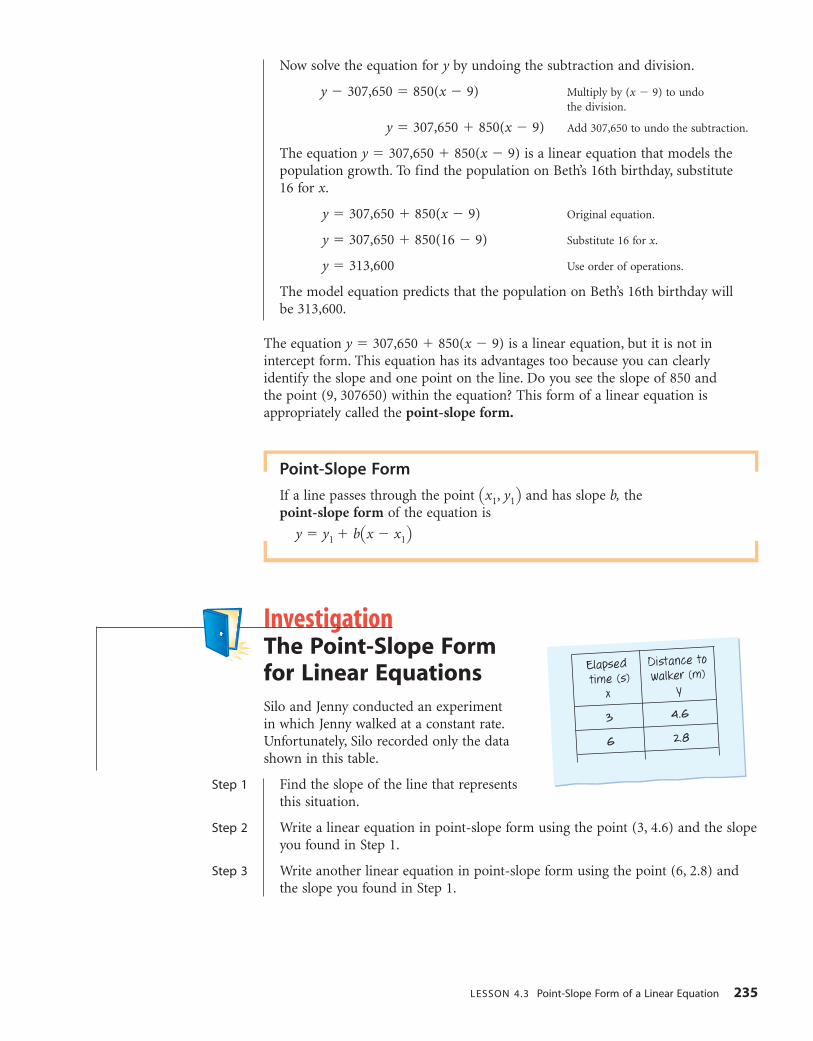
Because the rate of change is approximatelyconstant, a linear equation should modelthis population growth. Let x representtime in years since Beth’s birth, and lety represent the population.
In the problem, you are given one point,(9, 307650). Any other point on the linewill be in the form (x, y). So let (x, y)represent a second point on the line. Youalso know that the slope is 850. Now usethe slope formula to find a linear equation.
�xy2
2
�
�
yx
1
1� � b Slope formula.
�y �
x3�07
9,650
� � 850 Substitute the coordinates of the point (9, 307650) for �x1, y1�, and the slope 850 for b.
EXAMPLE
� Solution
234 CHAPTER 4 Fitting a Line to Data234 CHAPTER 4 Fitting a Line to Data
L E S S O N
4.3Success breeds confidence.
BERYL MARKHAM
Time (yr)
point 2(x, y)
point 1(9, 307650)P
opu
lati
on
x
y
Slope = 850
DA2SE_763_04.qxd 10/25/05 19:06 Page 234
LESSON 4.3 Point-Slope Form of a Linear Equation 235
Now solve the equation for y by undoing the subtraction and division.
y � 307,650 � 850(x � 9) Multiply by (x � 9) to undo the division.
y � 307,650 � 850(x � 9) Add 307,650 to undo the subtraction.
The equation y � 307,650 � 850(x � 9) is a linear equation that models thepopulation growth. To find the population on Beth’s 16th birthday, substitute 16 for x.
y � 307,650 � 850(x � 9) Original equation.
y � 307,650 � 850(16 � 9) Substitute 16 for x.
y � 313,600 Use order of operations.
The model equation predicts that the population on Beth’s 16th birthday willbe 313,600.
The equation y � 307,650 � 850(x � 9) is a linear equation, but it is not inintercept form. This equation has its advantages too because you can clearlyidentify the slope and one point on the line. Do you see the slope of 850 and the point (9, 307650) within the equation? This form of a linear equation isappropriately called the point-slope form.
Point-Slope Form
If a line passes through the point �x1, y1� and has slope b, the point-slope form of the equation is
y � y1 � b�x � x1�
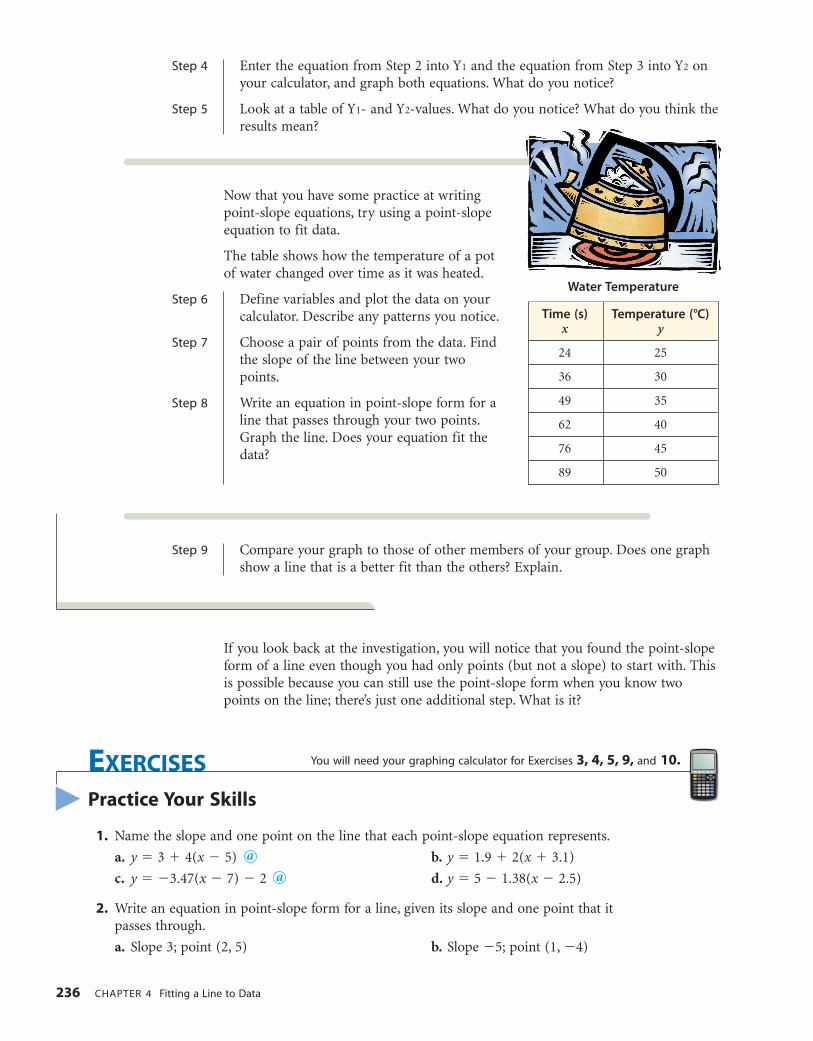
InvestigationThe Point-Slope Formfor Linear EquationsSilo and Jenny conducted an experimentin which Jenny walked at a constant rate.Unfortunately, Silo recorded only the datashown in this table.
Step 1 Find the slope of the line that representsthis situation.
Step 2 Write a linear equation in point-slope form using the point (3, 4.6) and the slopeyou found in Step 1.
Step 3 Write another linear equation in point-slope form using the point (6, 2.8) andthe slope you found in Step 1.
Elapsed Distance to
time (s) walker (m)
x y
3 4.6
6 2.8
DA2SE_763_04.qxd 10/17/2005 21:54 Page 235
236 CHAPTER 4 Fitting a Line to Data
Step 4 Enter the equation from Step 2 into Y1 and the equation from Step 3 into Y2 onyour calculator, and graph both equations. What do you notice?
Step 5 Look at a table of Y1- and Y2-values. What do you notice? What do you think theresults mean?
Now that you have some practice at writing point-slope equations, try using a point-slope equation to fit data.
The table shows how the temperature of a pot of water changed over time as it was heated.
Step 6 Define variables and plot the data on yourcalculator. Describe any patterns you notice.
Step 7 Choose a pair of points from the data. Findthe slope of the line between your twopoints.
Step 8 Write an equation in point-slope form for aline that passes through your two points.Graph the line. Does your equation fit thedata?
Step 9 Compare your graph to those of other members of your group. Does one graphshow a line that is a better fit than the others? Explain.
EXERCISES
Practice Your Skills
1. Name the slope and one point on the line that each point-slope equation represents.
a. y � 3 � 4(x � 5) b. y � 1.9 � 2(x � 3.1)
c. y � �3.47(x � 7) � 2 d. y � 5 � 1.38(x � 2.5)
2. Write an equation in point-slope form for a line, given its slope and one point that itpasses through.
a. Slope 3; point (2, 5) b. Slope �5; point (1, �4)
a
a
�
You will need your graphing calculator for Exercises 3, 4, 5, 9, and 10.
If you look back at the investigation, you will notice that you found the point-slopeform of a line even though you had only points (but not a slope) to start with. Thisis possible because you can still use the point-slope form when you know twopoints on the line; there’s just one additional step. What is it?
Time (s) Temperature (°C)x y
24 25
36 30
49 35
62 40
76 45
89 50
Water Temperature
DA2SE_763_04.qxd 10/17/2005 21:54 Page 236
LESSON 4.3 Point-Slope Form of a Linear Equation 237
3. A line passes through the points (�2, �1) and (5, 13).
a. Find the slope of this line.
b. Write an equation in point-slope form using the slope you found in 3a and thepoint (�2, �1).
c. Write an equation in point-slope form using the slope you found in 3a and thepoint (5, 13).
d. Verify that the equations in 3b and c represent the same line. Enter the equationsinto Y1 and Y2 on your calculator, and compare their graphs and tables.
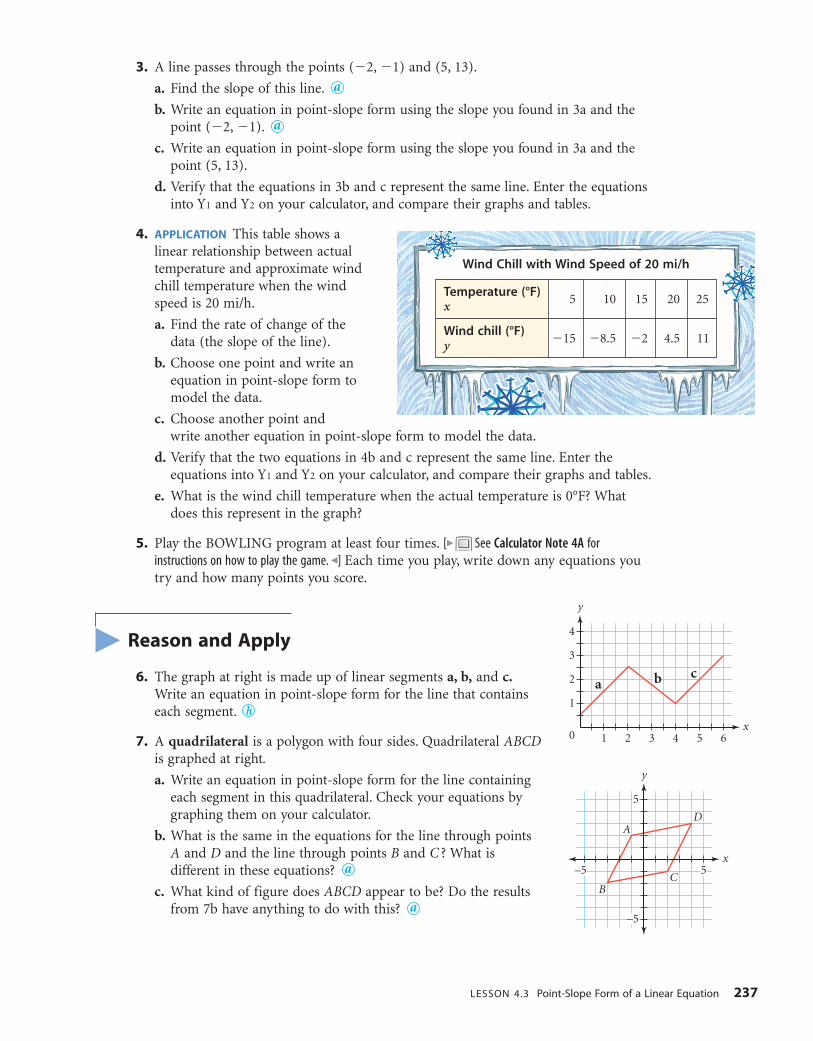
4. APPLICATION This table shows alinear relationship between actualtemperature and approximate windchill temperature when the windspeed is 20 mi/h.
a. Find the rate of change of thedata (the slope of the line).
b. Choose one point and write anequation in point-slope form tomodel the data.
c. Choose another point and write another equation in point-slope form to model the data.
d. Verify that the two equations in 4b and c represent the same line. Enter theequations into Y1 and Y2 on your calculator, and compare their graphs and tables.
e. What is the wind chill temperature when the actual temperature is 0°F? Whatdoes this represent in the graph?
5. Play the BOWLING program at least four times. [� See Calculator Note 4A forinstructions on how to play the game. �] Each time you play, write down any equations youtry and how many points you score.
Reason and Apply
6. The graph at right is made up of linear segments a, b, and c.Write an equation in point-slope form for the line that containseach segment.
7. A quadrilateral is a polygon with four sides. Quadrilateral ABCDis graphed at right.
a. Write an equation in point-slope form for the line containingeach segment in this quadrilateral. Check your equations bygraphing them on your calculator.
b. What is the same in the equations for the line through pointsA and D and the line through points B and C ? What isdifferent in these equations?
c. What kind of figure does ABCD appear to be? Do the resultsfrom 7b have anything to do with this? a
a
a
a
�
x
y
4
2 3 4 5 61
ac
1
2
3
0
b
x
y
5
5–5
AD
CB
–5
Temperature (°F) 5 10 15 20 25x
Wind chill (°F)�15 �8.5 �2 4.5 11y
Wind Chill with Wind Speed of 20 mi/h
DA2SE_763_04.qxd 10/17/2005 21:54 Page 237
238 CHAPTER 4 Fitting a Line to Data
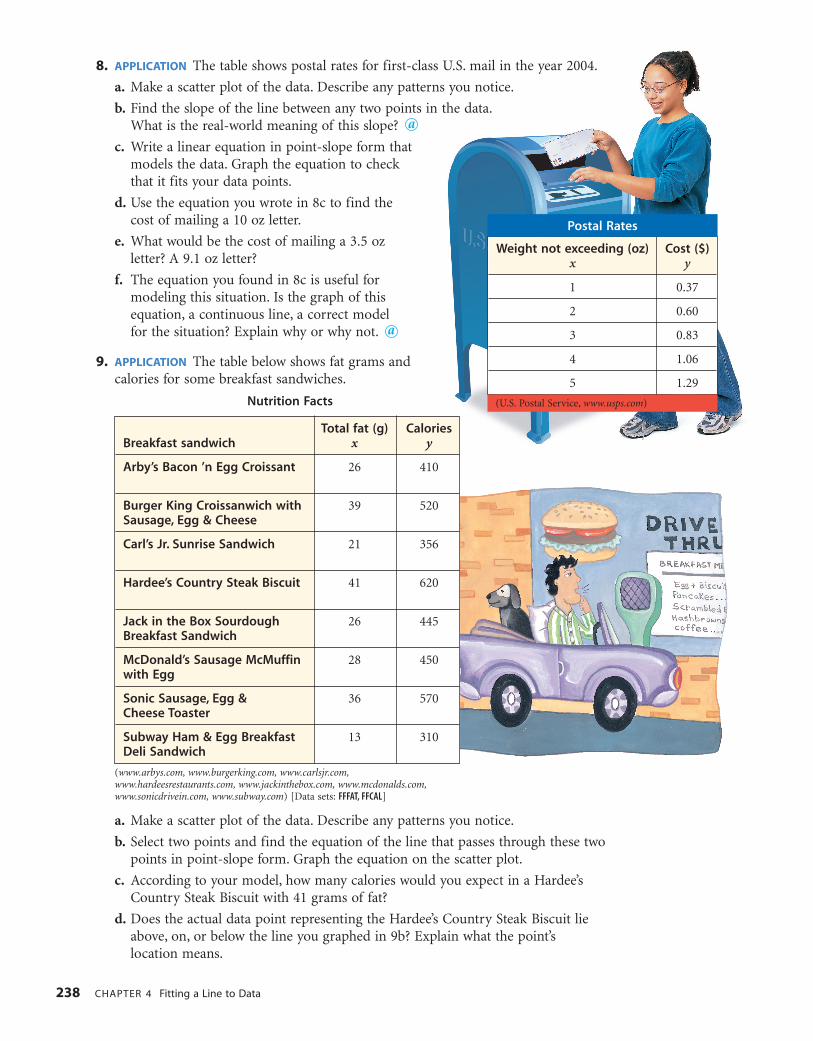
8. APPLICATION The table shows postal rates for first-class U.S. mail in the year 2004.
a. Make a scatter plot of the data. Describe any patterns you notice.
b. Find the slope of the line between any two points in the data.What is the real-world meaning of this slope?
c. Write a linear equation in point-slope form that models the data. Graph the equation to check that it fits your data points.
d. Use the equation you wrote in 8c to find the cost of mailing a 10 oz letter.
e. What would be the cost of mailing a 3.5 oz letter? A 9.1 oz letter?
f. The equation you found in 8c is useful for modeling this situation. Is the graph of this equation, a continuous line, a correct model for the situation? Explain why or why not.
9. APPLICATION The table below shows fat grams andcalories for some breakfast sandwiches.
a. Make a scatter plot of the data. Describe any patterns you notice.
b. Select two points and find the equation of the line that passes through these twopoints in point-slope form. Graph the equation on the scatter plot.
c. According to your model, how many calories would you expect in a Hardee’sCountry Steak Biscuit with 41 grams of fat?
d. Does the actual data point representing the Hardee’s Country Steak Biscuit lieabove, on, or below the line you graphed in 9b? Explain what the point’slocation means.
a
a
Weight not exceeding (oz) Cost ($)x y
1 0.37
2 0.60
3 0.83
4 1.06
5 1.29
Postal Rates
(U.S. Postal Service, www.usps.com)
Total fat (g) CaloriesBreakfast sandwich x y
Arby’s Bacon ’n Egg Croissant 26 410
Burger King Croissanwich with 39 520Sausage, Egg & Cheese
Carl’s Jr. Sunrise Sandwich 21 356
Hardee’s Country Steak Biscuit 41 620
Jack in the Box Sourdough 26 445Breakfast Sandwich
McDonald’s Sausage McMuffin 28 450with Egg
Sonic Sausage, Egg & 36 570Cheese Toaster
Subway Ham & Egg Breakfast 13 310Deli Sandwich
Nutrition Facts
(www.arbys.com, www.burgerking.com, www.carlsjr.com,www.hardeesrestaurants.com, www.jackinthebox.com, www.mcdonalds.com,www.sonicdrivein.com, www.subway.com) [Data sets: FFFAT, FFCAL]
DA2SE_763_04.qxd 10/17/2005 21:54 Page 238
LESSON 4.3 Point-Slope Form of a Linear Equation 239
�
e. Check each breakfast sandwich to find if its data point falls above, on, or belowyour line.
f. Based on your results for 9d and e, how well does your line fit the data?
g. If a sandwich has 0 grams of fat, how many calories does your equation predict?Does this answer make sense? Why or why not?
10. APPLICATION This table shows the amount of trash produced in the United States in 1990 and 1995.
a. Let x represent the year, and let y represent the amount of trash inmillions of tons for that year. Write an equation in point-slopeform for the line passing through these two points.
b. Plot the two data points and graph the equation you found in 10a.
c. In 2000, 232 million tons of trash were produced in the UnitedStates. Plot this data point on the same graph you made in 10b.Do you think the linear equation you found in 10a is a goodmodel for these data? Explain why or why not.
This table shows more data about theamount of trash produced in theUnited States.
d. Add these data points to your graph.Adjust the window as necessary.
e. Do you think the linear equation found in10a is a good model for this larger dataset? Explain why or why not.
f. Find the equation of a better-fittingline.
g. Use your new equation from 10f to predictthe amount of trash produced in 2010.
Review
11. APPLICATION The volume of a gas is 3.50 L at 280 K. The volume of any gas isdirectly proportional to its temperature on the Kelvin scale (K).
a. Find the volume of this gas when the temperature is 330 K.
b. Find the temperature when the volume is 2.25 L.
12. Find the slope of the line through the first two points given. Assume the third pointis also on the line and find the missing coordinate.
a. (�1, 5) and (3, 1); (5, ) b. (2, �5) and (2, �2); ( , 3)
c. (�10, 22) and (�2, 2); ( , �3)
13. Write the equation represented by this balance. Then solve the equation for x using the balancing method. a
�1�1
�1
�1
�1
�1 �1
�1 �1 �1
�x x
x x
x
x
a
a
a
U.S. Trash Production
Amount of trashYear (million tons)
1990 205
1995 214
(Environmental Protection Agency,www.epa.gov)
U.S. Trash Production
Amount of trashYear (million tons)
1960 88
1965 103
1970 121
1975 128
1980 152
1985 164
(Environmental Protection Agency,www.epa.gov) [Data sets: TRYR, TRAMT]
DA2SE_763_04.qxd 10/17/2005 21:54 Page 239