lessons learned: measuring program outcomes … program outcomes and using benchmarks . 1 . ......
TRANSCRIPT

August 21, 2013
Dale Hoffmeyer, DOE
Lessons Learned: Measuring Program Outcomes and Using Benchmarks
1

Better Buildings Residential Network: Connects energy efficiency programs and partners to share best practices to dramatically increase the number of homes that are energy efficient.
Membership: Open to organizations committed to accelerating the pace of existing residential upgrades. Grantees choose to join.
Commitment: Provide DOE with annual number of residential upgrades, and information about benefits associated with them.
Benefits: Peer Exchange Calls Tools, templates, & resources Newsletter updates on trends
Recognition: Media, materials Optional benchmarking Residential Solutions Center
RESIDENTIAL NETWORK

Inaugural Members:
For information & to join, email bbresidentialnetwork.ee.doe.gov
Austin Energy Boulder County
Local Energy Alliance Program (LEAP)
Mountain Association for Community Economic Development (MACED)
New York State Energy Research & Development Authority
RESIDENTIAL NETWORK
8/21/2013 4
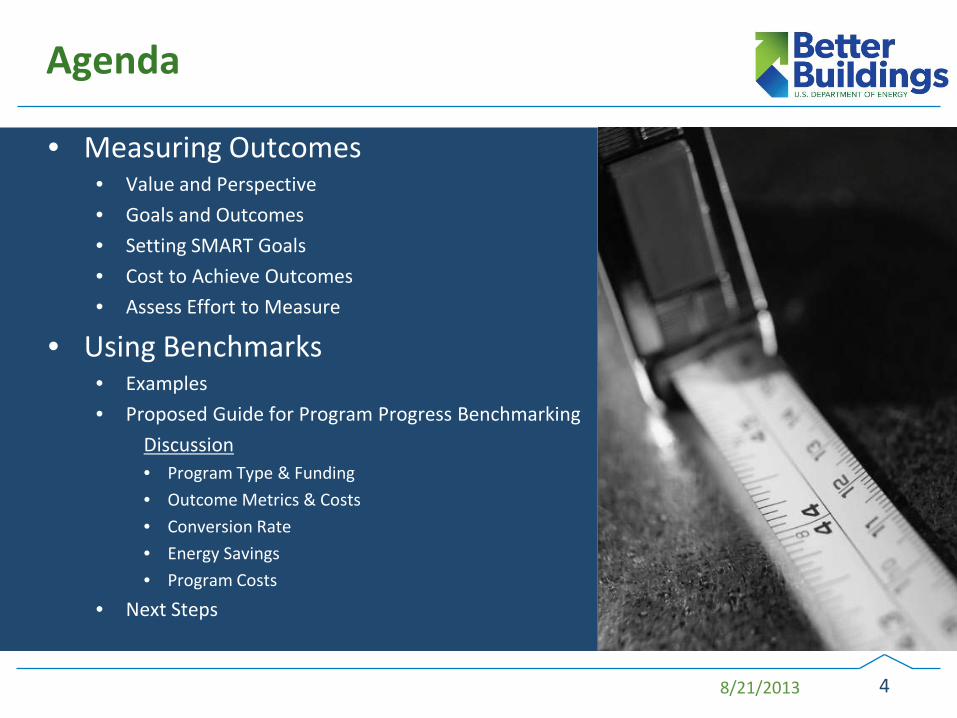
Agenda
• Measuring Outcomes • Value and Perspective
• Goals and Outcomes
• Setting SMART Goals
• Cost to Achieve Outcomes
• Assess Effort to Measure
• Using Benchmarks • Examples
• Proposed Guide for Program Progress Benchmarking
Discussion • Program Type & Funding
• Outcome Metrics & Costs
• Conversion Rate
• Energy Savings
• Program Costs
• Next Steps

8/21/2013 5
If at first you don’t succeed…
Success is what you define as the goal and objective of your program. But, if you can’t measure it, how will you know if you reached it?

8/21/2013 6
Key Takeaways
• Measuring program outcomes is a key to being successful
• Measuring program outcomes should be an integral part of program design planning
• Collecting and aggregating the information to measure program outcomes is challenging and should be assessed prior to making commitments
• Benchmarks can help set realistic goals, measure performance over time, and identify areas for improvement
Today’s webinar is intended to start a conversation about plans to draft a Guide for Program Benchmarking
• Draft available for stakeholder comment this Fall and an online tool for optional Better Buildings Residential Network (BBRN) program benchmarking next year

8/21/2013 7
Value
Measuring Program Outcomes: 1) Communicate progress
Policy goals are being achieved (energy savings, jobs, etc.)
Spending of public funds is effective
2) Assess when and where to make program design changes Spend less time trying to create the perfect program
design and more time measuring progress so that you can improve your design.
3) Justify continued or additional investment
However, individuals collecting or providing the data may not see the value for their immediate goals.
8/21/2013 8
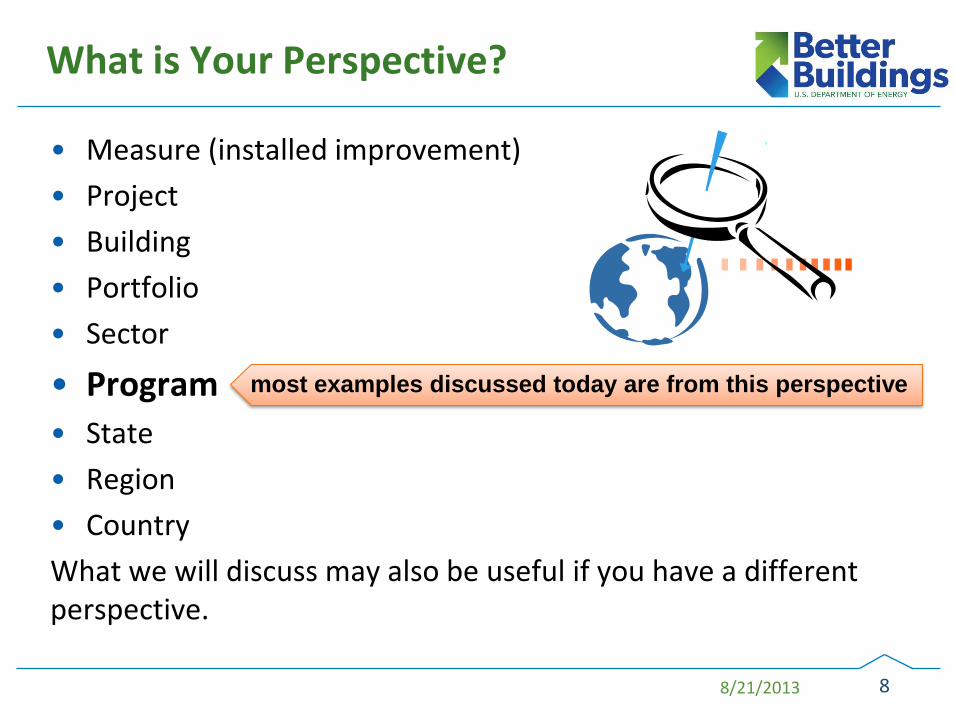
What is Your Perspective?
• Measure (installed improvement)
• Project
• Building
• Portfolio
• Sector
• Program • State
• Region
• Country
What we will discuss may also be useful if you have a different perspective.
most examples discussed today are from this perspective

8/21/2013 9
Goals and Outcomes
A program outcome is a measureable achievement that identifies progress toward a goal.
Goal: Improve the EE of homes in my community.
Outcome: Trained 20 new technicians in Building Science Fundamentals
Closed 150 EE loans
Participating contractors reported 180 home energy upgrades completed
The average participant saved 18% on energy bills
When planning your program, it is critical to consider what to measure.
Personal Example Goal: Beat My Personal Record (1:19:16 for 10 mile) Outcome: Average mile pace less than 7:50
8/21/2013 10
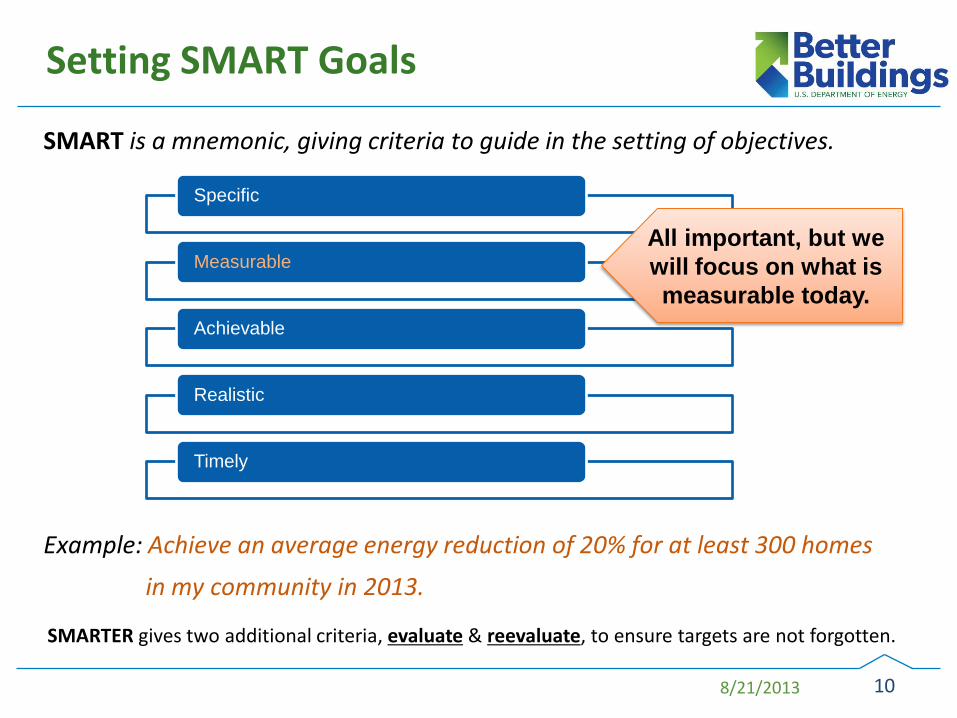
Setting SMART Goals
SMART is a mnemonic, giving criteria to guide in the setting of objectives.
Example: Achieve an average energy reduction of 20% for at least 300 homes
in my community in 2013.
Specific
Measurable
Achievable
Realistic
Timely
All important, but we will focus on what is measurable today.
SMARTER gives two additional criteria, evaluate & reevaluate, to ensure targets are not forgotten.
8/21/2013 11
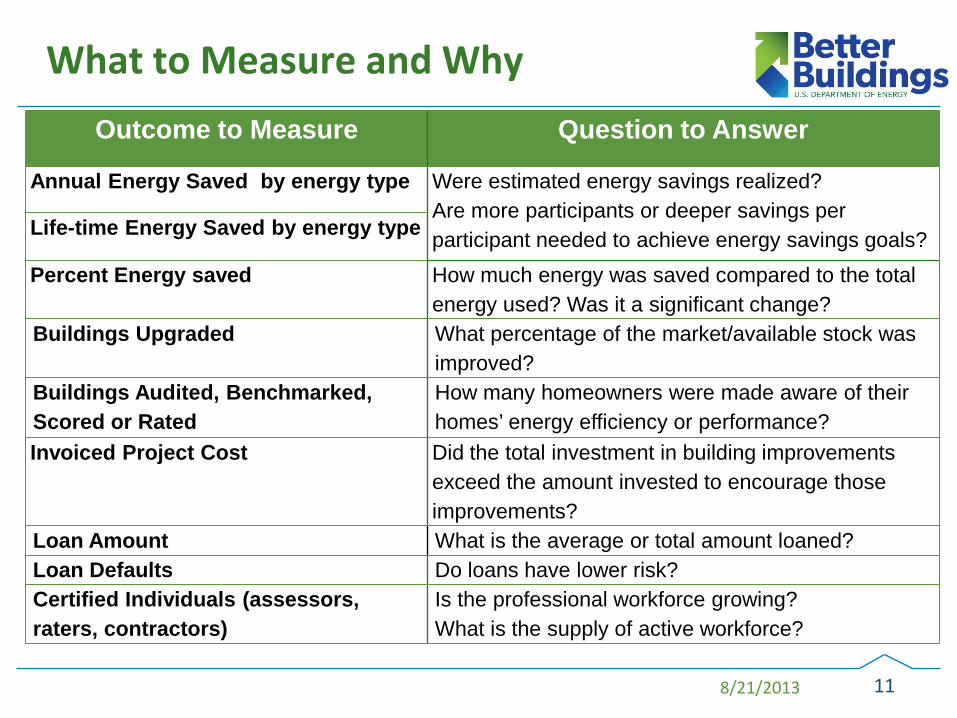
Outcome to Measure Question to Answer
Annual Energy Saved by energy type Were estimated energy savings realized? Are more participants or deeper savings per participant needed to achieve energy savings goals?
Life-time Energy Saved by energy type
Percent Energy saved How much energy was saved compared to the total energy used? Was it a significant change?
Buildings Upgraded What percentage of the market/available stock was improved?
Buildings Audited, Benchmarked, Scored or Rated
How many homeowners were made aware of their homes’ energy efficiency or performance?
Invoiced Project Cost Did the total investment in building improvements exceed the amount invested to encourage those improvements?
Loan Amount What is the average or total amount loaned? Loan Defaults Do loans have lower risk? Certified Individuals (assessors, raters, contractors)
Is the professional workforce growing? What is the supply of active workforce?
What to Measure and Why
8/21/2013 12
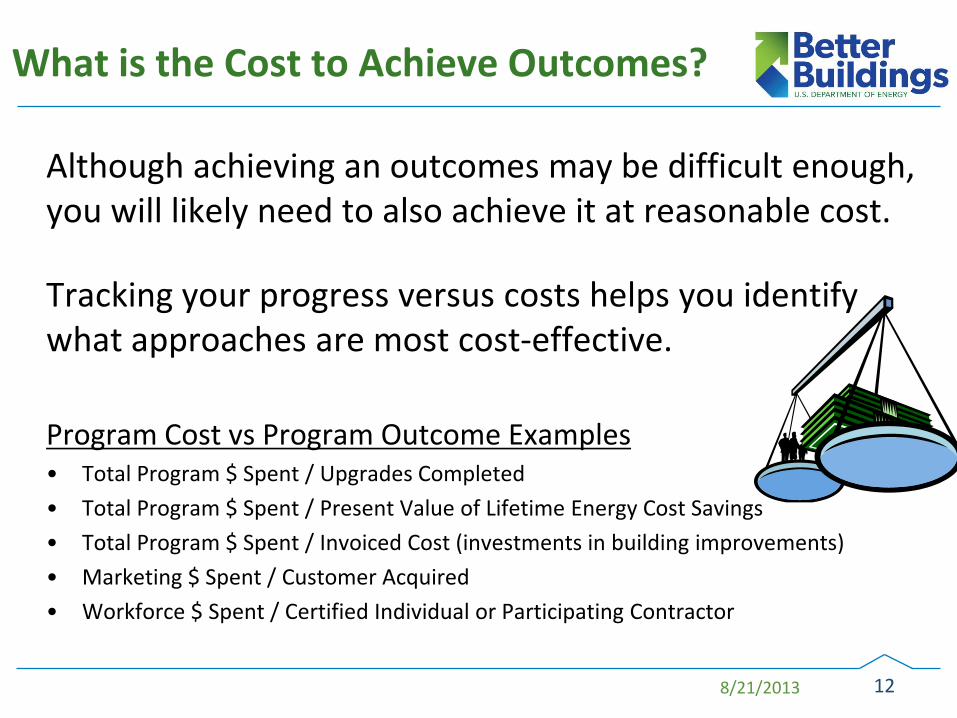
What is the Cost to Achieve Outcomes?
Although achieving an outcomes may be difficult enough, you will likely need to also achieve it at reasonable cost.
Tracking your progress versus costs helps you identify what approaches are most cost-effective.
Program Cost vs Program Outcome Examples • Total Program $ Spent / Upgrades Completed
• Total Program $ Spent / Present Value of Lifetime Energy Cost Savings
• Total Program $ Spent / Invoiced Cost (investments in building improvements)
• Marketing $ Spent / Customer Acquired
• Workforce $ Spent / Certified Individual or Participating Contractor

8/21/2013 13
Measurable: kWh saved, homes improved, workers trained, market penetration
Total Lifetime energy savings from all participants is measureable, but at what cost/burden?
Before committing to a goal, assess what data you need to collect, consolidate, clean and analyze to measure it. • Are savings estimates acceptable?
• How soon can it be measured? Three years or less?
• What type of mechanisms should be used to collect and store the data?
• How much will it cost?
Assess the Effort to Measure Outcomes

8/21/2013 14
Example
Program Goal: Reduce the average participant’s energy use 20% compared to last year.
Annual energy consumption (or an estimate) before participation for each participant.
Annual energy consumption (or an estimate) after participation for each participant.
Weather data OR an estimate of the percent
of energy saved by each participant.
Program Goal: Increase participation 5% from last year.
Total number of participants. Total number of participants
from the previous year.
What data needs to be collected to measure achievement of the goals?

8/21/2013 15
How to Avoid Chasing Your Data Collection Tail – Future Webinar
Defining a measureable goals and objective is the easy part, whereas collecting, cleaning, and aggregating the information to measure it seems to be more challenging and cost intensive.
Unless your data collection and aggregation process is Reliable,
Easy,
Consistent,
Timely,
Transparent
you can’t efficiently and effectively measure your objective.

Using Benchmarks
To Identify Goals and Track Progress
16
8/21/2013 17
Why Use Benchmarks?
A standard or point of reference in measuring or judging the current value or success of your company in order to determine your future business plans (entrepreneur.com)
• Benchmarking can be applied to any business process or function
• Identify markets, buildings or program performers that are energy leaders or laggards
• Identify targets (SMART goals)
• Identify program problem areas
• Measure performance over time (compared to past performance)
• Measure performance compared to peers (sector, regional, national)
8/21/2013 18
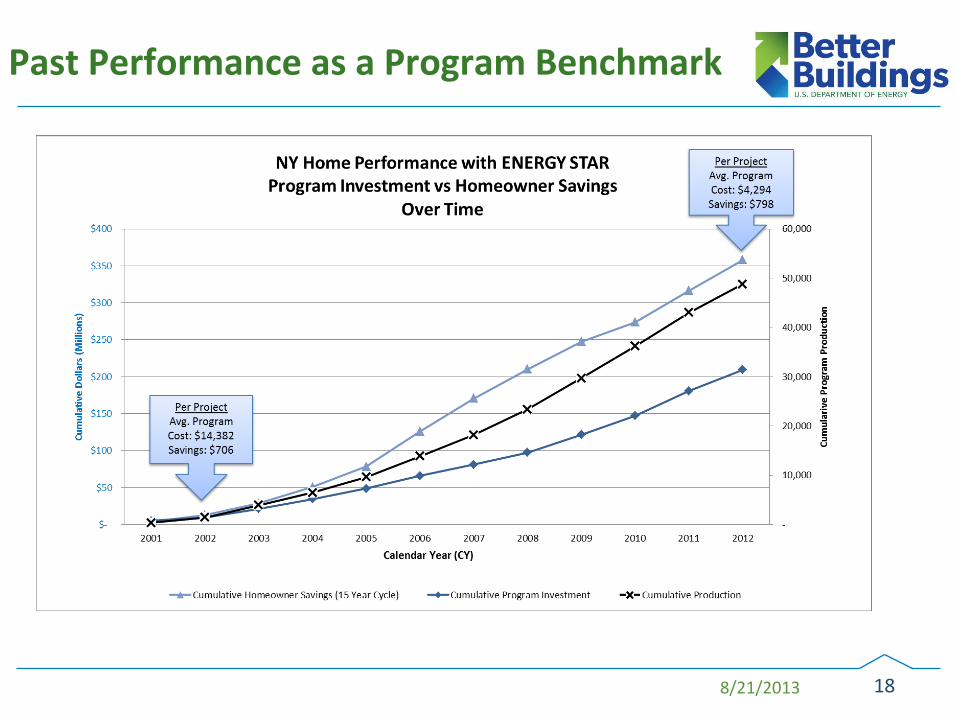
Past Performance as a Program Benchmark
8/21/2013 19
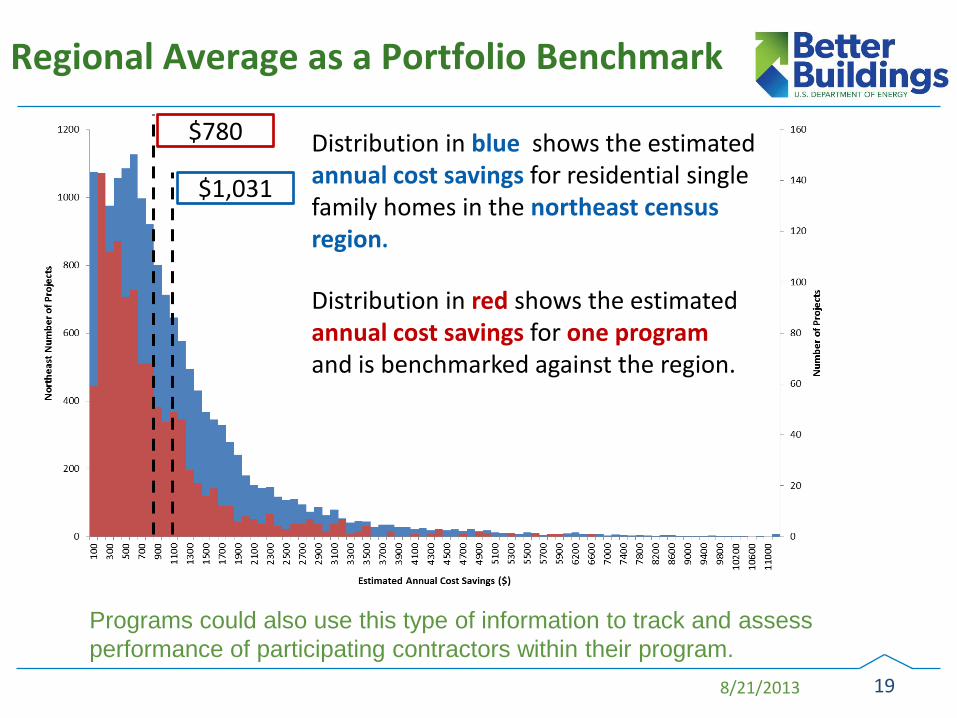
$780
$1,031
Distribution in red shows the estimated annual cost savings for one program and is benchmarked against the region.
Distribution in blue shows the estimated annual cost savings for residential single family homes in the northeast census region.
Programs could also use this type of information to track and assess performance of participating contractors within their program.
Regional Average as a Portfolio Benchmark

8/21/2013 20
Average Peer Group SIR as a Benchmark
savings-to-investment ratio (SIR) illustrative example
8/21/2013 21
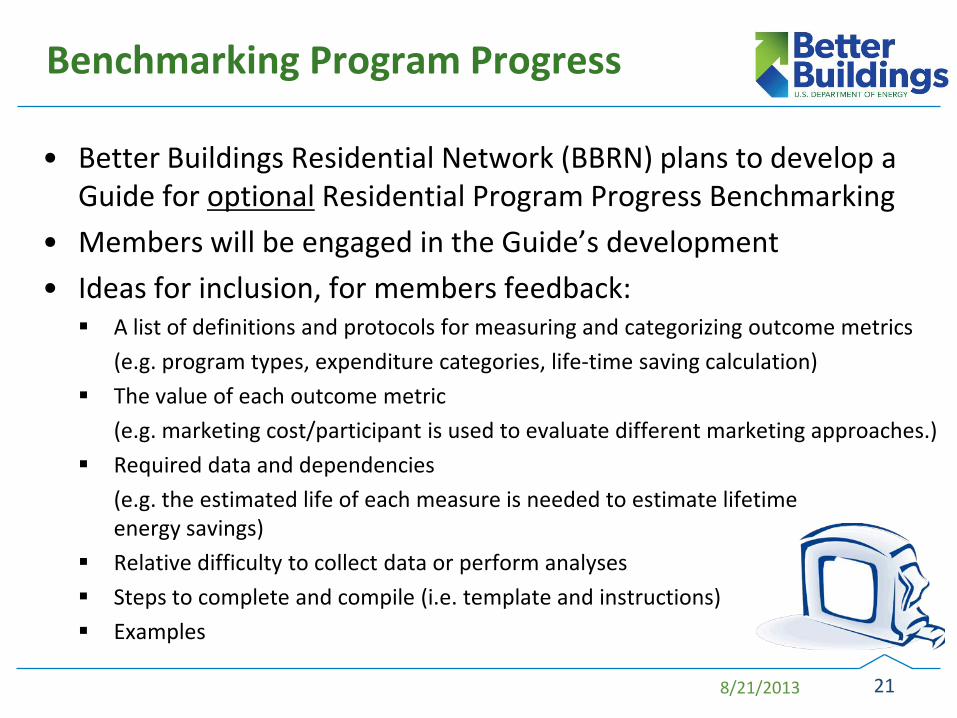
Benchmarking Program Progress
• Better Buildings Residential Network (BBRN) plans to develop a Guide for optional Residential Program Progress Benchmarking
• Members will be engaged in the Guide’s development
• Ideas for inclusion, for members feedback: A list of definitions and protocols for measuring and categorizing outcome metrics
(e.g. program types, expenditure categories, life-time saving calculation)
The value of each outcome metric
(e.g. marketing cost/participant is used to evaluate different marketing approaches.)
Required data and dependencies
(e.g. the estimated life of each measure is needed to estimate lifetime energy savings)
Relative difficulty to collect data or perform analyses
Steps to complete and compile (i.e. template and instructions)
Examples
8/21/2013 22
Next Steps
• [Today’s Webinar] Start a conversation to get preliminary feedback about Measuring Program Outcomes and Using Benchmarks.
• BBRN to draft Guide for Optional Residential Program Benchmarking for Stakeholder Comment (Fall 2013)
• Finalize Guide and Pilot with Up to 8 Better Buildings Residential Network Partners (Winter 2013-14)
• Evaluate Pilot and Revise for Online Tool (Spring 2014)
• Test Beta of Online Tool (Summer FY14)
8/21/2013 23
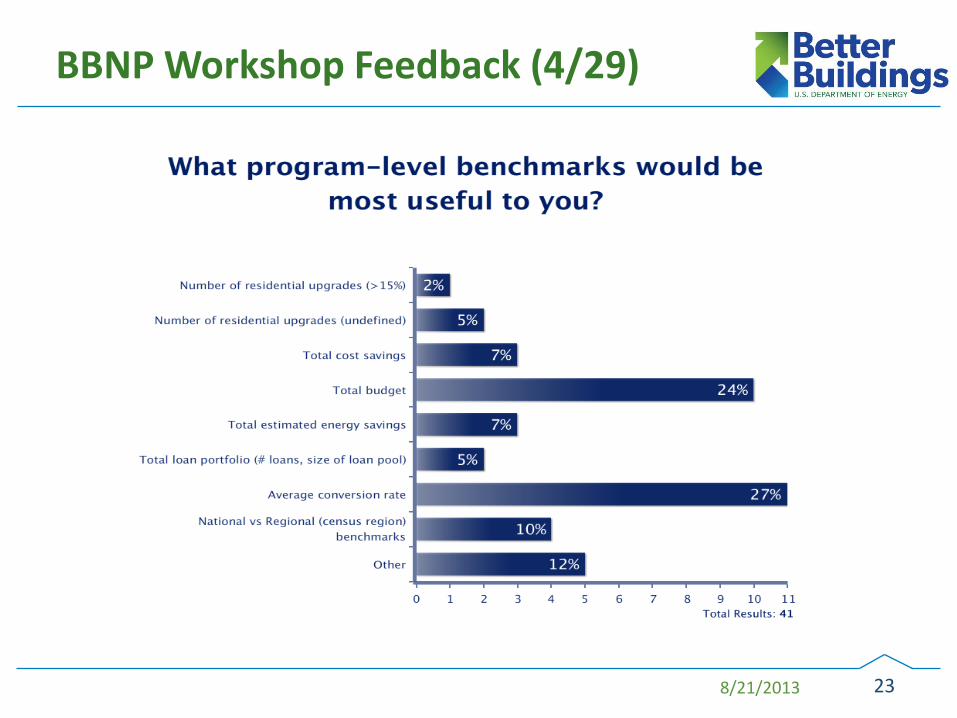
BBNP Workshop Feedback (4/29)

8/21/2013 24
BBNP Workshop Feedback (4/29)
8/21/2013 25
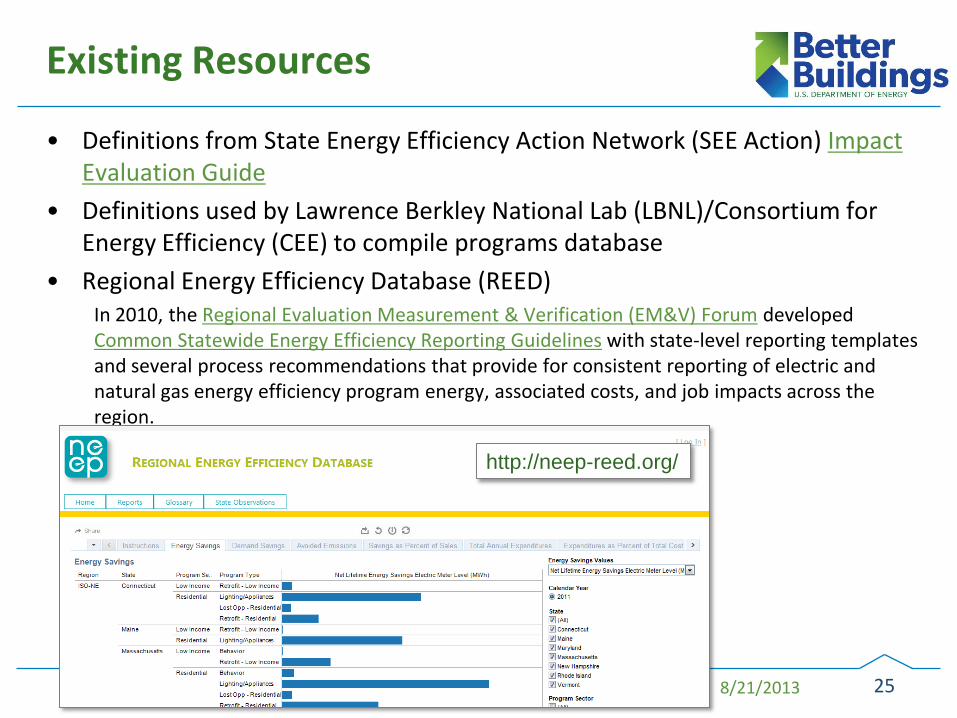
Existing Resources
• Definitions from State Energy Efficiency Action Network (SEE Action) Impact Evaluation Guide
• Definitions used by Lawrence Berkley National Lab (LBNL)/Consortium for Energy Efficiency (CEE) to compile programs database
• Regional Energy Efficiency Database (REED) In 2010, the Regional Evaluation Measurement & Verification (EM&V) Forum developed Common Statewide Energy Efficiency Reporting Guidelines with state-level reporting templates and several process recommendations that provide for consistent reporting of electric and natural gas energy efficiency program energy, associated costs, and job impacts across the region.
http://neep-reed.org/
8/21/2013 26
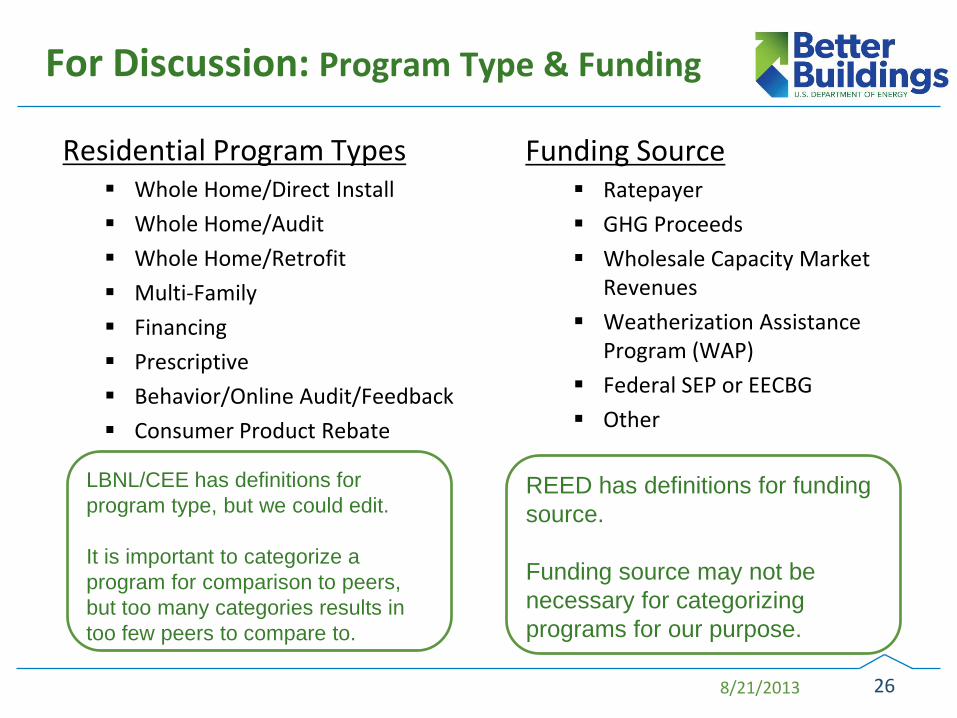
For Discussion: Program Type & Funding
Residential Program Types Whole Home/Direct Install
Whole Home/Audit
Whole Home/Retrofit
Multi-Family
Financing
Prescriptive
Behavior/Online Audit/Feedback
Consumer Product Rebate
Funding Source Ratepayer
GHG Proceeds
Wholesale Capacity Market Revenues
Weatherization Assistance Program (WAP)
Federal SEP or EECBG
Other
LBNL/CEE has definitions for program type, but we could edit. It is important to categorize a program for comparison to peers, but too many categories results in too few peers to compare to.
REED has definitions for funding source. Funding source may not be necessary for categorizing programs for our purpose.
8/21/2013 27
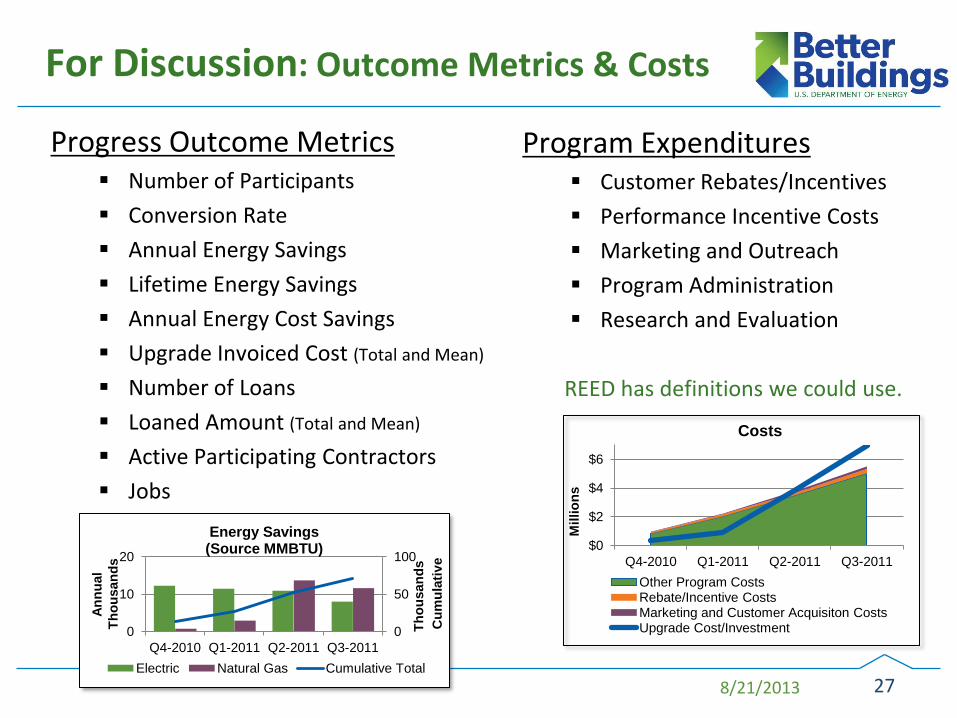
For Discussion: Outcome Metrics & Costs
Progress Outcome Metrics Number of Participants
Conversion Rate
Annual Energy Savings
Lifetime Energy Savings
Annual Energy Cost Savings
Upgrade Invoiced Cost (Total and Mean)
Number of Loans
Loaned Amount (Total and Mean)
Active Participating Contractors
Jobs
Program Expenditures Customer Rebates/Incentives
Performance Incentive Costs
Marketing and Outreach
Program Administration
Research and Evaluation
REED has definitions we could use.
0
50
100
0
10
20
Q4-2010 Q1-2011 Q2-2011 Q3-2011
Cum
ulat
ive
Thou
sand
s
Annu
al
Thou
sand
s
Energy Savings (Source MMBTU)
Electric Natural Gas Cumulative Total
$0
$2
$4
$6
Q4-2010 Q1-2011 Q2-2011 Q3-2011 M
illio
ns
Costs
Other Program Costs Rebate/Incentive Costs Marketing and Customer Acquisiton Costs Upgrade Cost/Investment
8/21/2013 28
Conversion Rate: Cautions/Questions
What is Meaningful to Measure? Audit-to-upgrade and non-participant-to-participant are two types of conversion
rates, but may not always be measuring the same thing. • Some programs only track upgrades completed (and require an audit) so you expect
reporting to show a 100% conversion rate.
• Some programs don’t require an audit (or they are not reported consistently) so you expect a conversion rate of > 100%.
Need to consistently define and measure the target audience and the participant based on the program type
Other Measurement Issues If all audits are reported, it is not possible to capture at one point in time the total
number that will lead to an upgrade. What is a reasonable time lag (3 or 6 months?) to expect a decision to upgrade?

8/21/2013 29
Energy Savings: Cautions/Questions Energy Cost Savings Good to communicate impact, but rate differences.
• Could look at program cost vs estimated lifetime cost savings
Annual Energy Savings
Doesn’t show full impact (over lifetime), but relatively easy to collect.
Need to document how savings were estimated or measured because there can be a wide difference (deemed savings vs modeled vs bills).
Do we provide estimated gross energy savings only or also options for adjusted gross (what can be reliably measured) and net energy savings (based on what is attributable to program)?
Lifetime Energy Savings
Shows impact over lifetime, but more difficult to collect and compile
Need to provide weighted average measure life • Could follow REED Guidelines for calculation
ENERGY TYPE GROSS
ENERGY SAVINGS NET
ENERGY SAVINGS UNITS Electicity kWh, MWh or MMBTU
Natural Gas Therms, CCF or MMBTU Other MMBTU

8/21/2013 30
Program Costs: Cautions/Questions • Marketing $ Spent /Participant
REED Guide combines Marketing and Administration costs because most programs couldn’t easily break it out.
Valuable for programs to track, but may be difficult to obtain.
• Levelized Cost and Lifetime Cost of Saved Energy Levelized Cost of Saved Energy captures the cost of efficiency as a resource
compared to supply-side resources.
• Need to agree on discount rate to use.
Lifetime Cost is easier, but doesn’t discount costs to a net present value
Could follow REED Guidelines
• What frequency is most useful for benchmarking progress over time? Monthly, Quarterly or Annually?

8/21/2013 31
Conclusions
• Measuring program outcomes is a key to being successful
• Planning how you measure program outcomes should be an integral part of program design planning
• Collecting and aggregating the information to measure program outcomes is challenging and should be assessed prior to making commitments
• Benchmarks can help set realistic goals, measure performance over time, and identify areas for improvement
Today’s webinar was intended to start a conversation about plans to draft a BBRN Guide for Residential Program Benchmarking
Draft available for stakeholder comment this Fall and an online tool for optional BBRN program benchmarking next year
Thank you for participating today