lessons learned unconv workshop may 2014 - coimce · lessons learned for us shale development ......
TRANSCRIPT

1
©20
14B
aker
Hug
hes
Inco
rpor
ated
.All
Rig
hts
Res
erve
d.
© 2014 BAKER HUGHES INCORPORATED. ALL RIGHTS RESERVED. TERMS AND CONDIT IONS OF USE: BY ACCEPTING THIS DOCUMENT, THE RECIPIENT AGREES THAT THE DOCUMENT TOGETHER W ITH ALL INFORMATION INCLUDED THEREIN IS THECONFIDENTIAL AND PROPRIETARY PROPERTY OF BAKER HUGHES INCORPORATED AND INCLUDES VALUABLE TRADE SECRETS AND/OR PROPRIETARY INFORMATION OF BAKER HUGHES ( COLLECTIVELY " INFORMATION") . BAKER HUGHES RETAINS ALL RIGHTSUNDER COPYRIGHT LAW S AND TRADE SECRET LAW S OF THE UNITED STATES OF AMERICA AND OTHER COUNTRIES. THE RECIPIENT FURTHER AGREES THAT THE DOCUMENT MAY NOT BE DISTRIBUTED, TRANSMITTED, COPIED OR REPRODUCED IN W HOLE ORIN PART BY ANY MEANS, ELECTRONIC, MECHANICAL , OR OTHERW ISE, W ITHOUT THE EXPRESS PRIOR W RITTEN CONSENT OF BAKER HUGHES, AND MAY NOT BE USED DIRECTLY OR INDIRECTLY IN ANY W AY DETRIMENTAL TO BAKER HUGHES’ INTEREST.
Lessons Learned
Alfredo Mendez
Business Development Director
Unconventional Resources-Eastern Hemisphere
Madrid, Spain
May 2014

2
©20
14B
aker
Hug
hes
Inco
rpor
ated
.All
Rig
hts
Res
erve
d.
U.S. Shale Basins (TRR - 665 Tcf & 58 BBO)
23 Significant Shale Basins in U.S. - 150,000+ producing wells16,000 Wells Drilled Every Year
McClure
Wolfcamp
Bakken
Antrim
Eagle Ford
Niobraraa

3
©20
14B
aker
Hug
hes
Inco
rpor
ated
.All
Rig
hts
Res
erve
d.
US Shale Plays
Formation Thickness - 20 - 600 ft
Depth Range - 6,500 - 13,500 ft (TVD)
Well IP’s - Gas = 2 - 10 MMcfd- Oil = 350-1800 BOPD (150-600 avg)
EUR per Well - Gas = 1.6 - 4.0 Bcf- Oil = 400 - 600 MBO
Primarily Dry Gas (Eagle Ford & Utica - Wet)
Shale Oil - Bakken*, Niobrara, Monterey, Eagle Ford, Wolfcamp (*Bakken not a shale;“shaley” LS + SS + DS - Tight Oil)
Some produce small amounts of water (Frac Flowback Water and Water Sourcing arethe major water handling concerns)
All Shales Are Not the Same - Geology, Mineralogy, Geochemistry VariesEven in the Same Basin/Play

4
©20
14B
aker
Hug
hes
Inco
rpor
ated
.All
Rig
hts
Res
erve
d.
Developing Shale Reservoirs – US Model
© 2012 Baker Hughes Incorporated. All Rights Reserved.
Shales must be Fracture Stimulated to produce commerciallyTwo Key Elements of shale gas development:
1. Multi-Stage Fracturing2. Horizontal Wells
(Maximize Reservoir Volume and NF’s Connected to Well)
Shale well Productivity depends on:Reservoir Quality andEffective Hydraulic Fracturing
• Vertical Wells - for reservoirdata and define play
Horizontal Wells to develop- Gas Laterals 3,000 - 6,000 ft
- Oil Laterals to 7,000 - 10,000+ ft
Well Spacing Avg. ~80 acres – Gas
~160 acres – Oil

5
©20
14B
aker
Hug
hes
Inco
rpor
ated
.All
Rig
hts
Res
erve
d.
Number of Wells to Develop 1 TCF of Shale Gas
Shale Gas Development Requires Large Number of Wells
Shale Gas Development Requires a Large Number of Wells

6
©20
14B
aker
Hug
hes
Inco
rpor
ated
.All
Rig
hts
Res
erve
d.
TRR - Technically Recoverable Resources
Source: EIA, Simmons and Others
Major Shale Gas Play Comparison

7
©20
14B
aker
Hug
hes
Inco
rpor
ated
.All
Rig
hts
Res
erve
d.
Major Shale Oil Plays
TRR = Technical Recoverable Resources
Niobrara and Utica very early data

8
©20
14B
aker
Hug
hes
Inco
rpor
ated
.All
Rig
hts
Res
erve
d.
-
2,000
4,000
6,000
8,000
10,000
12,000
14,000
Jan-81 Jan-83 Jan-85 Jan-87 Jan-89 Jan-91 Jan-93 Jan-95 Jan-97 Jan-99 Jan-01 Jan-03 Jan-05 Jan-07 Jan-09 Jan-11 Jan-13 Jan-15
Ave
rage
Dai
lyP
rod
uct
ion
Peak
mo
nth
(MC
FD)
Date
Learning Curve – Barnett Shale
8
MultistageCompletions
DirectionalVertical Horizontal
Unconventional Resource Development

9
©20
14B
aker
Hug
hes
Inco
rpor
ated
.All
Rig
hts
Res
erve
d.
Lessons Learned for US Shale Development
Data Collection and Management is critical and needs to be planned early
Proactive engagement with operators in developing regulation (US)
Solutions depend significantly on the geology of the shale and theparticular regional characteristics
Invest in creative water management options
Logistics operating model will impact congestion and efficiency of FracSand, Water, Oil, Rig and Equipment movement
© 2013 Baker Hughes Incorporated. All Rights Reserved.9

10
©20
14B
aker
Hug
hes
Inco
rpor
ated
.All
Rig
hts
Res
erve
d.
Baker Hughes Data-Driven ApproachAcross the Asset Life Cycle
High-Grade
Acreageand
TargetSweetSpots
Optimal
WellPlacement
DrillingPrecision
andEfficiency
TargetedFrac StagePlacement
Characterize
Lateral
OptimizeWellbore
Completion
OptimizeThe
FractureTreatment
Design
ProductionOptimization
WaterManagement
Refrac toImproveUltimateRecovery
1 2 3 4 5 6 7 8
Exploration
Appraisal
DevelopmentProduction
Rejuvenation
Asset Life Cycle
Delineating Sweet Spots / High-Grading Acreage
Optimizing Field Development / Lateral Placement
Delivering Drilling Efficiency and Precision
Characterizing The Lateral to Target Frac Placement
Optimizing The Fracture Design
Selecting Effective Wellbore Completions
Monitoring and Refining Fracture Stimulation
Maintaining Continuous Production Flow and
Managing The Water Cycle
Refracturing To Improve Ultimate Recovery
“Steps to Success - Increased Recovery”
11
©20
14B
aker
Hug
hes
Inco
rpor
ated
.All
Rig
hts
Res
erve
d.
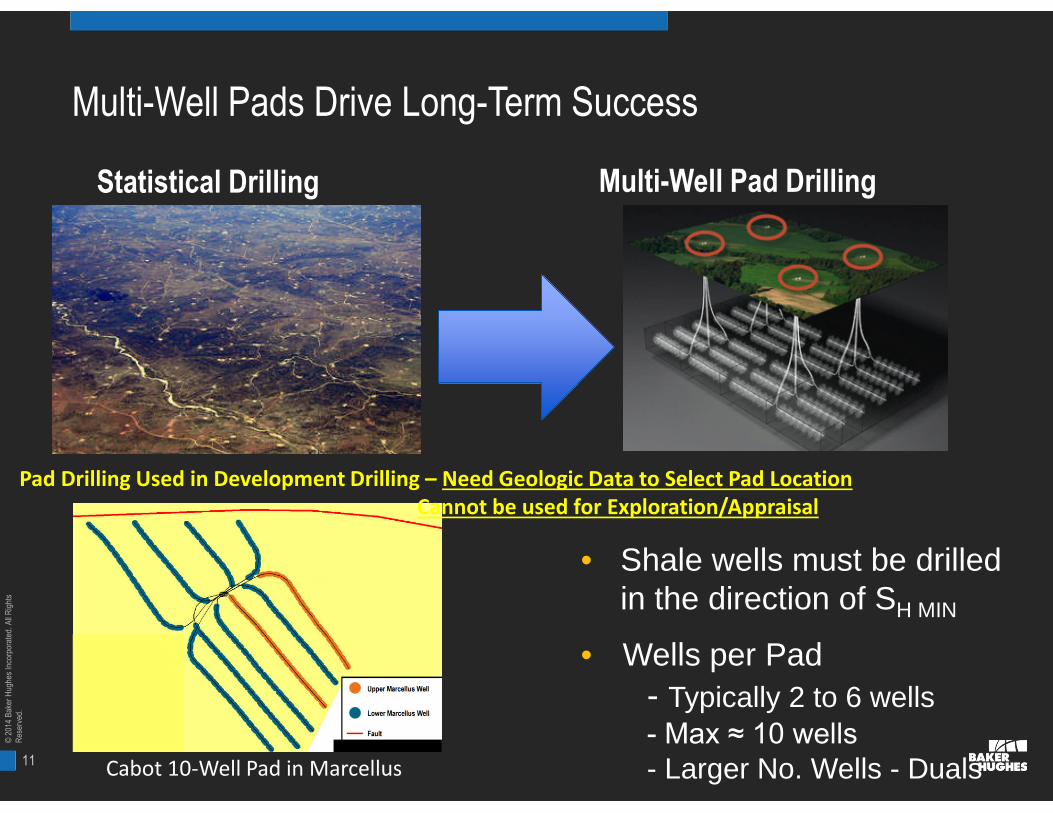
Multi-Well Pads Drive Long-Term Success
Statistical Drilling Multi-Well Pad Drilling
• Shale wells must be drilledin the direction of SH MIN
• Wells per Pad
- Typically 2 to 6 wells- Max ≈ 10 wells- Larger No. Wells - DualsCabot 10-Well Pad in Marcellus
Pad Drilling Used in Development Drilling – Need Geologic Data to Select Pad LocationCannot be used for Exploration/Appraisal
12
©20
14B
aker
Hug
hes
Inco
rpor
ated
.All
Rig
hts
Res
erve
d.
Benefits of Pad Drilling
Environmental– Dramatically minimize surface disturbance (consolidation of surface
drilling and production equipment)
– Reduces an Operator’s impact on developable land
– Minimizes wildlife disturbance
– Requires fewer access roads to multiple pads (single wells) vs singlepad for multiple wells
– Reduced truck traffic (emissions)
– In populated areas – smaller surface footprint better communityrelations

13
©20
14B
aker
Hug
hes
Inco
rpor
ated
.All
Rig
hts
Res
erve
d.
Environment Constrain – Traffic
133,950 1,810
Horizontal 3X Vertical

14
©20
14B
aker
Hug
hes
Inco
rpor
ated
.All
Rig
hts
Res
erve
d.
Hydraulic Fracturing
• Logistics for Hydraulic Fracturing is the Major Concern
Significant Equipment and Materials
- Pump Trucks: Approx 15,000 to 20,000 HHP typical Job
- Water = 1,000 bbl frac Fluid/Stage + Site Storage
(Total Well = 15,000 bbls)
- Sand/Proppant = 320,000 lbm /Stage + Site Storage
(Total Well = 4.8 Mil lbms = 2,400 Tons)
• US Water Trucked, Proppant Trucked or Rail car (track/line) Pump Trucks, andStorage Tanks via Road
• Rail In Eagle Ford Shale (Next Slide)

15
©20
14B
aker
Hug
hes
Inco
rpor
ated
.All
Rig
hts
Res
erve
d.
Three Principal Components of Costs of Water Management (USCosts)
1. Acquisition Costs($0.25/bbl - $1.75/bbl)
• Sourcing costs to acquire fresh water fromsurface waters, ground water and municipalstorage
• These Costs tend to be consistent betweendifferent resource plays. Bakken has seengreatest inflation in sourcing costs.
2. Hauling Costs($0.63/bbl - $10.00/bbl)
• Includes Transporting Sourced Water toWell and Flowback / Produced Water toDisposal
• These Costs tend to be most variablebetween resource plays. Marcellus haulingcosts higher due to strong regulations.
3. Disposal Costs($0.50/bbl - $3.00/bbl)
• Disposal Costs vary between resourceplays and are generally supported bystrong regulations.
Apache 50 Wolfcamp Shale Wells
• Water Source brackish water from SantaRosa aquifer and recycled flowback andproduced water
• $0.29/bbl - Treat Flowback Wtr• $2.50/bbl - Disposal costs

16
©20
14B
aker
Hug
hes
Inco
rpor
ated
.All
Rig
hts
Res
erve
d.
What to do?
Begin with the Hydraulic Fracturing in Mind!

17
©20
14B
aker
Hug
hes
Inco
rpor
ated
.All
Rig
hts
Res
erve
d.
In order to get long/bigger fractures:
•Improve fluid loss control
•Increase the pumping rate•Higher Friction•Higher Net pressure•More HHP•More than 15 K psi
High Frac Fluid Leak Off
BHFP
Q
Q leakoff
V Fracture = t * (Q-Q leakoff) = V pumped - V leaked
Q Leakoff - f (Cw, DP, Lf, etc)
Usual Gradientsat 16,000 ft
Frac: 0.7 - 0.95 psi/ft
Pore: 0.3 - 0.35 psi/ft
Very low fluid efficiency – Short/SmallFractures
The issues!

18
©20
14B
aker
Hug
hes
Inco
rpor
ated
.All
Rig
hts
Res
erve
d.
Bring the Gorillas
19
©20
14B
aker
Hug
hes
Inco
rpor
ated
.All
Rig
hts
Res
erve
d.
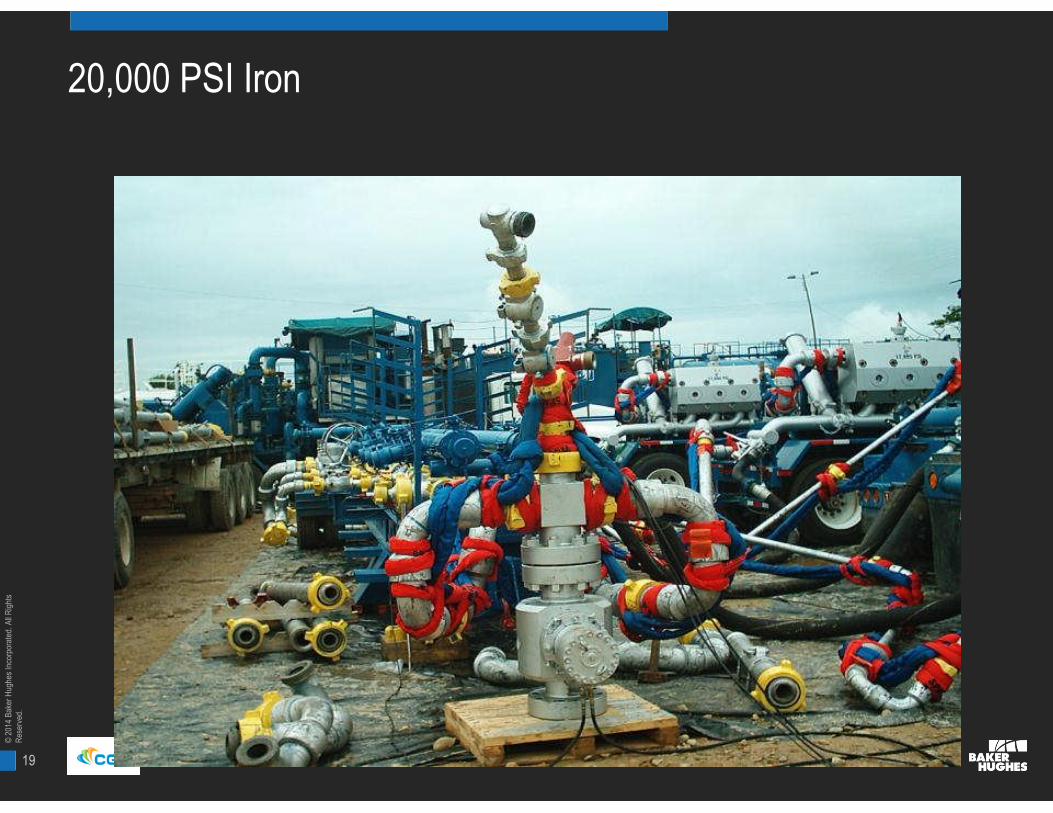
20,000 PSI Iron

20
©20
14B
aker
Hug
hes
Inco
rpor
ated
.All
Rig
hts
Res
erve
d.
First Campaign
# WellRATE
bpm
STP
psi
StressGrad.
psi/ft
FE
%
BHTPpsi
HSP lbs
Surf. Bottom
Max. Conc.
Ppa
1 I 33 15,240 0.95 6.3 18,500 190,300 185,400 8 / 8
2 I 42 15,000 0.75 5.9 18,500 181,600 168,000 8 / 6.4
3 II 41 13,500 0.67 11 17,500 408,600 398,000 11 / 11
4 II 39 16,500 0.74 8 25,000 433,000 389,600 8 / 8
5 III 35 14,250 0.93 14 18,200 99,400 68,700 5.8 / 5.4
6 IV 35 15,500 0.96 15 17,000 137,400 125,100 6.2 / 6.2

21
©20
14B
aker
Hug
hes
Inco
rpor
ated
.All
Rig
hts
Res
erve
d.
Actual Jobs
15,200 PSI

22
©20
14B
aker
Hug
hes
Inco
rpor
ated
.All
Rig
hts
Res
erve
d.
Another one
16,200 PSI

23
©20
14B
aker
Hug
hes
Inco
rpor
ated
.All
Rig
hts
Res
erve
d.
Test the Fluid the Right Way!

24
©20
14B
aker
Hug
hes
Inco
rpor
ated
.All
Rig
hts
Res
erve
d.
Petrophysics: “Shales” have variable mineralogy…
© 2009 Baker Hughes Incorporated. All Rights Reserved.
BarnettHaynesvilleMontney MarcellusEagle Ford

25
©20
14B
aker
Hug
hes
Inco
rpor
ated
.All
Rig
hts
Res
erve
d.
Characterize the Lateral for Completion Optimization
Optimized locations for frac stages

26
©20
14B
aker
Hug
hes
Inco
rpor
ated
.All
Rig
hts
Res
erve
d.
Unconventional Shale Reservoir Petrophysical Evaluation:Lateral Characterization
Currently only a few operators are acquiring petrophysical, geological or geomechanical information inhorizontal laterals.
Those who have reported improved well productivity from more effective stimulation and completionperformance.
The most frequently used technology is LWD resistivity Imaging.
© 2012 Baker Hughes Incorporated. All Rights Reserved.2

27
©20
14B
aker
Hug
hes
Inco
rpor
ated
.All
Rig
hts
Res
erve
d.
Geological Characterization: StarTrak Analysis in Horizontal Lateral to Optimize Stimulationand Completion Performance
© 2012 Baker Hughes2
Open Fractures
Partial Fractures
Shear Fractures
Faults
Open Fractures
Partial Fractures
Shear Fractures
Faults
Stages
WellborePath
Gamma RayModel
Gamma RayReal-time
Static ResistivityImage
Depth (ft)
Dip, Angle
Gamma
7,000 8,750 9,000 9,250 9,5007,750 8,000 8,250 8,5007,250 7,500
8 6 5 4 3 2 17

28
©20
14B
aker
Hug
hes
Inco
rpor
ated
.All
Rig
hts
Res
erve
d.
Niobrara Completion Study
Electrical Image
Completion Stages
RNS Correlation
Production
Stimulation Summary
91013 111215 14 2345678 1
Lower in zone =Better Frac
5% of Production20% of Frac Dollars
Higher in Zone not as productive
78% of Production60% of Frac Dollars
17% of Production20% of Frac Dollars
Comparing Electrical Images, Production by Stage, and Frac Dollars

29
©20
14B
aker
Hug
hes
Inco
rpor
ated
.All
Rig
hts
Res
erve
d.
2
Completion Recommendations
Isolate faultLower volume fracture
Isolate fault
15 4 3 210 9 8 7 6
Move sleeve towards lower packerTail in with higher ppg sandWalk away?
Aggressive tie-inHigher PPG
Combine Stages

30
©20
14B
aker
Hug
hes
Inco
rpor
ated
.All
Rig
hts
Res
erve
d.
Relating stage contributions to production: Impact on FieldDevelopment Plan
Rates measured by PLT 5 months later
7 6 5 4 3 2 189
302520151050
13 247 5689
Naturalfractures
Events

31
©20
14B
aker
Hug
hes
Inco
rpor
ated
.All
Rig
hts
Res
erve
d.
“Good Science Leads to Good Engineering”