let my patients flow-streamlining the or suite
TRANSCRIPT

Let My Patients Flow!
Patient Flow Summit
2015
1

Agenda
• Background
• Approach
• Process Improvement Teams
• Simulation Model
• Results
• Q&A
2

Robert Wood Johnson University Hospital
965-bed Academic Medical Center located in New Brunswick, NJ
Principal Teaching Hospital of Rutgers Robert Wood Johnson Medical School
Flagship Hospital of multi-hospital system
Centers of Excellence: Cardiovascular; Cancer; Women’s & Children’s; Neuroscience Center of Excellence; Level 1 Trauma Center
Located mid-way between New York and Philadelphia, serving six county population of approximately 1.4 M
Owner of Physician-Led Accountable Care Organization
3

4

Situation at RWJUH
Anticipated a significant increase in patient volume for the OR suite. As a
major source of revenue for the hospital, the leadership team needed to
make sure the OR suite was as efficient as possible while also minimizing
costs.
Due to the highly variable nature of work flow in the OR and the expenses
involved in managing the projected increase of volume, as well as the
introduction of case carts into the OR system, leadership requested that an
objective data driven analysis be conducted in order to assure optimal
performance of the OR suite.
5

Key Considerations/Potential Pitfalls when writing the
Problem Statement
Is the problem based on observation (fact) or assumption (guess)?
Does the problem statement prejudge a root cause?
Can data be collected by the team to verify and analyze the problem?
Is the problem statement too narrowly or broadly defined?
Is a solution included in the statement?
Would customers be happy if they knew we were working on this?
Problem Statement
6

RWJUH Problem
• Environmental factors driving a significant volume increase
• Introducing case carts to improve material flow and control
• OR utilization not acceptable
• Significant OR “churn” resulting in staff and patient stress
• Significant OR hold time due to PACU utilization issues
7
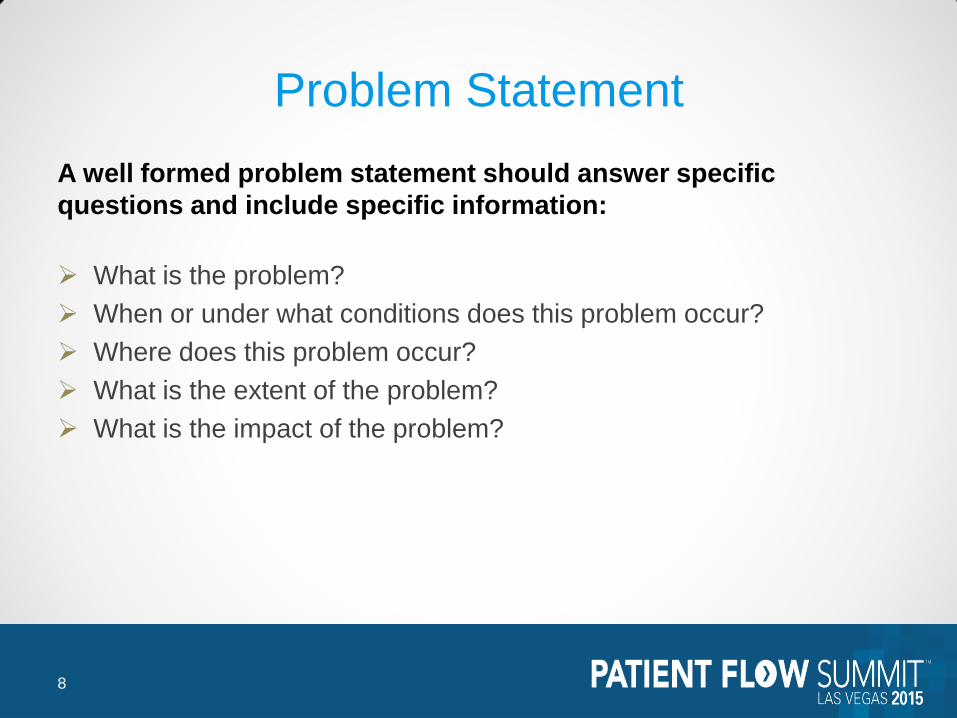
Problem Statement
A well formed problem statement should answer specific
questions and include specific information:
What is the problem?
When or under what conditions does this problem occur?
Where does this problem occur?
What is the extent of the problem?
What is the impact of the problem?
8

Simulation
9

Identify Your Business Goal From Your Project Sponsor
Identify Which of Those Goals Your Project Supports
Goal Statement
10

The Purpose of the Problem Statement
Is to Describe What Is Wrong
The Goal Statement Defines
The Team’s Improvement Objective
Problem vs. Goal Statement
11

Defines the improvement the team is seeking to accomplish
Starts with a verb (e.g., reduce, eliminate, control, increase)
Tends to start broadly—eventually should include measurable target and
completion date
Must not assign blame, presume cause, or prescribe solution!
Example:
Reduce the number of ER turnaround times for level 2 type patients
beyond 1.5 hours by 50% from 500 to 250 by January 1
Goal = Project Improvement Objective
The Goal Statement
12

RWJUH Problem / Goal
“Problem” - Old system processes and infrastructure made efficiency a daily
challenge with a growing perioperative service line. Competing stakeholders
with competing cultures and goals. Highly variable work flow in the OR, high
cost inefficient set-up with the introduction of new systems and targeted
expansion putting pressure on phasing and new work flow processes.
“Goal” – Improve overall efficiency of the OR Suite for both adult and
pediatric services while also minimizing costs. Leadership requested that
lean teams were deployed to ensure maximum return on investment of our
new COE dedicated to pediatric surgery, new dedicated robotic suites,
expanded PACU capacity and a new highly functioning case cart system.
13

Stakeholder Analysis
A Stakeholder is any person or group of people who are:
• Responsible for the final decision
• Likely to be affected, positively or negatively, by the outcomes
you want
• In a position to assist or block achievement of the outcomes
• Experts or special resources that could substantially affect the
quality of your end product/service
• Can have influence over other stakeholders
Identify those individuals with an interest in the process and what
their positions on a particular Six Sigma Change might be.
14

Stakeholder Analysis
SA MA N MS SS
Stakeholder A X
Stakeholder B X
Stakeholder C X X
Stakeholder D X X
Stakeholder E X X
Stakeholder F X X
Stakeholder G X
Stakeholder H X
Stakeholder I X
Stakeholder J X
Stakeholder K X X
15

Sources of Resistance
Source of
Resistance
Definition/Causes
of Resistance
Some Strategies for Overcoming
Resistance
Technical
Political
Cultural
Habit and inertia
Difficulty in learning new skills
Lack of skills
Threat to status quo
See Initiative as a “loss”
Power and authority
imbalance or self-
preservation
Control Issues
Locked into old "mindset“
Afraid of letting go
Provide education and training
Provide coaches, green belts, tools / job aids
Get people involved
Do a cultural audit: what beliefs drive us?
Articulate desired mindset and gaps
Give resistor control over the initiative
Give the resistor credit for the change
Empathize with the loss and show WIIFM
Do a political map to understand influence patterns
Provide “safe exits” and/or alternate job designs
New measures and rewards -- customer driven
Clarify roles and responsibilities -- accountabilities
16

Approach
• Form clinical based process improvement teams
• Teams define the processes
• Teams gather data on the processes
• Teams to recommend process changes
• Teams to guide change implementation
• Need arose to verify process changes prior to implementation and define which changes worked well together in combination
17

Charter Development
18

How do we remove the causes of the defects?
How can we maintain the improvements? Control
Define
Measure
Analyze
Improve
Who are the customers and what are their
priorities?
How is the process performing and how is it
measured?
What are the most important causes of the
defects?
ANALYZE
19

An approved charter establishes the purpose and plan for the project. The key
elements of the charter are:
Problem Statement
Project Timeline
Goal
Project Scope
Milestones
Team Members, Stakeholders and Roles
Develop Team Charter - Objectives
A charter: Clarifies what is expected of the team
Keeps the team focused
Keeps the team aligned with organizational priorities
Transfers the project from the Project Sponsor to the project team
20

Process Improvement Teams
• Formed steering team of clinical personnel who manage the work in the area affected
• Formed process oriented clinical teams for each major process
• Team supported by training and central quality improvement resources
• Started team and asked team if others were required to ensure all stakeholders involved
• Teams set goals for process improvement
21

How do you want the Project Sponsor to work with the team? Is the team’s
role to implement or recommend?
When must the team go to the Project Sponsor for approval?
What authority does the team have to act independently?
What and how do you want to inform the Project Sponsor about the team’s
progress?
What is the role of the team leader (Black Belt) and the team coach (Master
Black Belt)?
Are the right members on the team? Functionally? Hierarchically?
Team Member Roles
22

Process Improvement Teams • Teams created a flowchart of the
process under study
• Teams measured current performance
• Teams brainstormed changes and selected those rated most effective in reaching the goal
• Team reported to central steering committee
• Team and steering committee agreed on implementation – What
– How
– Time Frame
23

ROLE RESPONSIBILITIES BEHAVIORS
Executive Sponsor
Strategic guidance
Active participation (Regular mtgs, event kick offs & report outs)
Eliminate barriers
Communication to admin staff & organization
Committed to success of project
Trusts process
Fosters feeling of unity
Respect for team
Empowers team
Project Owner
Oversight & results of project
Team selection
Hold team accountable
Communication: Report status (up and down)
Monitor progress & attend regular progress mtgs
Sustain improvements after project completion
Recognize achievements
Mentors team members
Inspires team members
Utilizes listening skills
Maintains team focus
Team Leader
Content expert & team member,
Provide data as needed, coordinate observations
Recommend team members
Manage team focus / progress / follow-up, help lead meetings
Communication (Work with facilitator & project owner)
With project owner, own process & sustain changes
Positive (Trust)
Motivated and motivates others (Commitment)
Listens (Learning)
Open to suggestions (Respect)
Improvement Team
(Typically 3-8 consistent members)
Includes subject matter experts
Participate in observations and data collection as appropriate
Attend project meetings & improvement events (contribute ideas & execute action items)
Communication with coworkers
Respectful of each other
Holds self and others accountable
Actively engaged
Promotes positive environment
Influential among coworkers
Confident
Facilitator
Guide the team (scope project, assist with team selection, provide structure for project)
Lead pre-work w/ project owner / team leader incl. analysis
Lead improvement events (e.g. Kaizen, Work-Out)
Communication with entire project team
Hand off of project including metrics to project owner
Highlight achievements
Committed to success of project
Understanding of team’s needs
Inspires team
Respect for team
Supportive of improvement efforts throughout the project
Objective
Team Member Roles
24

Approach
• Some processes were highly interdependent making process change effectiveness difficult to predict
• Some changes needed their effectiveness demonstrated to engage all stakeholders
• Needed to test alternatives quickly and quantify their relative effectiveness
• Collaborated with ProModel Corp. to construct a simulation model of the entire OR suite
• This model used to analyze and verify changes prior to implementation
25

Lean in the OR
• PI teams tasked with applying lean
principles to the OR
• Eliminate waste!
– Excessive movement
– Excessive waiting
• Pull instead of push
– Paradigm shift for OR
26

What process will the team focus on?
What are the boundaries of the process we are to improve? Start point? Stop
point?
What resources are available to the team?
What is out of bounds for the team?
What constraints must the team work under?
What is the time commitment expected of team members? What will happen
to our “regular jobs” while we are doing the project?
Project Scope
27

In/Out of the Frame
n Visual tool based on the analogy of a picture frame
n It challenges the team to identify those aspects of the project (the type and
extent of end results or deliverables, the people impacted, timing, product
lines impacted, sites involved, etc.) which are :
– “in the frame” (meaning clearly within the scope of work)
– “out of the frame”
– “half-in-half-out” (meaning this is either up for debate, or some aspects
are in the scope of work but only in a partial way)
Tools to Define Project Scope
28

A high-level project plan with dates
Tied to phases of the project management process (define, measure,
analyze, improve, and control/sustain)
Aggressive (don’t miss “window of opportunity”)
Realistic (don’t force yourselves into “band-aid” solution)
Documented, shared with all project team members and Champion, and
updated regularly
Milestones
29

Pediatric Suite Elevator Changes
Scenario
Patient
Type
Total
Exits
Average
Total
Cycle
Time Difference
Class P
Patients
Above 120
Min Wait
(/Year)
Case Cart
Utilization
Time In
Pre-Op
As Is with Class P peds patient 58 293.70 22.00 57.00% 57.58
Seventh Floor Peds
Proposed Opening Day
Configuration peds patient 243 382.51 30.24% 3.00 72.00% 89.69
Seventh Floor Peds
Proposed Opening Day
Configuration With
Elevator Policy peds patient 243 352.51 20.02% 3.00 61.00% 58.02
30

Summarizes large data sets into frequency intervals
Represents data to evaluate: • Central Tendency • Spread • Patterns in data • ID sources of variation
Histogram
31

Pediatric Room Use Effect
Increased Time Spent in Pre-Op
versus Current State
Increase of 32 minutes
32

Helps to ID possible causes
related to a problem or a
condition
The team focuses on the content
of the problem “not the history”
Creates a snapshot of collective
knowledge
Builds support for resulting
solutions
Cause and Effect Diagram
33

Fishbone Diagram Example
* NOT RWJUH DATA
34

Nursing Staffing Requirements of Various
Changes
35

Investigation into Three Possible
Pediatric Configurations • The majority of this extra time occurs due to patients spending extra time in pre-op
and 1st stage recovery due to contention for beds when these two stages are
occurring in the same space. This is shown by the chart of patient time in stage
shown below.
36

Displays data in time order sequence
Run Charts
* NOT RWJUH DATA
37

Throughput Affect of Various Changes
As Is As Is with Class P Class P Bump Own
Service Only
Class P with Peds
Recovery
Total
Exits
Average Time In
System (Min)
Total
Exits
Average Time In
System (Min)
Total
Exits
Average Time In
System (Min)
Total
Exits
Average Time
In System
(Min)
MOR
patient
1502 457.759915 1502 475.017964 1502 475.017964 1502 466.596929
peds
patient
117 279.553803 116 293.697336 116 293.6973362 116 297.772465
SDS
patient
1348 386.533171 1348 372.123897 1348 372.1238976 1348 374.340928
38

20% of the sources cause 80% of any problem
Helps team focus on
causes
Based on the Pareto
Principle – 80/20 Rule
Displays the relative
importance of
“problems”
Shown by frequency or
size in a descending
bar graph
Pareto Analysis
39

Need for Simulation
• Many processes interdependent
• Patient care processes too critical to experiment requiring proof of change effectiveness
• Case cart processes totally new to the OR suite
• All of these factors make it necessary to have a safe trial environment to test changes, investigate processes, and prove effectiveness BEFORE their introduction into the patient care process
40

Simulation
• Collaborated with a trusted consultant
• Model constructed on floorplan (Autocad) of OR suite and scaled to drawing
• One year+ of data used to construct time and arrival distributions
• Model driven by Excel frontend for quick update and scenario creation
• Multiple scenarios created to test the introduction of case carts by itself and multiple process change combinations
41

Simulation
42

43

IMPROVE
• How can we fix the process?
• Generate alternatives
• Assess the risks
• Test the alternatives
• Select the best alternative
• Can we confirm the problem by turning it “off” and “on”?
... determine and confirm the
optimal solution ...
Outputs
Process X’s
or Factors
PROCESS
X1
X2
X3
X4
Y1
Y2
Y3
Before Improvements
After Improvements
The after curve shows a
more standardized
practice with reduced
variation – a more
predictable model
44

Model Benefits
• Explain what the model provided
• Explain how it let us know the unknowable
• Explain how it let us experiment with the
processes to define those changes that
are effective
45

Helps us determine whether observed differences are:
statistically significant
or
due to chance
(random variation)
Hypothesis Testing
46

Utilize different methods to identify solutions:
• Brainstorming
• Creative Thinking
• Best Practice
• “Should Be” Process Map
• Run A Pilot Study
• Full Implementation
•Design of Experiments
Identify Improvement Strategy
47

How do we remove the causes of the defects?
How can we maintain the improvements? Control
Define
Measure
Analyze
Improve
Who are the customers and what are their
priorities?
How is the process performing and how is it
measured?
What are the most important causes of the
defects?
IMPROVE
48

Objective and Solution Objective
To increase throughput while optimizing staff and plan for the necessary actions required to further accommodate a rise in patient volume.
Solution
The leadership team for the OR needed to understand; The overall constraints on throughput in the OR Suite
The cycle time for patients flowing through the system
Where patient flow problems existed, managers needed to determine if they were being caused by a lack of space or insufficient staff. The team was tasked with determining whether the OR suite could accommodate a 30% increase in patient volume without changing the OR’s physical environment or adding additional space. Additionally, case carts were being introduced into the system and the team needed to make sure that the carts were properly resourced to keep up with patient flow through the OR.
To deal with the effects of high variability in the OR it was decided that a simulation solution was the only way to reliably predict the impact of changes to the work and/or workflow.
49

Objective and Solution
Objective
To increase throughput while optimizing staff and plan for the necessary actions
required to further accommodate a rise in patient volume.
Solution
Particular attention was paid to the two patient recovery (PACU) areas in the OR
System, the Main PACU and Cardiac PACU. Expansion areas were also added
to the model to help understand if they could potentially add capacity and
improve patient flow through the OR, or if they were sources of further constraint
to the system.
The model was also designed to be fully costed, incorporating financial elements
and reporting on how much profit is generated with each patient flow scenario.
The output data of the model allowed the leadership team at RWJUH to design
an optimal workflow process that consisted of adjusting their staffing levels to
ensure maximum throughput with minimum patient delay and at minimum cost.
50

Investigation into Three Possible
Pediatric Configurations
Objective
• This study was to investigate the three different
configurations under consideration for the
Pediatrics department operating suite on the
seventh floor of Robert Wood Johnson
University Hospital.
51

Investigation into Three Possible
Pediatric Configurations The analysis was performed using the RWJUH OR Suite flexible simulation
model previously defined and validated. Data covering OR cases from
November 1, 2012 to January 30, 2013 was used for all runs during this study.
Any patient below eighteen years of age was considered pediatric for use in this
study.
This study also used the updated case cart washer configuration where the
washer capacity is:
Two large carts
Four small carts
One large and two small carts
52

Some solutions are easier to implement than others
Some solutions are more expensive than others
Some solutions have a bigger impact than others
It is impossible to implement everything at once
Tools:
Pay-off Matrix (Benefit VS Effort)
N/3 Voting (30 items/each person votes for 10 items)
Must/Want Matrix (assign weights/quantify)
Prioritize Solutions
53

A Pay-Off Matrix looks at the relationship of benefit and effort to
reduce the number of solutions to address
Benefit
Effort
High
Low
Low High
Pursue
Eliminate Eliminate
Rescope / Reconsider
Prioritize Solutions
54
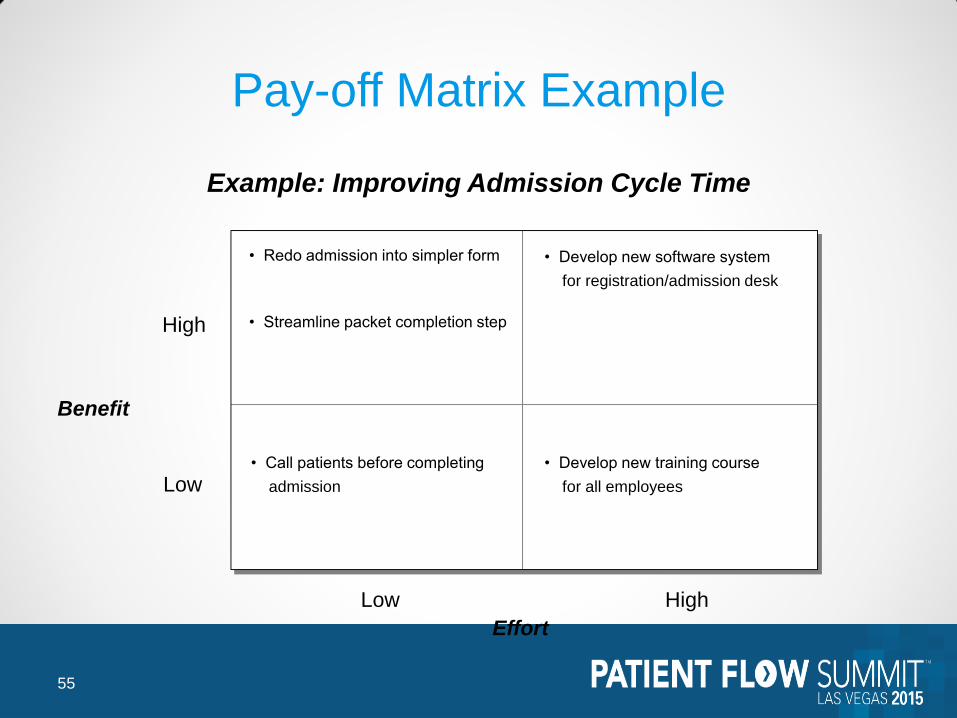
Example: Improving Admission Cycle Time
Benefit
Effort
High
Low
Low High
• Redo admission into simpler form
• Streamline packet completion step
• Call patients before completing
admission
• Develop new software system
for registration/admission desk
• Develop new training course
for all employees
Pay-off Matrix Example
55

Pilots are important when: The scope of change is large
Change could cause far-reaching unintended consequences
Implementing the change will be a costly process
Change would be difficult to reverse
Test part or all of a proposed solution on a small scale It helps to better understand the effects of a change
We learn how to make full scale implementation more effective
Pilot
56

Investigation into Three Possible
Pediatric Configurations Results - The key metrics of patient cycle time and PACU closing times are
shown in the table below.
Scenario Name
Monthly
Through
put
Patient
Cycle
Time
Normal
PACU
Close
Time
Normal
Late
Close
Time
Current State MOR patient 732 479 11:30 PM Midnight
Current State SDS patient 436 376 6:30
Current State peds patient 62 349 11:30 AM 1:00 PM
All Recovery Seventh Floor MOR patient 736 481 10:30 PM 11:30 PM
All Recovery Seventh Floor SDS patient 437 378 6:30 PM
All Recovery Seventh Floor peds patient 249 341 3:00 PM 4:00 PM
1st Stage Recovery Seventh Floor MOR patient 734 519 11:45 PM 1:00 AM
1st Stage Recovery Seventh Floor SDS patient 435 385 6:30 PM
1st Stage Recovery Seventh Floor peds patient 248 368 4:30 PM 5:30 PM
1st Stage Recovery Seventh Floor
With Revised Elevator Assignments MOR patient 734 515 11:30 PM 12:30 AM
1st Stage Recovery Seventh Floor
With Revised Elevator Assignments SDS patient 435 385 6:30 PM
1st Stage Recovery Seventh Floor
With Revised Elevator Assignments peds patient 248 359 3:45 PM 4:40 PM
57

Investigation into Three Possible
Pediatric Configurations The most effective performing scenario is that with all Pediatric
recovery occurring on the seventh floor. This scenario avoids contention for pediatric PACU beds between pre-operative and post-operative patients.
Splitting the pediatric recovery between the first and seventh floor so that stage two occurs in the main OR floor increases the patient cycle time and the PACU closing times due to the transport for pediatric inpatients and the effect of reducing the ability to flex PACU to beds in this space.
Reassigning the elevator transports to alleviate the elevator congestion reduces some amount of the impact but does not eliminate this reduction in efficiency versus having all pediatric recovery in one space.
58
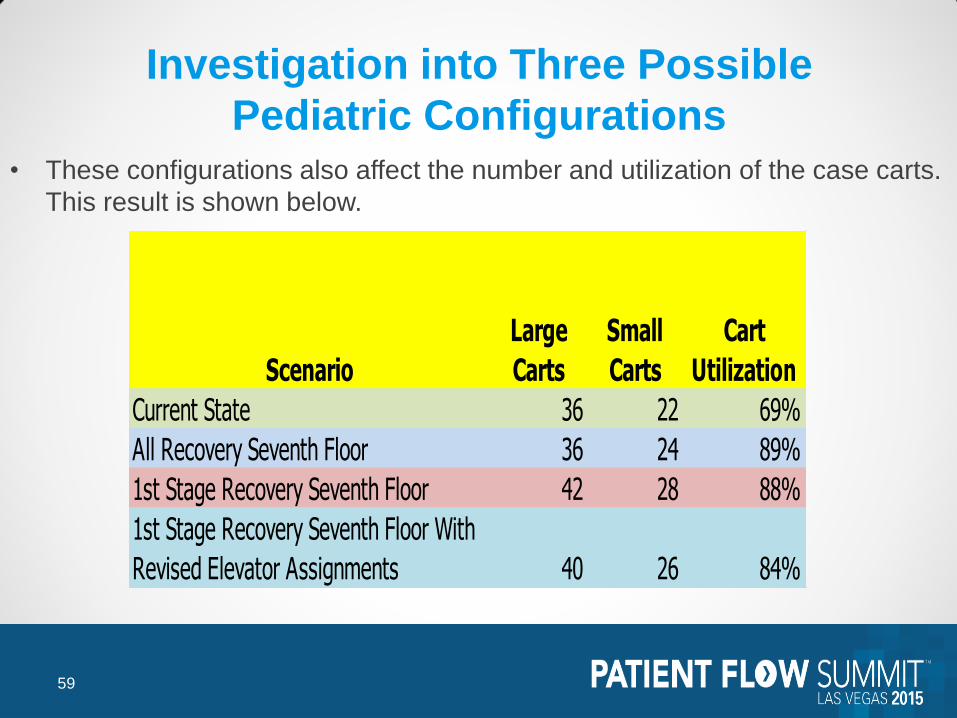
Investigation into Three Possible
Pediatric Configurations • These configurations also affect the number and utilization of the case carts.
This result is shown below.
Scenario
Large
Carts
Small
Carts
Cart
Utilization
Current State 36 22 69%
All Recovery Seventh Floor 36 24 89%
1st Stage Recovery Seventh Floor 42 28 88%
1st Stage Recovery Seventh Floor With
Revised Elevator Assignments 40 26 84%
59

• Implementation of
standardized order sets
• Selection of correct
CareMap
• Consultations
• Initiation of D/C planning
• Turnaround time of
echo
• Documentation of echo
• Discharge disposition
• Documentation of
ACE/ARB
• Compliance of MD to utilize
standardized order set
• Comorbidities
• Compliance of use of CareMap
• Necessity of needing
echo during
hospitalization
• Patient compliance to
follow-up care
• Patient resistance to
D/C
• Support system
High Medium Low
In
Control
Out of
Control
Control / Impact Matrix
60

Investigation into Three Possible
Pediatric Configurations • The split recovery configurations also take a higher level of labor due to the
extra inefficiency of the transport. This is shown in the table below.
Scenario Name
Work Time
(HR/Month)
Difference
(Hr/Month)
Difference
(%)
All Recovery Seventh Floor ORRN 1769.711683
All Recovery Seventh Floor PACURN 1750.139175
All Recovery Seventh Floor PreOpHoldingRN 24.75219583
All Recovery Seventh Floor Stage1RN 210.2421708
All Recovery Seventh Floor Stage2RN 284.1366333
All Recovery Seventh Floor PreOpRn 168.4124917
All Recovery Seventh Floor pedsor rn 503.7172042
All Recovery Seventh Floor pedspacu rn 447.3996583
Total Direct Work Hours 5158.511213
1st Stage Recovery Seventh Floor ORRN 1933.453766 163.7420825 9.25%
1st Stage Recovery Seventh Floor PACURN 1955.386574 205.2473992 11.73%
1st Stage Recovery Seventh Floor PreOpHoldingRN 34.21132917 9.459133333 38.22%
1st Stage Recovery Seventh Floor Stage1RN 227.6355263 17.39335542 8.27%
1st Stage Recovery Seventh Floor Stage2RN 308.7912758 24.6546425 8.68%
1st Stage Recovery Seventh Floor PreOpRn 184.9787271 16.56623542 9.84%
1st Stage Recovery Seventh Floor pedsor rn 546.7629521 43.04574792 8.55%
1st Stage Recovery Seventh Floor pedspacu rn 477.2634808 29.8638225 6.67%
Total Direct Work Hours 5668.483631 509.9724188 9.89%
1st Stage Recovery Seventh Floor With
Revised Elevator Assignments ORRN 1865.26964 95.55795661 5.40%
1st Stage Recovery Seventh Floor With
Revised Elevator Assignments PACURN 1886.428978 136.2898028 7.79%
1st Stage Recovery Seventh Floor With
Revised Elevator Assignments PreOpHoldingRN 33.00485109 8.25265526 33.34%
1st Stage Recovery Seventh Floor With
Revised Elevator Assignments Stage1RN 219.6078559 9.365685113 4.45%
1st Stage Recovery Seventh Floor With
Revised Elevator Assignments Stage2RN 297.9016111 13.7649778 4.84%
1st Stage Recovery Seventh Floor With
Revised Elevator Assignments PreOpRn 178.4553682 10.04287652 5.96%
1st Stage Recovery Seventh Floor With
Revised Elevator Assignments pedsor rn 527.481108 23.76390388 4.72%
1st Stage Recovery Seventh Floor With
Revised Elevator Assignments pedspacu rn 460.4325672 13.03290891 2.91%
Total Direct Work Hours 5468.581979 310.0707669 6.01%
61

Investigation into Three Possible
Pediatric Configurations Conclusions
The configuration with pediatric pre-op in the main OR area and all pediatric recovery occurring on the seventh floor is the most efficient since it minimizes the elevator use and avoids contention for bed space in the seventh floor complex between incoming pre-operative patients and outgoing post-operative patients. This option demonstrates superior metrics in the following areas versus the other two options:
Lower overall patient cycle time for all patients including Pediatric patients
Lower number of Class P patients that exceed the 120 minute threshold
Lower patient hold times due to higher efficiency of Phase I and II recovery in the same physical space
Lower number of case carts required to support the ORs in total
The revision to the case cart process showed a marked decrease in the number of case carts required to support the ORs using the most recent volumes. This analysis shows that approximately 40 large carts and 26 small carts are required to ensure no delays due to unavailability of case carts. The case carts and case cart washer remain an area of concern. All possible measures need to be taken to ensure the reliability and uptime of the cart washer.
62

Simulation
63

64

Simulation
• Model found that the cart washer was an important point of failure
• Model found the best set of PACU changes to reduce OR hold time
• Model verified multiple staffing changes
• Model found the optimum set of changes to OR assignments
• Model verified “smoothed” OR schedule to improve patient flow
through the OR suite and into inpatient units
• Model verified that current and next year projected volumes could be
handled by the new configuration
• Model determined the volume increase that could be tolerated
without further changes
• Model found the elevators to Seventh Floor to be problematic
without usage policies in place
65

Simulation Inputs
66

Pediatric Suite OR Close Time
Five Rooms
Close at 1:30
PM
Four Rooms
Close at
3:00 PM
Three Rooms
Close at 5:00
PM
67

Investigation into Three Possible
Pediatric Configurations 1. Pediatric patients would check into Pre-op on the first floor complex, then are
transported Main OR area on the seventh floor using the back elevators, receive their procedure in seventh floor OR suite, recover in the seventh floor PACU for Phase I & Phase II and either depart home or move to an inpatient room from the seventh floor PACU.
2. Pediatric patients would check into the Pre-Op Area on the seventh floor complex using the back elevators, receive their procedure in seventh floor OR suite, then from the OR Suite patients will move to the Phase I PACU on the seventh floor, then be transported downstairs via the back elevators to Phase II recovery on the first floor. Finally, patients will either depart from Phase II PACU to inpatient unit or home.
3. Pediatric patients would check into the Pre-Op area on the seventh floor complex using the main elevators, receive their procedure in seventh floor OR suite, then from the OR Suite patients will move to the Phase I PACU on the seventh floor, then be transported downstairs via the back elevators to Phase II recovery on the first floor. Finally, patients will either depart from Phase II PACU to inpatient unit or home.
68

Results of project
Learned which patient types and surgery types caused the most
disruption in flow and the length of OR hold times by patient type. In
particular, the model indicated that the PACU areas were the major
limiting factor and constraint to OR flow.
The OR suite simulation output significantly affected the decision
making process and was used to determine which actions were needed
to take regarding the PACU areas.
69

Investigation into Three Possible
Pediatric Configurations Results
The most effective performing scenario is that with all Pediatric recovery occurring on the seventh floor. This scenario avoids contention for pediatric PACU beds between pre-operative and post-operative patients.
Splitting the pediatric recovery between the first and seventh floor so that stage two occurs in the main OR floor increases the patient cycle time and the PACU closing times due to the transport for pediatric inpatients and the effect of reducing the ability to flex PACU to beds in this space.
Reassigning the elevator transports to alleviate the elevator congestion reduces some amount of the impact but does not eliminate this reduction in efficiency versus having all pediatric recovery in one space.
70

Appendix
71

Poor Example:
Under skilled staff takes too long to prepare and distribute Radiology reports.
Updated training is needed.
Improved Example:
60% of all Radiology reports over the past year have been delivered beyond 24
hours after exam at Speedy Medical Center. The result has been delayed
diagnosis by our Radiologists and delayed treatment for our patients.
Poor Example:
ER is understaffed, causing patients to wait too long for treatment. This is
making ER turnaround too long.
Improved Example:
ER patients are spending about 3 hours in ER before either being released or
admitted. Time in ER is especially long during the hours between 10 AM and 1
PM. The long time issue is causing many patients & physicians to complain.
Problem Statement Examples
72