let optimization be your guide for
TRANSCRIPT
Let Optimization be Your Guide for
a Magical Family Trip in Disneyland Paris
Amalia Chatzigeorgiou, Konstantina Kyriakou, and Georgia Lazaridou
Department of Mathematics and Statistics, University of Cyprus, Cyprus
{chatzigeorgiou.amalia, kyriakou.m.konstantina, lazaridou.georgia}@ucy.ac.cy
Advisor: Angelos Georghiou
Department of Business and Public Administration, University of Cyprus, Cyprus
Abstract
Disneyland is a magical place for young and old alike. Yet the size of the park, the age
restrictions of the attractions, the preferences amongst di↵erent age groups and the time a family
could spend in the park, makes it di�cult to decide which attractions to visit. By collecting
data from the Disneyland Paris website and other reliable sources which include ratings of the
attractions for each age group, we formulate an Orienteering Problem that aims to find the
route achieving the maximum total rating. Our case study tries to answer two questions: (i)
how should each family member individually navigate the park maximizing his/hers total rating,
and (ii) how should a family as a single group navigate the park such that all family members
achieve their goals. Our results show that if the family stay as a single group, the loss in total
rating is negligible compared to each family member navigating the park individually.
Keywords. Mixed-Integer Optimization, Orienteering Problem, Modeling, Disneyland Paris
1 Introduction
Founded in 1992, Disneyland Paris is one of the most visited attractions in Europe, attracting more
than 15 million visitors per year (1). Disneyland Paris, separated in two parks: the Disneyland Park
Copyright © SIAM Unauthorized reproduction of this article is prohibited
288

and the Walt Disney Studio Park, is a children’s favorite, and is a must see location for families
visiting Paris. The park claims to have attractions for all ages so as the whole family can have
an unforgettable experience. With 46 attractions it can accommodate all ages and tastes. Ideally
to fully experience the park, one will need to spend several days. This is usually not possible for
the majority of visitors that usually have time and budget restrictions, spending one or two days
in the park (9). So families need to be “strategic” and optimize how they should visit attractions,
maximizing their experience!
As with all theme parks, some attractions are more popular than others. There are many
guides trying to suggest the most noteworthy attractions (3; 15). A measure of popularity is the
rating reported by visitors in a trusted touring plan website (15). The website provides ratings for
each attraction based on di↵erent age groups. The age groups are: Preschoolers, Kids, Tweens,
Teenagers and Adults, and the rating ranges from 0 to 5, with 5 being the highest. With millions of
votes, the rating system is a robust measure of the popularity of each attraction. Some attractions
in Disneyland Paris have restrictions such as age and height while others are simply unsuitable for
young children as they are too scary (5). Despite these restrictions, (15) provides ratings for all the
attractions as shown in Table 7 of Appendix A. Figure 1 indicates the geographic location of the
attractions based on age restrictions, from which we can conclude that attractions are not grouped
based on age restrictions but rather scattered throughout the park. Figure 2 indicates the rating of
the attractions based on the di↵erent age groups. A naive approach is to visit attractions according
to the highest rating. However, this will result in traversing through the park unnecessarily, losing
precious time and not experiencing the park to the fullest. Motivated by our plan to visit Disneyland
in the coming years, our aim is to explore how a family should plan their visit to the park in order
to achieve a magical experience.
In this paper, we apply optimization techniques to help a family plan a trip to Disneyland
Paris. Our aim is two fold. First, we 4 study how each family member should navigate the
park individually maximizing his/hers experience, and second we study how a family consisting
of multiple age groups should navigate the park such that all family members can have a good
time. For each age group, we use the rating of each attraction as a measure of how much fun they
will have. To measure the experience of the family as they navigate the park together, for each
attraction we use the average rating of the age groups that form the family. In the first study we
289

Figure 1. Age restrictions of the attractions in Disneyland Paris. Red dots representavailable attractions while black dots represent attractions that the given age groupcannot visit. The blue dot indicates the entrance to the park. The age group of Tweensis not included as they have no restrictions at all.
see the ultimate rating each age group can achieve individually, while in the second experiment
we see the compromise that each age group experiences as the family visits the attractions as a
single group. In both cases, we seek to find routes that maximize the total rating of the attractions
visited while satisfying time availability and age group restrictions. Generally, our study focuses
on the variety of age groups within a family which we systematically study by formulating several
optimization problems in order to understand how the change of other factors like available time
and rate of attraction acts on each age group. The di�culty of these problems is the diversity of the
park’s attractions that are not only aimed at di↵erent age groups but also have di↵erent ratings for
each group. So, family members need to compromise in order for the family to achieve the highest
total average rate while satisfying time restrictions and personal preferences.
To find the best routes for the family we formulate the problem as an Orienteering Problem (7).
The Orienteering Problem is a routing problem in which the goal is to determine a subset of nodes
to visit and in which order, so that the collected reward is maximized and a given time budged is not
exceeded. The problem results in a mixed-integer optimization problem. The Orienteering Problem
is well suited for the application in hand as the optimal route visits only a subset of the attractions
and tries to maximize the sum of rating from the visited attractions while satisfying the time and age
290

Figure 2. Rating of each attraction for each age group on the Disneyland map.
restrictions. The Orienteering Problem has been successfully used in many applications. In (7) the
authors use a variant of the Orienteering Problem formulation for home fuel delivery. The aim is to
deliver fuel to as many customers as possible while maintaining inventory fuel levels and satisfying
time budget constraints. Also, in (18) the Orienteering Problem is used for scheduling submarine
and unmanned aircraft where the aim is to maximize surveillance coverage subject to fuel and time
constraints. In addition, (6) uses the Orienteering Problem to study a route-planning problem such
that tourists can plan their visit in multiple points of interest during their vacation. Moreover,
the author of (16) describes the case of a traveller with not enough time to visit all possible cities.
He knows the expected number of sales in each city and wants to maximize total sales, while
keeping the total travel time limited to a day (or week). One could alternatively formulate the
problem as the Prize Collecting Traveling Salesman Problem like (2) which is similar in spirit to
the Orienteering Problem. The main di↵erence is that the salesman needs to pay “transportation
cost” for every pair of nodes he visits, while he has to pay a “penalty” for every node which is
not visited. In addition, rather than maximizing the overall rewards collected, the Prize Collecting
291

Traveling Salesman Problem imposes a constraint on the minimum number of rewards that need to
be collected while minimizing the overall cost. Another application of this is used by the authors
in (14) in a single-ring design problem. In contrast, the Orienteering Problem maximizes rewards
subject to a budget constraint on the overall time allowed. The two formulations could potentially
be used interchangeably, however, we believe the Orienteering formulation is better suited for our
case. More applications of the Orienteering Problem are surveyed in (17; 8).
An important question for everyone visiting Disneyland is how much time they should spend in
the park. Disneyland Paris o↵ers a variety of tickets for visiting the park. Briefly, the first option
is to buy a 1-Day ticket that either has access to one part of park or all the park. The second
option is to buy a Multi-Day ticket to make the magic last longer and enjoy even more adventures
in both parks, and the last option is annual passes. In summary, there are three types of tickets:
the Mini Ticket, the Magic ticket and the Super Magic ticket which refer to the validity periods as
shown in Disneyland’s o�cial website calendar (4). For the purpose of this study, we consider that
the visitors buy a Super Magic 1-Day Ticket which gives them access to both parks and there is
no need for extra cost during their trip.
The contributions of this paper are:
• We formulated the problem as an orienteering problem. We provide formulations for each
age group to model the restrictions and requirements according to the attributes of each
attraction. The formulation of the constraints is modular and can easily be extended to
model other attraction parks.
• We examine how each age group will optimally navigate the park. We study the trade-o↵
between the hours spent in the park and the experience achieved, measured as the number of
attractions visited and the total rate collected. This analysis compares the behaviour between
the age groups and provides insights on how much time a visitor should spend in order to
achieve given levels of satisfaction.
• We examine how a family formed by members of di↵erent age groups should navigate the
park. As di↵erent age groups would have di↵erent priorities in the attractions they might
want to visit, we study how a family should split its time, first navigating the park as a single
group and then each age group visiting the attractions individually. Our results provide
292

insights on how the available time, and the split of available time impacts the rating for each
age group.
The paper is structured as follows. In Section 2, we examine the data set collected for Disneyland
Paris and study what attributes of the attractions have an impact on the di↵erent age groups. In
Section 3, we formulate the orienteering problem and discuss restrictions of the di↵erent age groups.
In Section 4 we present the findings of our case study about a family trip and discuss the implications
of the time and age restrictions. Finally, our conclusions and remarks can be found in Section 5.
2 Data Description
In this study we use data for Disneyland Paris, collected from the o�cial web page of Disneyland
Paris (5). In cases of missing data for some of the attractions, we substituted data from Disneyland
Park in California which has the same attractions (15). All data used for this study can be found
in Appendix A in Tables 7–10.
Disneyland Paris’ provision of di↵erent facilities to its visitors gives us the opportunity to
classify the attractions by their characteristics and services. Disneyland has one entrance which is
used as an exit too, forty-six attractions and it is divided into two major areas: Disneyland Park
and Walt Disney Studios Park. Particularly, Disneyland Park is separated into five smaller areas:
Discoveryland, Fantasyland, Adventureland, Frontierland and Main Street USA while Walt Disney
Studios Park is separated into the following three sub-areas: Production Courtyard, ToonStudio
and Front Lot.
Each of Disneyland’s activities has the following characteristics: location, wait time in the queue
based on a day with moderate crowds and duration. Some attractions have extra restrictions, such
as age and height limit. The five age groups are: Preschoolers (ages 3-5), Kids (ages 6-10), Tweens
(ages 10-13), Teenagers (ages 14-18) and Adults (ages 18+). Each age group rates the attractions
di↵erently. The ratings of the attractions for each age group is summarized in Table 1. It is
clear that Kids have lots of high rated attractions while Teenagers quite a few low rated attractions
compared to the other age groups. We can also notice that despite the age restrictions, Preschoolers
have a large number of high rated attractions. This leads us to conclude that the target audience
of Disneyland might be a younger audience. Table 2 summarizes the number of attractions each
293

age group can visit as well as the rate each group can achieve by visiting all attractions without age
group restriction. We see that Preschoolers have the most restrictions, while for the rest of the age
groups the restrictions are few, with Tweens having no restrictions at all. Finally, Table 3 presents
the correlation of the rating between di↵erent age groups. We observe that Tweens and Kids as
well as Teenagers and Adults have a high positive correlation. The correlation between Tweens and
Adults and the correlation between Kids and Adults is almost identical and it indicates a moderate
positive relationship between them.
Table 1. Number of Attractions in each rate range according to age groups.
Range ofAttractions’ Rate
Preschooler Kid Tween Teenager Adult
0 < Rate 1 0 0 0 2 01 < Rate 2 0 0 0 2 12 < Rate 3 3 2 3 8 43 < Rate 4 13 21 25 17 214 < Rate 5 15 20 18 15 18
Table 2. The number of available and restricted attractions for each age group and themaximum possible rate achieved if all the available attractions are visited.
Preschoolers Kids Tweens Teenagers AdultsAvailable Attractions 31 43 46 44 44Restricted Attractions 15 3 0 2 2
Maximum Possible Rate 123.6 173.5 181.9 158 168.85
Table 3. Correlation Coe�cients for the ratings of di↵erent age groups
Age Groups Preschoolers Kids Tweens Teenagers AdultsPreschoolers 1.0000 0.3309 -0.0431 -0.2995 -0.1699
Kids 0.3309 1.0000 0.8226 0.4373 0.4994Tweens -0.0431 0.8226 1.0000 0.4717 0.5263
Teenagers -0.2995 0.4373 0.4717 1.0000 0.7028Adults -0.1699 0.4994 0.5263 0.7028 1.0000
Besides the above attributes, each activity has the following features: “Family Adventure”,
“Fun for Little ones”, “Guest may get Splashed”, “Not to be Missed” and “May Frighten Younger
visitors” as shown in the Table 9 in Appendix A. Finally, each attraction provides some services such
as: “Single Rider Service”, “Fastpass”, “PhotoPassTM”, “Meet Disney Characters”. Especially,
“Fastpass” indicates that the visitor can cut down queue times on this attraction and with Disney
“PhotoPassTM” the visitor can acquire a digital portfolio of all his souvenir photos taken during
his visit to Disneyland Paris, whether on the Attractions, or by Disney PhotoPass Photographers.
The di↵erent services are summarized in Table 8 of the Appendix A. Along with the tables, Figure
294
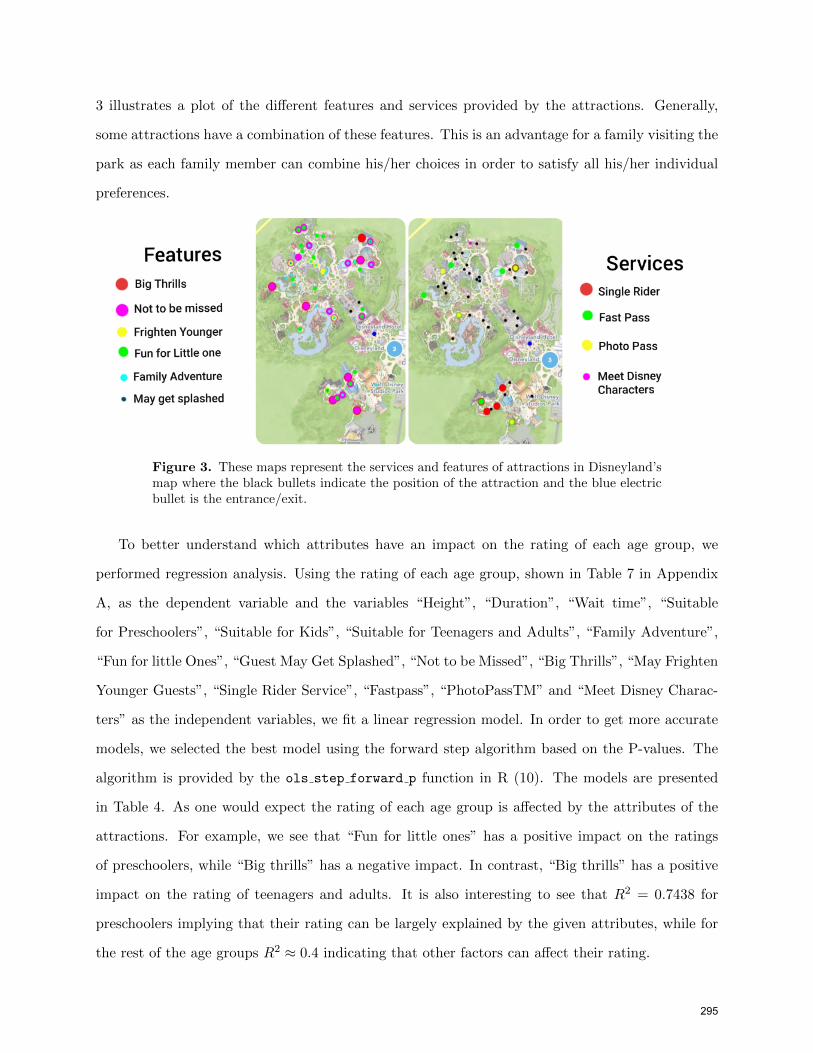
3 illustrates a plot of the di↵erent features and services provided by the attractions. Generally,
some attractions have a combination of these features. This is an advantage for a family visiting the
park as each family member can combine his/her choices in order to satisfy all his/her individual
preferences.
Figure 3. These maps represent the services and features of attractions in Disneyland’smap where the black bullets indicate the position of the attraction and the blue electricbullet is the entrance/exit.
To better understand which attributes have an impact on the rating of each age group, we
performed regression analysis. Using the rating of each age group, shown in Table 7 in Appendix
A, as the dependent variable and the variables “Height”, “Duration”, “Wait time”, “Suitable
for Preschoolers”, “Suitable for Kids”, “Suitable for Teenagers and Adults”, “Family Adventure”,
“Fun for little Ones”, “Guest May Get Splashed”, “Not to be Missed”, “Big Thrills”, “May Frighten
Younger Guests”, “Single Rider Service”, “Fastpass”, “PhotoPassTM” and “Meet Disney Charac-
ters” as the independent variables, we fit a linear regression model. In order to get more accurate
models, we selected the best model using the forward step algorithm based on the P-values. The
algorithm is provided by the ols step forward p function in R (10). The models are presented
in Table 4. As one would expect the rating of each age group is a↵ected by the attributes of the
attractions. For example, we see that “Fun for little ones” has a positive impact on the ratings
of preschoolers, while “Big thrills” has a negative impact. In contrast, “Big thrills” has a positive
impact on the rating of teenagers and adults. It is also interesting to see that R2 = 0.7438 for
preschoolers implying that their rating can be largely explained by the given attributes, while for
the rest of the age groups R2 ⇡ 0.4 indicating that other factors can a↵ect their rating.
295

Table 4. Linear Regression Analysis of Age Groups’ rating
Age Group Name of VariableEstimateValue
Std.Error
P-Value
Preschoolers Intercept 3.3825 0.1965 < 2e-16 ***R2 = 0.7438 Big Thrills -1.4618 0.2981 1.79e-05 ***F significance = 1.701e� 09 Fastpass 1.1554 0.2398 2.34e-05 ***Adjusted R2 = 0.6966 Fun for little ones 0.8365 0.2097 0.000291 ***
Kids restrictions -1.2136 0.3744 0.002474 **PhotoPassTM 0.7063 0.3057 0.26387 *Guest may get splashed -0.6648 0.3060 0.036111 *Family Adventure 0.3561 0.2089 0.096475 .
Kids Intercept 3.6698 0.1180 < 2e-16 ***R2 = 0.3511 Wait time 0.0049 0.0037 0.1954F significance = 0.01467 Fastpass 0.4203 0.2164 0.0596 .Adjusted R2 = 0.2316 Fun for little ones 0.2215 0.1322 0.1021
Not to be missed 0.2736 0.1404 0.0588 .Single rider service -0.3605 0.2178 0.1062Kids restrictions -0.4472 0.3159 0.1650Preschoolers restrictions 0.1957 0.1563 0.2183
Tweens Intercept 3.5632 0.1164 < 2e-16 ***R2 = 0.3698 Not to be missed 0.2815 0.1640 0.0939 .F significance = 0.001824 Fastpass 0.2658 0.2287 0.2520Adjusted R2 = 0.291 Preschoolers Restrictions 0.3144 0.1814 0.0907 .
Guest may get splashed 0.4038 0.3145 0.2066Wait time 0.0048 0.0044 0.2775
Teenagers Intercept 3.3000 0.1282 < 2e-16 ***R2 = 0.3539 Big Thrills 1.4571 0.3178 3.88e-05 ***F significance = 8.351e� 05 Guest may get splashed 0.9667 0.4623 0.0425 *Adjusted R2 = 0.3238Adults Intercept 3.4858 0.1115 < 2e-16 ***R2 = 0.5269 Not to be missed 0.5340 0.1688 0.00293 **F significance = 5.433e� 05 Big Thrills 1.8300 0.5387 0.00152 **Adjusted R2 = 0.3929 Height restrictions -1.1053 0.4545 0.01948 *
May frighten younger guests 0.4278 0.2349 0.07588 .
Significant codes: 0 ‘***’ 0.001 ‘**’ 0.01 ‘*’ 0.05 ‘.’ 0.1 ‘ ’ 1Sample size for all age groups = 46
3 Problem Formulation
In this section we formulate the problem as an Orienteering Problem to find the best route through
the park. We adopt the formulation in (8) which uses Miller-Tucker-Zemlin formulation for the
subtour elimination (13). We denote by N the number of attractions in the park. By convention
296

we have that attractions 1 and N + 2 indicate the entrance and exit of the park, respectively. Let
xi,j , i, j = 1, ..., N + 2, be binary variables such that
xi,j :=
8><
>:
1 if visitor goes from attraction i to attraction j
0 otherwise
9>=
>;. (3.1)
Let ui, i = 2, . . . , N + 2, be integer variables. The values of the ui, in ascending order, represent
the order of attractions visited. For example, consider that a visitor will visit ten attractions. If
we put the values of the variables u2, . . . , u12 in a list and sort them in ascending order, we can say
that the attraction i is visited first if ui has the smallest value, attraction j is visited second if uj
has the second smallest value, etc.
Our orienteering problem uses the rating to decide which attractions to visit and aims to
maximize the sum of the visited attractions’ rate. We denote by ri the rating of attraction i. Note
that r1 = rN+2 = 0 since node 1 and N + 2 are the entrance and exit of the park, respectively.
Hence, we aim to maximize the objective function
N+1X
i=2
N+2X
j=2
rixi,j . (3.2)
The following constraints enforce the routing problem.
N+2X
j=2
x1,j =N+1X
i=1
xi,N+2 = 1, (3.3)
xi,i = 0, 8i = 1, . . . , N + 2, (3.4)
andN+1X
i=1
xi,k =N+2X
j=2
xk,j 1, 8k = 2, . . . , N + 1. (3.5)
Constraint (3.3) ensures that the visitor should start his/her path from the entrance and finish at
the exit, while constraint (3.4) ensures that the visitor is not allowed to stay at the same attraction.
Constraint (3.5) ensures that each attraction is visited at most once.
297

The following constraint ensures that the visitor not exceed the available time.
N+1X
i=1
N+2X
j=2
ti,jxi,j Tmax. (3.6)
Here Tmax denotes the time in minutes available to the visitor. The constants ti,j denote the sum
of minutes needed for the visitor to walk from attraction i to attraction j plus the wait time and
duration of attraction i. For the calculation of the walking minutes from attraction i to j, we used
the walking time information given in Google Maps.
As described previously, the integer decision variables ui are responsible for the path that the
visitor will follow, taking values in [2, N + 2], i.e.,
2 ui N + 2, 8i = 2, . . . , N + 2, (3.7)
with the following constraint ensuring that the path will not contain sub-tours
xi,j(N + 1) + ui � uj N, 8 i = 2, . . . , N + 1, 8 j = 2, . . . , N + 2. (3.8)
Constraint (3.8) usually referred to as the Miller-Tucker-Zemlin constraint.
Finally, we look at the constraints about age restrictions. The visitor cannot visit certain
attractions, see Table 10 of the Appendix A. For each age group the same method is followed: For
each attraction i that cannot be visited by the specific age group, then xi,j = 0, for all j = 2, ..., N+2
and xi,j = 0, for all i = 1, ..., N +1. The overall problem can be cast as the following mixed-integer
optimization problem.
maximizeN+1X
i=2
N+2X
j=2
rixi,j
subject to (3.3)� (3.8),
xi,j 2 {0, 1} and ui 2 Z, and
age group restrictions.
(3.9)
298

4 Case Studies through Numerical Experiments
In the following, we perform numerical studies to understand how di↵erent age groups navigate the
park, and how a family should approach a trip to Disneyland Paris. All optimization problems were
solved in Matlab using Gurobi 8.0.0 optimizer see (www.gurobi.com) through the Yalmip interface
(12). The source code and data used can be found in (11). We use a stopping criterion of 2 hours
which was only needed for a small number of instances. For these instances, the gap between the
upper and lower bounds was less than 1%. Hence, in the following we don’t report solution times
as they are not insightful.
4.1 Age Groups Experiment
In this section we solve the problem with only age restrictions in order to understand how the
total rate and total visited attractions is a↵ected by the available time for each age group. For
this numerical experiment, we first consider that the visitor has 600 minutes (10 hours) available
in Disneyland. For each age group, we solved problem (3.9) by imposing the appropriate age
group restrictions. The optimal solution for each of these problems as well as its optimal value can
be shown in the Disneyland’s maps in Figure 4. We observe that Kids and Tweens can achieve
higher total rating and visit more attractions than Preschoolers, Teenagers and Adults. This is
because Disneyland has more attractions that interest young visitors. Preschoolers and Teenagers’
total rating is lower as Preschoolers have stricter restrictions and Teenagers have many low rated
attractions. Adults’ optimal rating is similar to Kids and Tweens since their ratings are moderatily
correlated and don’t have significant age restrictions.
We next try to understand how time restrictions a↵ect the optimal solution. To this end, for
each age group, we solved the problem for di↵erent values of Tmax 2 {0, 60, 120, 180, . . . , 600}.
In each run, we record the optimal value of the problem and the number of attractions visited.
Our aim is to understand the relation between the total rate achieved and the time available. The
results are depicted in Figure 5. We can see the diminishing total rating achieved as the available
time increases. The age groups Kids and Tweens achieve larger total ratings, while Preschoolers
achieve lower values as it is the age group with the most restrictions. This is evident from Table 2.
It is of course desirable to spend as much time as possible in Disneyland, however, this might
299

Figure 4. Optimal Paths for each age group. The blue point shows the entrance andexit, the red points show the coordinates of Disneyland’s attractions and the black onesindicates the visited attractions for each age group. The black line show the optimalpath and the two arrows help the visitor understand from where to start. The optimalvalues: Preschooler= 111.4, Kid= 128.3, Tween= 125.6, Teenager= 109.8, Adult= 117.9Number of games visited: Preschooler= 28, Kid= 32, Tween= 32, Teenager=30, Adults=31
not always be the case. Many times, individuals set targets such as “visit 50% of the attractions”
in order to decide how much time they should spend in the park. Table 5 presents the percentage
of attractions visited by each age group for di↵erent hours, as well as the percentage of the rating
achieved by the optimal route compared to the maximum rate an age group can achieve, see Table 2
for the maximum rate. We observe that a Preschooler needs roughly 4 hours to achieve the 50%
goal for both the percentage of attractions visited and rating, a Kid needs roughly 5 hours, and
Tweens, Teenagers and Adults need 6 hours to achieve the same goal. Since Preschoolers have less
available attractions to visit due to age restrictions, they can visit 90% of the park in 10 hours.
In contrast, Kids, Tweens, Teenagers and Adults can only visit around 70% of the park within 10
300

hours. These results, could be seen as guidelines in deciding how much time one should spend in
the park, aiding with the type of ticket one should buy.
It is also interesting to see the overlap in the attractions visited by di↵erent age groups. If
there are 10 hours available, we observe that all age groups have approximately 20 attractions
in common, which make up more that around 70% of all attractions visited by each group. The
overlap in attractions visited leads us to believe that if di↵erent age groups move together as a
group through the park, they will not experience significant drop in the rating received, something
that we will be verified in the following section.
AvailableTime
Preschoolers Kids Tweens Teenagers Adults
(Minutes) Attract. Rate Attract. Rate Attract. Rate Attract. Rate Attract. Rate0 0% 0% 0% 0% 0% 0% 0% 0% 0% 0%60 19% 19% 16% 15% 15% 14% 14% 11% 14% 12%120 35% 35% 28% 27% 26% 25% 25% 23% 25% 23%180 45% 45% 37% 36% 35% 33% 32% 32% 32% 32%240 58% 56% 44% 44% 41% 41% 39% 40% 41% 40%300 68% 65% 51% 52% 48% 47% 45% 47% 48% 48%360 71% 70% 58% 58% 54% 54% 52% 53% 55% 54%420 77% 76% 63% 62% 59% 58% 57% 57% 59% 58%480 84% 82% 67% 66% 63% 62% 59% 62% 61% 62%540 87% 86% 72% 71% 67% 66% 64% 66% 66% 66%600 90% 90% 74% 74% 70% 69% 68% 69% 70% 70%
Table 5. Percentage of attractions visited and percentage of total rating achieved byeach group for di↵erent available time. Red denotes the maximum time needed to achievea target of at least 50%, and blue denotes the maximum time needed to achieve a targetof at least 70%.
4.2 Family Trip Experiment
In this section, we have decided to examine how a family would experience a Disneyland trip. To
this end, we consider a family consisting of two adults, two teenagers and a kid. The problem
has two phases. In Phase 1 the family members visit the attractions together as a single group
and in Phase 2 the group splits with the teenagers playing on their own, while the kid and the
adults move together as a single group. If in Phase 1 a particular attraction is visited, then it is
removed from the available attractions in Phase 2. Splitting the family into groups for the second
part of their trip was motivated by the previous experiment in Section 4.1 which showed that
301

0
20
40
60
80
100
120
140
0 60 120 180 240 300 360 420 480 540 600
Ratin
g co
llect
ed
Available time (minutes)
Rating collected vs available time
Preschoolers
Kids
Tweens
Teens
Adults
0
5
10
15
20
25
30
35
0 60 120 180 240 300 360 420 480 540 600
Num
ber o
f att
ract
ions
Available time (minutes)
Number of attractions visited vs available time
Preschoolers
Kids & Tweens
Teens
Adults
Figure 5. Total rate and total number of visited attractions as functions of availabletime for each age group
each age group experiences di↵erently its time in Disneyland. The rating used for Phase 1 is the
average calculated from every age group that the family consists of. For example, for Mickey’s
PhilharMagic, the family rating is 4.1 as the ratings for the Kids, Teenagers, Adults are 4.3, 3.9,
and 4.1 respectively. In Phase 2 we used two di↵erent ratings, as the family splits into two groups.
For the teenagers we used their own age group’s rate, while for the kid and adults moving together
we calculated the average between these two age categories.
In the following we perform two experiments. In Section 4.2.1 we split the available time with
a constant ratio 1:1 meaning that if, for example, they have 10 hours available the family visits
attractions together for 5 hours and the remaining 5 hours they play separately. We repeat this
experiment for 5, 6, 7, 8, 9 and 10 hours. In Section 4.2.2 we examine the e↵ect of di↵erent split
times. To this end, we fix the available time to 10 hours and vary the split time to di↵erent ratios.
Finally, in Section 4.2.3 we investigate how the split time a↵ects families with alternative age group
compositions.
In all experiments we solved our optimization problem, as formulated in (3.9), three times for
each time ratio. In particular, we first solve the problem for Phase 1 once, when they all play
together, and after removing the attractions that the family visited, we resolve the problem two
more times for Phase 2, one for the kid with his parents and one for the teenagers. In this way, we
prevented the possibility of visiting the same attraction in both rounds. We note that the family
will start its trip at the entrance and finish at the exit, and the separate trip for the kid with adults
302

and teenagers will also start from the entrance and finish at the exit.
4.2.1 Constant Time Ratio Experiment
As described in the Section 4.2, the orienteering problem was solved with a Tmax value equal to
600, 540, 480, 420, 360 and 300 minutes regarding to the constraint (3.6). Specifically, using the
constant time ratio 1:1 we have that each phase lasts half of the Tmax. The results are summarized
in Figures 6 and 7. We note that the ratings reported in both graphs are calculated as follows: We
first solve the two phase routing problems as described at the beginning of Section 4.2. Then, for
each age group we calculate the sum of rates collected corresponding to that age group, according
to the optimal route of the orienteering problem.
83.5 78.572.3
64.955.9 51.472.8
66.8 62.255.3 50.3
42.2
80.573.5
67.361.5
52.546.6
300 270 240 210 180 150
Phase 1: Total rating achieved by each group whenfamily plays together
KID TEENAGERS ADULTS
35.6 33.2 34.4 33.3 34.5 30.6
32.5 33.4 31.6 31.5 29.8 28.5
31.95 33 33.75 32.4 33.45 30.9
300 270 240 210 180 150
Phase 2: Total rating achieved by each group whenfamily plays separately
KID TEENAGERS ADULTS
Figure 6. The e↵ects of time on the total rates of each age group. Phase 1 and 2 timeratio is 1:1.
119.1111.7 106.7
98.290.4
82105.3 100.293.8
86.880.1
70.7
112.45 106.5 101.0593.9
85.9577.5
600 540 480 420 360 300
Total rating achieved in Phases 1 and 2
KID TEENAGERS ADULTS
21 2018
1614 13
9 8 9 9 9 8
9 9 8 9 8 7
300 270 240 210 180 150
Number of attractions visited in Phases 1 and 2
FAMILY KID WITH ADULTS TEENAGERS
Figure 7. The e↵ects of time on the overall rate and number of attractions visited ofeach age group.
From Figure 6, we notice that there is a significant di↵erence in the rates collected in the two
phases. In Phase 1, Figure 6 (left), as expected we see a decrease in rating as the available time
303

decreases in all age groups. However, the results are much less dramatic in Phase 2, Figure 6 (right).
In addition, the total rates collected in Phase 2 are significantly lower than the corresponding rates
in Phase 1, despite the fact that the time spent in both phases is the same. This can be partly
explained by the fact that attractions visited in Phase 1 are excluded from Phase 2, which is
compounded by the fact that there is a significant overlap in the attractions visited by all age
groups as seen in Section 4.1. The attractions remaining for Phase 2 typically have longer wait plus
duration time, and sometimes lower rating, as seen in Table 6 which reports the average rating and
average wait time plus duration of attractions in Phases 1 and 2. Figure 7 (left) gives the sum of
the ratings from both phases.
AvailableTime
Average Phase 1 Phase 2
(Minutes) (Rate/Time) Kids Teenagers Adults Kids Teenagers Adults600 Rate 3.976 3.467 3.833 3.956 3.611 3.550
Time 11.313 11.313 11.313 30.092 29.899 30.092540 Rate 3.925 3.340 3.675 4.150 3.711 4.125
Time 10.889 10.889 10.889 30.393 26.654 30.393480 Rate 4.017 3.456 3.739 3.822 3.950 3.750
Time 10.453 10.453 10.453 23.849 25.702 23.849420 Rate 4.056 3.456 3.844 3.700 3.500 3.600
Time 10.497 10.497 10.497 17.981 20.116 17.981360 Rate 3.993 3.593 3.750 3.833 3.725 3.717
Time 9.916 9.916 9.916 14.756 18.782 14.756300 Rate 3.954 3.246 3.585 3.825 4.071 3.863
Time 9.653 9.653 9.653 13.389 15.511 13.389
Table 6. Average rating (Rate) and average wait plus duration time of attractionsvisited (Time) in Phases 1 and 2 for each age group.
From our observations, we realised that despite the fact that each age group has di↵erent rate,
the big impact on the rating achieved comes from the family playing together as a single group in
Phase 1. This realisation made us conclude that splitting the available time with a time ratio 1:1
for the two phases may not be the best decision as at the end family time turned out to be more
e↵ective. In the following section, we examine which time split is more suitable for a family visiting
Disneyland.
304
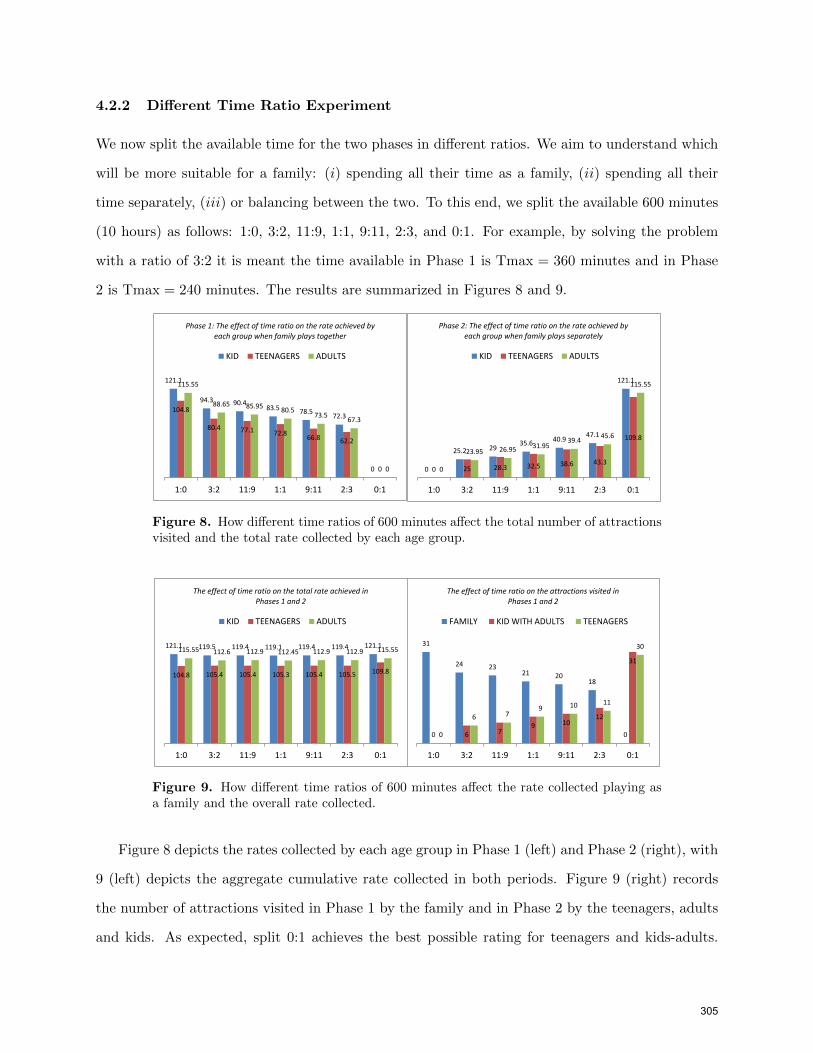
4.2.2 Di↵erent Time Ratio Experiment
We now split the available time for the two phases in di↵erent ratios. We aim to understand which
will be more suitable for a family: (i) spending all their time as a family, (ii) spending all their
time separately, (iii) or balancing between the two. To this end, we split the available 600 minutes
(10 hours) as follows: 1:0, 3:2, 11:9, 1:1, 9:11, 2:3, and 0:1. For example, by solving the problem
with a ratio of 3:2 it is meant the time available in Phase 1 is Tmax = 360 minutes and in Phase
2 is Tmax = 240 minutes. The results are summarized in Figures 8 and 9.
121.1
94.3 90.483.5 78.5 72.3
0
104.8
80.4 77.1 72.8 66.8 62.2
0
115.55
88.65 85.95 80.573.5 67.3
0
1:0 3:2 11:9 1:1 9:11 2:3 0:1
Phase 1: The effect of time ratio on the rate achieved byeach group when family plays together
KID TEENAGERS ADULTS
0
25.2 29 35.6 40.9 47.1
121.1
0 25 28.3 32.5 38.6 43.3
109.8
0
23.95 26.95 31.9539.4 45.6
115.55
1:0 3:2 11:9 1:1 9:11 2:3 0:1
Phase 2: The effect of time ratio on the rate achieved byeach group when family plays separately
KID TEENAGERS ADULTS
Figure 8. How di↵erent time ratios of 600 minutes a↵ect the total number of attractionsvisited and the total rate collected by each age group.
31
24 2321 20
18
00 6 79 10
12
31
0
6 79 10 11
30
1:0 3:2 11:9 1:1 9:11 2:3 0:1
The effect of time ratio on the attractions visited inPhases 1 and 2
FAMILY KID WITH ADULTS TEENAGERS
121.1 119.5 119.4 119.1 119.4 119.4 121.1
104.8 105.4 105.4 105.3 105.4 105.5 109.8
115.55 112.6 112.9 112.45 112.9 112.9 115.55
1:0 3:2 11:9 1:1 9:11 2:3 0:1
The effect of time ratio on the total rate achieved inPhases 1 and 2
KID TEENAGERS ADULTS
Figure 9. How di↵erent time ratios of 600 minutes a↵ect the rate collected playing asa family and the overall rate collected.
Figure 8 depicts the rates collected by each age group in Phase 1 (left) and Phase 2 (right), with
9 (left) depicts the aggregate cumulative rate collected in both periods. Figure 9 (right) records
the number of attractions visited in Phase 1 by the family and in Phase 2 by the teenagers, adults
and kids. As expected, split 0:1 achieves the best possible rating for teenagers and kids-adults.
305

What is interesting, however, is that the di↵erence in total rating achieved is practically the same
of all splits with the di↵erence being less than 5% of the teenagers and less than 2% of the kids
and adults. In addition, we observe that the total number of attractions visited is between 29 and
31 by all age groups. This suggests that all age groups within a family will achieve near optimal
routes in terms of rating when navigating the park as a single family group compared to visiting
the park individually. This is also true for the number of attractions visited. Hence, a family can
manage its time in the park accordingly.
We next try to understand what type of attractions the age groups visit for di↵erent time splits.
Figures 11, 12 and 13 of Appendix A, show the attributes of the visited attractions. In general,
we don’t observe large changes but there are some notable exceptions. For example, the number of
“Big Thrills” attractions visited by teenagers increases as the time available in Phase 2 increases.
This is also true for the “PhotoPassTM” and “Fastpass” attractions, however, there is only a slight
decrease in the number of “Fun for little ones” and “Family Adventure” attractions. For kids and
adults, it makes little di↵erence with respect to the time split as they practically visit attractions
with similar features and achieve very similar ratings in all time splits. Hence, as there are only
few di↵erences, a family might decide to spend more time as a whole instead of being separated,
so they can have a family experience.
4.2.3 Alternative Family Compositions
The aim of this section is to assess how well our result extends to di↵erent family compositions.
For this experiment we consider four families comprising of: (i) one preschooler, two teenagers and
two adults, (ii) one preschooler, one kid, two teenagers and two adults, (iii) one preschooler, one
tween and two adults and (iv) one kid, one tween and two adults. We repeat the experiments
from Section 4.2.2 to assess the impact of splitting the available time between the whole family
and individual time in the park. Figure 10 reports the total rate achieved in both phases for each
age group. The conclusions are similar to the previous section, i.e., the rating achieved by each
age group is roughly unchanged across all time allocations. However, for families that include a
preschooler, the rating of all age groups is slightly lower when the family spends all its time as
a single group (time split 1:0). This is the case as preschoolers have many attractions with age
restrictions thus the whole family cannot visit them when they are all together. Yet, when the time
306

The effect of time ratio on the total rate achieved in Phases 1 and 2
111.2 110.9 110.9 110.9 110.9 110.9 111.2
95.4
105.9 104.9 105.9 105.3 104.9109.8
104.95 105.15 105.15 105.15 105.15 105.15 104.95
1:0 3:2 11:9 1:1 9:11 2:3 0:1
Family composed of 2 adults, 2 teenagers and 1 preschooler
PRESCHOOLER TEENAGERS ADULTS
111.2 110.9 110.9 110.9 110.9 110.9 111.2
110.7 110.4 110.4 110.4 110.4 110.4 110.7
104.95 105.15 105.15 105.15 105.15 105.15 104.95
95.4
106 104.9 105.9 106.1 105.2109.8
1:0 3:2 11:9 1:1 9:11 2:3 0:1
Family composed of 2 adults, 2 teenagers, 1 kid and 1 preschooler
PRESCHOOLER KID TEENAGERS ADULTS
111.2 110.9 110.9 110.9 110.9 110.9 111.2
105.4
115 114.8 115.4 115.6 114.8118.8104.95
109.25 109.4109.675
109.4 109.4111.425
1:0 3:2 11:9 1:1 9:11 2:3 0:1
Family composed of 2 adults, 1 tween and 1 preschooler
PRESCHOOLER TWEEN ADULTS
121.1 119.5 119.4 119.4 119.4 119.4 121.1
116.7 116 116.6 116.6 116.8 116.8 118.8
115.55 113.1 113.15 113.15 113.25 113.25 116.725
1:0 3:2 11:9 1:1 9:11 2:3 0:1
Family composed of 2 adults, 1 tween and 1 kid
KID TWEEN ADULTS
Figure 10. How di↵erent time ratios of 600 minutes a↵ect the overall rate collected byeach age group of di↵erent types of families.
split allocates some time to older members of the family to visit the park on their own, e.g., split
3:2, the rating of all age groups increases and remain roughly unchanged across the rest of the time
splits. We conclude that families that include the age group of preschoolers, which is restrictive in
terms of attractions, might want to allocate some time to older age groups to navigate the park on
their own.
5 Conclusions
Our study exposes a number of interesting observations. The most striking is that if a family
spends all their time together as a single group, the individual age groups in the family will not
experience a significant drop in the rate collected compared to navigating the park on their own.
This is supported both by the experiments in Section 4.1 in which we observe that there is a
significant overlap in the attractions visited between the di↵erent age groups, and the experiments
in Section 4.2 where we clearly see that splitting the time between family and individual visits does
307

not produce significantly di↵erence for all age groups. In addition, the number of available hours
in the park will have an e↵ect on the total rating between the age groups, but will not favor one
age group over another. Therefore, our recommendation to families is to spend most (or all) their
time as a single group as they will achieve practically the same rating as if they would have visited
the park independently. This will of course have other side benefits as they will have more fun and
memories together.
We will like to emphasize that our analysis heavily depends on the rating of each attraction.
In many cases, rating alone might not be the best measure on how each age group experiences
each attraction. Families with younger children might prioritize attractions labeled as “Family
Adventure” or attractions where the children can meet Disney characters. Although the regression
analysis in Section 2 verifies that the ratings are partially influenced by these factors, each family
could have di↵erent priorities, a↵ecting in di↵erent ways the objective function or the orienteering
problem. As future work, we would like to examine further the preferences of visitors in Disneyland,
and provide a personalized schedule for each visitor. Our long term aim is to create a mobile
application in which the user can enter their preferences, and the rating of each attraction will be
adjusted accordingly. The application will then recommend the user the optimal route through
Disneyland maximizing their experience in the park.
308

References
[1] about france.com. The most visited tourist attraction in france. https://about-france.com/tourism/disneyland-paris.htm. Accessed June 23, 2021.
[2] Balas, E. The prize collecting traveling salesman problem. Networks 19, 6 (1989), 621–636.
[3] Bricker, T. Best disneyland paris attractions and ride guide. https://www.
disneytouristblog.com/best-disneyland-paris-attractions-ride-guide/. AccessedJune 23, 2021.
[4] Disneyland Paris. Calendar: Validity periods. https://www.disneylandparis.com/
en-int/tickets/1-day-ticket/. Accessed June 23, 2021.
[5] Disneyland Paris. Disneyland paris attractions. https://www.disneylandparis.com/
en-int/attractions/. Accessed June 23, 2021.
[6] Gavalas, D., Konstantopoulos, C., Mastakas, K., and Pantziou, G. A survey onalgorithmic approaches for solving tourist trip design problems. Journal of Heuristics 20, 3(2014), 291–328.
[7] Golden, B. L., Levy, L., and Vohra, R. The orienteering problem. Naval ResearchLogistics (NRL) 34, 3 (1987), 307–318.
[8] Gunawan, A., Lau, H. C., and Vansteenwegen, P. Orienteering problem: A surveyof recent variants, solution approaches and applications. European Journal of OperationalResearch 255, 2 (2016), 315–332.
[9] Hacking, M. Disneyland paris complete guide and tips (2020). https://www.mousehacking.com/blog/disneyland-paris-trip-planning-guide/. Accessed June 21, 2021.
[10] Howson, I. ols step forward p: Stepwise forward regression. https://rdrr.io/cran/
olsrr/man/ols_step_forward_p.html. Accessed June 23, 2021.
[11] Lazaridou, G. Numerical experiments disneyland paris project. https://github.com/
glazar01/Project-Disneyland-Paris. Accessed June 23, 2021.
[12] Lofberg, J. Yalmip: A toolbox for modeling and optimization in matlab. In 2004 IEEEinternational conference on robotics and automation (2004), IEEE, pp. 284–289.
[13] Miller, C. E., Tucker, A. W., and Zemlin, R. A. Integer programming formulation oftraveling salesman problems. Journal of the ACM (JACM) 7, 4 (1960), 326–329.
[14] Thomadsen, T., and Stidsen, T. K. The quadratic selective travelling salesman problem.
[15] Touringplans. Disneyland attractions. https://touringplans.com/disneyland/
attractions/. Accessed June 23, 2021.
[16] Tsiligirides, T. Heuristic methods applied to orienteering. Journal of the OperationalResearch Society 35, 9 (1984), 797–809.
[17] Vansteenwegen, P., Souffriau, W., and Oudheusden, D. V. The orienteering problem:A survey. European Journal of Operational Research 209, 1 (2011), 1–10.
[18] Wang, X., Golden, B. L., and Wasil, E. A. Using a genetic algorithm to solve thegeneralized orienteering problem. In The vehicle routing problem: latest advances and newchallenges. Springer, 2008, pp. 263–274.
309

A Appendix
Table 7. Characteristics for each attraction. With an asterisk we denote attractionsfor which the age group cannot visit due to age restrictions, however, a rating is stillprovided in (15).
No NameDuration
(m)Wait
time(m)Rate
PreschoolerRateKid
RateTween
RateTeen
RateAdult
2 Mickey’s PhilharMagic 12 0 4.1 4.3 4.3 3.9 4.13 It’s a small world 12 26.11 4.6 3.9 3.4 3.7 4.154 Adventure Isle 60 0 4 4 4 3.5 3.55 Alice’s Curious Labyrinth 4 5.39 4.3 4 3.3 3.6 3.76 Autopia 5.75 32.325 4.1* 4.3 3.7 3 3.17 Big Thunder Mountain 4.25 50.995 3.5* 4.7 4.8 4.8 4.558 Blanche-Neige et les Sept Nains 3 52.21 4 4.4 4.4 4.4 4.49 Buzz Lightyear Blast 4.75 37.55 4.3* 4.4 4.2 4 4.1510 Cars Quatre Roues Rallye 2 56.01 4.3 4.3 4.3 3.7 3.811 Cassey Jr.- le Petit Train du Cirque 3.5 18.805 4.3 3.5 2.7 2.9 3.2512 Crush’s Coaster 3 71.66 1.6* 4.5 4.5 4.9 4.713 Discovery Arcade 9.8 0 3.3 4 4 3.8 3.314 Disney Studio 1 9.5 0 2.8 3.7 3.7 4.1 4.515 Dumbo the Flying Elephant 2.335 31.895 4.6 4.1 3.4 3.6 3.716 Frontierland Playground 5 0 4.3* 4.6 4.6 3.9* 3.7*17 Horse-Drawn Streetcars 7 9.67 4.1 4.3 3.6 4.2 4.4518 Indiana Jones:Temple of Peril 3 41.815 1.6* 4.1* 4.7 4.8 4.419 La Cabane des Robinson 5 1.95 4 4 4 2 3.2520 La Galerie de la Belle au Bois Dormant 15 0.56 3 2.7 2.7 3.6 4.221 La Taniere du Dragon 6 0 3 3 3 2.5 322 Le Carrousel de Lancelot 5 9.06 3.5 3.5 3.5 1 223 Le Passage Enchante d’Aladdin 10 0 4.7 4.4 4.4 3.7 424 Le Pays des Contes de Fees 3 7.1 4 4 4 1 425 Les Mysteres du Nautilus 10 4.83 3.5 3.5 3.5 3 426 Les Tapis Volants 2 11.93 4.5* 4.1 4.1 3.2 3.427 Les Voyages de Pinocchio 3 16.997 3.6 3.4 3.2 3.3 3.4528 Liberty Arcade 8.98 1.02 3.3 4 4 3.8 3.329 Mad Hatter’s Tea Cups 3 9.06 4.4 4.3 4 4.1 3.730 Main Street Vehicles 4 8.22 4.1 4.3 3.6 4.2 4.4531 Orbitron 3 22.18 4.3 3.9 3.4 3.3 2.732 Peter Pan’s Flight 3 42.19 5 5 5 3 433 Phantom Manor 7 12.03 5* 5 5 4 534 Pirate Galleon 3 0 4 3.5 3.5 2.4 2.435 Pirates of the Caribbean 10 25.845 3.8 4.3 4.6 4.7 4.736 Pirates’ Beach 3 0 3.7* 3.6 3.6 3* 3.3*37 Princess Pavilion 14.5 64.33 4.4 4.1 4.1 3 3.238 RC Racer 2 35.6 1.9* 3.6 4.5 4.7 4.539 Ratatouille: The Adventure 5 9.27 4.4 4.1 4.1 3 3.240 Rustler Roundup Shootin’ Gallery 9 4.3 4.8* 4 4 3.8 3.341 Sleeping Beauty Castle 6 0 3.8 3.6 3.1 3.1 3.7542 Slinky Dog Zigzag Spin 2 10.96 4.3 4.8 4.8 4.6 4.743 StarTours:The Adventures Continue 7 39.935 3.7* 4.5 4.4 4.5 4.444 Star Wars Hyperspace Mountain 3 27.36 2.6* 4.4* 4.9 4.9 4.445 The Twilight Zone Tower of Terror 5 37.84 2.8* 4* 4 4.7 4.746 Thunder Mesa Riverboat Landing 15 20.91 4 4 4 2 447 Toy Soldiers Parachute Drop 2 32.08 3.6* 3.4 3.4 2.8 2.6
310

Table 8. Services for each attraction
Services No of attractions Total of attractionsSingle Rider 12,38,39,44,47 5Fastpass 7,9,18,32,39,43,44,45 8
PhotoPass TM 7,35,44,45 4Meet Disney Characters 37 1
15
14
3
12
1
5
3
1
1
0
3
5
0
8
6
1
2
7
3
1
0 5 10 15 20 25
Family AdventureFun for little Ones
Guest May Get SplashedNot to be Missed
Big ThrillsMay Frighten Younger Guests
Single Rider ServiceFastpass
PhotoPassTMMeet Disney Characters
Time Ratio 1:0FAMILY
Visited attractions compared to available attractions
Visited Not Visited
Figure 11. Visited attractions compared to available attractions for time ratio 1:0 forfamily experiment in Section 4.2.2
311

Table 9. Features of each attraction
NoFamily
AdventureFun for
little OnesGuest MayGet Splashed
Not tobe Missed
BigThrills
May FrightenYounger Guests
2 3 3 3 3 7 73 7 3 7 7 7 74 3 7 7 7 7 75 7 3 7 7 7 76 7 3 7 7 7 77 7 7 7 3 3 78 3 7 7 7 7 39 3 7 7 3 7 710 7 3 7 3 7 711 7 3 7 3 7 712 7 7 7 3 3 713 7 7 7 7 7 714 3 7 7 7 7 715 7 3 7 7 7 716 7 3 7 7 7 717 7 3 7 3 7 718 7 7 7 3 3 719 3 7 7 7 7 720 3 7 7 7 7 721 7 7 7 7 7 322 7 3 7 7 7 723 7 3 7 7 7 724 7 3 7 3 7 725 3 7 7 3 7 726 7 3 7 7 7 727 3 7 7 7 7 328 7 7 7 7 7 729 3 7 7 3 7 730 7 3 7 7 7 731 3 3 7 7 7 732 7 7 7 3 7 733 3 7 7 3 7 334 3 7 7 7 7 735 3 7 3 3 7 336 7 3 7 7 7 737 7 3 7 7 7 738 7 7 7 3 3 739 7 3 3 7 7 340 3 7 7 7 7 741 3 7 7 7 7 742 7 3 7 3 7 743 7 7 7 7 3 744 7 7 7 3 3 745 7 7 7 3 3 746 3 7 7 3 7 747 3 7 7 3 7 7
TotalNumber
18 19 3 20 7 6
312
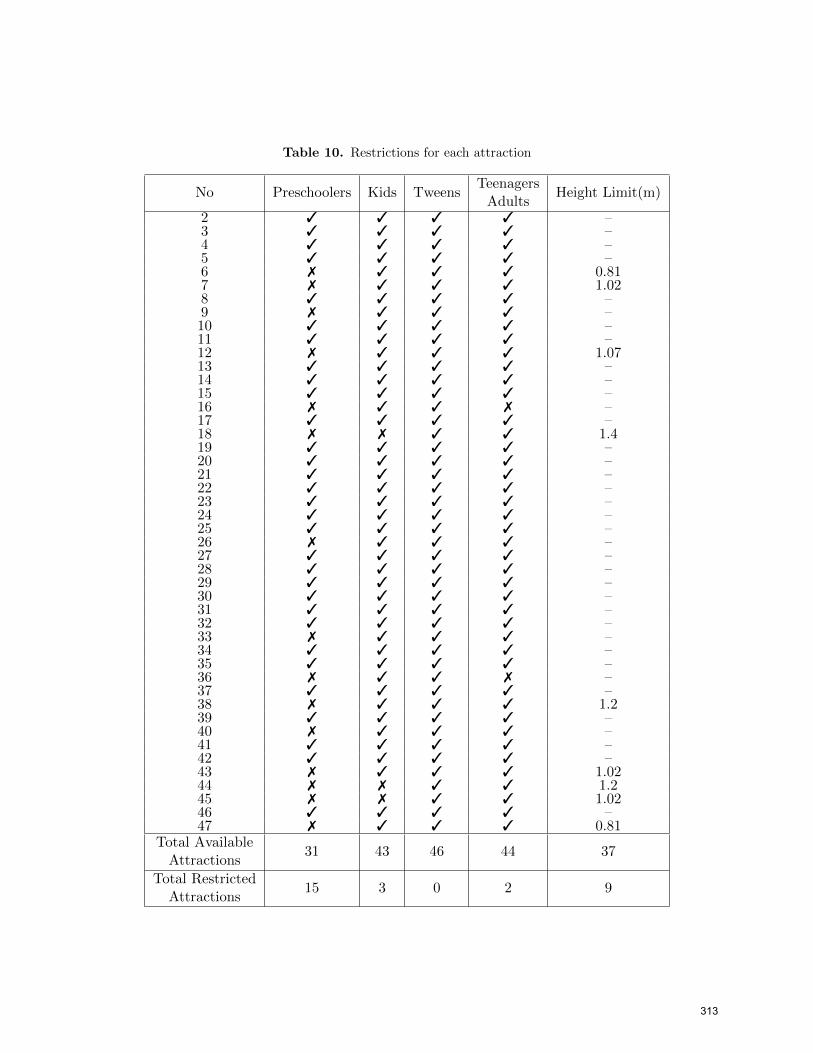
Table 10. Restrictions for each attraction
No Preschoolers Kids TweensTeenagersAdults
Height Limit(m)
2 3 3 3 3 –3 3 3 3 3 –4 3 3 3 3 –5 3 3 3 3 –6 7 3 3 3 0.817 7 3 3 3 1.028 3 3 3 3 –9 7 3 3 3 –10 3 3 3 3 –11 3 3 3 3 –12 7 3 3 3 1.0713 3 3 3 3 –14 3 3 3 3 –15 3 3 3 3 –16 7 3 3 7 –17 3 3 3 3 –18 7 7 3 3 1.419 3 3 3 3 –20 3 3 3 3 –21 3 3 3 3 –22 3 3 3 3 –23 3 3 3 3 –24 3 3 3 3 –25 3 3 3 3 –26 7 3 3 3 –27 3 3 3 3 –28 3 3 3 3 –29 3 3 3 3 –30 3 3 3 3 –31 3 3 3 3 –32 3 3 3 3 –33 7 3 3 3 –34 3 3 3 3 –35 3 3 3 3 –36 7 3 3 7 –37 3 3 3 3 –38 7 3 3 3 1.239 3 3 3 3 –40 7 3 3 3 –41 3 3 3 3 –42 3 3 3 3 –43 7 3 3 3 1.0244 7 7 3 3 1.245 7 7 3 3 1.0246 3 3 3 3 –47 7 3 3 3 0.81
Total AvailableAttractions
31 43 46 44 37
Total RestrictedAttractions
15 3 0 2 9
313

15
13
3
12
0
5
1
3
1
0
3
6
0
8
7
1
4
5
3
1
0 5 10 15 20 25
Family AdventureFun for little Ones
Guest May Get SplashedNot to be Missed
Big ThrillsMay Frighten Younger Guests
Single Rider ServiceFastpass
PhotoPassTMMeet Disney Characters
Time Ratio 11:9KID WITH ADULTS
Visited attractions compared to available attractions
Visited Not Visited
14
13
3
12
2
5
2
4
2
0
4
6
0
8
5
1
3
4
2
1
0 5 10 15 20 25
Family AdventureFun for little Ones
Guest May Get SplashedNot to be Missed
Big ThrillsMay Frighten Younger Guests
Single Rider ServiceFastpass
PhotoPassTMMeet Disney Characters
Time Ratio 11:9TEENAGERS
Visited attractions compared to available attractions
Visited Not Visited
14
14
3
11
0
5
1
2
1
0
4
5
0
9
7
1
4
6
3
1
0 5 10 15 20 25
Family AdventureFun for little Ones
Guest May Get SplashedNot to be Missed
Big ThrillsMay Frighten Younger Guests
Single Rider ServiceFastpass
PhotoPassTMMeet Disney Characters
Time Ratio 1:1KID WITH ADULTS
Visited attractions compared to available attractions
Visited Not Visited
14
13
3
12
2
5
2
4
2
0
4
6
0
8
5
1
3
4
2
1
0 5 10 15 20 25
Family AdventureFun for little Ones
Guest May Get SplashedNot to be Missed
Big ThrillsMay Frighten Younger Guests
Single Rider ServiceFastpass
PhotoPassTMMeet Disney Characters
Time Ratio 1:1TEENAGERS
Visited attractions compared to available attractions
Visited Not Visited
14
14
3
11
0
5
1
3
1
0
4
5
0
9
7
1
4
5
3
1
0 5 10 15 20 25
Family AdventureFun for little Ones
Guest May Get SplashedNot to be Missed
Big ThrillsMay Frighten Younger Guests
Single Rider ServiceFastpass
PhotoPassTMMeet Disney Characters
Time Ratio 3:2KID WITH ADULTS
Visited attractions compared to available attractions
Visited Not Visited
14
13
3
12
2
5
2
4
2
0
4
6
0
8
5
1
3
4
2
1
0 5 10 15 20 25
Family AdventureFun for little Ones
Guest May Get SplashedNot to be Missed
Big ThrillsMay Frighten Younger Guests
Single Rider ServiceFastpass
PhotoPassTMMeet Disney Characters
Time Ratio 3:2TEENAGERS
Visited attractions compared to available attractions
Visited Not Visited
Figure 12. Visited attractions compared to available attractions for time ratios 3:2,11:9 and 1:1 for family experiment in Section 4.2.2
314

15
13
3
12
0
5
1
3
1
0
3
6
0
8
7
1
4
5
3
1
0 5 10 15 20 25
Family AdventureFun for little Ones
Guest May Get SplashedNot to be Missed
Big ThrillsMay Frighten Younger Guests
Single Rider ServiceFastpass
PhotoPassTMMeet Disney Characters
Time Ratio 9:11KID WITH ADULTS
Visited attractions compared to available attractions
Visited Not Visited
14
13
3
12
2
5
2
4
2
0
4
6
0
8
5
1
3
4
2
1
0 5 10 15 20 25
Family AdventureFun for little Ones
Guest May Get SplashedNot to be Missed
Big ThrillsMay Frighten Younger Guests
Single Rider ServiceFastpass
PhotoPassTMMeet Disney Characters
Time Ratio 9:11TEENAGERS
Visited attractions compared to available attractions
Visited Not Visited
15
13
3
12
0
5
1
3
1
0
3
6
0
8
7
1
4
5
3
1
0 5 10 15 20 25
Family AdventureFun for little Ones
Guest May Get SplashedNot to be Missed
Big ThrillsMay Frighten Younger Guests
Single Rider ServiceFastpass
PhotoPassTMMeet Disney Characters
Time Ratio 2:3KID WITH ADULTS
Visited attractions compared to available attractions
Visited Not Visited
14
11
3
13
3
5
2
5
3
0
4
8
0
7
4
1
3
3
1
1
0 5 10 15 20 25
Family AdventureFun for little Ones
Guest May Get SplashedNot to be Missed
Big ThrillsMay Frighten Younger Guests
Single Rider ServiceFastpass
PhotoPassTMMeet Disney Characters
Time Ratio 2:3TEENAGERS
Visited attractions compared to available attractions
Visited Not Visited
15
14
3
12
1
5
3
1
1
0
3
5
0
8
6
1
2
7
3
1
0 5 10 15 20 25
Family AdventureFun for little Ones
Guest May Get SplashedNot to be Missed
Big ThrillsMay Frighten Younger Guests
Single Rider ServiceFastpass
PhotoPassTMMeet Disney Characters
Time Ratio 0:1KID WITH ADULTS
Visited attractions compared to available attractions
Visited Not Visited
13
12
3
13
4
5
3
4
3
0
5
7
0
7
3
1
2
4
1
1
0 5 10 15 20 25
Family AdventureFun for little Ones
Guest May Get SplashedNot to be Missed
Big ThrillsMay Frighten Younger Guests
Single Rider ServiceFastpass
PhotoPassTMMeet Disney Characters
Time Ratio 0:1TEENAGERS
Visited attractions compared to available attractions
Visited Not Visited
Figure 13. Visited attractions compared to available attractions for time ratios 9:11,2:3 and 0:1 for family experiment in Section 4.2.2
315

Acknowledgement
We would like to express our special thanks of gratitude to our advisor Professor Dr. Angelos
Georghiou for the patient guidance, encouragement and advice he has provided throughout our
time as his students. We consider ourselves to be extremely privileged to have been his students
because we benefited enormously from his excellence as a teacher and as a researcher. In particular,
he has encouraged our research and has made a significant contribution to our completion of this
study, without him we could not have completed this project. These contributors have enhanced
the quality of our work. We have been extremely lucky to have a supervisor who cared so much
about our work.
316