let’s make this qualitative
TRANSCRIPT

Let’s Make This Qualitative
Quantitative Business Decision Making for the Qualitative Minded
Mike Desilets, MBA
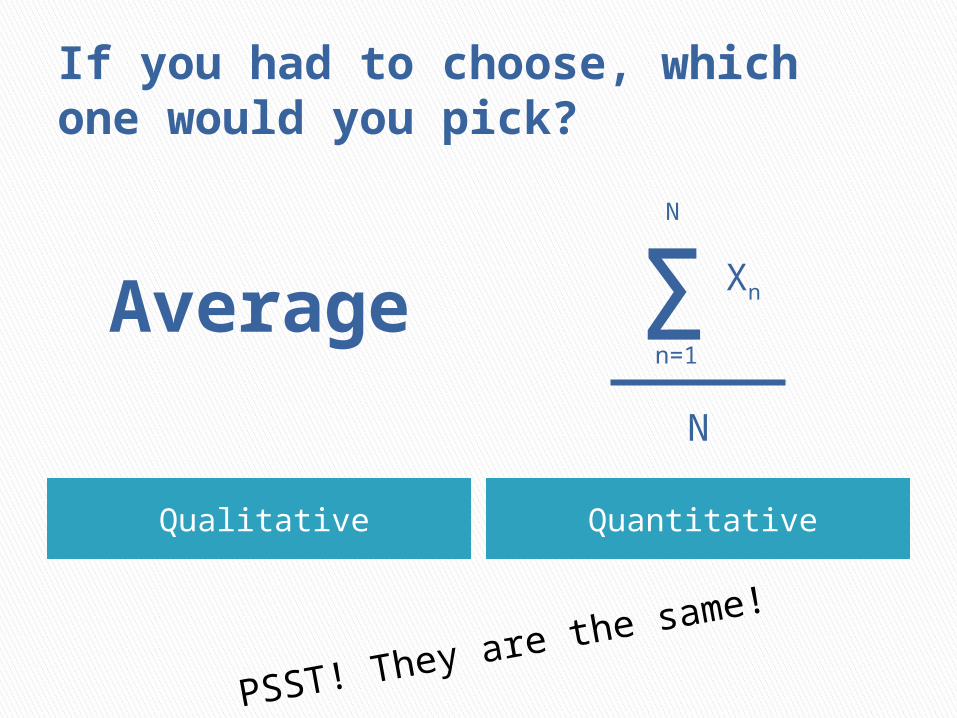
If you had to choose, which one would you pick?
Qualitative Quantitative
Average Σn=1
N
Xn
N
PSST! They are the same!

Should you continue?
Average Σn=1
N
Xn
N
YES!!! You are free to go…
We all make decisions everyday.
TUNA-OR-
HAM?

Pick which one you want more.
TUNA: A LOTHAM: NOT REALLY

Can we quantify this?
THINK OF A SURVEY1 2 3 4 5
Not really A Lot
On a scale of 1 to 5, how much do you want tuna?
1 2 3 4 5
Not really A Lot
On a scale of 1 to 5, how much do you want ham?

How did we come to a conclusion?
5 > 1
Ham
Tuna

How do we extend this to multiple criteria?
ONLY CRITERIA BEFORE WAS:
“HOW MUCH DO IWANT THIS?”

You’ve been made 3 job offers in each of the following cities:◦ Denver◦ San Francisco◦ Boston
You decide that the most important factors to consider where to move are (in order)◦ Weather (given the fact you aren’t a skier)◦ Salary◦ City’s cultural and historical value◦ Proximity to your family (who are in Denver)
Task: Use a quantitative decision matrix to help
Example

Step 1) Define the criteria
1) WEATHER2) SALARY3) CITY CULTURE4) PROXIMITY TO FAMILY
You’ve already done that!

Decide importance of each criteria
FAMILY : NEUTRALWEATHER : VERY
IMPORTANTSALARY : IMPORTANTCITY CULTURE :
IMPORTANT
You’ve already done that, too!But, let’s rate them like a survey.
1 2 3 4 5
Not Important
VeryImportant
Neutral
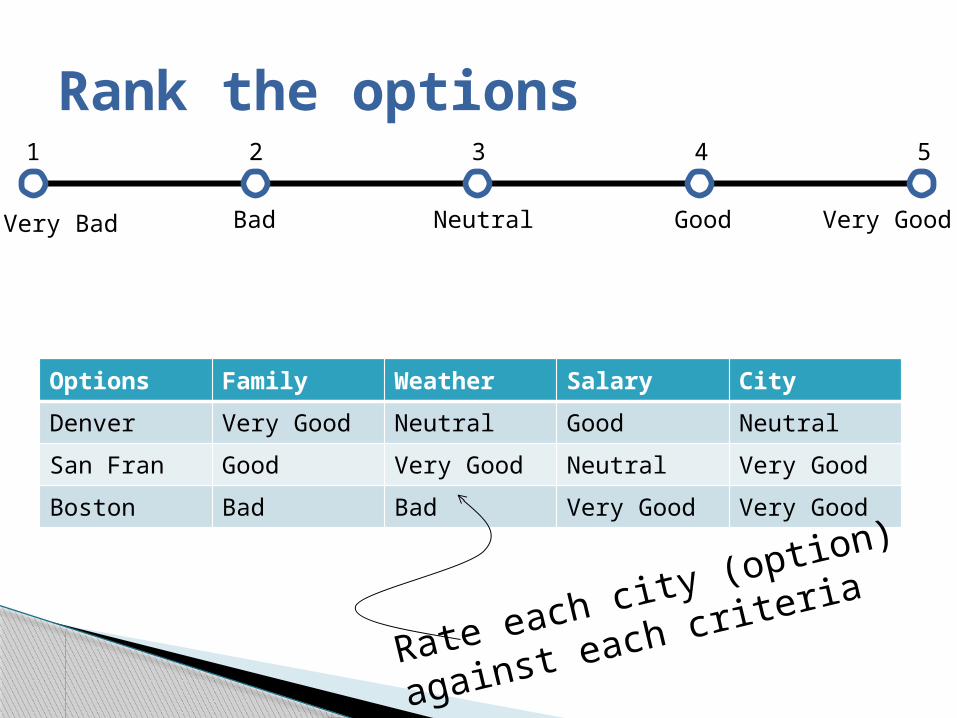
Options Family Weather Salary City
Denver Very Good Neutral Good Neutral
San Fran Good Very Good Neutral Very Good
Boston Bad Bad Very Good Very Good
Rank the options
Rate each city (option)
against each criteria
1 2 3 4 5
Very Bad Very GoodNeutral GoodBad
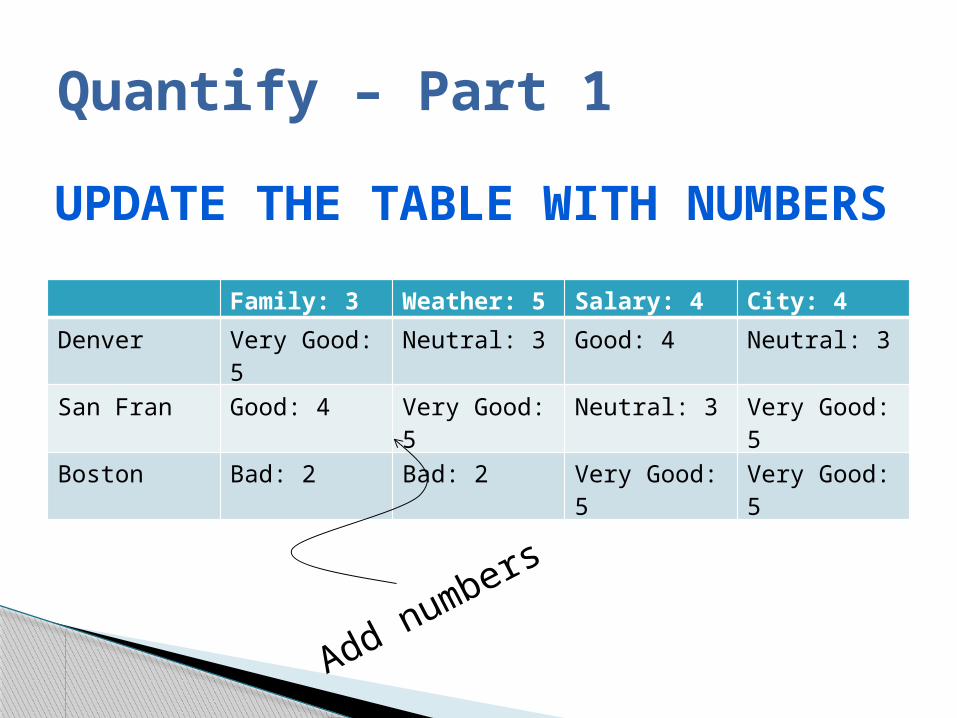
Quantify – Part 1
UPDATE THE TABLE WITH NUMBERS
Family: 3 Weather: 5 Salary: 4 City: 4
Denver Very Good: 5
Neutral: 3 Good: 4 Neutral: 3
San Fran Good: 4 Very Good: 5
Neutral: 3 Very Good: 5
Boston Bad: 2 Bad: 2 Very Good: 5
Very Good: 5
Add numbers

Quantify – Part 2MULTIPLY CRITERIA
AND OPTION RANKINGSFamily: 3 Weather: 5 Salary: 4 City: 4
Denver Very Good: 5 (15)
Neutral: 3(15)
Good: 4(16)
Neutral: 3(12)
San Fran Good: 4(12)
Very Good: 5(25)
Neutral: 3(12)
Very Good: 5(20)
Boston Bad: 2(6)
Bad: 2(10)
Very Good: 5(20)
Very Good: 5(20)
“Salary” @ 4
Times“Very Good” @ 5
Equals 20

Quantify – Part 3ADD VALUES TO DETERMINE
RAW SCORESFamily: 3 Weather:
5Salary: 4 City: 4 3+5+4+4=16
Denver Very Good: 5 (15)
Neutral: 3(15)
Good: 4(16)
Neutral: 3(12)
15+15+16+12 =58
San Fran Good: 4(12)
Very Good: 5(25)
Neutral: 3(12)
Very Good: 5(20)
12+25+12+20=69
Boston Bad: 2(6)
Bad: 2(10)
Very Good: 5(20)
Very Good: 5(20)
6+10+20+20=56
Family 12 + Weather 25 + Salary 12 + City 20 = 69

Evaluate – but what does it mean?
LARGEST ONE IS CHOICE
RIGHT?
Raw Score
Denver 58
San Fran 69
Boston 56
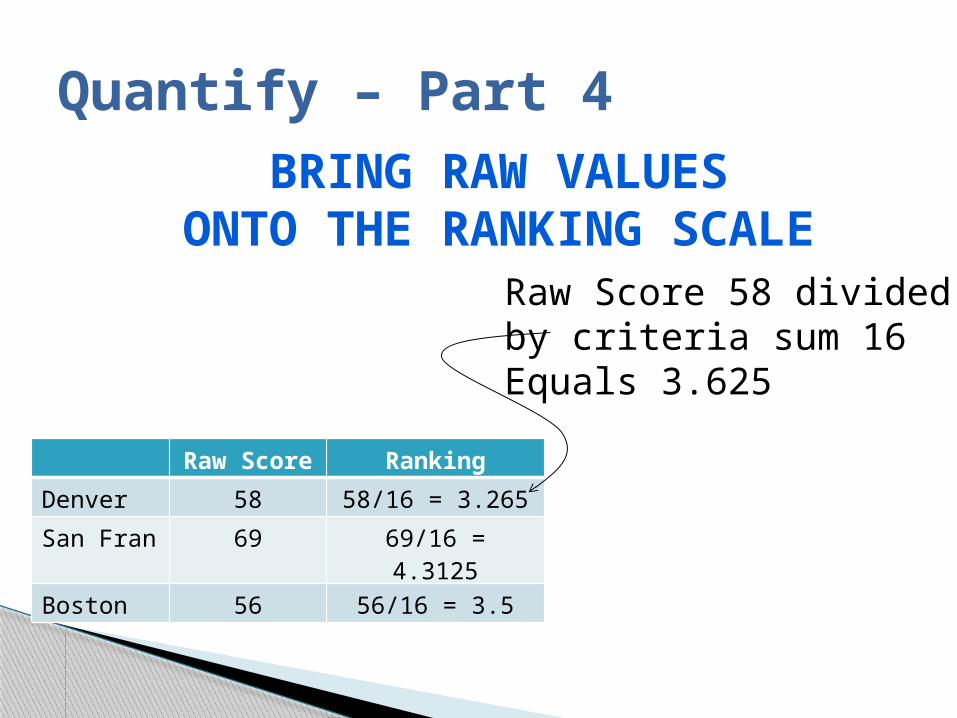
Quantify – Part 4BRING RAW VALUES
ONTO THE RANKING SCALERaw Score 58 divided by criteria sum 16Equals 3.625
Raw Score
Ranking
Denver 58 58/16 = 3.265
San Fran 69 69/16 = 4.3125
Boston 56 56/16 = 3.5

Evaluate – and understand
Raw Score
Final Score
Denver 58 3.625
San Fran 69 4.3125
Boston 56 3.5
Boston (3.5)
Denver (3.625)
San Fran(4.3125)
1 2 3 4 5
Very Bad Very GoodNeutral GoodBad
Evaluating was “easy”
BOSTON < DENVER < SAN FRAN
What about when there is only one choice (yes/no, up/down, etc)?
DO I GO AHEAD WITHTHIS R&D PROJECT?
IF YES, WHAT IS MY STRATEGY?

Go/No-Go: Answer 1RANK THE OPTION LIKE BEFORE
AND CHOOSE A VALUE THATIS YOUR THRESHOLD BETWEEN
YES AND NO.
FOR EXAMPLE, A SCORE OVER 4.5MEANS “GO”
PROS: EASY, CONCRETECONS: WHAT DOES IT MEAN?
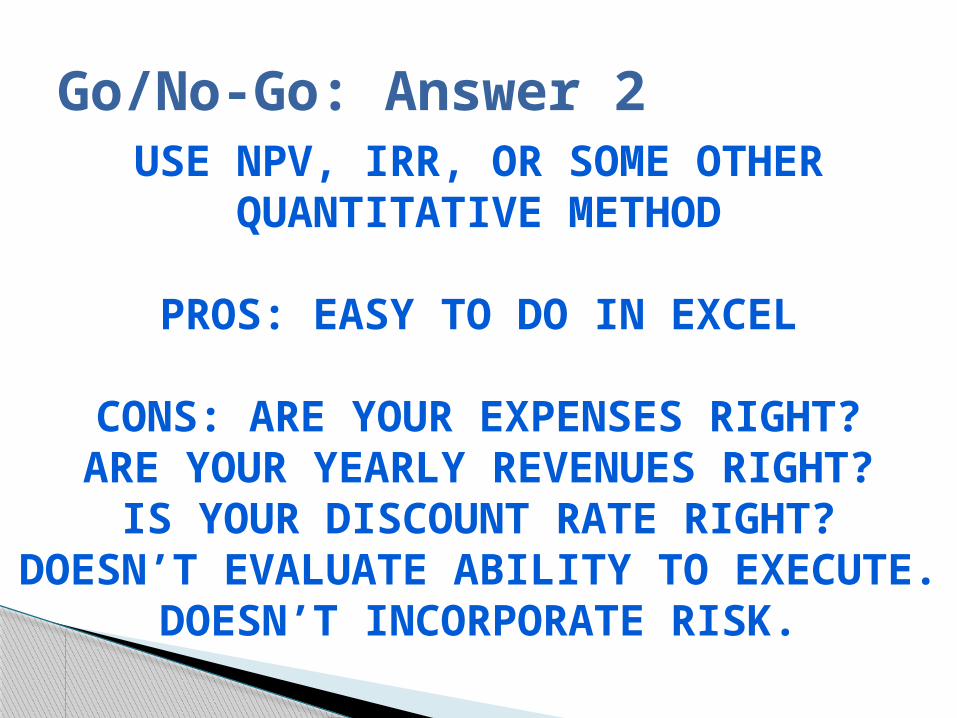
Go/No-Go: Answer 2USE NPV, IRR, OR SOME OTHER
QUANTITATIVE METHOD
PROS: EASY TO DO IN EXCEL
CONS: ARE YOUR EXPENSES RIGHT?ARE YOUR YEARLY REVENUES RIGHT?
IS YOUR DISCOUNT RATE RIGHT?DOESN’T EVALUATE ABILITY TO
EXECUTE.DOESN’T INCORPORATE RISK.
Best answer
VISUALIZE THE ANSWER AND MAKE A QUALITATIVE
DECISION BASED ON SIMPLE RATINGS OF CASH
FLOWS, RISK, MARKET, ABILITY TO EXECUTE, ETC?

Solution
GE/MCKINSEYNINEBOX
MATRIX

Evaluates Decisions on 2 Criteria
MARKET ATTRACTIVENESS&
BUSINESS STRENGTH
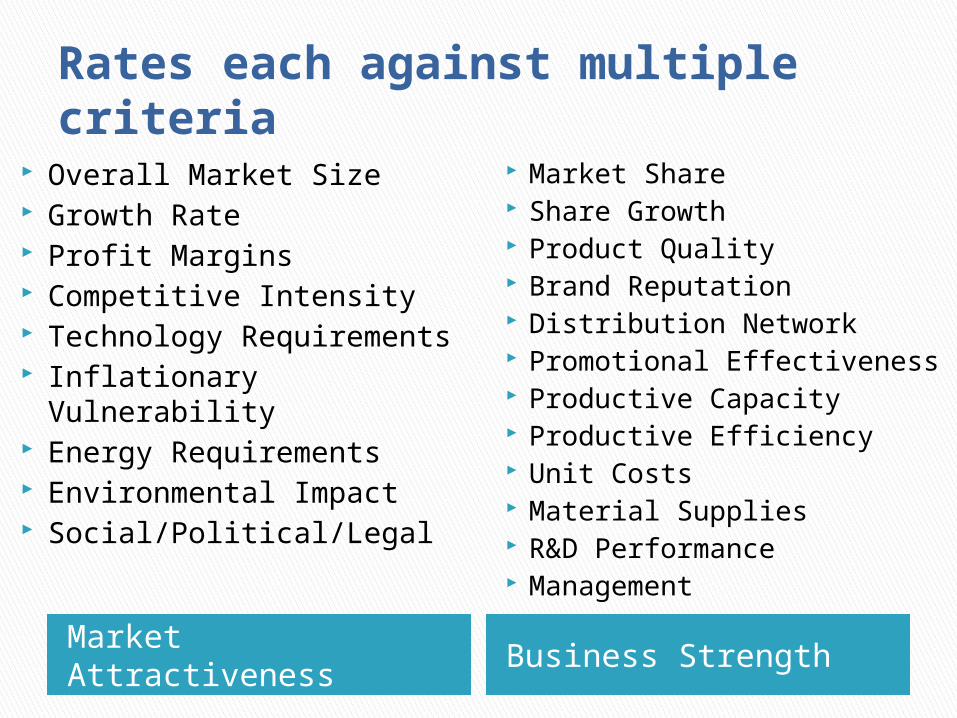
Rates each against multiple criteria
Market Attractiveness Business Strength
Overall Market Size Growth Rate Profit Margins Competitive Intensity Technology Requirements Inflationary Vulnerability Energy Requirements Environmental Impact Social/Political/Legal
Market Share Share Growth Product Quality Brand Reputation Distribution Network Promotional Effectiveness Productive Capacity Productive Efficiency Unit Costs Material Supplies R&D Performance Management

Decide importance of each criteria
Importance to Evaluation
Overall Ranking
Very High: 5 High: 4 Neutral : 3 Low : 2 Very Low : 1 Not at all : 0
Very Positive : 5 Positive : 4 Neutral : 3 Negative : 2 Very Negative : 1
We can easily eliminate some options from the evaluation by rating something as “not important at all”
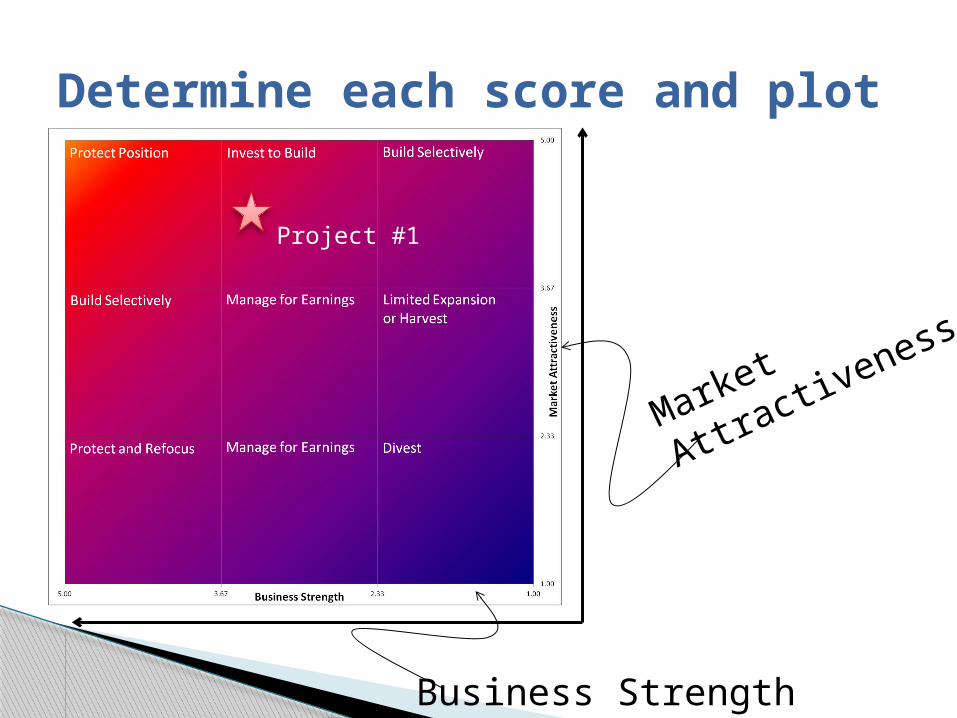
Market
Attractiveness
Business Strength
Project #1
Determine each score and plot
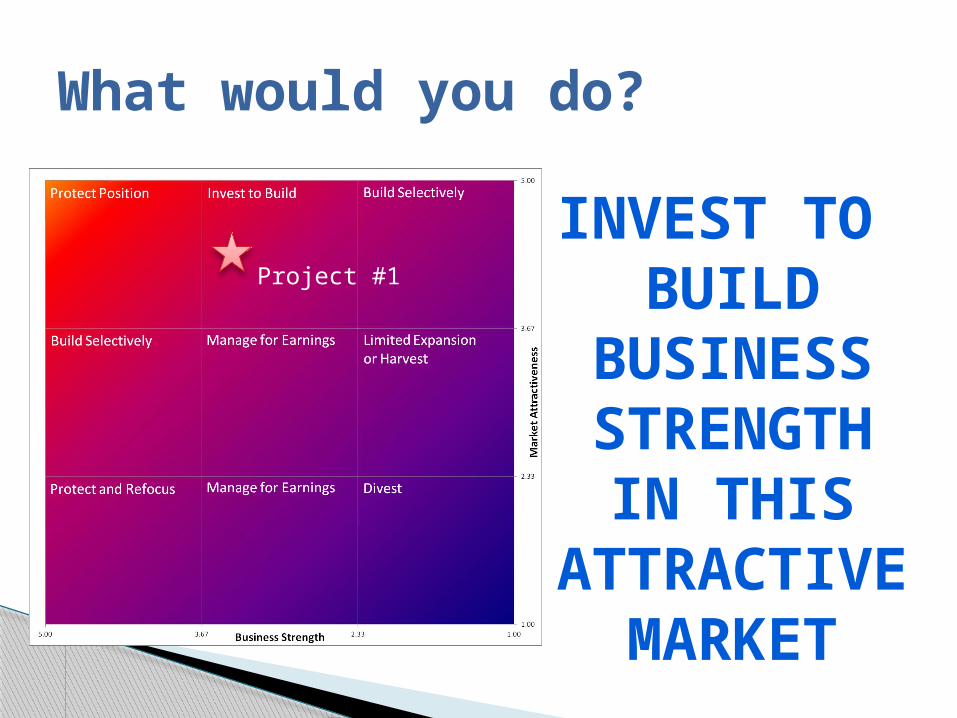
Project #1
INVEST TO BUILD
BUSINESSSTRENGTH
IN THISATTRACTIVE
MARKET
What would you do?

MAYBE NOT!
HOW CAN WE DO BETTER?
CHOOSE A NEW MARKET?
ALWAYS TRY TO FIND A WAY TO MOVE UP AND
LEFT
Do you give up here?
Project #2
Project #1
Porter’s 5 Forces to the market attractiveness
PESTLE Analysis to market attractiveness
Porter’s Value Chain to business strength
Day’s Risk Matrix to business strength
VRIO Model assessment of competitive advantages to business strength
AND MORE!!!
Why stop there? We can add…
Bottom line (no – not profit)
MORE INFORMATION =
A MORE REALISTIC MODEL

Your model is only as good as the inputs
A canned model is never right. It…◦ Reminds you what to look for◦ Shows you which way you might want to go
The GE/McKinsey Matrix can be used to view multiple projects and compare them.◦ Use market size to add value (larger market
means larger plot marker)
Caveats
