letshego holdings limited
TRANSCRIPT

Andrew F OkaiGroup Chief Executive
Letshego Holdings Limited Group Interim Results 2021

AGENDA
2
G R O U P I N T E R I M R E S U L T S 2 0 2 1
S T R A T E G I C O U T L O O K
§ Financial Performance§ Credit Overview§ Funding & Liquidity
Financial Highlights§ Headlines§ 6-2-5 roadmap§ Plan 2 progress
§ Economic and business outlook § Foundation for the future - LetsGO Mall§ 2025 Targets
Plan 2 and beyond
H1 Headlines & Achievements

AGENDA
3
G R O U P I N T E R I M R E S U L T S 2 0 2 1
S T R A T E G I C O U T L O O K
§ Financial Performance§ Credit Overview§ Funding & Liquidity
Financial Highlights§ Headlines§ 6-2-5 roadmap§ Plan 2 progress
§ Economic and business outlook § Foundation for the future - LetsGO Mall§ 2025 Targets
Plan 2 and beyond
H1 Headlines & Achievements

Letshego Interim Results 2021: Agenda
4
Digital Quotient (DQ) improves from 25% to 51% driven by strides in Enterprise Agility
Strong loan growth underpinning significant uplift in PBT and PAT (in excess of 20%)
50% dividend payout ratio combined with 17% dividend yield driving higher returns
Continued commitment to prioritising lives and livelihoods of our people, customers and communities.Building a culture of digital leadership, through enhanced knowledge and skills 97% uptake of digital learning solutions
Programmatic lending to accelerate social impact. BWP400 million boosting reach
Accelerating digitalisation - LetsGO digital platform now live in 10 markets
Leveraging emerging technologies (RPA) and Data to enhance productivity and efficiency. First ‘Bots’ deployed
Business Transformation
Strong Performance
Shareholder Value
People First
Improving Lives
End-2-End Automation
Digital First
Headline themes: H1 2021

Business environment has been challenging…IMF GDP Projections (August 2021)
5
Ghana1
-0.1
Tanzania
Uganda
Kenya
Eswatini
Rwanda
Mozambique
Nigeria
Lesotho
Namibia
Botswana
1.0
0.9
-0.2
-0.5
-7.2
-1.8
-2.1
-4.5
-3.3
-8.3
7.5
Lesotho
Uganda 6.4
Botswana
4.6
Kenya
Rwanda
Ghana
5.7
Tanzania
Nigeria
Namibia
Mozambique
Eswatini
7.6
3.5
2.7
2.6
2.1
2.5
1.4
Africa (Region)
Europe
Asia and Pacific
-1.9
World
North America
South America
-1.3
-3.3
-4.1
-5.8
-6.6
6.1
7.3Asia and Pacific
North America
World
South America
Africa (Region)
Europe
6.0
4.9
4.4
4.3
Global GDP outlook Africa’s economic outlook
Real 2020 GDP growthAnnual percent change, %
Real 2020 GDP growthAnnual percent change, %
Real 2021 GDP growthAnnual percent change, %
Real 2021 GDP growthAnnual percent change, %
1. Ghana's own estimate per budget statement is 0.2%Source: IMF GDP Forecast (August 2021)
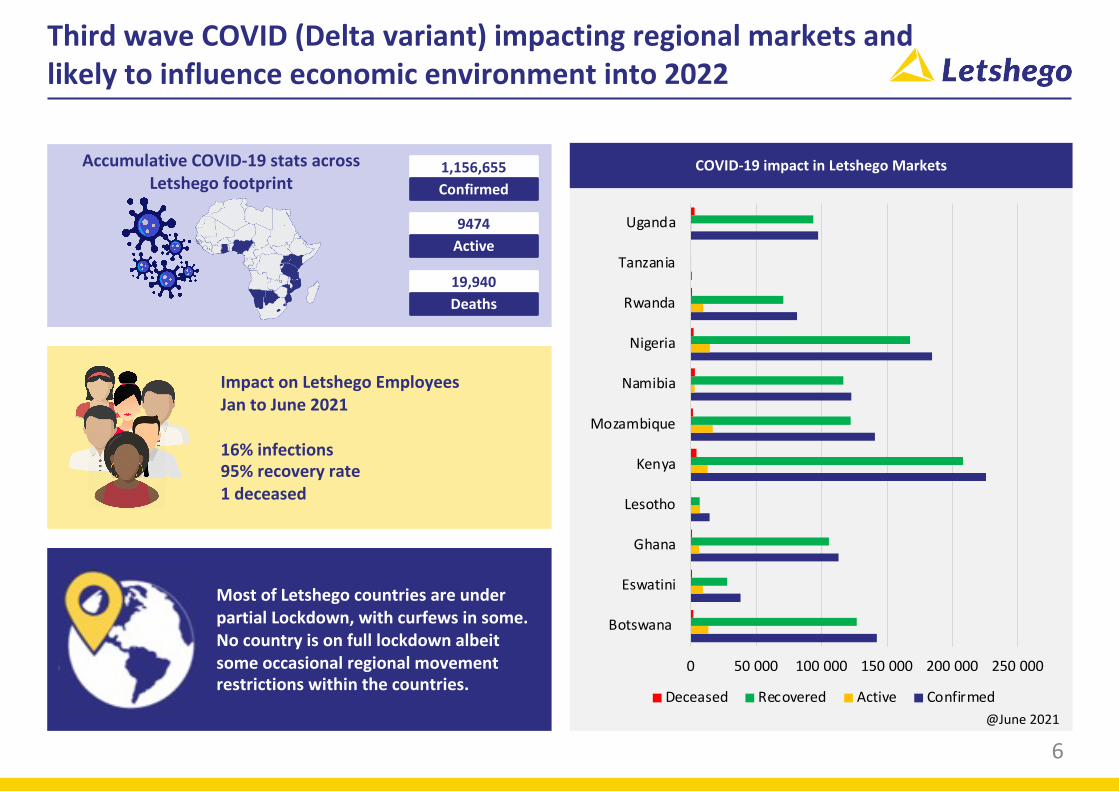
Third wave COVID (Delta variant) impacting regional markets and likely to influence economic environment into 2022
6
COVID-19 impact in Letshego Markets
0 50 000 100 000 150 000 200 000 250 000
Botswana
Eswatini
Ghana
Lesotho
Kenya
Mozambique
Namibia
Nigeria
Rwanda
Tanzania
Uganda
Deceased Recovered Active Confirmed
Accumulative COVID-19 stats across Letshego footprint
1,156,655Confirmed
9474Active
19,940Deaths
Impact on Letshego EmployeesJan to June 2021
16% infections 95% recovery rate1 deceased
Most of Letshego countries are under partial Lockdown, with curfews in some. No country is on full lockdown albeit some occasional regional movement restrictions within the countries.
@June 2021

Our 6-2-5 Plan: ‘Return to growth’
7
Creating a world class Retail Financial services organisation
Short term: Leverage on our strengths to deepen impact Medium /Long term : Customer ; Talent, Innovation and technology
Platform ThinkingTransformative TechnologiesProductivity of Solutions
STRENGTHEN our foundation
§ Build on core business, DAS§ Key digital channels to improve
DAS productivity§ Diversify solutions & Funding
BECOME customer led
§ Invest in Customer Experience § Leverage on emerging
transformative technologies§ Customer led, speed to market§ Enterprise Agility as a
methodology .
CREATE the future organisation
§ Talent mobility § Relentless Innovation
culture § Digital delivery – Innovation
hubs / Platform/Ecosystem thinking
6Months
2Years
5Years

All channels available
We have rolled out the DIGITAL MALL to 10 Letshego markets (DAS-focused)
Key Insights from the DigitalMall Rollout
Android Web
WWW
USSD iOS
74%Digital
adoption
Kenya
Namibia
Tanzania
EswatiniLesotho
Mozambique
Uganda
Botswana
Nigeria
Ghana
Customers Registered> 20 000
Customers New to Letshego77%

Strong traction in strategy execution
9
STRATEGIC TRANFORMATION
1
2
3
5
4
DIGITAL MALL live in 10 markets DIGITAL QUOTIENT
ROBOTIC PROCESS AUTOMATION (RPA)
ARCHITECTURE REFRESH
East & West PBT Growth 23% yoy
Kenya more than doubled PBT
Nigeria accelerating digital
Ghana loan book growth 62% Uganda realigned structure
SAFe Trained 180 employees
OKR Rating Platform : Digitising employee
performance
New skills recruitment – #futurefit 20 Squads
PBT 23% PAT 28%
D/E: 119% CIR
ROE Dividend Ratio
LLR <2% Strong funding base
LetsgoINSURE partnership with
SANLAMLetsGo Pay Digital
Account - Panamax USA
Affordable Housing Namibia
49%
13% 50%
97% staff registration

Digital Quotient our measure of our Digital maturity
10
30
-30
40
-20
-10
0
10
20
50
60
70
80
Digital Leaders1 Letshego Others Digital Emergents2
Digital Leader Average: 66
Traditional Bank
Letshego 2nd SurveyPost 6-2-5
29th August 2021
Source: McKinsey Digital Quotient1. Digital Leaders are defined as the top quintile companies in the DQ database2. Digital Emergents are defined as the bottom quintile companies in the DQ database3. Banking average includes 182 Banking players across the Globe
Distribution of DQ score (DQ Scores Out of 100)
Second quintile of peer average
(20-40%)
DQ Score: 25
Letshego 1st Survey Before Plan 6-2-5
June 2020
Banking3 DQ score: 41
Top Quintile DQ score in Banking: 51

H1 2021 Performance: Take aways
Strong financial performance
Our business remains resilient
Accelerating our digitalisation agenda
Culture and Enterprise Agility integral to our transformation
Generating long term shareholder value remains our priority
11

AGENDA
12
G R O U P I N T E R I M R E S U L T S 2 0 2 1
S T R A T E G I C O U T L O O K
§ Financial Performance§ Credit Overview§ Funding & Liquidity
Financial Highlights
§ Headlines§ 6-2-5 roadmap§ Plan 2 progress
§ Economic and business outlook § Foundation for the future - LetsGO Mall§ 2025 Targets
Plan 2 and beond
H1 Headlines & Achievements

Income Statement Highlights H1 2021
13
Net Interest Income Impairment Charge Profit before Tax
Cost to income Loan loss ratio Return on equity
48%
47%
May 20
May 21
1,7%
1,5%
May 20
May 21
12%
13%
May 20
May 21
H1 2021: P1.02 bnH1 201: P910 mn
12%
H1 2021:P76 mnH1 2020: P 71 mn
7%
H1 2021: P544 mnH1 2020: P 443 mn
23%
41%
49%
H1 2019
H1 2020
Cost to income Loan loss ratio Return on equity
41%
49%
H1 2019
H1 2020
Cost to incomeCost to income
49%
47%
H1 2020
H1 2021
1,4%
1,4%
H1 2020
H1 2021
11%
13%
H1 2020
H1 2021

Income Statement Commentary
14
H12021
H1 2020
Change%
Net interest income 1,019 910 12%
Non funded income 150 113 33%
Operating income 1,169 1,023 14%
Operating costs (549) (509) (8%)
Pre - provision profits 620 514 21%
Expected credit losses (76) (71) (7%)
Profit before tax 544 443 23%
Tax charge (230) (198) (16%)
Profit after tax 314 245 28%
Basic Earnings per Share (thebe) 13.4 10.7 25%
Key Messages
Net interest up 12% from prior period on the back of net loan book growth of 20% mainly in Namibia, Ghana and Mozambique
NFI increased by 33% as the insurance structures in Namibia were set up in the latter part of 2020. Increased transactional activities expected in H2 .
Operating expenditure up 8% . This is in line with continued investment on future capability on robotics, data analytics and process automation.
ETR at 42% and down 3% from prior year. This was driven by a 23% increase in the Group’s profit which was propelled by the increase in non-funded income (mainly insurance arrangements).
Credit impairment charge. LRR was 1.4%, same as last year. Asset quality has remained strong, despite impact of Covid -19 on MSE portfolio

Despite severe headwinds across our markets, Business is on an upward trajectory path as Plan 2 is implemented
15
YOY GrowthNet Advances16% Collection Rate
(2020: 92%)98% YOY PBT Growth 31%YOY GrowthNet Payouts25% New Customers37%
Net PayoutsValue (BWP Mlns)
Overall DAS Performance
112
152169
212223 220
0
50
100
150
200
250
Jan-21 Feb-21 Mar-21 Apr-21 May-21 Jun-21
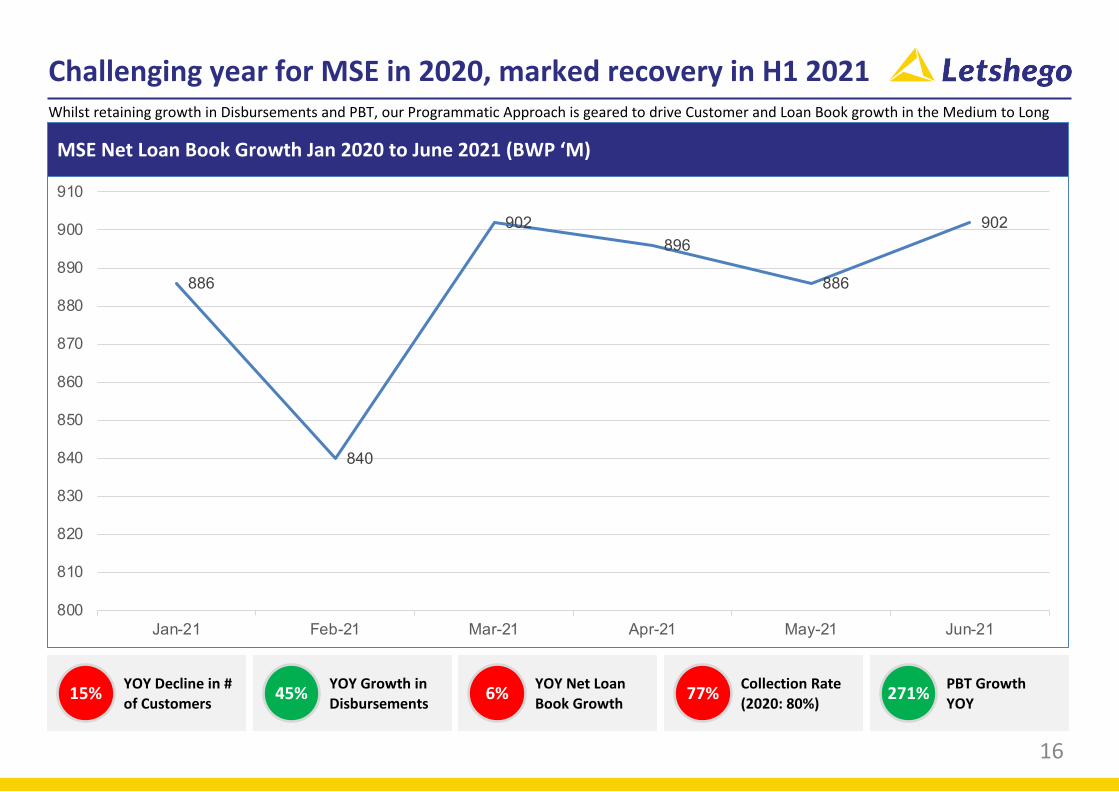
Challenging year for MSE in 2020, marked recovery in H1 2021Whilst retaining growth in Disbursements and PBT, our Programmatic Approach is geared to drive Customer and Loan Book growth in the Medium to Long Term
16
YOY Growth in Disbursements 45% Collection Rate
(2020: 80%)77% PBT Growth YOY 271%YOY Decline in #
of Customers 15% YOY Net Loan Book Growth 6%
MSE Net Loan Book Growth Jan 2020 to June 2021 (BWP ‘M)
886
840
902896
886
902
800
810
820
830
840
850
860
870
880
890
900
910
Jan-21 Feb-21 Mar-21 Apr-21 May-21 Jun-21

Mobile Mass Business: Strength and resilience
17
Net Advances P’ Millions
Overall Mass Mobile Performance
YOY growthNet Advances218% Active Customer Usage grows
by 1,5 MillionYOY PBT increase>30% 20%
274
313
371
310 300
364
0
50
100
150
200
250
300
350
400
Jan-21 Feb-21 Mar-21 Apr-21 May-21 Jun-21

18
29
-89
136
76
-150
-100
-50
0
50
100
150
Impairment provision Recoveries Write offs Total charge
42
-105
134
71
-150
-100
-50
0
50
100
150
Impairment provision Recoveries Write offs Total charge
-153 -199
377
26
-300
-200
-100
0
100
200
300
400
500
Impairment provision Recoveries Write offs Total charge
HY2021 HY2020
FY2020 June 2021 Impairment Charge is unfavorable by 7% in comparison to same time last year ( Jun21: P75.7m ,Jun20 :P70.9m)
Turnaround strategy in mobile lending resulted in Ghana Qwikloans impairment charge reducing by 97% last year .
Annualised loan loss rate (LLR) for June 2021 is 1.4% compared to 1.4% same period last year .
Forward Looking Provisions – All macro economic outlook variables stretched to downside in our ECL models . These include CPI, unemployment rate ,GDP and Inflation ..
Covid-19 provisions – Stress testing led to staging amendments and therefore additional provision of P13.2m
Income Statement: Impairment Charge Trends

Expected Credit Losses (ECL): Stable Impairment Coverage; ECL increase in downside macroeconomic environment
19
Key Highlights
§ Overall impairment coverage remained stable at 5.4% in June 2021 ( 5.4% in Dec2020)
§ Loan loss rate moving to 1.4% from 0.3% full year 2020, with increase in Gross advances that increased from P10.74 billion in 2020 to P11.7billion at June 2021
§ Stage 1 - Growth in DAS portfolios at the back digitization strategy
§ Stage 2- Increase in accounts having significant increase in credit risk at the back of sectoral risk in MSE portfolio
§ Stage 3 – Increase driven by increased impact of 3rd wave on MSE portfolio . Investments in Collections and recoveries continue.
Coverages HY 2019 FY2019 HY2020 FY2020 HY2021Total Impairment Coverage 9.2% 7.7% 8.1% 5.4% 5.4%Stage 3 coverage 109% 105% 103% 98% 92%
8680 8642 88099653 10506
515465 470
496 544
844 726 794590 684
HY2019 FY2019 HY2020 FY2020 HY2021
Gross Advances to customers in BWPm
Stage1 Stage2 Stage3
221 149232
214 208
98 9276
73 129
604 521 510291 294
HY2019 FY2019 HY2020 FY2020 HY2021
Expected Credit Losses (Provisions ) in BWPm
Stage1 Stage2 Stage3
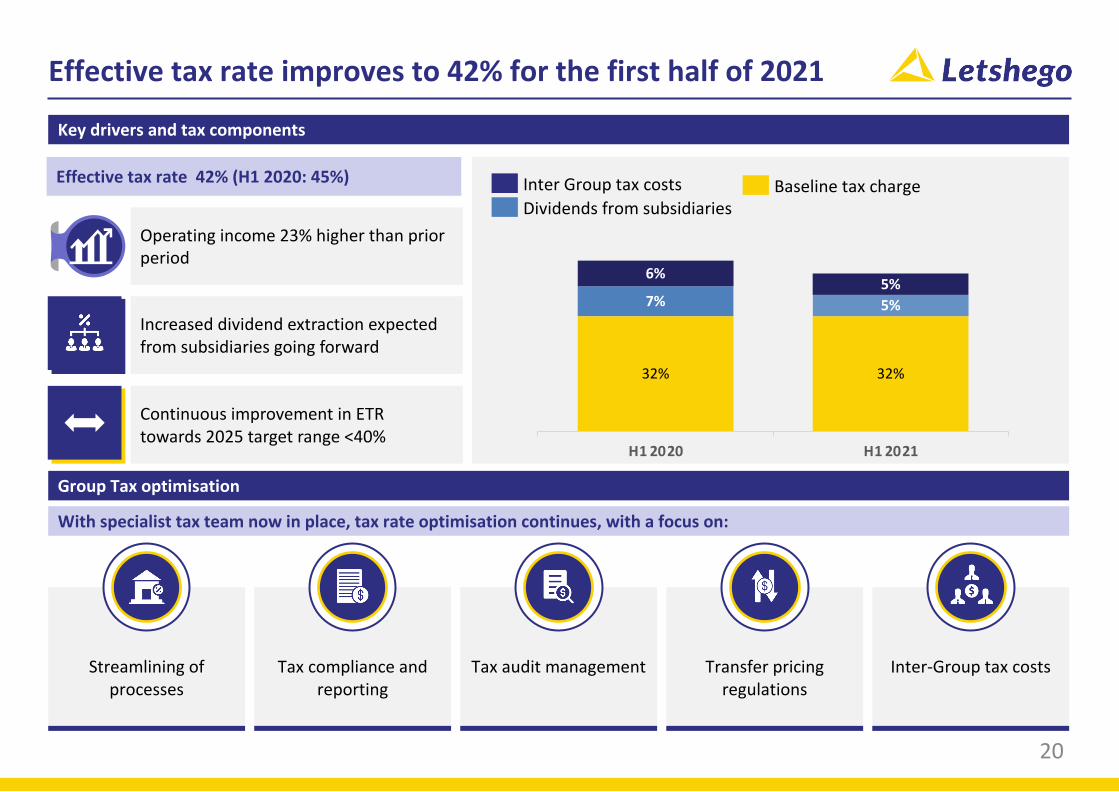
Effective tax rate improves to 42% for the first half of 2021
20
Key drivers and tax components
Effective tax rate 42% (H1 2020: 45%)
Operating income 23% higher than prior period
Increased dividend extraction expected from subsidiaries going forward
Continuous improvement in ETR towards 2025 target range <40%
Group Tax optimisation
With specialist tax team now in place, tax rate optimisation continues, with a focus on:
Streamlining of processes
Tax compliance and reporting
Tax audit management Transfer pricing regulations
Inter-Group tax costs
Dividends from subsidiariesInter Group tax costs Baseline tax charge
32% 32%
7% 5%
6%5%
H1 2020 H1 2021

Double digit Balance Sheet growth achieved in H1 2021
21
Total Assets Net Advances Customer deposits
Cost to income Loan loss ratio Return on equity
48%
47%
May 20
May 21
1,7%
1,5%
May 20
May 21
12%
13%
May 20
May 21
H1 2021:P13.3 bnH1 201: P10.6 bn
25%
H1 2021: P11.1 bnH1 2020: P 9.3 bn
20%
H1 2021: P989 mnH1 2020: P499 mn
98%
41%
49%
H1 2019
H1 2020
Cost to income Capital Adequacy Shareholder return
41%
49%
H1 2019
H1 2020
Cost to incomeDebt to Equity
H1 2021 interim dividend
H1 2020 interim dividend
7.3t
3.9t37%
34%
H1 2020
H1 2021
105%
119%
H1 2020
H1 2021

Balance Sheet Commentary
22
H12021
H2 2020
Change%
Cash and cash equivalent 1,006 624 61%
Net advances to customers 11,103 9,256 20%
Other Assets 1,230 767 60%
Total Assets 13,339 10,648 25%
Customer deposits 989 499 98%
Borrowings 5,858 4,809 22%
Other Liabilities 1,334 768 74%
Shareholders funds 4,722 4,219 12%
Non controlling interest 436 352 24%
Total Liabilities & Equity 13,339 10,648 25%
Return of assets 5% 5% -
Strong Cash and cash equivalents up 61% year on year depicting healthy cash flow and liquidity position
Net Advances to customers up 20% year on year driven by a 44% increase in net disbursements.
Customer deposits growth of 98% . Growth wastriggered by strengthening partnerships at institutionallevels, providing easier access to funds, and linkingsavings to loan solutions.
Shareholder funds strong at P4.7 billion and up 12% year on year.
Borrowings up 22% with strong pipeline and continued focus on changing the deposit mix and sourcing long term funding.
Key Messages

Asset Quality and Provisioning: Business remains resilient during C-19
23
§ Underlying asset quality remains resilient despite impact of 3rd wave on African economies
§ June 2021 impairment loan loss rate remains stable at 1.4% (Budget at 1.9%)with all Consumer Finance businesses now within 1% to 3% benchmark .
§ We continue to make investments to strengthen and improve collection and recoveries bench strength and strategy.
§ The Group PAR>90(Non Performing loans ) have improved to 5.6% from 7.9% in June2020
§ YTD impairment charge deteriorated slightly by 7% YOY .June20 at P70.9m verses June 21 at P75.7m.
§ Recoveries remain strong despite of impact of the 3rd covid wave on our subsidiaries and some countries invoking lockdowns therefore affecting our ability to collect on the MSE portfolio
§ Once off recoveries on mobile book leading to a write back of P105m in 2020 resulted in a loan loss rate of 0.3%. Normalized LLR at 1.8%
§ We Continue to automate credit decision and collection and recoveries processes.
Asset quality HY2021 FY2020 HY2020 FY2019 HY2019 FY2018 FY2017
Portfolio at risk – 90 days (NPL) 5.6% 5.3% 7.9% 6.9% 7.3% 7.1% 6.8%
Portfolio at risk – 30 days 8.7% 8.3% 11.2% 10.0% 10.6% 10.4% 9.9%
Non-performing loan coverage ratio 92.0% 98.0% 103.0% 112.0% 109.0% 115.0% 70.0%
Loan loss rate – actual 1.4% 0.3% 1.4% 1.7% 2.5% 4.1% 3.1%
Loan loss rate – excluding once-off items 1.9% 1.8% 1.4% 1.7% 2.5% 2.0% 2.5%

§ Group PAR 30 / PAR 90 remain around the benchmarks of 10% and 5% respectively notwithstanding restrictions to collections and recoveries related activities occasioned by Covid.
§ MSE portfolio still recovering from impact of 3rd wave and sectoral initiatives being taken to curb any further deterioration.
§ Portfolio adequately covered for future losses
§ Portfolio remains resilient
§ Increased Investments & focus on Collection & recoveries
Asset Quality (Segmental) : Our portfolios are holding strong against C-19 Headwinds
24

Deposit growth of 98% yoy contributing to lower cost of fundsDeposit values doubled to P989million in the first half (H1 2020; P499m)
25
22%
39%
34%
3% 1% 1%
Ghana Mozambique Namibia
Nigeria Tanzania Rwanda
Growing Deposits trends in P ‘ millions Country contribution to P 989 P’ millions
Deposit value growth YOY
98%
Grow Deposits
-
200 000 000
400 000 000
600 000 000
800 000 000
1 000 000 000
1 200 000 000Se
p-19
Nov
-19
Jan-
20
Mar
-20
May
-20
Jul-2
0
Sep-
20
Nov
-20
Jan-
21
Mar
-21
May
-21
VOL
IN P
ULA
H1 20: P 499
H1 21: P 989
Lower cost of customer deposits Grow the franchise
Costs decrease YOY2 percentage points
YOY 19%
694 273 108 504 New Customers

Our balance sheet profile is strengthening
26
External Funding Sources External Funding Sources
June 2020 June 2021
Security P’m
Secured (19%) 1,331
Unsecured (81%) 5,771
Total 7,102
Interest Profile P’m
Fixed (23%) 1,627
Floating (77%) 5,475
Total 7,102
§ Concluded P1.7bn of rollovers and new facilities
§ Significant progress in long term debt funding
§ Cash reserves on hand P1bn
Funding
§ Retail deposits increased by 37%
§ Corporate deposits increased by 172%
§ Deposit customers increased by 19%
Deposit Mobilisation
§ Ba3 (stable) outlook issuer rating affirmed by Moody’s
§ Ba2 Corporate Family Rating (CFR) assigned
Credit Rating
Debt Profile
1,658(23%)
2,660(37%)
1,795(25%)
989(14%)
BondsDepositsBankDFI
980 9
416986390
127
1,050
> 3 yrs1-3 yr
370
282
<1 yr
1,009 1,4830
2,790
1,427
2,885Security P’m
Secured (34%) 1,843
Unsecured (66%) 3,465
Total 5,308
Interest Profile P’m
Fixed (41%) 2,067
Floating (59%) 3,241
Total 5,308
Debt Profile
1,945(37%)
1,761(33%)
1,103(21%)
499(9%)
BankBonds DFI
Deposits
499 503 20758
818
784337
2,858
1-3 yr
1,238
<1 yr
343
08
> 3 yrs
1,604846

Capital Adequacy ratio Tier 1 Capital ratio Min. Core Capital
Country Regulatory Limit
Actual June 2021
Regulatory Limit
Actual Regulatory Limit (LCY’m)
Actual
Ghana 10% 12% 8% 12% 15 30.5Mozambique 12% 46.31% 80%* 85% 1,700 1,700Namibia 10% 63% 7% 60% Min 6% 55%Nigeria 10% 58% 10% 12% 2,000 3,698Rwanda 15% 37% 300 1,117Tanzania 14.5% 50% 15,000 15,096
§ All entities are within regulatory limits for Capital Adequacy.
§ All entities comply with Tier 1 Capital Ratios.§ Minimum core capital within the subsidiaries
are above limits.
Group Capital Position
§ Group maintains a CAR which is higher than minimum regulatory capital requirements
§ Subsidiaries adequately capitalised
Capital Adequacy Ratio
Regulated Entities Capital Position as at June 2021
36%
35%
34%
FY 2019
FY 2020
HY 2021
Capital allocation and Optimisation
§ Capital Allocation project concluded
§ Outcomes to be communicated as appropriate
Dividend Policy
Dividend payout Dividend yield
22%
40%
50%
FY 2019
FY 2020
H1 2021
11%
12%
17%
FY 2019
FY 2020
HY 2021*
Maintaining strong capital levels
27* - annualised

TRS (% change in share price + dividends) CAGR, in BWP, Percent CAGR
-4
28
15
10
3
-2
-23
-5
10
Peer 4
Letshego
Peer 1
Peer 4
Peer 2
Peer 3
BSE Index
Peer 5
OMSCI EmergingMarket index
5
-4
37
19
16
0
-3
-17
-4
8
9
-53
10
8
13
32
16
-52
-5
7
5
94
23
13
-12
-8
-15
-21
-10
24
-3
Apr 1st 2019 –Dec 31st 2019
Jan 1st 2015 –Mar 31st 2019Jan 1st 2015 – Current1 Jan 1st 2020 –
Current1
Peer average
Letshego’s returns since 2020 lead peers
281. As of Aug 16, 2021.CAGR for all periods greater than 1 year else actual returns usedSource: Capital IQ, Analyst reports

AGENDA
29
G R O U P I N T E R I M R E S U L T S 2 0 2 1
S T R A T E G I C O U T L O O K
§ Financial Performance§ Credit Overview§ Funding & Liquidity
Financial Highlights§ Headlines§ 6-2-5 roadmap§ Plan 2 progress
§ Economic and business outlook § Foundation for the future - LetsGO Mall§ 2025 Targets
Plan 2 and beyond...
H1 Headlines & Achievements

30
Business environment to remain challenging butexpected to rebound
IMF GDP Projections (August 2021)
Source: IMF GDP Forecast (August 2021)
1,0
0,9
-0,1
-0,2
-0,5
-1,8
-2,1
-3,3
-4,5
-7,2
-8,3
Rwanda
Ghana1
Uganda
Tanzania
Nigeria
Kenya
Mozambique
Eswatini
Lesotho
Namibia
Botswana
7,6
7,5
6,4
5,7
4,6
3,5
2,7
2,6
2,5
2,1
1,4
Ghana
Uganda
Botswana
Kenya
Rwanda
Lesotho
Tanzania
Namibia
Mozambique
Nigeria
Eswatini
-1,3
-1,9
-3,3
-4,1
-5,8
-6,6South America
North America
Africa (Region)
Asia and Pacific
World
Europe
7,3
6,1
6,0
4,9
4,4
4,3
North America
Asia and Pacific
Africa (Region)
World
South America
Europe
Real 2021 GDP growthAnnual percent change, %
Real 2020 GDP growthAnnual percent change, %
Real 2021 GDP growthAnnual percent change, %
Global GDP outlook
1. Ghana's own estimate per budget statement is 0.2%
Africa’s economic outlook
Real 2020 GDP growthAnnual percent change, %
Forecasted 2026 GDP growthAnnual percent change, %
6,4
6,1
6,1
5,5
5,4
5,3
3,9
3,2
2,5
2,3
2,2
Uganda
Lesotho
Rwanda
Botswana
Kenya
Tanzania
Ghana
Mozambique
Namibia
Eswatini
Nigeria

Navigating external factors and environments Responding to emerging environment through our 5 Conversations
EVOLVING MACRO
DYNAMICS
1 2
3
Battle for skills and talent
STRATEGIC TRANFORMATION
1
2
3
5
4
31

Lending
Saving
Payments
Insurance
Beyond Banking Ecosystem approach (Big Tech and FinTech )
Customer Journey
LETSGO MALL …….LetsGo FAST (Frictionless; Agile ; Simple & Timely)™
32
Ecosystem Partners ((MNO ; Com Com ; Agency)
§ One Data Lake§ RPA§ Predictive power§ Customer Data
intelligence
LetsGo Digital Mall Platform Digital Mall SquadsLetshego Digital Eagles
Customer Experience
§ Easy to Join § Easy to 1st Product
(Instant Wallet; Loans; Saving; insurance )
§ Easy to use & Fantastic to Stay Instant Rewards
§ Improving Lives
One API layer
BaaPAPI Based Stacks; HaaS;
(Digital Eagles App)Digital Services
API Market PlaceEcommerce; Merchants;
Beyond Banking
FinTech SolutionsBanking & Beyond
Banking

Robotics and Process Automation (RPAs) Implemented RPA to enhance LetsGo Mall Customer Expereince
33
LetsGo Mall Fast Turn around time Improved Customer satisfaction

Providing FAST access to the products on the LetsGo Mall
-Our Vision of the LetsGo Mall is to bring a World Class Retail financial services platform into the Hands of Africa’s underserved. Eg A, farmer in Funhaloro with LetsGoPay buys a machine in China and has it delivered to her, without her leaving the village.
34
Personal Loans (DAS)
Personal Loans (Non-DAS)
Life and Short-term insurance
Wallets; Cards and Remittances
Programmatic Loans
Scale Deposits
Beyond Financial Services: Lifestyle Partnerships

@letsgodigitalafrica
Building a digital community of African Doers, Shakers, Changers, Believers entrepreneurs (LetsGoprenuers) who are using their common energy to ‘get things done FAST’ to help ’improve lives’ for all.
Register

36
Insights informing our LetsGo Mall
Improved Operational efficiency (from >70% STP)+30%
Instant completion of LetsGo Mall registration for West Africa
>80%
CPO
LetsGo Mall Customer are new 77%
Africa estimated domestic payment size by 2025**
Payment Player growing faster than Bank
USD27bn
>40%Strong fundamental trend (shift away from cash, digitization...)*
Source: * McKinsey Global Payments Map; Central Bank data, Team analysis** McKinsey 2020 Global Payments Report

37#futurefit #digitalskills #transformation
squads working on digital platforms
new digital skills roles appointed
Empowering our people in digital
20
97% registration
4672 courses
2561digital
30

In summary…
38
“Digital is not a revolution, Digital is life”
Empowering our people to be Future Fit by embedding Agile digital culture and learning
Resilient business driving an uplift in PBT
Results means higher returns for shareholders
Improving lives by accelerating high social impact programs
Robotic deployment to increase operational efficiencies
Digital accelerated, and Business fundamentals are strong

Delivering on this roadmap will mean significantly transforming Letshego Group
39
Digital Mall … new ways of working PLAN 2 5 YEAR TARGETS
Agile ways of working embedded into the
organisation
pivot to a
Digital First organisation
people first cultureto sustain change
over time
1 millionEnterprise Active
Customers (EAC) by 2023On track strategic 80% by 2024
3 millionEnterprise Active
Customers (EAC) by 2025
75%Digitisation
On track strategic 80% by 2024
80%Digitisation
15%Return on Equity
On track strategic 20% by 2024
>20%Return on Equity
