letter (w/attachments) to lorenzo thantu, remedial project
TRANSCRIPT

URS
Januarys, 2001
Chief, NY Remediation BranchUnited States Environmental Protection Agency290 Broadway, 20th FloorNew York, New York 10007
Attn: Mr. Lorenzo Thantu
Re: Final Groundwater Flow and Solute Modeling Memorandum - AddendumContinued RI/FS Activities, Liberty Industrial Finishing SiteFarmingdale, Nassau County, New York
Dear Mr. Thantu:
This letter represents the Addendum to the "Final Groundwater Flow and Solute Modeling Memorandum,Liberty Industrial Finishing Site". The final memorandum was submitted on October 5, 2001, andsummarized the transient flow calibration and model configuration for the transport simulations of chromium,cadmium, and trichloroethene (TCE). Subsequent to the October 5, 2001 submittal, the U.S. EnvironmentalProtection Agency (EPA) communicated (via e-mail) to the Liberty Group the need for additional modelingoutput, as follows:
"We've reviewed URS' above-referenced final modeling report. We made oneobservation/concern (actually, that made by D&B, consultant to the Massapequa WaterDistrict) that although the report states in the "Summary of Model" on the first page that"overall, the model successfully predicts the extent and magnitude of chromium, cadmium,and TCE concentrations in the Upper Glacial andMagothy aquifers, " the Report does notprovide any illustration of predicted versus observed contaminant concentrations in theMagothy aquifer (i.e., in its associated plan view). EPA fully agrees with this comment, as itis the groundwater contamination in the Magothy aquifer that poses potential threat, if any,to downgradient water district (MWD and SFWD) supply well fields that is of greatestconcern to the MWD and SFWD commissioners and the community. And, EPA needs to beprepared to provide this info in detail at the upcoming make-up public meeting. To facilitateyour response to the above matter, I'd just request that a brief addendum to the 10/5/01 FinalGroundwater Flow and Solute Modeling Memorandum be prepared and submitted to EPAthat addresses the above-mentioned concern (supported by illustrations ofCd, Cr, and TCEfor a few depth intervals within the Upper Portion of the Magothy)
Therefore, this Addendum presents plan view maps of modeled constituent concentrations (trichloroethene,cadmium, and chromium) at two separate depths within the model framework. The chosen depths arecoincident with Layer 22 of the model (-100 to -150 ft msl, equivalent to approximately 150 to 200 ft belowground surface, near the Woodward Parkway Elementary School) and Layer 24 of the model (-200 to -300 ftmsl, equivalent to approximately -250 to -350 ft below ground surface, near the Woodward Parkway School).These layer intervals were chosen because they represent the upper and middle portion of the Magothy
aquifer, and, near the Woodward Parkway School, coincide with the maximum depth where potentially site-related constituents were observed (Layer 22 - TCE only, cadmium and chromium were generally not observedto bffipsaseafetswithin the Magothy aquifer at concentrations greater than the relevant criteria).
2325 Maryland Road, 2nd FloorWillow Grove, PA 19090Tel: 215.657.5000Fax: 215.657.5454
306125

Mr. Lorenzo ThantuUSEPA-Region IIJanuary 4, 2001Page -2-
For each layer and each constituent, model outputs were prepared for the Year 2000 and the Year 2010. Alloutputs were prepared absent any on-site or off-site groundwater remediation.
Thus the following figures are included in this Addendum:
Figure 1A Layer 22 (-100 to -150 ft msl) - Magothy aquifer - Year 2000 TCEFigure IB Layer 22 (-100 to -150 ft msl) - Magothy aquifer - Year 2010 TCEFigure 1C Layer 24 (-200 to -300 ft msl) - Magothy aquifer - Year 2000 TCEFigure ID Layer 24 (-200 to -300 ft msl) - Magothy aquifer - Year 2010 TCE
Figure 2A Layer 22 (-100 to -150 ft msl) - Magothy aquifer - Year 2000 CadmiumFigure 2B Layer 22 (-100 to-150 ft msl)-Magothy aquifer-Year 2010 CadmiumFigure 2C Layer 24 (-200 to -300 ft msl) - Magothy aquifer - Year 2000 CadmiumFigure 2D Layer 24 (-200 to -300 ft msl) - Magothy aquifer - Year 2010 Cadmium
Figure 3A Layer 22 (-100 to -150 ft msl) - Magothy aquifer - Year 2000 ChromiumFigure 3B Layer 22 (-100 to -150 ft msl) - Magothy aquifer - Year 2010 ChromiumFigure 3C Layer 24 (-200 to -300 ft msl) - Magothy aquifer - Year 2000 ChromiumFigure 3D Layer 24 (-200 to -300 ft msl) - Magothy aquifer - Year 2010 Chromium
The figures contain modeled concentration contours to the relevant regulatory concentration limit (i.e., thelowest concentration contour for TCE is 0.005 mg/L, etc.)
The output figures in this Addendum clearly show that the model does not predict chromium and cadmium tobe present in Layer 22 or 24 of the Magothy aquifer at concentrations greater than the relevant criteria (0.005mg/L for cadmium, and 0.05 mg/L for chromium). This is consistent with the field data derived from deepmonitoring wells screened within the Magothy aquifer.
TCE is modeled to be present in Layer 22 and 24 of the Magothy aquifer at concentrations greater than therelevant criteria (0.005 mg/L). The modeled concentrations in Layer 22 near monitoring well cluster MW-11(Woodward Parkway School) are consistent with field observations; however, the model appears to over-predict the downgradient progress of the TCE plume (for example, the field data do not indicate the presenceof TCE in well MW-9D, yet the model predicts low concentrations of TCE at that location). Importantly, thewithdrawal from supply wells operated by the South Farmingdale Water District and the Massapequa WaterDistrict to the south of the Southern State Parkway does not influence the predicted migration of thegroundwater TCE plume. The water table and analytical data presented in the July 20,2000 CRI Report areconsistent with this modeled behavior of the groundwater TCE plume.
2325 Maryland Road - Willow Grove, Pennsylvania 19090 - (215)657-5000 - Fax:(215)657-5454
306126
Mr. Lorenzo ThantuUSEPA - Region IIJanuary 4,2001Page-3-
Please contact Mr. Matthias Ohr at (215) 830-2068 if you have any questions regarding the informationpresented in this letter.
Sincerely,URS CORPORATION
Matthias OhrProject Manager
Enclosures (Figures 1A through 3D)
MO:moK:\Liberty_35S50\Uberty CR1-FS\AGENCY\11-13-00 transport model_letter.doc
cc: Mr. Joe Wheatley (The BFGoodrich Company)Ms. Tracey Salmon-Smith (U.S. Attorney's Office)H2M Group (Mr. Loesch)Dvirka & Bartilucci (Mr. Maher)
2325 Maryland Road - Willow Grove, Pennsylvania 19090 - (215)657-5000 - Fax:(215)657-5454 —-
306127

Figure 1A
Layer 22 (-100 to -150 ft msl) - Magothy Aquifer - Year 2000 TCE
306128

Figure IB
Layer 22 (-100 to -150 ft msl) - Magothy Aquifer - Year 2010 TCE
306129

Figure 1C
Layer 24(-200 to -300 ft msl) - Magothy Aquifer - Year 2000 TCE
306130

Figure ID
Layer 24(-200 to -300 ft msl) - Magothy Aquifer - Year 2010 TCE
306131
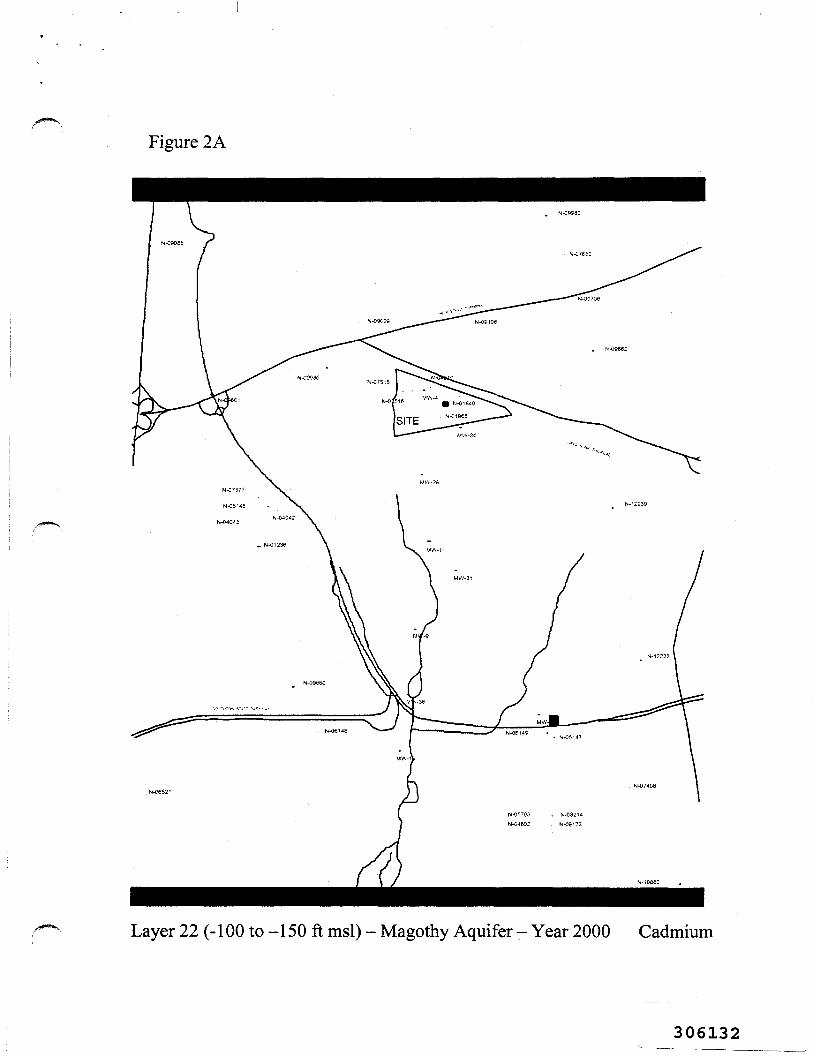
Figure 2A
Layer 22 (-100 to -150 ft msl) - Magothy Aquifer - Year 2000 Cadmium
306132

Figure 2B
Layer 22 (-100 to -150 ft msl) - Magothy Aquifer - Year 2010 Cadmium
306133
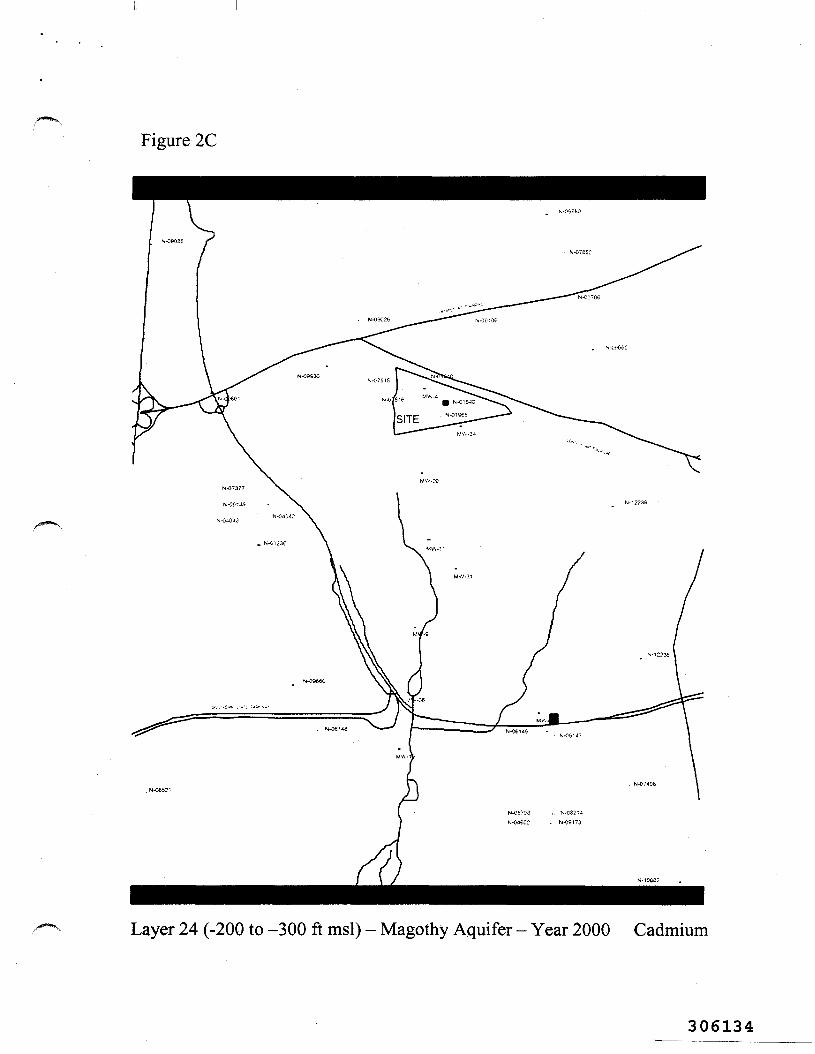
Figure 2C
/*—N
Layer 24 (-200 to -300 ft msl) - Magothy Aquifer - Year 2000 Cadmium
306134
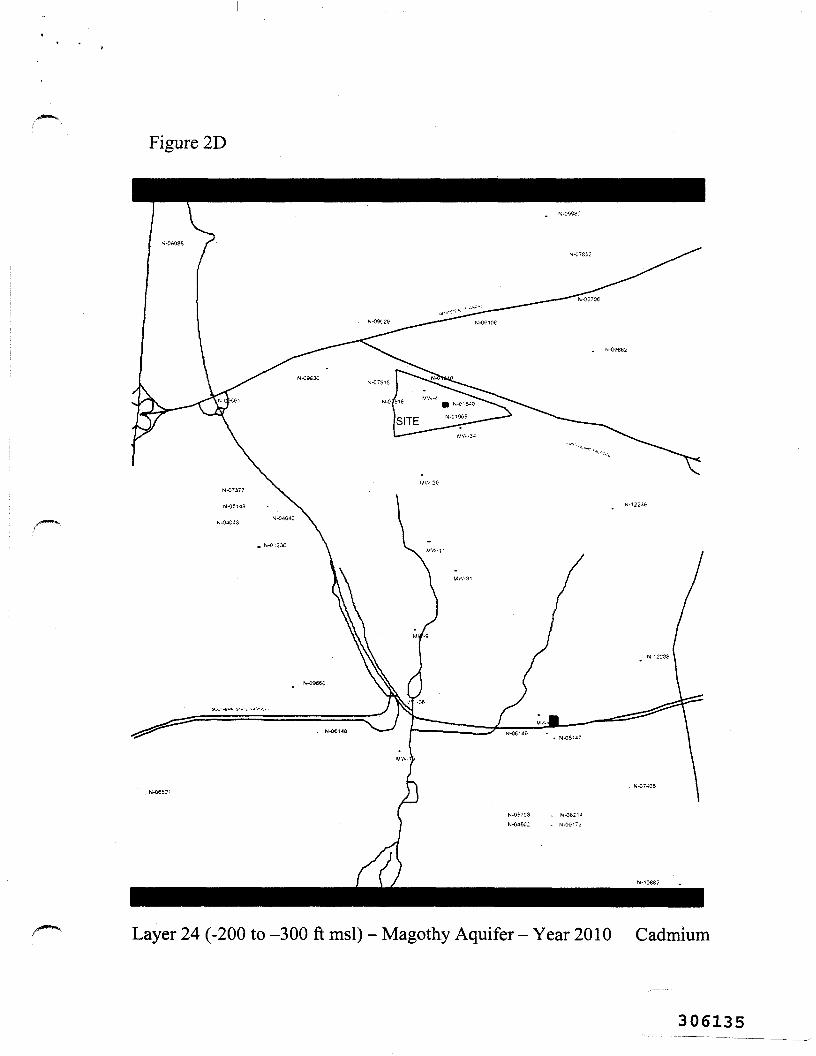
Figure 2D
Layer 24 (-200 to -300 ft msl) - Magothy Aquifer - Year 2010 Cadmium
306135

Figure 3A
Layer 22 (-100 to -150 ft msl) - Magothy Aquifer - Year 2000 Chromium
306136

Figure 3B
Layer 22 (-100 to -150 ft msl) - Magothy Aquifer - Year 2010 Chromium
306137

Figure SC
/"•"•"•v Layer 24 (-200 to -300 ft msl) - Magothy Aquifer - Year 2000 Chromium
306138

Figure 3D
Layer 24 (-200 to -300 ft msl) - Magothy Aquifer - Year 2010 Chromium
306139