leukodystrophy in children: a pictorial review of mr
TRANSCRIPT

EDUCATION EXHIBIT 461
Leukodystrophy in Children: A Pictorial Review of MR Imaging Features1
CME FEATURE See accompanying
test at http:// www.rsna.org
/education /rg_cme.html
LEARNING OBJECTIVES FOR TEST 1 After reading this article and taking the test, the reader
will be able to:
� Recognize the important MR imaging features of leukodystrophy in children.
� Describe the important clinical, biochemical, and pathologic features of leukodystrophy in children.
� Develop a frame-work for making the appropriate diagnosis of leukodystrophy in children.
Jung-Eun Cheon, MD2 ● In-One Kim, MD ● Yong Seung Hwang, MDKi Joong Kim, MD ● Kyu-Chang Wang, MD ● Byung-Kyu Cho, MDJe Geun Chi, MD ● Chong Jai Kim, MD ● Woo Sun Kim, MDKyung Mo Yeon, MD
Dysmyelinating diseases, or leukodystrophies, encompass a wide spectrum of inherited neurodegenerative disorders affecting the integrity of myelin in the brain and peripheral nerves. Most of these disorders fall into one of three categories—lysosomal storage diseases, peroxisomal disorders, and diseases caused by mitochondrial dysfunction—and each leukodystrophy has distinctive clinical, biochemical, pathologic, and radiologic features. Magnetic resonance (MR) imaging has be-come the primary imaging modality in patients with leukodystrophy and plays an important role in the identification, localization, and characterization of underlying white matter abnormalities in affected patients. MR imaging has also been extensively used to monitor the natural progression of various white matter disorders and the response to therapy. Although the MR imaging features of leukodystrophy are of-ten nonspecific, systematic analysis of the finer details of disease involvement may permit a narrower differential diagnosis, which the clinician can then further refine with knowledge of patient history, clinical testing, and metabolic analysis. ©RSNA, 2002
Abbreviations: ALD � adrenoleukodystrophy, MELAS � myopathy, encephalopathy, lactic acidosis, and strokelike episodes, PMD � Pelizaeus-Merzbacher disease
Index terms: Brain, diseases, 10.873 ● Brain, MR, 10.1214 ● Brain, white matter, 10.873 ● Children, central nervous system, 10.873
RadioGraphics 2002; 22:461–476
1From the Departments of Radiology (J.E.C., I.O.K., W.S.K., K.M.Y.), Pediatrics (Y.S.H., K.J.K.), Neurosurgery (K.C.W., B.K.C.), and Pathology (J.G.C., C.J.K.), Seoul National University College of Medicine, 28 Yongon-dong, Chongno-gu, Seoul 110-744, Korea. Presented as an education exhibit at the 2000 RSNA scientific assembly. Received May 16, 2001; revision requested July 5 and received August 15; accepted August 15. Ad-dress correspondence to I.O.K. (e-mail: [email protected]).
2Current address: Department of Radiology, Seoul Municipal Boramae Hospital, Seoul, Korea.
©RSNA, 2002

462 May-June 2002 RG f Volume 22 ● Number 3
Introduction Table 1 White matter diseases in children are traditionally Classification of Leukodystrophies on the divided into two categories: dysmyelinating dis- Basis of Organelle Disordereases and demyelinating diseases (1,2). Dysmyeli-
Lysosomal storage diseases with white matter innating diseases, also known as leukodystrophies, volvementresult from an inherited enzyme deficiency that Metachromatic leukodystrophycauses abnormal formation, destruction, or turn- Krabbe disease (globoid cell leukodystrophy)over of myelin. Demyelinating diseases involve Niemann-Pick diseasedestruction of intrinsically normal myelin. Fabry disease
Recent classification schemes have emphasized GM1 gangliosidosis the role of enzyme defects and organelle dysfunc- GM2 gangliosidosis tion in the pathogenesis of many metabolic disor- Mucopolysaccharidosis
ders that affect the central nervous system. These Fucosidosis
neurodegenerative disorders are primarily subdi- Mucolipidosis
vided into lysosomal, peroxisomal, and mitochon- Wolmann disease and cholesterol ester storage disease
drial diseases (Table 1) (2,3). Ceroid lipofuscinosisIn this study, we discuss leukodystrophies in Peroxisomal disorders
terms of their clinical manifestations, biochemical Zellweger syndromefeatures, and magnetic resonance (MR) imaging X-linked adrenoleukodystrophy (ALD) characteristics. We focus on the MR imaging fea- Neonatal ALD tures of some of the more common and important Pseudoneonatal ALD leukodystrophies, which were diagnosed with Classic Refsum disease metabolic analysis, clinical testing, or pathologic Hyperpipecolic acidemia
analysis. We discuss and illustrate these features Cerebrotendinous xanthomatosis
with emphasis on lesion location, mode and di- Abetalipoproteinemia
rection of extension, pattern of contrast material Rhizomelic chondrodysplasia calcificans punctata
enhancement, and changes at follow-up imaging. Mitochondrial dysfunction with leukoencephalop
athy Leigh disease
Lysosomal Storage Diseases Myopathy, encephalopathy, lactic acidosis, and Lysosomes are membrane-bound cell organelles strokelike episodes (MELAS syndrome)
that contain a variety of hydrolytic enzymes and Myoclonus epilepsy with ragged red fibers
aid in the digestion of phagocytosed particles. (MERRF syndrome)
When the activity of a specific lysosomal enzyme Kearns-Sayre syndrome
is deficient, a lysosomal storage disorder may re- Disorders of amino acid and organic acid metabolism
sult. These disorders are classified according to Canavan disease what materials show abnormal accumulation in White matter disorders with unknown metabolic defectthe lysosomes (eg, sphingolipidosis, glycopro- Pelizaeus-Merzbacher disease (PMD)teinosis, mucopolysaccharidosis, mucolipidosis) Alexander disease(2). The underlying disorder may be diagnosed Congenital muscular dystrophy (Fukuyama type)clinically with assay for the enzyme deficiency orabnormal accumulation of material.
Metachromatic Leukodystrophy Metachromatic leukodystrophy is an autosomal recessive disorder caused by a deficiency of the lysosomal enzyme arylsulfatase A (4–8). This
RG f Volume 22 ● Number 3 Cheon et al 463
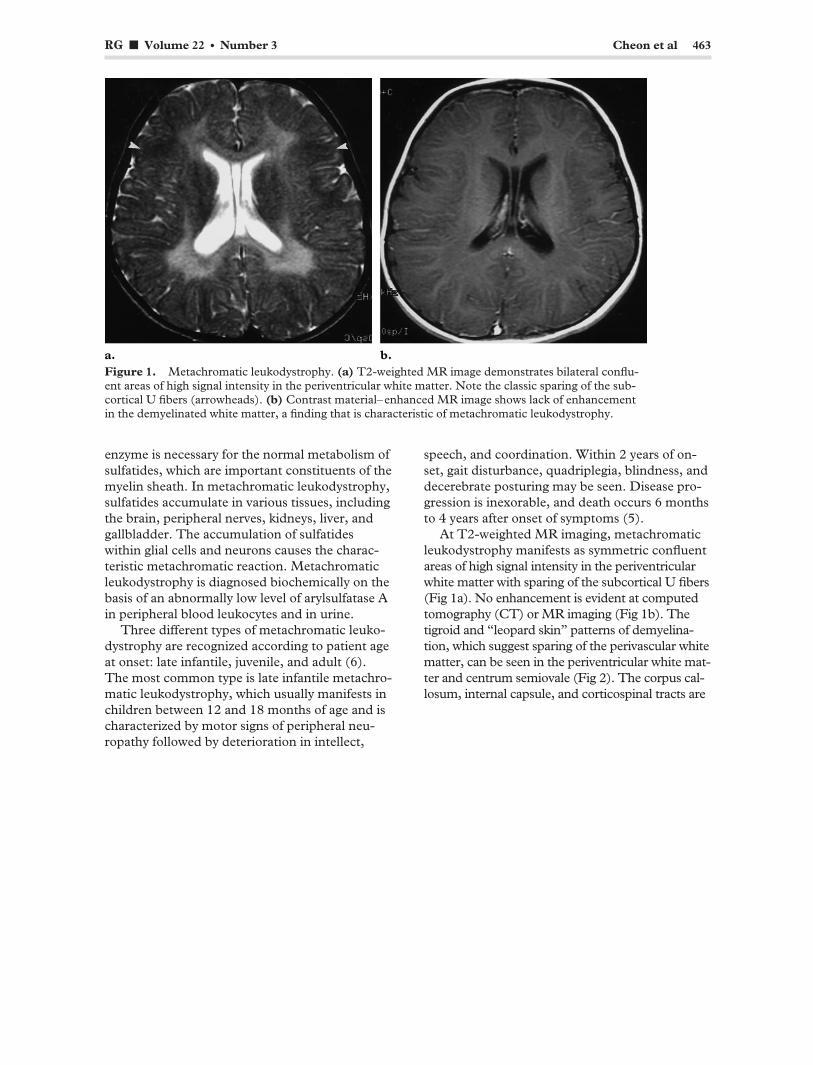
Figure 1. Metachromatic leukodystrophy. (a) T2-weighted MR image demonstrates bilateral confluent areas of high signal intensity in the periventricular white matter. Note the classic sparing of the sub-cortical U fibers (arrowheads). (b) Contrast material–enhanced MR image shows lack of enhancement in the demyelinated white matter, a finding that is characteristic of metachromatic leukodystrophy.
enzyme is necessary for the normal metabolism of sulfatides, which are important constituents of the myelin sheath. In metachromatic leukodystrophy, sulfatides accumulate in various tissues, including the brain, peripheral nerves, kidneys, liver, and gallbladder. The accumulation of sulfatides within glial cells and neurons causes the characteristic metachromatic reaction. Metachromatic leukodystrophy is diagnosed biochemically on the basis of an abnormally low level of arylsulfatase A in peripheral blood leukocytes and in urine.
Three different types of metachromatic leukodystrophy are recognized according to patient age at onset: late infantile, juvenile, and adult (6). The most common type is late infantile metachromatic leukodystrophy, which usually manifests in children between 12 and 18 months of age and is characterized by motor signs of peripheral neuropathy followed by deterioration in intellect,
speech, and coordination. Within 2 years of on-set, gait disturbance, quadriplegia, blindness, and decerebrate posturing may be seen. Disease progression is inexorable, and death occurs 6 months to 4 years after onset of symptoms (5).
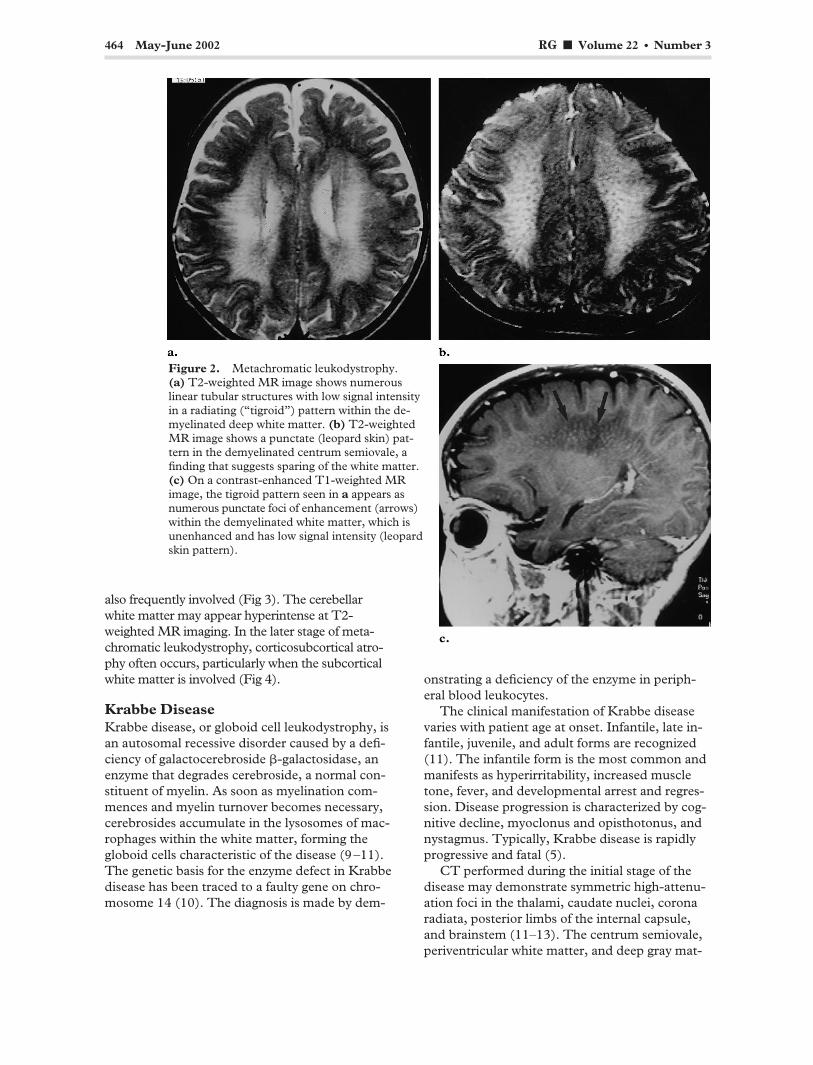
At T2-weighted MR imaging, metachromatic leukodystrophy manifests as symmetric confluent areas of high signal intensity in the periventricular white matter with sparing of the subcortical U fibers (Fig 1a). No enhancement is evident at computed tomography (CT) or MR imaging (Fig 1b). The tigroid and “leopard skin” patterns of demyelination, which suggest sparing of the perivascular white matter, can be seen in the periventricular white matter and centrum semiovale (Fig 2). The corpus callosum, internal capsule, and corticospinal tracts are
464 May-June 2002 RG f Volume 22 ● Number 3
Figure 2. Metachromatic leukodystrophy. (a) T2-weighted MR image shows numerous linear tubular structures with low signal intensity in a radiating (“tigroid”) pattern within the demyelinated deep white matter. (b) T2-weighted MR image shows a punctate (leopard skin) pat-tern in the demyelinated centrum semiovale, a finding that suggests sparing of the white matter. (c) On a contrast-enhanced T1-weighted MR image, the tigroid pattern seen in a appears as numerous punctate foci of enhancement (arrows) within the demyelinated white matter, which is unenhanced and has low signal intensity (leopard skin pattern).
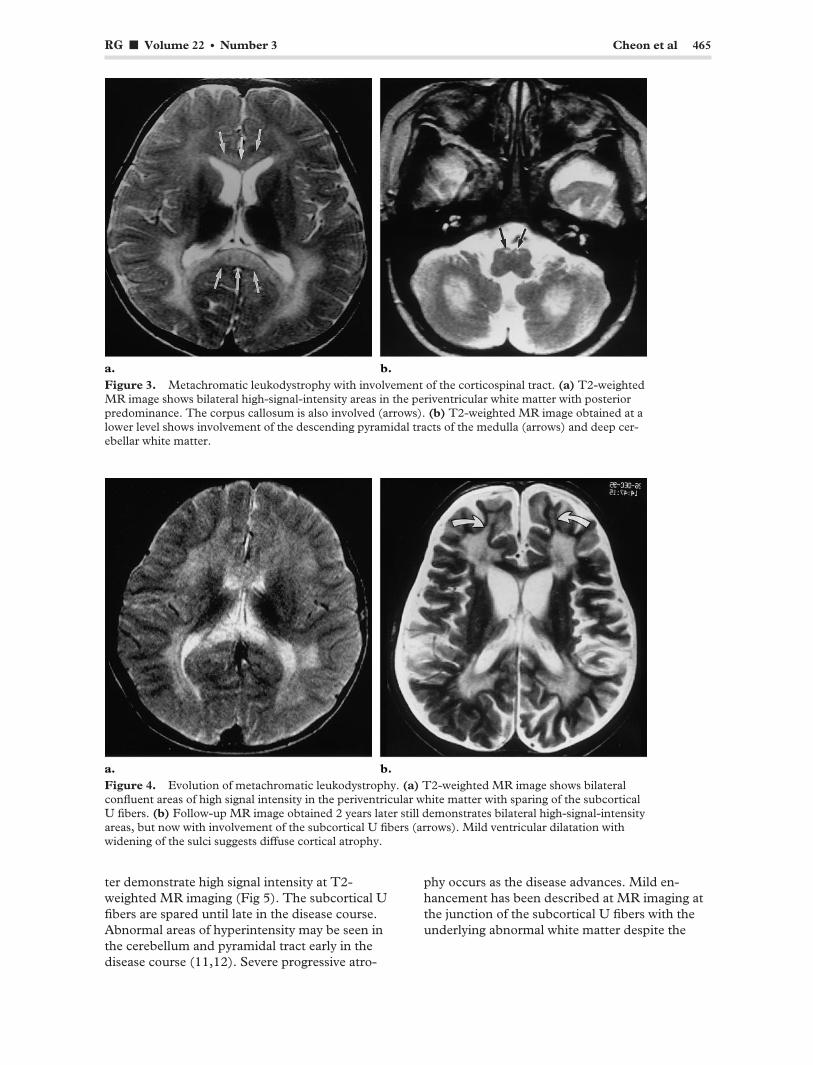
also frequently involved (Fig 3). The cerebellar white matter may appear hyperintense at T2-weighted MR imaging. In the later stage of metachromatic leukodystrophy, corticosubcortical atrophy often occurs, particularly when the subcortical white matter is involved (Fig 4).
Krabbe Disease Krabbe disease, or globoid cell leukodystrophy, is an autosomal recessive disorder caused by a deficiency of galactocerebroside �-galactosidase, an enzyme that degrades cerebroside, a normal constituent of myelin. As soon as myelination commences and myelin turnover becomes necessary, cerebrosides accumulate in the lysosomes of macrophages within the white matter, forming the globoid cells characteristic of the disease (9–11). The genetic basis for the enzyme defect in Krabbe disease has been traced to a faulty gene on chromosome 14 (10). The diagnosis is made by dem
onstrating a deficiency of the enzyme in peripheral blood leukocytes.
The clinical manifestation of Krabbe disease varies with patient age at onset. Infantile, late infantile, juvenile, and adult forms are recognized (11). The infantile form is the most common and manifests as hyperirritability, increased muscle tone, fever, and developmental arrest and regression. Disease progression is characterized by cognitive decline, myoclonus and opisthotonus, and nystagmus. Typically, Krabbe disease is rapidly progressive and fatal (5).
CT performed during the initial stage of the disease may demonstrate symmetric high-attenuation foci in the thalami, caudate nuclei, corona radiata, posterior limbs of the internal capsule, and brainstem (11–13). The centrum semiovale, periventricular white matter, and deep gray mat-
RG f Volume 22 ● Number 3 Cheon et al 465
Figure 3. Metachromatic leukodystrophy with involvement of the corticospinal tract. (a) T2-weighted MR image shows bilateral high-signal-intensity areas in the periventricular white matter with posterior predominance. The corpus callosum is also involved (arrows). (b) T2-weighted MR image obtained at a lower level shows involvement of the descending pyramidal tracts of the medulla (arrows) and deep cerebellar white matter.
Figure 4. Evolution of metachromatic leukodystrophy. (a) T2-weighted MR image shows bilateral confluent areas of high signal intensity in the periventricular white matter with sparing of the subcortical U fibers. (b) Follow-up MR image obtained 2 years later still demonstrates bilateral high-signal-intensity areas, but now with involvement of the subcortical U fibers (arrows). Mild ventricular dilatation with widening of the sulci suggests diffuse cortical atrophy.
ter demonstrate high signal intensity at T2-weighted MR imaging (Fig 5). The subcortical U fibers are spared until late in the disease course. Abnormal areas of hyperintensity may be seen in the cerebellum and pyramidal tract early in the disease course (11,12). Severe progressive atro
phy occurs as the disease advances. Mild enhancement has been described at MR imaging at the junction of the subcortical U fibers with the underlying abnormal white matter despite the
466 May-June 2002 RG f Volume 22 ● Number 3
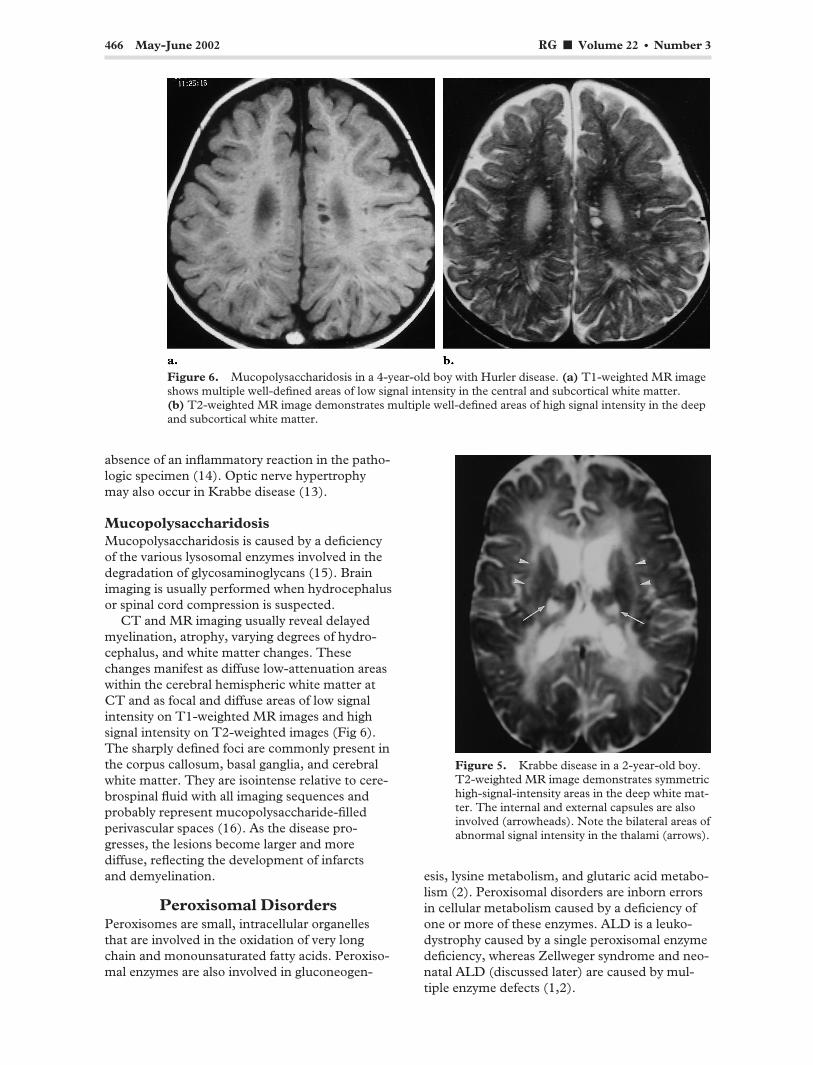
Figure 6. Mucopolysaccharidosis in a 4-year-old boy with Hurler disease. (a) T1-weighted MR image shows multiple well-defined areas of low signal intensity in the central and subcortical white matter. (b) T2-weighted MR image demonstrates multiple well-defined areas of high signal intensity in the deep and subcortical white matter.
absence of an inflammatory reaction in the pathologic specimen (14). Optic nerve hypertrophy may also occur in Krabbe disease (13).
Mucopolysaccharidosis Mucopolysaccharidosis is caused by a deficiency of the various lysosomal enzymes involved in the degradation of glycosaminoglycans (15). Brain imaging is usually performed when hydrocephalus or spinal cord compression is suspected.
CT and MR imaging usually reveal delayed myelination, atrophy, varying degrees of hydrocephalus, and white matter changes. These changes manifest as diffuse low-attenuation areas within the cerebral hemispheric white matter at CT and as focal and diffuse areas of low signal intensity on T1-weighted MR images and high signal intensity on T2-weighted images (Fig 6). The sharply defined foci are commonly present in the corpus callosum, basal ganglia, and cerebral white matter. They are isointense relative to cerebrospinal fluid with all imaging sequences and probably represent mucopolysaccharide-filled perivascular spaces (16). As the disease progresses, the lesions become larger and more diffuse, reflecting the development of infarcts and demyelination.
Peroxisomal Disorders Peroxisomes are small, intracellular organelles that are involved in the oxidation of very long chain and monounsaturated fatty acids. Peroxisomal enzymes are also involved in gluconeogen-
Figure 5. Krabbe disease in a 2-year-old boy. T2-weighted MR image demonstrates symmetric high-signal-intensity areas in the deep white matter. The internal and external capsules are also involved (arrowheads). Note the bilateral areas of abnormal signal intensity in the thalami (arrows).
esis, lysine metabolism, and glutaric acid metabolism (2). Peroxisomal disorders are inborn errors in cellular metabolism caused by a deficiency of one or more of these enzymes. ALD is a leukodystrophy caused by a single peroxisomal enzyme deficiency, whereas Zellweger syndrome and neonatal ALD (discussed later) are caused by multiple enzyme defects (1,2).
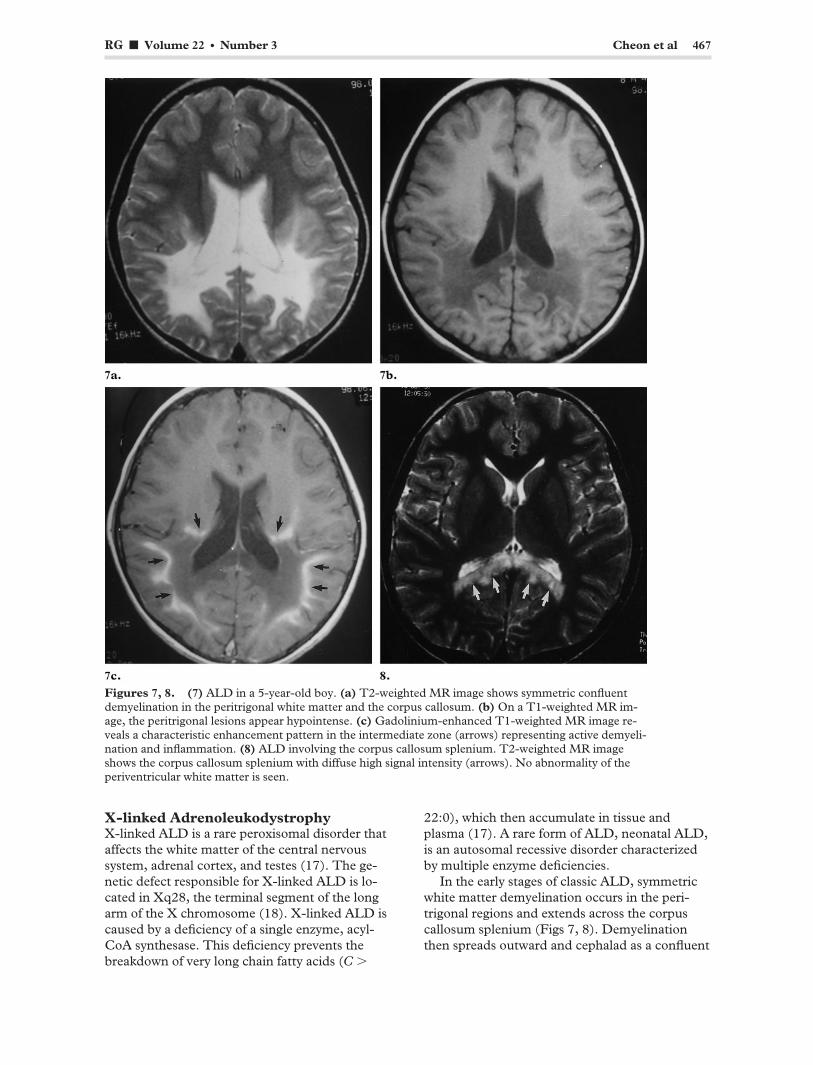
RG f Volume 22 ● Number 3 Cheon et al 467
Figures 7, 8. (7) ALD in a 5-year-old boy. (a) T2-weighted MR image shows symmetric confluent demyelination in the peritrigonal white matter and the corpus callosum. (b) On a T1-weighted MR image, the peritrigonal lesions appear hypointense. (c) Gadolinium-enhanced T1-weighted MR image reveals a characteristic enhancement pattern in the intermediate zone (arrows) representing active demyelination and inflammation. (8) ALD involving the corpus callosum splenium. T2-weighted MR image shows the corpus callosum splenium with diffuse high signal intensity (arrows). No abnormality of the periventricular white matter is seen.
X-linked Adrenoleukodystrophy X-linked ALD is a rare peroxisomal disorder that affects the white matter of the central nervous system, adrenal cortex, and testes (17). The genetic defect responsible for X-linked ALD is located in Xq28, the terminal segment of the long arm of the X chromosome (18). X-linked ALD is caused by a deficiency of a single enzyme, acyl-CoA synthesase. This deficiency prevents the breakdown of very long chain fatty acids (C �
22:0), which then accumulate in tissue and plasma (17). A rare form of ALD, neonatal ALD, is an autosomal recessive disorder characterized by multiple enzyme deficiencies.
In the early stages of classic ALD, symmetric white matter demyelination occurs in the peritrigonal regions and extends across the corpus callosum splenium (Figs 7, 8). Demyelination then spreads outward and cephalad as a confluent
468 May-June 2002 RG f Volume 22 ● Number 3
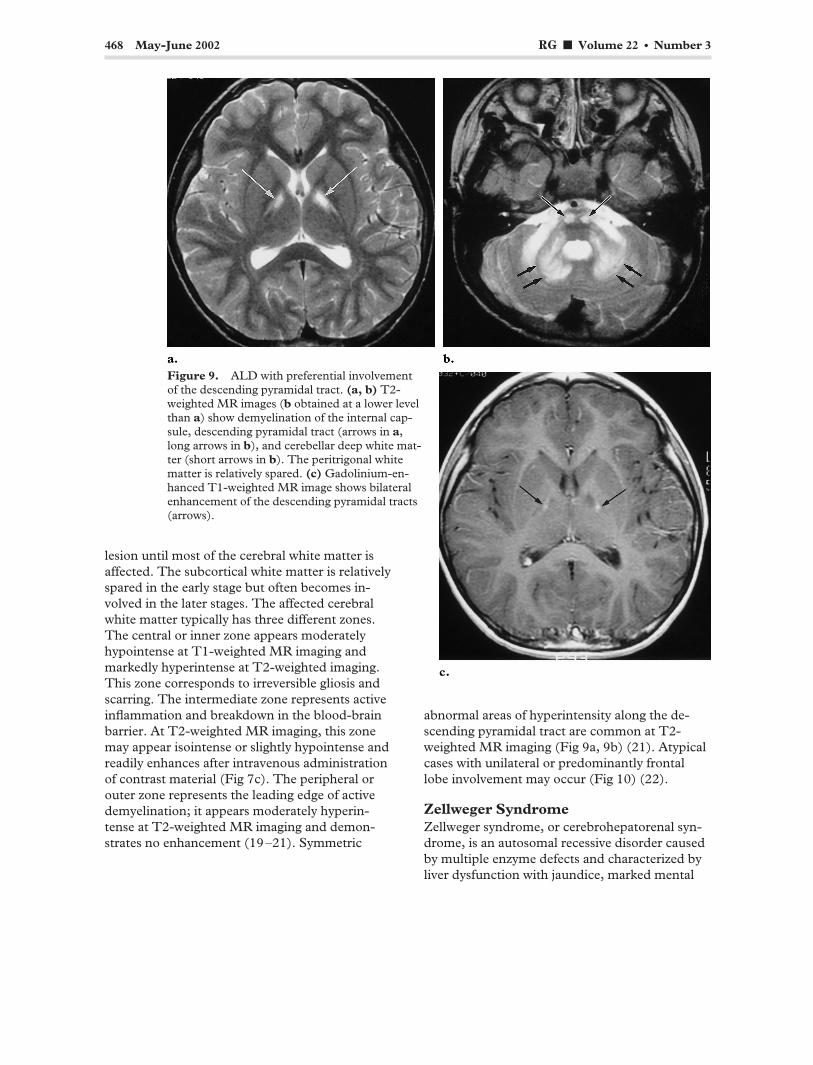
Figure 9. ALD with preferential involvement of the descending pyramidal tract. (a, b) T2-weighted MR images (b obtained at a lower level than a) show demyelination of the internal capsule, descending pyramidal tract (arrows in a, long arrows in b), and cerebellar deep white matter (short arrows in b). The peritrigonal white matter is relatively spared. (c) Gadolinium-enhanced T1-weighted MR image shows bilateral enhancement of the descending pyramidal tracts (arrows).
lesion until most of the cerebral white matter is affected. The subcortical white matter is relatively spared in the early stage but often becomes involved in the later stages. The affected cerebral white matter typically has three different zones. The central or inner zone appears moderately hypointense at T1-weighted MR imaging and markedly hyperintense at T2-weighted imaging. This zone corresponds to irreversible gliosis and scarring. The intermediate zone represents active inflammation and breakdown in the blood-brain barrier. At T2-weighted MR imaging, this zone may appear isointense or slightly hypointense and readily enhances after intravenous administration of contrast material (Fig 7c). The peripheral or outer zone represents the leading edge of active demyelination; it appears moderately hyperintense at T2-weighted MR imaging and demonstrates no enhancement (19–21). Symmetric
abnormal areas of hyperintensity along the descending pyramidal tract are common at T2-weighted MR imaging (Fig 9a, 9b) (21). Atypical cases with unilateral or predominantly frontal lobe involvement may occur (Fig 10) (22).
Zellweger Syndrome Zellweger syndrome, or cerebrohepatorenal syndrome, is an autosomal recessive disorder caused by multiple enzyme defects and characterized by liver dysfunction with jaundice, marked mental

RG f Volume 22 ● Number 3 Cheon et al 469
Figure 10. Atypical ALD. (a) T2-weighted MR image shows involvement predominantly of the frontal lobe white matter, genu of the corpus callosum, and anterior limbs of the internal capsule (arrows). (b) Gadolinium-enhanced T1-weighted MR image shows linear enhancement within the involved white matter and the anterior limbs of the internal capsule (arrows).
Figure 11. Zellweger syndrome in a 5-month-old girl. (a) T2-weighted MR image shows extensive areas of diffuse high signal intensity in the white matter. The gyri are broad, the sulci are shallow, and there is incomplete branching of the subcortical white matter, findings that suggest a migration anomaly with pachygyria. (b) On a T1-weighted MR image, the white matter abnormalities demonstrate low signal intensity.
retardation, weakness, hypotonia, and craniofacial dysmorphism (23). It may lead to death in early childhood. The severity of disease varies and is determined by the degree of peroxisomal activity. Ultrasonography of the kidneys reveals small cortical cysts.
MR imaging reveals diffuse demyelination with abnormal gyration that is most severe in the perisylvian and perirolandic regions (Fig 11). The pattern of gyral abnormality is similar to that seen in polymicrogyria or pachygyria.
470 May-June 2002 RG f Volume 22 ● Number 3
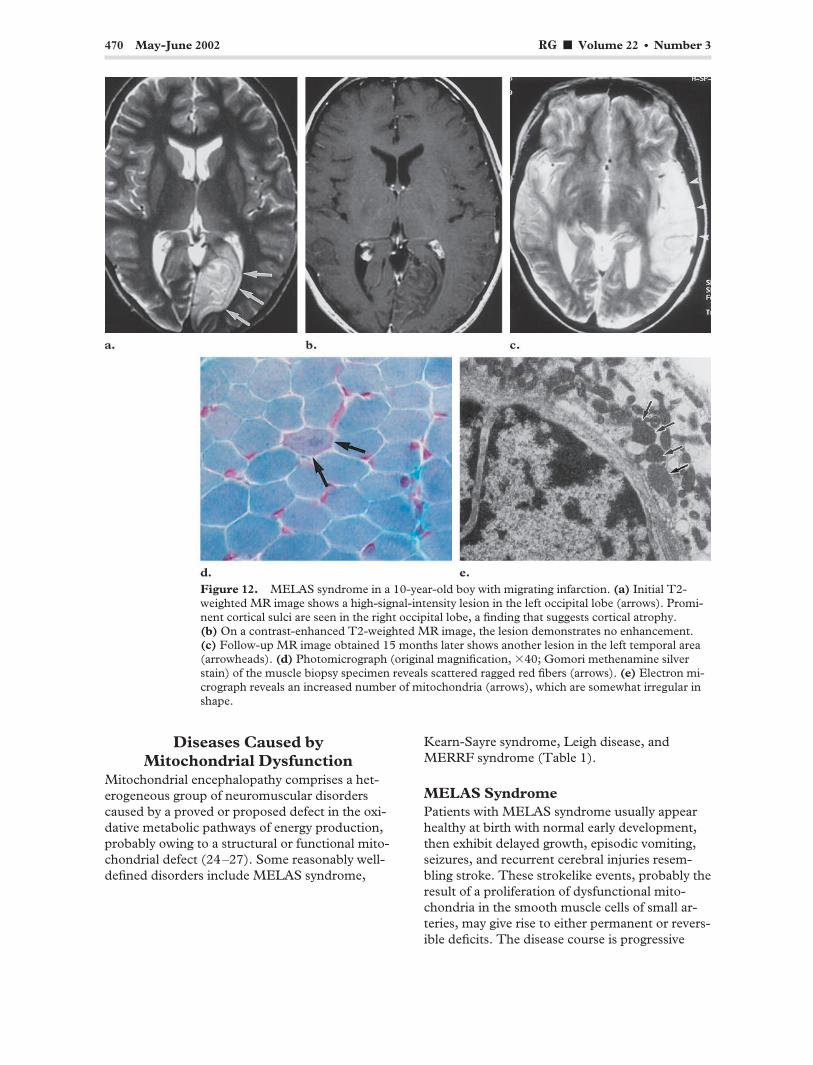
Figure 12. MELAS syndrome in a 10-year-old boy with migrating infarction. (a) Initial T2-weighted MR image shows a high-signal-intensity lesion in the left occipital lobe (arrows). Prominent cortical sulci are seen in the right occipital lobe, a finding that suggests cortical atrophy. (b) On a contrast-enhanced T2-weighted MR image, the lesion demonstrates no enhancement. (c) Follow-up MR image obtained 15 months later shows another lesion in the left temporal area (arrowheads). (d) Photomicrograph (original magnification, �40; Gomori methenamine silver stain) of the muscle biopsy specimen reveals scattered ragged red fibers (arrows). (e) Electron micrograph reveals an increased number of mitochondria (arrows), which are somewhat irregular in shape.
Diseases Caused by Mitochondrial Dysfunction
Mitochondrial encephalopathy comprises a heterogeneous group of neuromuscular disorders caused by a proved or proposed defect in the oxidative metabolic pathways of energy production, probably owing to a structural or functional mitochondrial defect (24–27). Some reasonably well-defined disorders include MELAS syndrome,
Kearn-Sayre syndrome, Leigh disease, and MERRF syndrome (Table 1).
MELAS Syndrome Patients with MELAS syndrome usually appear healthy at birth with normal early development, then exhibit delayed growth, episodic vomiting, seizures, and recurrent cerebral injuries resembling stroke. These strokelike events, probably the result of a proliferation of dysfunctional mitochondria in the smooth muscle cells of small arteries, may give rise to either permanent or reversible deficits. The disease course is progressive
RG f Volume 22 ● Number 3 Cheon et al 471
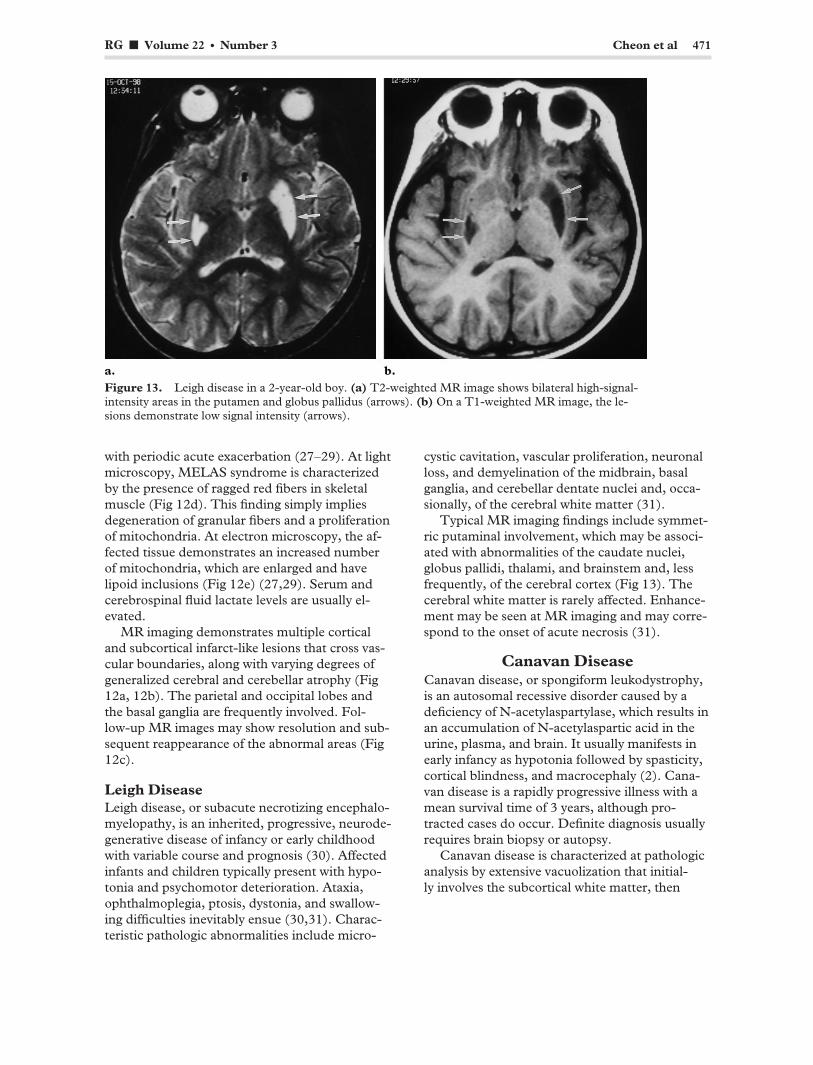
Figure 13. Leigh disease in a 2-year-old boy. (a) T2-weighted MR image shows bilateral high-signal-intensity areas in the putamen and globus pallidus (arrows). (b) On a T1-weighted MR image, the lesions demonstrate low signal intensity (arrows).
with periodic acute exacerbation (27–29). At light microscopy, MELAS syndrome is characterized by the presence of ragged red fibers in skeletal muscle (Fig 12d). This finding simply implies degeneration of granular fibers and a proliferation of mitochondria. At electron microscopy, the affected tissue demonstrates an increased number of mitochondria, which are enlarged and have lipoid inclusions (Fig 12e) (27,29). Serum and cerebrospinal fluid lactate levels are usually elevated.
MR imaging demonstrates multiple cortical and subcortical infarct-like lesions that cross vascular boundaries, along with varying degrees of generalized cerebral and cerebellar atrophy (Fig 12a, 12b). The parietal and occipital lobes and the basal ganglia are frequently involved. Follow-up MR images may show resolution and sub-sequent reappearance of the abnormal areas (Fig 12c).
Leigh Disease Leigh disease, or subacute necrotizing encephalomyelopathy, is an inherited, progressive, neurodegenerative disease of infancy or early childhood with variable course and prognosis (30). Affected infants and children typically present with hypotonia and psychomotor deterioration. Ataxia, ophthalmoplegia, ptosis, dystonia, and swallowing difficulties inevitably ensue (30,31). Characteristic pathologic abnormalities include micro-
cystic cavitation, vascular proliferation, neuronal loss, and demyelination of the midbrain, basal ganglia, and cerebellar dentate nuclei and, occasionally, of the cerebral white matter (31).
Typical MR imaging findings include symmetric putaminal involvement, which may be associated with abnormalities of the caudate nuclei, globus pallidi, thalami, and brainstem and, less frequently, of the cerebral cortex (Fig 13). The cerebral white matter is rarely affected. Enhancement may be seen at MR imaging and may correspond to the onset of acute necrosis (31).
Canavan Disease Canavan disease, or spongiform leukodystrophy, is an autosomal recessive disorder caused by a deficiency of N-acetylaspartylase, which results in an accumulation of N-acetylaspartic acid in the urine, plasma, and brain. It usually manifests in early infancy as hypotonia followed by spasticity, cortical blindness, and macrocephaly (2). Canavan disease is a rapidly progressive illness with a mean survival time of 3 years, although protracted cases do occur. Definite diagnosis usually requires brain biopsy or autopsy.
Canavan disease is characterized at pathologic analysis by extensive vacuolization that initially involves the subcortical white matter, then

472 May-June 2002 RG f Volume 22 ● Number 3
Figure 14. Canavan disease in a 6-month-old boy with macrocephaly. (a) T2-weighted MR image shows extensive high-signal-intensity areas throughout the white matter, resulting in gyral expansion and cortical thinning. Striking demyelination of the subcortical U fibers is also noted. (b) T1-weighted MR image shows demyelinated white matter with low signal intensity. (c) Photomicrograph (original magnification, �200; hematoxylin-eosin stain) shows ballooning of the myelin sheaths of oligodendrocytes due to massive intramyelinic edema.
spreads to the deep white matter (Fig 14c). Electron microscopy demonstrates increased water content within the glial tissue, described as having the texture of a wet sponge, as well as dysmyelination (32,33).
T1-weighted MR imaging demonstrates symmetric areas of homogeneous, diffuse low signal intensity throughout the white matter, whereas T2-weighted imaging shows nearly homogeneous high signal intensity throughout the white matter. The subcortical U fibers are preferentially affected early in the course of the disease (Fig 14a, 14b). In rapidly progressive cases, the internal and external capsules are involved, and the cerebellar white matter is usually affected as well. As the disease progresses, atrophy becomes conspicuous.
Unknown Causes
Pelizaeus-Merzbacher Disease PMD has been linked to a severe deficiency of myelin-specific lipids caused by a lack of proteolipid protein. This myelin-specific proteolipid protein is necessary for oligodendrocyte differentiation and survival. PMD has traditionally been divided into classic and connatal forms (34,35). Classic PMD begins during late infancy with X-linked recessive inheritance. Connatal PMD is a rarer and more severe variant that begins at birth or in early infancy. The connatal form has either X-linked or autosomal recessive inheritance. Patients with all forms of PMD present with clinical signs and symptoms including abnormal eye

RG f Volume 22 ● Number 3 Cheon et al 473
Figure 16. Alexander disease in a 5-year-old boy with macrocephaly. (a) T2-weighted MR image shows symmetric demyelination in the frontal lobe white matter. The internal and external capsules and parietal white matter are also involved. (b) Photomicrograph (original magnification, �100; hematoxylin-eosin stain) of the pathologic specimen shows deposition of Rosenthal fibers (arrows).
Figure 15. PMD in a 7-month-old boy. T2-weighted MR image reveals almost no myelination of the cerebral white matter. The sub-cortical white matter is also involved, as are the internal and external capsules (arrow-heads).
movements, nystagmus, extrapyramidal hyperkinesias, spasticity, and slow psychomotor development (34–36).
T2-weighted MR imaging reveals a nearly total lack of normal myelination with diffuse high signal intensity that extends peripherally to involve
the subcortical U fibers, along with early involvement of the internal capsule (Fig 15). Sometimes, the white matter demonstrates high signal intensity with small scattered foci of more normal signal intensity, a finding that may reflect the tigroid pattern of myelination (36). At pathologic analysis, the involved white matter demonstrates patchy distribution of dysmyelination with pre-served myelin islands. These findings are frequently seen along the perivascular area, thus giving rise to the characteristic tigroid appearance (35,36).
Alexander Disease Alexander disease, or fibrinoid leukodystrophy, is characterized at pathologic analysis by massive deposition of Rosenthal fibers (dense, eosinophilic, rodlike cytoplasmic inclusions found in astrocytes) in the subependymal, subpial, and perivascular regions (Fig 16b) (37). Three clinical subgroups are recognized. The infantile subgroup is characterized by early onset of macrocephaly, psychomotor retardation, and seizure. Death occurs within 2–3 years. The diagnosis is made on the basis of a combination of macrocephaly, early onset of clinical findings, and imaging findings, but definite diagnosis usually requires brain biopsy or autopsy. In the juvenile subgroup, onset of symptoms occurs between 7 and 14 years of
474 May-June 2002 RG f Volume 22 ● Number 3
age. Progressive bulbar symptoms with spasticity are common. In the adult subgroup, onset of symptoms occurs between the 2nd and 7th decades. The symptoms and disease course can be indistinguishable from those of classic multiple sclerosis in the adult subgroup (38,39).
Alexander disease has a predilection for the frontal lobe white matter early in its course. CT demonstrates low attenuation in the deep frontal lobe white matter. Enhancement is often seen near the tips of the frontal horns early in the disease course (39). The characteristic frontal lobe areas of hyperintensity are seen at T2-weighted MR imaging. These hyperintense areas progress posteriorly to the parietal white matter and internal and external capsules (Fig 16a). The subcortical white matter is affected early in the disease course. In the late stages of the disease, cysts may develop in affected regions of the brain.
Conclusions There are many different leukodystrophies, each of which has distinctive features (Table 2). MR imaging is highly sensitive in determining the presence and assessing the severity of underlying white matter abnormalities in patients with leukodystrophy. Although the findings are often non-specific, systematic analysis of the finer details of disease involvement may permit a narrower differential diagnosis, which the clinician can then further refine with knowledge of patient history, clinical testing, and metabolic analysis. MR imaging has also been extensively used to monitor the natural progression of various white matter disorders and the response to therapy.
References 1. Becker LE. Lysosomes peroxisomes and mito
chondria: function and disorder. AJNR Am J Neuroradiol 1992; 13:609–620.
2. Kendall BE. Disorders of lysosomes, peroxisomes, and mitochondria. AJNR Am J Neuroradiol 1992; 13:621–653.
3. Valk J, van der Knaap MS. Classification of myelin disorders. In: Valk J, van der Knaap MS, eds. Magnetic resonance of myelin, myelination, and myelin disorders. Berlin, Germany: Springer-Verlag, 1989; 4–8.
4. Demaerel P, Faubert C, Wilms G, Casaer P, Piepgras U, Baert AL. MR findings in leukodystrophy. Neuroradiology 1991; 33:368–371.
5. Wolpert SM, Anderson ML, Kaye EM. Metabolic and degenerative disorders. In: Wolpert SM,
Barnes PD, eds. MRI in pediatric neuroradiology. St Louis, Mo: Mosby, 1992; 121–150.
6. Kolodny EH. Sulfatide lipidosis: metachromatic leukodystrophy. In: Scriver CR, Beaedet Al, Sly W, Valle D, eds. The metabolic basis of inherited diseases. 6th ed. New York, NY: McGraw-Hill, 1989; 1721–1750.
7. Kim TS, Kim IO, Kim WS, et al. MR of child-hood metachromatic leukodystrophy. AJNR Am J Neuroradiol 1997; 18:733–738.
8. Faerber EN, Melvin J, Smergel EM. MRI appearances of metachromatic leukodystrophy. Pediatr Radiol 1999; 29:669–672.
9. Suzuki Y, Suzuki K. Krabbe’s globoid cell leukodystrophy: deficiency of galactocerebrosidase in serum, leukocytes and fibroblasts. Science 1971; 171:73–75.
10. Zlotogora J, Chakraborty S, Knowlton RG, Wenger DA. Krabbe disease locus mapped to chromosome 14 by genetic linkage. Am J Hum Genet 1990; 47:37–44.
11. Loes DJ, Peters C, Krivit W. Globoid cell leukodystrophy: distinguishing early-onset from late-onset disease using a brain MR imaging scoring method. AJNR Am J Neuroradiol 1999; 20:316–323.
12. Choi S, Enzmann DR. Infantile Krabbe disease: complementary CT and MR findings. AJNR Am J Neuroradiol 1993; 14:1164–1166.
13. Jones BV, Barron TF, Towfighi J. Optic nerve enlargement in Krabbe’s disease. AJNR Am J Neuroradiol 1999; 20:1228–1231.
14. Valk J, van der Knaap MS. Magnetic resonance of myelin, myelination and myelin disorders. Berlin, Germany: Springer-Verlag, 1989.
15. Murata R, Nakajima S, Tanaka A, et al. MR imaging of the brain in patients with mucopolysaccharidosis. AJNR Am J Neuroradiol 1989; 10:1165– 1170.
16. Becker LE, Yates A. Inherited metabolic disease. In: Davis R, Robertson D, eds. Textbook of neuropathology. 2nd ed. Baltimore, Md: Williams & Wilkins, 1990; 331–427.
17. Moser HW. Adrenoleukodystrophy: phenotype, genetics, pathogenesis and therapy. Brain 1997; 120(pt 8):1485–1508.
18. Migeon BR, Moser HW, Moser AB, Axelman J, Sillence D, Norum RA. Adrenoleukodystrophy: evidence for X-linkage, inactivation and selection favoring the mutant allele in heterozygous cell. Proc Natl Acad Sci U S A 1981; 78:5066–5070.
19. Melhem ER. Breiter SN, Ulug AM, Raymond GV, Moser HW. Improved tissue characterization in adrenoleukodystrophy using magnetization transfer imaging. AJR Am J Roentgenol 1996; 166:689–695.
20. Melhem ER. Loes DJ, Georgiades CS, Raymond GV, Moser HW. X-linked adrenoleukodystrophy: the role of contrast-enhanced MR imaging in predicting disease progression. AJNR Am J Neuroradiol 2000; 21:839–844.
21. Barkovich AJ, Ferriero DM, Bass N, Boyer R. Involvement of the pontomedullary corticospinal tracts: a useful finding in the diagnosis of X-linked adrenoleukodystrophy. AJNR Am J Neuroradiol 1997; 18:95–100.

Tab
le 2
D
isti
nct
ive
Fea
ture
s of
Var
iou
s L
euko
dys
trop
hie
s
Leu
kody
stro
phy
Enz
yme
Defi
cien
cy
Inhe
rita
nce
Loc
atio
n S
ubco
rtic
al
Invo
lvem
ent*
C
orti
cosp
inal
Tra
ct
Invo
lvem
ent
Enh
ance
men
t O
ther
Fea
ture
s†
Lys
osom
al s
tora
ge d
isea
se
Met
achr
omat
ic le
ukod
ystr
ophy
A
ryls
ulfa
tase
A
Aut
osom
al r
eces
sive
(Y
) Y
N
T
igro
id p
atte
rn
Kra
bbe
dise
ase
Gal
acto
cere
bros
ide
aspa
rtoa
cyla
se
Aut
osom
al r
eces
sive
(Y
) Y
Y
H
igh
CT
att
enua
tion
Muc
opol
ysac
char
idos
is
Per
oxis
omal
dis
orde
r A
LD
A
cyl-
CoA
syn
thes
ase
X-l
inke
d re
cess
ive
Par
ieto
occi
pita
l (Y
) Y
Y
Z
ellw
eger
syn
drom
e A
utos
omal
rec
essi
ve
Gyr
al a
bnor
mal
ity
Mit
ocho
ndri
al d
ysfu
ncti
on
Lei
gh d
isea
se
Y
ME
LA
S s
yndr
ome
Par
ieto
occi
pita
l M
igra
ting
infa
rct
Kea
rn-S
ayre
syn
drom
e Y
C
anav
an d
isea
se
Y
Mac
roce
phal
y U
nkno
wn
caus
e P
MD
X
-lin
ked
rece
ssiv
e Y
Y
N
T
igro
id p
atte
rn
Ale
xand
er d
isea
se
Fro
ntal
Y
Y
M
acro
ceph
aly
*(Y
) in
dica
tes
dela
yed
subc
orti
cal w
hite
mat
ter
invo
lvem
ent.
† M
R im
agin
g fe
atur
es (
exce
pt in
Kra
bbe
dise
ase)
.
RG f Volume 22 ● Number 3 Cheon et al 475

476 May-June 2002 RG f Volume 22 ● Number 3
22. Castellote A, Vera J, Vazquez E, Roig M, Belmonte JA, Rovira A. MR in adrenoleukodystrophy: atypical presentation as bilateral frontal demyelination. AJNR Am J Neuroradiol 1995; 16: 814–815.
23. Barkovich AJ, Peck WW. MR of Zellweger syndrome. AJNR Am J Neuroradiol 1997; 18:1163– 1170.
24. Kuriyama M, Umezaki H, Fukuda Y, et al. Mitochondrial encephalomyopathy with lactate-pyruvate elevation and brain infarction. Neurology 1984; 34:72–77.
25. Tulinius MH, Holme E, Kristiansson B, Larsson NG, Oldfors A. Mitochondrial encephalopathies in childhood. I. Biochemical and morphologic investigation. J Pediatr 1991; 119:242–250.
26. Tulinius MH, Holme E, Kristiansson B, Larsson NG, Oldfors A. Mitochondrial encephalomyopathies in childhood. II. Clinical manifestations and syndromes. J Pediatr 1991; 119:250–251.
27. Barkovich AJ, Good WV, Koch TK, Berg BO. Mitochondrial disorders: analysis of their clinical and imaging characteristics. AJNR Am J Neuroradiol 1993; 14:1119–1137.
28. Pavlakis SG, Phillips PC, DiMauro S, De Vivo DC, Rowland LP. Mitochondrial myopathy, encephalopathy, lactic acidosis, and strokelike episodes: a distinct clinical syndrome. Ann Neurol 1984; 16:481–488.
29. Kim IO, Kim JH, Kim WS, Hwang YS, Yeon KM, Han MC. Mitochondrial myopathy-encephalopathy-lactic acidosis and strokelike episodes (MELAS) syndrome: CT and MR findings
in seven children. AJR Am J Roentgenol 1996; 166:641–645.
30. DiMauro S, Servidei S, Zeviani M, et al. Cytochrome c oxidase deficiency in Leigh syndrome. Ann Neurol 1987; 22:498–506.
31. Medina L, Chi TL, DeVivo DC, Hilal SK. MR findings in patients with subacute necrotizing encephalomyelopathy (Leigh disease): correlation with biochemical defect. AJNR Am J Neuroradiol 1990; 11:379–384.
32. McAdams HP, Geyer CA, Done SL, Deigh D, Mitchell M, Ghaed VN. CT and MR imaging of Canavan disease. AJNR Am J Neuroradiol 1990; 11:397–399.
33. Brismar J, Brismar G, Gascon G, Ozand P. Canavan disease: CT and MR imaging of the brain. AJNR Am J Neuroradiol 1990; 11:805–810.
34. Seitelberger F. Neuropathology and genetics of Pelizaeus-Merzbacher disease. Brain Pathol 1995; 5:267–273.
35. Silverstein AM, Hirsh DK, Trobe JD, Gebarski SS. MR imaging of the brain in five members of a family with Pelizaeus-Merzbacher disease. AJNR Am J Neuroradiol 1990; 11:495–499.
36. van der Knaap MS, Valk J. The reflection of histology in MR imaging of Pelizaeus-Merzbacher disease. AJNR Am J Neuroradiol 1989; 10:99– 103.
37. Borrett D, Becker LE. Alexander’s disease: a disease of astrocytes. Brain 1985; 108(pt 2):367–385.
38. Shah M, Ross JS. Infantile Alexander disease: MR appearance of a biopsy-proven case. AJNR Am J Neuroradiol 1990; 11:1105–1106.
39. Trommer BL, Naidich TP, Dal Canto MC, McLone DG, Larsen MB. Noninvasive CT diagnosis of infantile Alexander’s disease: pathologic correlation. J Comput Assist Tomogr 1983; 7: 509–516.
This article meets the criteria for 1.0 credit hour in category 1 of the AMA Physician’s Recognition Award. To obtain credit, see accompanying test at http://www.rsna.org/education/rg_cme.html.