leung
DESCRIPTION
single cellsTRANSCRIPT
SNES: single nucleus exome sequencingLeung et al.
Leung et al. Genome Biology (2015) 16:55 DOI 10.1186/s13059-015-0616-2
Leung et al. Genome Biology (2015) 16:55 DOI 10.1186/s13059-015-0616-2
METHOD Open Access
SNES: single nucleus exome sequencingMarco L Leung1,3, Yong Wang1, Jill Waters1 and Nicholas E Navin1,2,3*
Abstract
Single-cell genome sequencing methods are challenged by poor physical coverage and high error rates, making itdifficult to distinguish real biological variants from technical artifacts. To address this problem, we developed a methodcalled SNES that combines flow-sorting of single G1/0 or G2/M nuclei, time-limited multiple-displacement-amplification,exome capture, and next-generation sequencing to generate high coverage (96%) data from single human cells. Wevalidated our method in a fibroblast cell line, and show low allelic dropout and false-positive error rates, resulting inhigh detection efficiencies for single nucleotide variants (92%) and indels (85%) in single cells.
BackgroundSingle-cell sequencing methods have the potential toprovide great insight into the genomes of rare sub-populations and complex admixtures of cells, but arecurrently challenged by extensive technical errors andpoor physical coverage data. While much progress hasbeen made in developing single-cell RNA sequencingmethods [1-4], the development of genome-wide DNAsequencing methods has proven to be more challenging[5,6], owing to the fact that single cells contain thousandsof copies of each mRNA molecule, but only two copies ofeach chromosome. Therefore each cell provides only twotemplate DNA molecules for whole-genome-amplification(WGA) reactions and errors that occur in the initialrounds of amplification are inherited by all subsequentmolecules. In our previous work we developed the firstsingle-cell genome sequencing method, Single-Nucleus-Sequencing (SNS), which utilized DOP-PCR to generateabout 10% coverage breadth of an individual cell [7,8].Coverage breadth is defined as the percentage of nucleo-tide sites in the single-cell data with ≥1X coverage depth.However, while SNS was adequate for copy numberdetection using large genomic intervals (54 kb), it could notdetect mutations at base-pair resolution. Two subsequentmethods were developed that use multiple-displacement-amplification (MDA) [9] and multiple-annealing-looping-based-amplification-cycles (MALBAC) [10] to increase
* Correspondence: [email protected] of Genetics, MD Anderson Cancer Center, Houston, TX, USA2Department of Bioinformatics and Computational Biology, MD AndersonCancer Center, Houston, TX, USA3Graduate Program in Genes and Development, Graduate School of BiomedicalSciences, University of Texas Health Science Center at Houston, Houston, TX, USA
© 2015 Leung et al.; licensee BioMed Central.Commons Attribution License (http://creativecreproduction in any medium, provided the orDedication waiver (http://creativecommons.orunless otherwise stated.
coverage breadth during WGA. While pioneering, thesestudies increased coverage breadth at the cost of introdu-cing high false positive and false negative error rates, dueto excessive over-amplification (1:1e6) of the DNA from asingle cell from 6 picograms to microgram concentrations.Consequently, it was necessary to call variants across mostof the single cells to reduce the high false positive (FP)technical errors, which is equivalent to sequencing thebulk tissue en masse.To mitigate technical errors, we recently developed a
method called Nuc-Seq, which utilizes G2/M cells toperform single-cell genome sequencing [11]. While thisapproach was suitable for analyzing highly proliferativecells, such as cancer cells, it was not suitable for theanalysis of normal cells or slowly dividing populations.To address this problem, we developed a new approachcalled single nucleus exome sequencing (SNES) that buildsupon our previous method. SNES combines flow-sorting,time-limited isothermal multiple-displacement amplifica-tion (MDA), exome capture, and next-generation sequen-cing (NGS) to generate high coverage (96%) data forthe accurate detection of point mutations and indels insingle mammalian cells. SNES has several improvementsover Nuc-Seq, including: (1) improved exome captureperformance; (2) time-limited isothermal amplification;(3) enhanced MDA polymerases; (4) efficient DNA ligases;(5) quality control (QC) of WGA using qPCR panels; and(6) cost reduction by using standard reagents instead ofcommercial WGA kits. Importantly we show that SNEScan be applied to either G1/0 or G/2 M cells, opening upnew avenues of investigation into single-cell genomicsstudies of normal tissues and slowly proliferating cells (forexample, stem cell or cancer stem cells).
This is an Open Access article distributed under the terms of the Creativeommons.org/licenses/by/4.0), which permits unrestricted use, distribution, andiginal work is properly credited. The Creative Commons Public Domaing/publicdomain/zero/1.0/) applies to the data made available in this article,

Leung et al. Genome Biology (2015) 16:55 Page 2 of 9
Results and discussionExperimental approach and quality control assaysTo perform SNES nuclear suspensions are preparedfrom fresh or frozen tissue using a DAPI-NST lysisbuffer (Figure 1a). Single nuclei are flow-sorted into in-dividual wells by gating distributions of ploidy at 2 N(G1/0) or 4 N (G2/M). Alternatively, this approach canbe applied to gate G1/0 or G2/M cells from aneuploidtumors, which also have G2/M distributions at higher
Figure 1 SNES method and WGA quality control. (a) Nuclear suspensioSingle nuclei were isolated by gating the G1/0 or G2/M ploidy distributions aamplification is performed using Φ29 to perform WGA. (b) Time-course of WGusing a panel of 22 chromosome-specific qPCR primers to determine the WG
ploidy indexes (Additional file 1: Figure S1). Single nucleiare then deposited into individual wells of a 96-well platecontaining nuclear lysis buffer. The 6 picograms (2 N) or12 picograms (4 N) of gDNA from each nucleus is incu-bated with the Φ29 polymerase (New England Biolabs)and modified random hexamer primers to perform time-limited MDA. To determine the optimal isothermal time-frame, we performed time-series MDA reactions usingG1/0 and G2/M cells over 8 h (Figure 1b). From this
ns were prepared from tissues, stained with DAPI and flow-sorted.nd deposited nuclei singly into a 96-well plate. Multiple-displacement-A showing total DNA yield from single nuclei. (c) Quality control assayA amplification efficiency of each single nucleus.
Leung et al. Genome Biology (2015) 16:55 Page 3 of 9
curve, we determined 120 min to be the minimum time-frame required to generate approximately 500 ng of DNAfrom a single cell, providing sufficient input material forconstructing libraries, exome capture, and performing thenecessary quality control assays.To evaluate WGA efficiency we performed qPCR on
each single nucleus WGA reaction using a set of 22 pri-mer pairs that target each chromosome independently(Additional file 2: Table S1, methods). Single nuclei with22/22 amplicons were selected for subsequent libraryconstruction and next-generation sequencing. Our datashowed that G2/M cells resulted in an improvementover G1/0 cells for WGA efficiency, with 70% (14/20)single cells having the full set of chromosomes amplifiedin G2/M cells compared to 15% (3/20) in G1/0 cells(Figure 1c). Additional G1/0 WGA experiments and QCwere subsequently performed to obtain nine SKN2 cellsin total for the single-cell sequencing experiments.Notably, performing QC analysis with qPCR on cancer
cells may lead to diminished signal due to hemizygousdeletions, and occasionally rare focal homozygous dele-tions [12,13]. Therefore users may want to considerlooser filtering criteria (20/22 amplicons). However thishas not been a problem in our previous work, in whichwe performed QC on single breast tumor cells usingstandard PCR and found that >20 amplicons weredetected in 80 single cells [11]. Single cells that passedQC for WGA were used to construct sequencing librar-ies using a low-input TA cloning protocol starting with100 ng of input material (see Methods). During libraryconstruction a unique 6 bp barcode was added to eachsingle-cell library for sample multiplexing. We pooledfour single-cell libraries together into one reaction forexome capture (TruSeq, Illumina) and next-generationpaired-end sequencing on the HiSeq2000 system (Illumina)using 100 paired-end cycles. The number of cells that canbe multiplexed is a function of the amount of data that isgenerated from the sequencing platform and the size ofthe exome target region.
Measuring coverage performance and uniformityTo determine the coverage performance and error ratesof SNES, we used a normal isogenic female fibroblastcell line (SKN2), in which we assume that the variantspresent in a single cell will be highly similar to the referencepopulation sample. Any deviations from the reference vari-ants were considered to be technical errors, and were usedto calculate the error rates (see Methods). We sequencedthe population of cells at high coverage depth (59X) andbreadth (99.76%) to obtain a reference set of whole-genomevariants. We then applied SNES to sequence nine singlecells that were gated from the G1/0 stage of the cell cycleand 10 single cells from the G2/M stage (Additional file 3:Table S2). We aligned the single-cell data to the human
genome using our processing pipeline and eliminatedsequence reads with multiple mappings and PCR dupli-cates (see Methods). As expected, all of the single cellsshowed very similar coverage depth distributions, irre-spective of whether they were gated from the G1/0 or G2/M distributions (P = 0.85, t-test), which is important forthe subsequent comparisons (Figure 2a and b).In order to assess coverage performance, we calculated
coverage breadth (sites with ≥1X coverage) (Figure 2c) andcoverage uniformity (evenness) (Figure 2e). Our data sug-gest that coverage breadth (≥1X) significantly (P = 0.0021,t-test) increased in the G2/M cells (95.94%, ± 0.005 SEM)relative to the G1/0 cells (89.60% ± 0.018 SEM) (Figure 2d).This results in the number of site with sufficient coveragedepth for variant calling at 73.54% in G1/0 cells comparedto 84.34% in G2/M cells. To assess coverage uniformity,we plotted the fraction of the exome covered as a functionof coverage depth (Figure 2f). These plots show that theG2/M cells achieved more even coverage uniformity atsites with low coverage depth compared to the G1/0 cells.To further investigate coverage uniformity, we calculatedLorenz curves and plotted data for perfect uniformity, agenomic DNA population sample and mean data for theG1/0 and G2/M single cells, as well as data from ourprevious Single-Nucleus-Sequencing method (Figure 2g)[14]. These curves show a large improvement in coverageuniformity using G2/M cells compared to the G1/0 cells,and both showed vast improvements over our previousSNS approach [7]. We also calculated the on-target per-formance for data in the exome region of single cells, andfound very high percentages (mean = 67.33%) for G1/0and G2/M cells (Figure 2h), which is equivalent to previ-ous reports (55% to 85%) of exome capture efficienciesusing millions of cells [15].
Estimating technical error ratesTo calculate the technical error rates we filtered the readsby mapping quality, base quality, and clustered regions[16]. We then performed local realignment around indels(see Methods). From these data we identified single-nucleotide variants (SNVs) and indels using the UnifiedGenotyper (GATK), following our processing pipeline(Additional file 4: Figure S2) [17]. Major sources of tech-nical errors that occur during WGA include the allelicdropout rate (ADR) and the FP error rates (Figure 3a)[18,19]. Previous studies have reported very high (43.09%)allelic dropout rates in single-cell exome sequencing data[19,20]. In comparison, our data show that SNES signifi-cantly (P = 7e-4, t-test) reduced the allelic dropout rates to30.82% (±0.013, SEM) in G1/0 cells and 21.52% (±0.019,SEM) in G2/M cells (Figure 3b). These calculations arebased on sites in which both the single cells and popula-tion sample have sufficient (≥6X) coverage depth (in orderto eliminate sites with low coverage in which WGA did
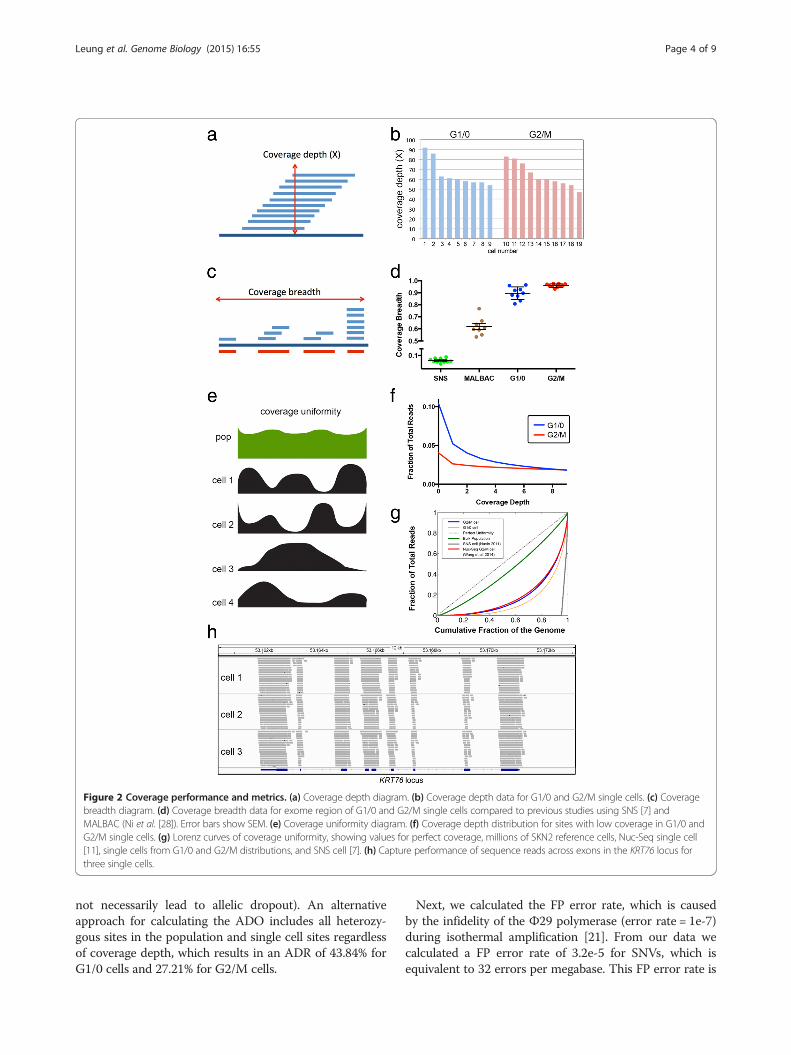
Figure 2 Coverage performance and metrics. (a) Coverage depth diagram. (b) Coverage depth data for G1/0 and G2/M single cells. (c) Coveragebreadth diagram. (d) Coverage breadth data for exome region of G1/0 and G2/M single cells compared to previous studies using SNS [7] andMALBAC (Ni et al. [28]). Error bars show SEM. (e) Coverage uniformity diagram. (f) Coverage depth distribution for sites with low coverage in G1/0 andG2/M single cells. (g) Lorenz curves of coverage uniformity, showing values for perfect coverage, millions of SKN2 reference cells, Nuc-Seq single cell[11], single cells from G1/0 and G2/M distributions, and SNS cell [7]. (h) Capture performance of sequence reads across exons in the KRT76 locus forthree single cells.
Leung et al. Genome Biology (2015) 16:55 Page 4 of 9
not necessarily lead to allelic dropout). An alternativeapproach for calculating the ADO includes all heterozy-gous sites in the population and single cell sites regardlessof coverage depth, which results in an ADR of 43.84% forG1/0 cells and 27.21% for G2/M cells.
Next, we calculated the FP error rate, which is causedby the infidelity of the Φ29 polymerase (error rate = 1e-7)during isothermal amplification [21]. From our data wecalculated a FP error rate of 3.2e-5 for SNVs, which isequivalent to 32 errors per megabase. This FP error rate is

Figure 3 Error rates and detection efficiencies. (a) Illustration of technical errors, including the allelic-dropout rate (ADR) and false positive (FP)error rate. (b) Allelic dropout rates for single-cell experiments using G1/0 and G2/M single cells. (c) Spectrum of FP errors detected in the G2/Msingle-cell data, with each column representing a single cell. (d) Spectrum of single nucleotide variants detected in the SKN2 population data.(e) Distribution of FP errors on chromosome 7 and 11 that occur in single cells (black) or in two or more cells (red). (f) Detection efficiency forsingle-nucleotide variants in the G1/0 cells and G2/M cells calculated from the exome sequencing data. (g) Detection efficiency for indels in theG1/0 cells and G2/M cells calculated from single-cell exome sequencing data. Error bars in all panels represent the SEM.
Leung et al. Genome Biology (2015) 16:55 Page 5 of 9
higher than our previous estimates for whole-genomesingle-cell sequencing with Nuc-Seq, but can be explainedby the increased isothermal WGA timeframe and add-itional PCR cycles required to generate sufficient DNA forexome capture and enrichment. We investigated the
spectrum of the FP errors and found that 82.3% were C >Tand G >A transitions (Figure 3c), showing a significantbias relative to the normal transition and transversionspectrum in the population of fibroblast cells (Figure 3d).Importantly, we found that the majority of the FP errors

Leung et al. Genome Biology (2015) 16:55 Page 6 of 9
occurred at random sites in the genomes of single cells,with few mutations occurring at recurrent sites in two ormore cells (Figure 3e, Additional file 5: Figure S3). Thisdistribution allows the FP error rates to be mitigated bycalling mutations in two (FP: 3.2e-52 = 1.02e-9) or more(FP: 3.2e-5n) single cells. Using two or more cells in vari-ant calling is possible in most single-cell studies, whichnormally seek to analyze large numbers of cells.We also investigated the distribution of allelic dropout
events in the single-cell data. By comparing the allelicdropout events from both alleles, our data showed thatthere is a slight bias towards AB→ BB dropout events,when compared to AB→AA events in both the G1/0and G2/M cells (Additional file 6: Figure S4). Wehypothesize that this bias is likely due to mismatchhybridization inefficiency of the exome capture probesto the B alleles, since they were designed for the A allelesequence (reference human genome assembly). Next weexamined the distribution and recurrence of allelicdropout events by examining their frequency acrossmultiple single cells (Additional file 7: Figure S5). Ourdata show that in contrast to the random distributionof FP errors that occur at different site in single cells,allelic dropout errors sometimes occurred at recurrentpositions in multiple single cells (Additional file 7:Figure S5). On average we observed that 2.55 cells outof 19 single cells shared a recurrent allelic dropoutevent at the same nucleotide position. These regionsare important to note in single-cell studies and shouldbe filtered, since they can be misinterpreted as bio-logical variation in SNV prevalence, when in fact theyare likely to be technical errors.
Measuring detection efficienciesWe calculated the detection efficiencies, to measure theproportion of the SNVs and indels that were successfullydetected in each single fibroblast cell exome. For SNVswe detected 92.37% (±0.008, SEM) of the variants in thesingle cells (mean = 32,369/34,982) in the G2/M cells, and86.71% (±0.012, SEM) in the G1/0 cells (mean = 25,753/29,549) (Figure 3f). In comparison, previous studies usingMALBAC [9] reported detection efficiencies of only 76%for SNVs. An alternative approach is to calculate the SNVdetection efficiency at all variant sites in the reference, re-gardless of the coverage depth in the single-cell and popu-lation sample. This calculation results in a detectionefficiency for SNVs of 60.64% for G1/0 cells and 76.22%for G2/M cells. We also calculated the detection efficiencyfor indels, which is 85.60% (±0.007 SEM) for G2/M cells(mean = 2,448/2,856), and 82.11% (±0.009 SEM) for G1/0cells (mean = 1,926/2,336) (Figure 3g). To our knowledge,this is the first report showing that indels can accuratelybe detected in the genomes of single mammalian cells.
ConclusionsWe report the development of a novel single-cell exomesequencing method called SNES that can achieve highcoverage (96%) data from the exome of a single mamma-lian cell. From these data we show that we can accur-ately detect SNVs and indels at base-pair resolution. Thetechnical performance in coverage improvement is dueto multiple factors, including an improved Phi29 poly-merase (New England Biolabs), time-limited isothermalamplification and the use of a 22-chromosome qPCRpanel to eliminate cells with poor WGA performanceprior to exome capture and sequencing. In contrast to ourprevious method [11], SNES eliminates the requirementfor Tn5 transposases for library construction, which canintroduce integration biases in the human genome andlead to coverage non-uniformity [22-25]. By performingtime-limited isothermal MDA with an improved Phi29polymerase (New England Biolabs) we were able to miti-gate FP and FN error rates, resulting in improved detec-tion efficiencies for SNVs and indels. Importantly, theSNES protocol eliminates commercial kits for cell isola-tion, WGA, and library construction, thereby reducing thecost of generating a single-cell library to approximately$30 per cell (not including the exome capture reagentsand sequencing costs). This will enable a large number ofcells to be analyzed and multiplexed, which is the goal ofmost single-cell sequencing studies.In our study, we performed a direct comparison of
data derived from G1/0 and G2/M single cells, whichshows that both cells performed well for coverage uni-formity and breadth. However our data show that usingG2/M cells will lead to even further technical improve-ments in the allelic dropout rates. In the future, furthertechnical improvements may be achieved by combiningSNES with microfluidic platforms (for example, Flui-digm) which have been shown to decrease errors whennanoliter volumes are used for MDA reactions [5,26,27].In contrast to most single cell sequencing methods todate [5,9,10,27] SNES utilizes nuclei instead of cells foranalysis. Nuclei have several advantages over using cells:(1) nuclei can be stained with DAPI and gated to avoidcollecting cells that are degraded, apoptotic, or replicat-ing; 2) nuclei can be deposited more accurately to avoidsequencing multiple cells; and (3) nuclei can be isolatedfrom archival frozen tissue samples, that have beenstored for decades [5,10,20,28]. The last point is crucialfor single-cell sequencing of archival tissues, becausefreezing ruptures the cytoplasmic membrane of mostcells, but leaves the nuclear membrane intact from whichnuclear suspensions can easily be prepared. However,nuclei also have several notable limitations, includingpotentially missing DNA from micronuclei [29] and thefact that cell surface markers cannot be used to isolatespecific populations (for example, by gating during flow-

Leung et al. Genome Biology (2015) 16:55 Page 7 of 9
sorting). Thus the choice of using nuclei vs. cells willdepend largely on the specific requirements of theresearch project. In closing, we expect that SNES willhave broad applications in many diverse fields of biology,including cancer research, microbiology, neurobiology,development, and prenatal genetic diagnosis, and willlead to vast improvements in our fundamental under-standing of human diseases.
MethodsCell line sampleSKN2 is an isogenic human fibroblast cell line that wasobtained from the Cold Spring Harbor Laboratory (Dr.Michael Wigler). SKN2 was cultured using Dulbecco’sModified Eagle Medium with 10% fetal bovine serum,penicillin/streptomycin and L-glutamine.
SNES experimental protocolIsolating single nuclei by flow-sortingNuclei were isolated from the fibroblasts using an NST-DAPI buffer (800 mL of NST (146 mM NaCl, 10 mMTris base at pH 7.8, 1 mM CaCl2, 21 mM MgCl2, 0.05%BSA, 0.2% Nonidet P-40)), 200 mL of 106 mM MgCl2,10 mg of DAPI, and 0.1% DNase-free RNase A. Cellswere trypsinized and lysed using the NST-DAPI buffer.The nuclear suspension was filtered through 37-μmplastic mesh prior to flow-sorting. Single nuclei weresorted using the MoFlo Astrios Cell Sorter (Beckman)by gating cellular distributions with differences in theirtotal genomic DNA content according to DAPI intensity.Single nuclei were sorted into individual wells in a 96-well plate. Each well was preloaded with 3.5 μL of lysisbuffer (1 M DTT, 100 mM sodium phosphate, 10 mMTris pH 8.0, and 6 M guanidine hydrochloride and PBS).After flow-sorting, the plate was centrifuged at 700 rpmfor 1 min and incubated at 65°C for 10 min. Afteradding 1.5 μL of neutralization buffer (800 mM Trizmahydrochloride) to each well, the volume was 5 μL.
Whole-genome amplification by time-limitedmultiple-displacement amplificationWhole-genome amplification was performed on singleflow-sorted nuclei using 10 units of Φ29 polymerase and10× Φ29 buffer (NEB cat#M0269L), 1 mM dNTP (GEHealthcare, cat#28-4065-51), and 50 μM random hexamer(phosphorothioate modification on the two 3’-terminalnucleotide - NNNN*N*N - synthesized by Sigma Aldrich)to each well. The total 50 μL reactions were mixed bygently pipetting up and down and spinning down thereaction. Reactions were incubated at 30°C for 120 min toobtain approximately 500 ng of DNA. The polymerasewas denatured subsequently at 65°C for 3 min. The ampli-fied DNA was purified using DNA Clean & Concentrator-5 columns (Zymo D4004).
WGA quality control using qPCR chromosome panelsTo evaluate the WGA amplification efficiency of eachsingle-cell reaction we designed 22 pairs of primers(Sigma Aldrich) to target 22 loci on different chromo-somes for qPCR (Additional file 2: Table S1). The primersequences are listed below. For each qPCR reaction 5 ngof DNA was used for the KAPA Taq PCR kit (Kapa#BK1001). The qPCR reactions were run on the ABI7500 system (Applied Biosystems) in 96-well plates. TheqPCR conditions used were: 95°C for 3 min, followed by45 cycles (95°C for 20 s, and 60°C for 30 s). Single cellWGA reactions that show positive qPCR reactions areselected for subsequent library construction and next-generation sequencing.
Construction of barcoded sequencing librariesWGA reactions that passed QC were sonicated at350 bp using Covaris S220. We used 100 ng of DNA toconstruct sequencing libraries by TA cloning using KAPALibrary preparation kit (Kapa Biosystems, cat#KK8232), inaccordance with the manufacturer’s protocol. Librarieswere quantified by real-time qPCR using Library Quantifi-cation Kit (Kapa Biosystems, cat# KK4835). We used theTruSeq Exome Enrichment Kit (Illumina cat# FC-121-1008) for exome capture in accordance with the manufac-turer’s protocol using eight cycles of PCR enrichment.Final concentrations were measured prior to sequencingby qPCR using the Kappa Library Quantification Kit. Li-braries were sequenced using 100 cycle paired-end flow-cell lanes on the HiSeq2000 system (Illumina, Inc.) for100 cycles. Data were processed using CASAVA 1.8.1pipeline (Illumina, Inc) converting BCL basecall files tofastq files.
Data processing and analysis pipelineSequence reads in FASTQ files were aligned to thehuman genome (hg19) using the Bowtie 2 alignmentsoftware [30]. Samtools (0.1.16) was used to convertSAM files to compressed BAM files and sort BAM filesby coordinate [31]. The Genome Analysis Toolkit (GATKv1.4-37) was used to locally realign the BAM files at inter-vals with indel alignment errors [17]. To eliminate PCRduplicates, we removed sequences with identical start andend coordinates using Picard software [32]. Reads withmapping quality MQ <40 were filtered from the BAMfiles. We used GATK Unified Genotyper to detect singlenucleotide variants (SNVs). All single cells and referencesamples were processed together to generate a singleVCF4 file. We required a minimum base quality (mbq) of20 for the base to be considered during variant detection.Coverage depth at a given locus of greater than 2,500reads was down sampled to expedite analysis processing.We used the GATK variant recalibrator to filter the output
Leung et al. Genome Biology (2015) 16:55 Page 8 of 9
at default sensitivity level. A minimum coverage depthof 6 and at least 2 reads with variant allele was used forfurther filtering of SNVs. SNVs in clustered regionswith neighboring SNVs within 10 bp were filtered fromthe data to remove FPs. We then used GATK Select-Variants to separate SNVs into VCF4 files for down-stream analysis. The processing pipeline is outlined inAdditional file 4: Figure S2.
Calculation of coverage metricsReads with multiple mappings in the human genomewere filtered from the BAM files. Sequence reads withunique mappings were used for calculating coveragemetrics. Coverage depth and breadth were calculatedusing BEDTools by running genomecoverageBED usingthe BED file from the TruSeq capture region of62,286,318 bp [33]. Coverage breadth is defined as thepercentage of the exome with at least 1× read coverage,while coverage depth refers to the mean number ofread counts across all the bases of a sequenced sample.Lorenz curves [14] were calculated to determine cover-age uniformity in the single cell and populationsamples. Briefly, sequence reads were aligned withbowtie2 using unique mappings and PCR duplicateswere removed with Picard. From the BAM files we ransamtools mpileup with the following parameters:‘-A -B -d1000000000’ to determine the read counts forevery base in the human genome reference assemblyHG18. The depth values were sorted using Unix sortwith ‘-n’ parameter and a custom perl script was usedto read the sorted depth values and calculate thecumulative fraction of the genome that was coveredand the cumulative fraction of reads. The curves foreach cells and population samples were plotted inMatlab (Mathworks).
Calculation of technical error ratesThe allelic dropout rate (ADR) is defined as the meanfraction of homozygous sites in the single-cell samples(Homs) where the population reference sample is het-erozygous (Hetp) at the same nucleotide site. Thesecalculations were made using all of the G1/0 or all ofthe G2/M single-cell fibroblast exome sequencing dataindependently. In these calculations both sites (referenceand single cell) required a minimum of 6X coverage depthto call variants.
ADR ¼ 1n
Xn
i¼1
Homs
Hetp
The false positive rate (FPR) is defined as the numberof heterozygous sites in the single cell sample (Hets)divided by the number of sites in the population
reference sample (Homp) that are homozygous for thereference allele at the same nucleotide site.
FPR ¼ 1n
Xn
i¼1
HetsHomp
Calculation of detection efficienciesThe detection efficiencies are calculated from the VCF4variant files after the filtering steps have been performed.The filtered multi-VCF4 file is partitioned into separatefiles for SNVs and indels. For each line in the VCF file weadd a binary string indicating the absence or presence ofeach variant in the single-cell samples or the referencepopulation sample. For each variant site in the populationsample, we identify variant sites in the single-cell sampleswith sufficient coverage depth (≥6X). From the binarystring we determine if the variant is present/absent in eachsingle cell relative to the population reference sample. Wedefine a variant as being detected if the reference allele isAB and the single-cell data are either AB or BB. The meandetection efficiencies for indels and SNVs are then com-puted across all of the single cells.
Data accessThe data from this study has been deposited into the Se-quence Read Archive (SRA) under accession SRP046355.
Additional files
Additional file 1: Figure S1. G1/0 and G2/M ploidy distributions inaneuploid breast tumors. Nuclei were prepared from frozen breasttumors and stained with DAPI. The nuclear suspensions were analyzed bycytometric analysis showing the distributions of total DNA content. Theaneuploid distributions are highlighted for G1/0 and the correspondingG2/M populations in each frozen tumor sample.
Additional file 2: Table S1. Chromosome specific qPCR primers.Summary table of the chromosome-specific primer panel DNA sequencesthat are used to perform quality control of the single cell WGA reactions.
Additional file 3: Table S2. Single nuclei exome sequencing metrics.Summary table for the coverage and sequencing metrics from single-cellexome sequencing of the G1/0 and G2/M fibroblast cells analyzed by SNES.
Additional file 4: Figure S2. Processing pipeline for variant detectionand annotation. (a) Reads from single-cell exome sequencing are processedby alignment to the human genome, followed by local realignment aroundindels and removal of PCR duplicates. (b) Error prone reads are filtered bymapping quality, clustering, coverage depth, and the number of variantreads, followed by variant detection using the Unified genotyper to detectSNVs and indels. (c) Multiple databases are integrated for annotation of thevariants and to predict the functional impact of the variant on the protein.
Additional file 5: Figure S3. Distribution of random FP errors alongchromosomes. The frequency of FP errors observed in each single cellare plotted along each chromosome. Frequency counts above four cellswere not observed (out of N = 19 cells), and therefore the y-axis scale hasshows a limit at four cells.
Additional file 6: Figure S4. Allelic dropout bias in single-cell data.Allelic dropout events were calculated from the single-cell exomedata and classified into two categories (AB to AA, and AB to BB). Thefrequency of AB to AA and AB to BB dropout events were calculated anddisplayed as a stacked histogram.
Leung et al. Genome Biology (2015) 16:55 Page 9 of 9
Additional file 7: Figure S5. Distribution of recurrent allelic dropoutevents along chromosomes. The frequency of allelic dropout errorsobserved in each single cell are plotted along each chromosome. ManyADO events are recurrent, occurring in multiple single cells.
Competing interestsThe authors declare that they have no competing interests.
Authors’ contributionsML conducted experiments, performed analysis, and prepared figures. YWperformed data analysis. JW performed experiments. NN performed dataanalysis and wrote the manuscript. All authors read and approved the finalmanuscript.
AcknowledgementsNN is a Nadia’s Gift Foundation Damon Runyon-Rachleff Innovator (DRR-25-13).This research was supported by grants to NN from NIH (R21CA174397-01) andNCI (1RO1CA169244-01). Funding for this project was also supported by the TCHsu Foundation and the Alice-Reynolds Kleberg Foundation. This study wassupported by grant from the Center for Genetics & Genomics to NN. The studywas supported by the MD Anderson Moonshot Knowledge Gap grant to NN.This work was also supported by the MD Anderson Sequencing Core FacilityGrant (CA016672). MLL is a CPRIT Graduate scholar (CPRIT RP140106) and issupported by the American Legion Auxiliary and Hearst Foundations. We thankMichael Wigler, James Hicks, and Linda Rodgers at the Cold Spring HarborLaboratory for reagents and advice. We thank Louis Ramagli, Hongli Tang,Kanhav Khanna, and Erika Thompson (MD Anderson Sequencing Core Facility),and Wendy Schober (Flow Core Facility). We thank Jessica Tyler for her support.
Received: 16 November 2014 Accepted: 18 February 2015
References1. Ramskold D, Luo S, Wang YC, Li R, Deng Q, Faridani OR, et al. Full-length
mRNA-Seq from single-cell levels of RNA and individual circulating tumorcells. Nat Biotechnol. 2012;30:777–82.
2. Tang F, Barbacioru C, Wang Y, Nordman E, Lee C, Xu N, et al. mRNA-Seqwhole-transcriptome analysis of a single cell. Nat Methods. 2009;6:377–82.
3. Islam S, Kjallquist U, Moliner A, Zajac P, Fan JB, Lonnerberg P, et al.Characterization of the single-cell transcriptional landscape by highlymultiplex RNA-seq. Genome Res. 2011;21:1160–7.
4. Hashimshony T, Wagner F, Sher N, Yanai I. CEL-Seq: single-cell RNA-Seq bymultiplexed linear amplification. Cell Rep. 2012;2:666–73.
5. Wang J, Fan HC, Behr B, Quake SR. Genome-wide single-cell analysis ofrecombination activity and de novo mutation rates in human sperm. Cell.2012;150:402–12.
6. Lohr JG, Adalsteinsson VA, Cibulskis K, Choudhury AD, Rosenberg M,Cruz-Gordillo P, et al. Whole-exome sequencing of circulating tumor cellsprovides a window into metastatic prostate cancer. Nat Biotechnol.2014;32:479–84.
7. Navin N, Kendall J, Troge J, Andrews P, Rodgers L, McIndoo J, et al. Tumourevolution inferred by single-cell sequencing. Nature. 2011;472:90–4.
8. Baslan T, Kendall J, Rodgers L, Cox H, Riggs M, Stepansky A, et al. Genome-widecopy number analysis of single cells. Nat Protoc. 2012;7:1024–41.
9. Hou Y, Song L, Zhu P, Zhang B, Tao Y, Xu X, et al. Single-cell exome sequencingand monoclonal evolution of a JAK2-negative myeloproliferative neoplasm. Cell.2012;148:873.
10. Zong C, Lu S, Chapman AR, Xie XS. Genome-wide detection of single-nucleotide and copy-number variations of a single human cell. Science.2012;338:1622–6.
11. Wang Y, Waters J, Leung ML, Unruh A, Roh W, Shi X, et al. Clonal evolutionin breast cancer revealed by single nucleus genome sequencing. Nature.2014;512:155–60.
12. Hicks J, Krasnitz A, Lakshmi B, Navin NE, Riggs M, Leibu E, et al. Novelpatterns of genome rearrangement and their association with survival inbreast cancer. Genome Res. 2006;16:1465–79.
13. Beroukhim R, Mermel CH, Porter D, Wei G, Raychaudhuri S, Donovan J, et al.The landscape of somatic copy-number alteration across human cancers.Nature. 2010;463:899–905.
14. Lorenz MO. Methods of measuring the concentration of wealth. J Am StatAssoc. 1905;9:209–19.
15. Hodges E, Xuan Z, Balija V, Kramer M, Molla MN, Smith SW, et al.Genome-wide in situ exon capture for selective resequencing. Nat Genet.2007;39:1522–7.
16. Cibulskis K, Lawrence MS, Carter SL, Sivachenko A, Jaffe D, Sougnez C, et al.Sensitive detection of somatic point mutations in impure andheterogeneous cancer samples. Nat Biotechnol. 2013;31:213–9.
17. McKenna A, Hanna M, Banks E, Sivachenko A, Cibulskis K, Kernytsky A,et al. The Genome Analysis Toolkit: a MapReduce framework for analyzingnext-generation DNA sequencing data. Genome Res. 2010;20:1297–303.
18. Dean FB, Hosono S, Fang L, Wu X, Faruqi AF, Bray-Ward P, et al.Comprehensive human genome amplification using multiple displacementamplification. Proc Natl Acad Sci U S A. 2002;99:5261–6.
19. Lasken RS. Single-cell genomic sequencing using Multiple DisplacementAmplification. Curr Opin Microbiol. 2007;10:510–6.
20. Xu X, Hou Y, Yin X, Bao L, Tang A, Song L, et al. Single-cell exome sequencingreveals single-nucleotide mutation characteristics of a kidney tumor. Cell.2012;148:886–95.
21. de Vega M, Lazaro JM, Mencia M, Blanco L, Salas M. Improvement of phi29DNA polymerase amplification performance by fusion of DNA bindingmotifs. Proc Natl Acad Sci U S A. 2010;107:16506–11.
22. Adey A, Morrison HG. Asan, Xun X, Kitzman JO, Turner EH, et al. Rapid,low-input, low-bias construction of shotgun fragment libraries byhigh-density in vitro transposition. Genome Biol. 2010;11:R119.
23. Wang Q, Gu L, Adey A, Radlwimmer B, Wang W, Hovestadt V, et al.Tagmentation-based whole-genome bisulfite sequencing. Nat Protoc.2013;8:2022–32.
24. Picelli S, Bjorklund AK, Reinius B, Sagasser S, Winberg G, Sandberg R. Tn5transposase and tagmentation procedures for massively scaled sequencingprojects. Genome Res. 2014;24:2033–40.
25. Marine R, Polson SW, Ravel J, Hatfull G, Russell D, Sullivan M, et al.Evaluation of a transposase protocol for rapid generation of shotgunhigh-throughput sequencing libraries from nanogram quantities of DNA.Appl Environ Microbiol. 2011;77:8071–9.
26. de Bourcy CF, De Vlaminck I, Kanbar JN, Wang J, Gawad C, Quake SR. Aquantitative comparison of single-cell whole genome amplificationmethods. PLoS One. 2014;9:e105585.
27. Gole J, Gore A, Richards A, Chiu YJ, Fung HL, Bushman D, et al. Massivelyparallel polymerase cloning and genome sequencing of single cells usingnanoliter microwells. Nat Biotechnol. 2013;31:1126–32.
28. Ni X, Zhuo M, Su Z, Duan J, Gao Y, Wang Z, et al. Reproducible copynumber variation patterns among single circulating tumor cells of lungcancer patients. Proc Natl Acad Sci U S A. 2013;110:21083–8.
29. Crasta K, Ganem NJ, Dagher R, Lantermann AB, Ivanova EV, Pan Y, et al.DNA breaks and chromosome pulverization from errors in mitosis. Nature.2012;482:53–8.
30. Langmead B, Trapnell C, Pop M, Salzberg SL. Ultrafast and memory-efficientalignment of short DNA sequences to the human genome. Genome Biol.2009;10:R25.
31. Li H, Handsaker B, Wysoker A, Fennell T, Ruan J, Homer N, et al. The SequenceAlignment/Map format and SAMtools. Bioinformatics. 2009;25:2078–9.
32. Picard Tools. [http://broadinstitute.github.io/picard/].33. Quinlan AR, Hall IM. BEDTools: a flexible suite of utilities for comparing
genomic features. Bioinformatics. 2010;26:841–2.