level 41 melbourne vic 3000 australia company ... · 9/6/2012 · )uhh fdvkÀrz5,197 5,477 6,225...
TRANSCRIPT

Telstra Corporation Limited ACN 051 775 556
ABN 33 051 775 556
6 September 2012 The Manager Company Announcements Office Australian Securities Exchange 4th Floor, 20 Bridge Street SYDNEY NSW 2000
Office of the Company Secretary Level 41 242 Exhibition Street MELBOURNE VIC 3000 AUSTRALIA General Enquiries 08 8308 1721 Facsimile 03 9632 3215
ELECTRONIC LODGEMENT Dear Sir or Madam Telstra Corporation Limited – 2012 Annual Report In accordance with the listing rules, I attach a copy of the 2012 Annual Report which will be sent to shareholders shortly. Yours faithfully
Damien Coleman Company Secretary
For
per
sona
l use
onl
y

IT’S HOW WE CONNECTTELSTRA 2012 ANNUAL REPORT
TELSTRA 2012 A
NNUAL R
EPORT
For
per
sona
l use
onl
y

ANNUAL REPORT
Becoming an e-ShareholderTelstra encourages shareholders to elect to receive their communications electronically. By providing your email address you will receive your dividend statements, Notice of the Annual General Meeting and Shareholder Updates (including summary
is also important if we want to communicate with you at short notice in relation to current issues.
Please refer to the Managing my Telstra Shareholding Online section below for instructions on how to do this.
Please contact our share registry on 1300 88 66 77 or email [email protected] should you require any further information relating to your shareholding.
Managing my Telstra Shareholding Online1. Go to www.linkmarketservices.com.au/telstra2. Enter your SRN/HIN (this can be found on
your latest dividend statement), your post code, the security code displayed and read and accept the terms and conditions.
Use the following sections to help you locate information about your Telstra holding(s):
Holdings – here you can access your transaction history, holding balance, holding value and see the last closing share price.
Payment & Tax – here you can access your dividend payment history, payment instructions and your TFN. Shareholders can update bank details here.
Communication – use this section to become an e-Shareholder. You can update your postal address, email address and communication elections here.
Annual ReportTelstra’s 2012 Annual Report is available to all shareholders on our Investor Website at www.telstra.com.au/annualreports. To receive a hardcopy of the statutory Annual Report (free of charge) you can call our Share Registry on 1300 88 66 77 and request the report be sent to you. You may also update your communication election online to receive future copies of the Annual Report. Please refer to the Managing my Telstra Shareholding online section for instructions on how to do this.
Communicating With Our ShareholdersOur online Investor Centre www.telstra.com/investor is an important tool for our shareholders where you can access all the latest news, information and shareholder communications faster. If you are an e-shareholder, we will let you know when there is something important for you to view or download.
Additional Sustainability ReportingSelected graphs and data presented in this report are included in our Bigger Picture sustainability reporting series. This series provides detailed information and analysis for our stakeholders on Telstra’s sustainability performance. We develop our reporting with reference to industry and sustainability standards including the United Nations Global Compact Communication on Progress, Global Reporting Initiative (GRI) G3 Sustainability Reporting Guidelines and Telecommunications Sector Supplement (pilot). The GRI Index and Bigger Picture series can be found online at www.telstra.com.au/sustainability.
Key Highlights i
Results ii
Chairman and CEO Message iv
Board of Directors vi
Our Business viii
Our Performance x
Improve Customer Satisfaction xRetain and Grow Customer xii Numbers Simplify the Business xivDevelop New Growth Businesses xvi
Sustainability xviii
Our Customers xxOur People xxii Our Communities xxiv Our Environment xxvi FULL ANNUAL REPORT 1
For
per
sona
l use
onl
y
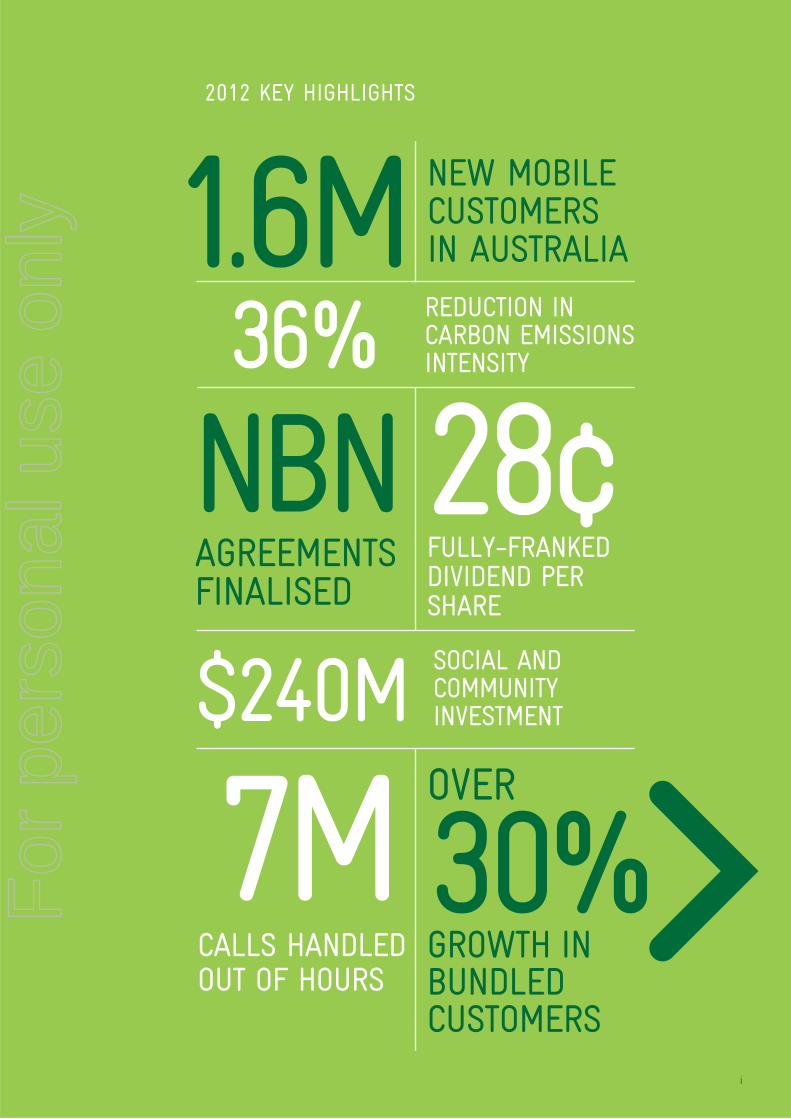
1.6M
7MOVER
30% GROWTH INBUNDLEDCUSTOMERS
NBN
NEW MOBILE CUSTOMERS IN AUSTRALIA
FULLY-FRANKED DIVIDEND PER SHARE
AGREEMENTSFINALISED
2012 KEY HIGHLIGHTS
i
SOCIAL AND COMMUNITY INVESTMENT
REDUCTION IN CARBON EMISSIONS INTENSITY
CALLS HANDLEDOUT OF HOURS
$240M
36%
28
For
per
sona
l use
onl
y

FINANCIAL RESULTS
FIVE YEAR SUMMARY
(1) Operat
2012$m
2011$m
2010$m
2009$m
2008$m
25,232 24,983 24,813 25,371 24,657 EBITDA(1) 10,234 10,151 10,847 10,948 10,416 EBIT(2) 5,822 5,692 6,501 6,558 6,226
3,424 3,250 3,940 4,076 3,711 28 28 28 28 28
39,525 37,913 39,282 39,962 37,922 17,222 16,232 16,031 17,036 16,285 13,277 13,595 13,926 15,655 15,385 11,689 12,292 13,008 12,681 12,245 3,591 3,410 3,471 4,598 4,897 5,197 5,477 6,225 4,365 3,855
FREE CASHFLOW
SALES REVENUE
2010
$24.8b
2012
$25.2b
2011
$25.0b
MOBILE REVENUE
PROFIT FOR THE YEAR
$3.9b
2010
$3.4b
2012
$3.3b
2011
$6.2b
2010
$5.2b
2012
$5.5b
2011
$8.7b
2012
$7.3b
2010
$7.9b
2011
ii
For
per
sona
l use
onl
y

2012 2011 2010
Score 7.2 7.3 6.9 6.8
Level 1 Complaints per month per 10,000 SIOs
1.9 3.1
Percentage of commitments completed 66% 75%
Survey score 77% 77% 75% 75%
Lost Time Injury Frequency Rate (LTIFR) 1.5 1.32 1.30 2.32
Women in executive management 25% 25.0% 22.7% 22.4%
Number of days 1,500 1,375
Participation rate 3.0% 2.7% 3.5%
Total (millions of dollars) Ongoing investment $239.8m $248.0m $262.1mEveryone Connected (targeted programmes) People impacted 101,500
Tonnes of carbon dioxide equivalent (tCO2e) Minimise our impact 1,676,925 1,659,714 1,687,777
tCO2e per terabyte of data 15% reduction to 1.64 1.24 1.93
Tonnes collected 14.3 17.3 18.9
NON-FINANCIAL RESULTSKEY PERFORMANCE INDICATORS
OUR PEOPLE
OUR CUSTOMERS
OUR COMMUNITY
OUR ENVIRONMENT
iii
OUR GOAL IS TO BRING THE SOCIAL AND THE ENVIRONMENTAL INTO THE HEART OF THE ORGANISATION IN WAYS THAT CREATE VALUE.F
or p
erso
nal u
se o
nly

WE CONTINUE TO FOCUS ON THE STRATEGIC PRIORITIES OF IMPROVING CUSTOMER SATISFACTION; RETAINING AND GROWING CUSTOMER NUMBERS; SIMPLIFYING THE BUSINESS AND DEVELOPING NEW GROWTH BUSINESSES. THESE PRIORITIES ARE DELIVERING POSITIVE RESULTS.
KEY OUTCOMES
and services.
NATIONAL BROADBAND NETWORK (NBN)
2012 HIGHLIGHTS
CHAIRMAN AND CEO MESSAGE
iv
For
per
sona
l use
onl
y

SUSTAINABILITY
the progress we have made on our
helping our most vulnerable
equipping our employees to build
wide environmental strategy and
the Telstra Foundation, with over
During 2012, through our Access for Everyone programme,
OUTLOOK*
to be around 15% of sales over the next two years as we plan to invest
v
Chairman
David ThodeyDavid Thodey
For
per
sona
l use
onl
y

BOARD OFDIRECTORS
CATHERINE B LIVINGSTONE
DAVID I THODEY
TIMOTHY Y CHEN
Committee.
GEOFFREY A COUSINS
Committees.
RUSSELL A HIGGINS
JOHN P MULLEN
Committee.
vi
For
per
sona
l use
onl
y

NORA L SCHEINKESTEL
MARGARET L SEALEBA, GAICD
JOHN W STOCKER STEVEN M VAMOSBEng (Hons)
JOHN D ZEGLIS
vii
For
per
sona
l use
onl
y

WHO WE ARETELSTRA IS A COMPANY OF CONNECTIONS. EVERY DAY WE HELP MILLIONS OF AUSTRALIANS CONNECT TO THE PEOPLE AND THINGS THAT MATTER MOST TO THEM.
INDUSTRY CONTEXTCONNECTIVITY IS DRIVING AN EXPLOSION IN DEMAND ON OUR NETWORKS.
OUR BUSINESS
viii
For
per
sona
l use
onl
y
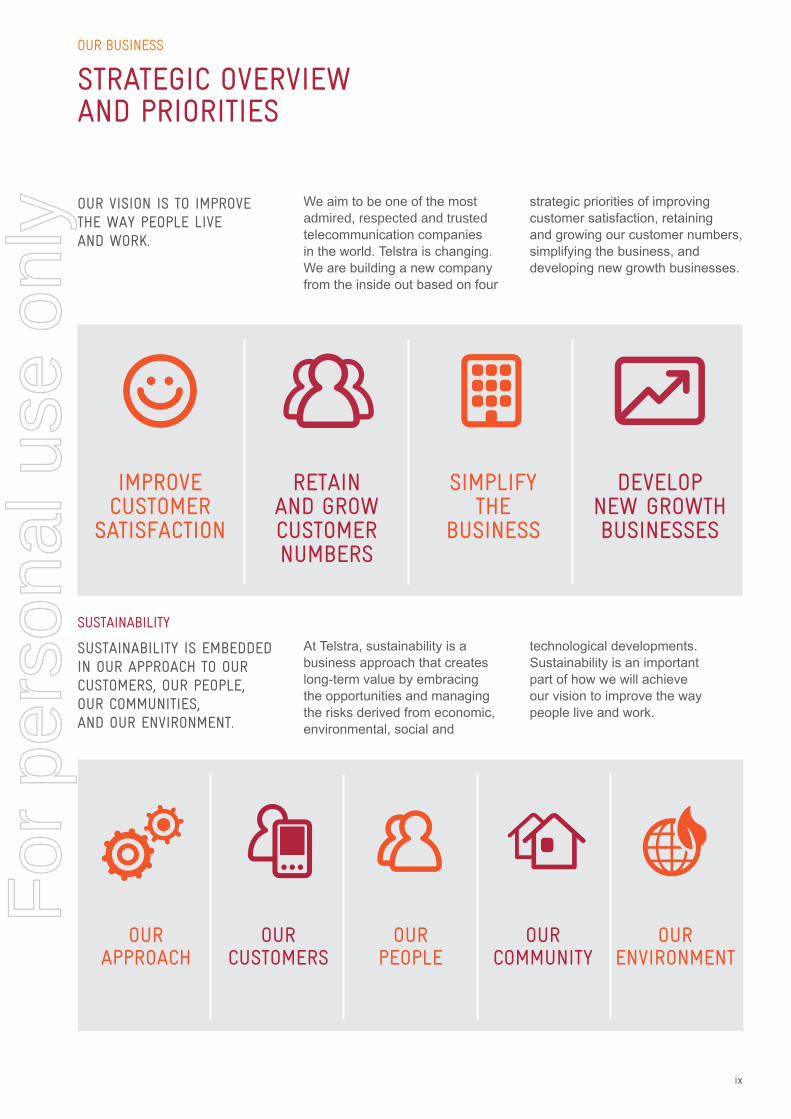
OUR VISION IS TO IMPROVE THE WAY PEOPLE LIVE AND WORK.
admired, respected and trusted
SUSTAINABILITY IS EMBEDDED IN OUR APPROACH TO OUR CUSTOMERS, OUR PEOPLE, OUR COMMUNITIES, AND OUR ENVIRONMENT.
OUR BUSINESS
STRATEGIC OVERVIEW AND PRIORITIES
SUSTAINABILITY
IMPROVE CUSTOMER
SATISFACTION
RETAIN AND GROW CUSTOMER NUMBERS
SIMPLIFY THE
BUSINESS
DEVELOP NEW GROWTH BUSINESSES
ix
OUR APPROACH
OUR CUSTOMERS
OUR PEOPLE
OUR COMMUNITY
OUR ENVIRONMENT
For
per
sona
l use
onl
y

OUR PERFORMANCE
IMPROVE CUSTOMER SATISFACTION
x
WE WANT OUR CUSTOMERS TO BECOME OUR GREATEST ADVOCATES. TO ACHIEVE THAT, WE HAVE TO WIN AND RETAIN THE TRUST OF OUR CUSTOMERS – ONE CUSTOMER AT A TIME.
iPad^ ^ and Android devices.
seen a 6 per cent improvement
OUR GOAL: TO DELIVER OUR CUSTOMERS A GREAT SERVICE EXPERIENCE. TO CONTINUE TO WORK HARD TO MAKE SURE THAT OUR CUSTOMERS ARE AT THE CENTRE OF EVERYTHING WE DO
For
per
sona
l use
onl
y

xi
TELSTRA HAS RECENTLY INTRODUCED THE NET PROMOTER SYSTEM (NPS) WHICH IS THE NEXT STAGE IN IMPROVING CUSTOMER SATISFACTION.
continuous improvement and
advocates.
ONLINE SERVICES ARE NOW AVAILABLE TO OUR CUSTOMERS 24 HOURS A DAY, SEVEN DAYS A WEEK.
FACEBOOK 24X7
CROWDSUPPORT
service options.
APPLICATIONS
iPad^ ^ and Android
NET PROMOTER SYSTEM
For
per
sona
l use
onl
y

OUR PERFORMANCE
RETAIN AND GROW CUSTOMER NUMBERS
xii
WE ARE GRATEFUL FOR THE MANY CUSTOMERS WHO CHOSE TELSTRA THIS YEAR. THE QUALITY OF OUR NETWORKS AND SERVICE IS A KEY DIFFERENTIATOR AND IS CONTINUING TO DRIVE GROWTH IN OUR BUSINESS.
investments continued to attract
our Next G®
important competitive advantage.
AUSTRALIANS NOW HAVE ACCESS TO ONE OF THE WORLD’S MOST ADVANCED MOBILE NETWORKS DELIVERING SOME OF THE FASTEST MOBILE SPEEDS AVAILABLE.
OUR GOAL: RETAIN AND GROW OUR CUSTOMER NUMBERS TO DRIVE REVENUE GROWTH AND LONG TERM VALUE FOR OUR SHAREHOLDERS
For
per
sona
l use
onl
y

xiii
$3.4b
® ®
®.
®
®
®
®.
service and customer support.
TELSTRA HAS ALSO STARTED TO PROVIDE SERVICES TO OUR CUSTOMERS ON THE NATIONAL BROADBAND NETWORK (NBN).
®
For
per
sona
l use
onl
y

OUR PERFORMANCE
SIMPLIFY THE BUSINESS
xiv
SIMPLIFYING THE BUSINESS IS A COMPANY-WIDE PROJECT THAT HAS HELPED CHANGE TELSTRA’S CULTURE.
our customers.
to provide innovative support to
product management and product
OUR GOAL: SIMPLIFY THE BUSINESS, IMPROVE CUSTOMER SERVICE AND SAVE UNNECESSARY COSTS
For
per
sona
l use
onl
y

xv
ONLINE
customer experience.
T-ANALYST
organising and managing
DIGITAL BILL
an iPad^ ^ or Android
For
per
sona
l use
onl
y

OUR PERFORMANCE
DEVELOP NEW GROWTH BUSINESSES
xvi
WE ARE LOOKING TO GROW THE TELSTRA BUSINESS, NOT JUST PROTECT OUR CURRENT MARKET SHARE.
domestic directories and advertising
®, ®, and our investment
MOG, a next generation music
media services in auto, IT and
OUR GOAL: TO DEVELOP GROWTH BUSINESSES IN THE AREAS OF NETWORK APPLICATIONS AND SERVICES, MEDIA AND INTERNATIONAL
For
per
sona
l use
onl
y

xvii
COCA-COLA AMATIL AND NAS
COCA-COLA AMATIL (CCA), ONE OF THE WORLD’S TOP FIVE COCA-COLA BOTTLERS, IS A TRUE NAS CUSTOMER.
50 per cent in some venues.
The Clever Australian
For
per
sona
l use
onl
y

OUR PERFORMANCE
SUSTAINABILITY – CONDUCTING OUR BUSINESS RESPONSIBLY
xviii
FOR TELSTRA, SUSTAINABILITY IS A BUSINESS APPROACH THAT CREATES LONG-TERM VALUE BY EMBRACING THE OPPORTUNITIES AND MANAGING THE RISKS DERIVED FROM ECONOMIC, ENVIRONMENTAL, SOCIAL AND TECHNOLOGICAL DEVELOPMENTS. SUSTAINABILITY IS AN IMPORTANT PART OF HOW WE WILL ACHIEVE OUR VISION TO IMPROVE THE WAY PEOPLE LIVE AND WORK.
SUSTAINABILITY GOVERNANCE
reports on progress are provided
UNITED NATIONS GLOBAL COMPACT
and our communication on
OUR GOAL: TO BRING THE SOCIAL AND THE ENVIRONMENTAL INTO THE HEART OF THE ORGANISATION IN WAYS THAT CREATE VALUE
www.telstra.com.au/sustainability
For
per
sona
l use
onl
y

xix
TELSTRA SUSTAINABILITY FRAMEWORK
TELSTRA’S SUSTAINABILITY FRAMEWORK IS BUILT AROUND FIVE KEY PILLARS AND INDICATES OUR BROAD GOALS AND KEY SUSTAINABILITY ISSUES.
For
per
sona
l use
onl
y

AS AUSTRALIA’S LARGEST TELCO, WE ARE COMMITED TO KEEPING THE CUSTOMER AT THE CENTRE OF EVERYTHING WE DO.
EVERYONE CONNECTED
Everyone Connected customer programmes
and communities most in need.
Income Measure Assessment Committee (LIMAC) – comprising
Communications.
Customers experiencing disadvantage
Access for Everyone
Bill Assistance
Access for Everyone
Disability Action Plan 2010-2012
Customers in remote Indigenous communities
xx
OUR GOAL: TO ENSURE THAT ALL AUSTRALIANS ENJOY THE EVERYDAY BENEFITS OF BEING CONNECTED TO MODERN COMMUNICATION TECHNOLOGIES
OUR PERFORMANCE
SUSTAINABILITY – PUTTING CUSTOMERS AT THE CENTRE
For
per
sona
l use
onl
y

CYBER SAFETY
PRIVACY PROTECTION
impacted customers and put in
xxi
CELEBRATING TEN YEARS OF ACCESS FOR EVERYONE
our Access for Everyone programmes,
Access for Everyone,
83
16.78
ACCESS FOR EVERYONE
CHARITY AND NON-PROFIT DISCOUNT
DISABILITY SUPPORT
0.22
EVERYONE CONNECTED – CUSTOMER PROGRAMMES% OF TOTAL INVESTMENT
80,000 customers
For
per
sona
l use
onl
y

OUR PERFORMANCE
SUSTAINABILITY – BEING A GOOD EMPLOYER
xxii
OUR GOAL: TO ATTRACT AND BUILD A WORLD-CLASS TALENT BASE AND CREATE A HIGH-PERFORMING, CUSTOMER-CENTRIC CULTURE
OUR AIM IS TO CREATE A WORKPLACE CULTURE THAT SUPPORTS OUR TRANSFORMATION TO A MORE EFFICIENT, INNOVATIVE AND CUSTOMER-CENTRIC BUSINESS.
CULTURE & EMPLOYEE ENGAGEMENT
HEALTH, SAFETY & WELLBEING
GENDER DIVERSITY
Executive Directors to 30 per
For
per
sona
l use
onl
y
xxiii
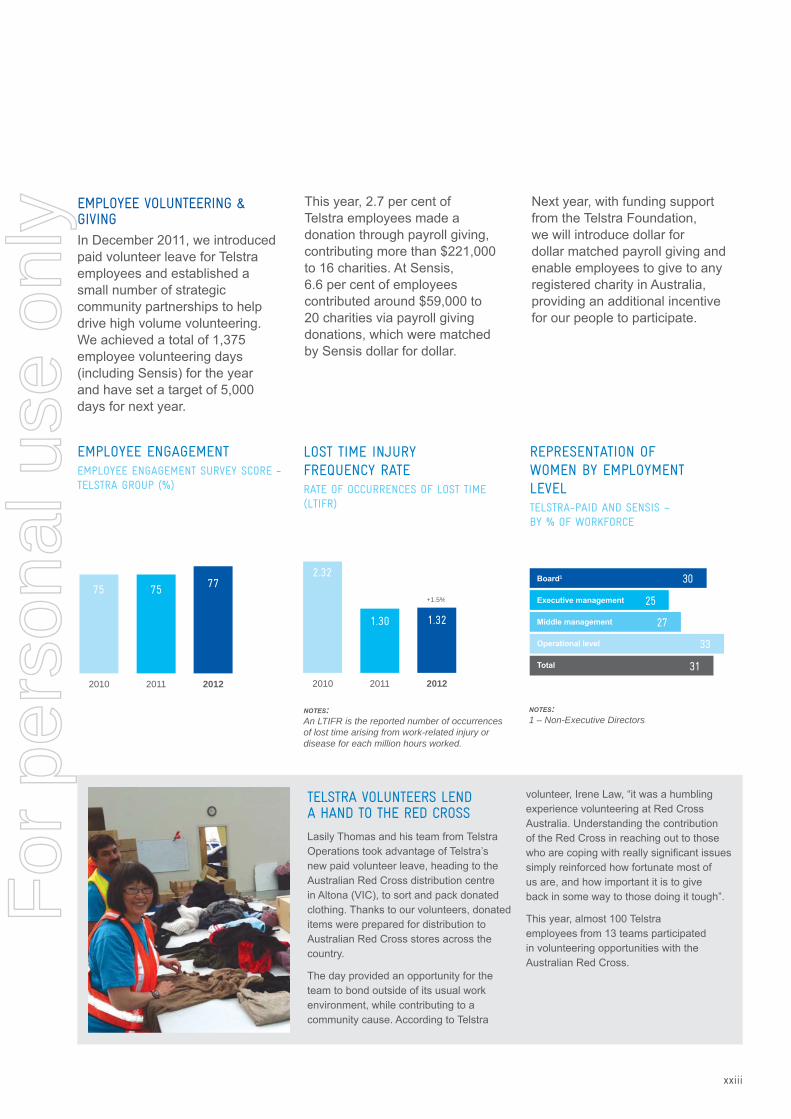
TELSTRA VOLUNTEERS LEND A HAND TO THE RED CROSS
EMPLOYEE ENGAGEMENTEMPLOYEE ENGAGEMENT SURVEY SCORE - TELSTRA GROUP (%)
LOST TIME INJURY FREQUENCY RATE RATE OF OCCURRENCES OF LOST TIME (LTIFR)
REPRESENTATION OF WOMEN BY EMPLOYMENT LEVEL TELSTRA-PAID AND SENSIS – BY % OF WORKFORCE
NOTES: 1 – Non-Executive Directors
NOTES: An LTIFR is the reported number of occurrences of lost time arising from work-related injury or disease for each million hours worked.
75 75 77
2010 2011 2012
2.32
1.30 1.32
2010 2011 2012
+1.5%
EMPLOYEE VOLUNTEERING & GIVING
30
31
25
27
33
1
For
per
sona
l use
onl
y
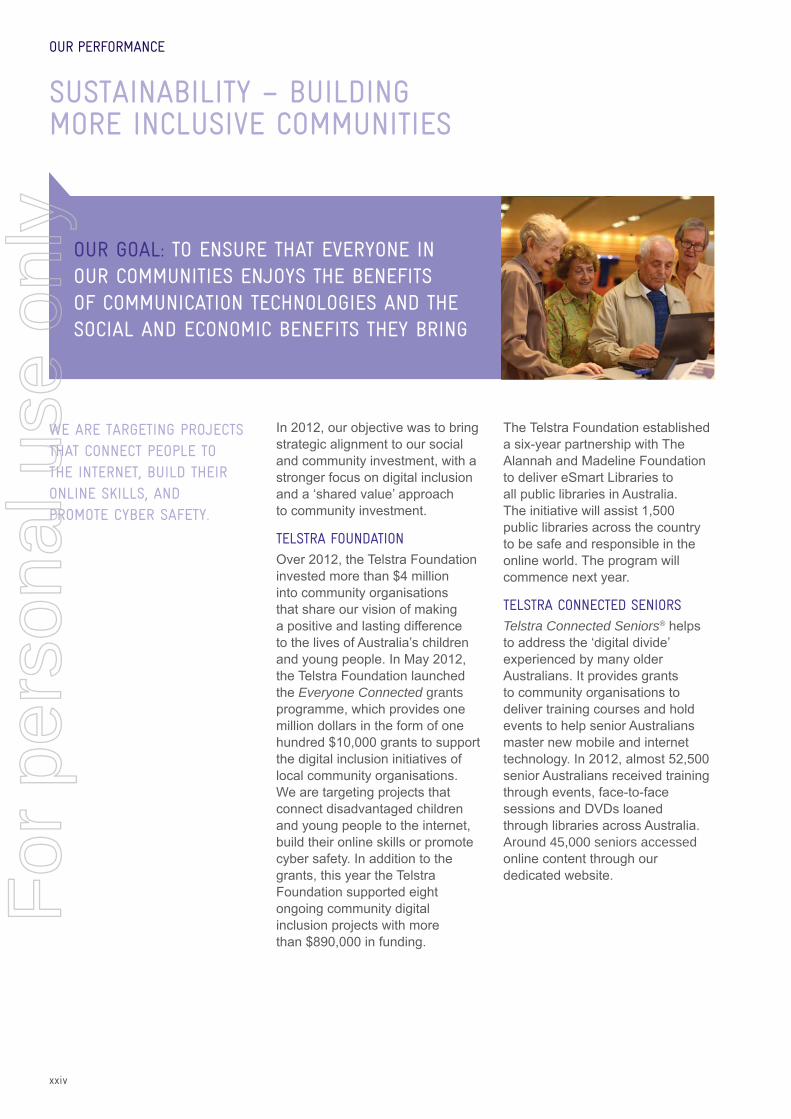
WE ARE TARGETING PROJECTS THAT CONNECT PEOPLE TO THE INTERNET, BUILD THEIR ONLINE SKILLS, AND PROMOTE CYBER SAFETY.
TELSTRA FOUNDATION
Everyone Connected grants
TELSTRA CONNECTED SENIORSTelstra Connected Seniors®
Around 45,000 seniors accessed
OUR PERFORMANCE
SUSTAINABILITY – BUILDING MORE INCLUSIVE COMMUNITIES
xxiv
OUR GOAL: TO ENSURE THAT EVERYONE IN OUR COMMUNITIES ENJOYS THE BENEFITS OF COMMUNICATION TECHNOLOGIES AND THE SOCIAL AND ECONOMIC BENEFITS THEY BRING
For
per
sona
l use
onl
y

RECONCILIATION ACTION
Palm Island Early Learning Program
provided $300,000 to continue our
prestigious Indigenous art
DISASTER RELIEF & RECOVERY
xxv
TELSTRA FOUNDATION CELEBRATES A DECADE OF SUPPORTING COMMUNITIES
past decade.
SOCIAL AND COMMUNITY INVESTMENT BY FOCUSDOLLAR INVESTMENT (MILLIONS) AND PERCENTAGE OF TOTAL
DESCRIPTION: Everyone Connected
Access for Everyone
$216.42m – 90.2%
Everyone Connected
$4.75m – 2.0%
Amount % of totalIssue invested investment
Digital inclusion $221.16 92.2%
Employee community involvement $2.35 1.0%
Sponsorship $13.02 5.4%
Environment $0.61 0.3%
Disaster relief $0.06 <0.1%
Management costs $2.59 1.1%
TOTAL $239.8
For
per
sona
l use
onl
y

WE ACTIVELY MINIMISE THE ENVIRONMENTAL IMPACTS OF OUR OPERATIONS AND SUPPORT OUR CUSTOMERS TO ENHANCE THEIR ENVIRONMENTAL PERFORMANCE.
ENERGY EFFICIENCY & CARBON EMISSIONS
15 per cent reduction in emissions
(tCO2
continued improvements in our
HELPING OUR CUSTOMERS TO REDUCE THEIR CARBON EMISSIONS
customer Green ICT Management
to procurement, construction,
management.
OUR PERFORMANCE
SUSTAINABILITY – REDUCING OUR ENVIRONMENTAL IMPACT
xxvi
OUR GOAL: TO DO MORE FOR OUR CUSTOMERS WHILE ACTIVELY MANAGING AND MINIMISING OUR ENVIRONMENTAL IMPACTS AND RESOURCE INTENSITY
For
per
sona
l use
onl
y

xxvii
TELSTRA GETS QANTAS PILOTS OFF THE GROUND WITH IPADS^
^
^
^
iPads^
TOTAL CARBON EMISSIONS AND INTENSITY (SCOPE 1, 2 & 3)TONNES OF CARBON DIOXIDE EQUIVALENT (tCO2e)
201220112010
1,68
7,77
7
1,65
9,71
4
1,67
6,92
5
+1%
CARBON EMISSIONS INTENSITYTONNES OF CARBON DIOXIDE EQUIVALENT PER TERABYTE (tCO2e/TB)
20122011
1.93
1.24
-36%
PAPER USE – SENSIS PRINT DIRECTORIES
E-WASTE
For
per
sona
l use
onl
y

UNLOCK AMAZING NATIONAL BROADBAND NETWORK
xxviii
ON FEBRUARY 28 WE LAUNCHED TELSTRA’S POPULAR NATIONAL BUNDLES FOR CONSUMER CUSTOMERS ON THE NBN IN THE FIVE FIRST RELEASE SITES IN ARMIDALE AND KIAMA IN NSW, WILLUNGA IN SA, TOWNSVILLE AND MELBOURNE’S INNER CITY SUBURB OF BRUNSWICK. IN JUNE, WE WELCOMED OUR FIRST TASMANIAN CUSTOMERS ON THE NBN IN TRIABUNNA AND SORELL.
extensive customer education
reassurance to our customers, and
progresses.
For
per
sona
l use
onl
y

1
Telstra Corporation Limited and controlled entities
Contents
1. Full year results and operations review June 2012 . . . . . . . . . . . . . . . . . . . . . . . . . . . . . . . . . . . . . 3
2. Corporate Governance and Board Practices . . . . . . . . . . . . . . . . . . . . . . . . . . . . . . . . . . . . . . . . 23
3. Shareholder Information . . . . . . . . . . . . . . . . . . . . . . . . . . . . . . . . . . . . . . . . . . . . . . . . . . . 38
4. Directors’ Report . . . . . . . . . . . . . . . . . . . . . . . . . . . . . . . . . . . . . . . . . . . . . . . . . . . . . . . 40
5. Remuneration Report . . . . . . . . . . . . . . . . . . . . . . . . . . . . . . . . . . . . . . . . . . . . . . . . . . . . 51
6. Financial Report . . . . . . . . . . . . . . . . . . . . . . . . . . . . . . . . . . . . . . . . . . . . . . . . . . . . . . . 71
For
per
sona
l use
onl
y

Telstra Corporation Limited and controlled entities
2
® Registered trade mark of Telstra Corporation Limited™ Trade mark of Telstra Corporation Limited^ Trade mark of Apple IncFOXTEL marks are used under licence by FOXTEL Management Pty Ltd.
All amounts are expressed in Australian dollars ($A) unless otherwise stated.
For
per
sona
l use
onl
y

Full year results and operations review - June 2012
Telstra Corporation Limited and controlled entities
3
FY 2012 ($m)
FY 2011 ($m)
YoY change
Sales Revenue 25,232 24,983 1.0%
Total Revenue 25,368 25,093 1.1%
Operating Expenses 15,269 15,154 0.8%
EBITDA 10,234 10,151 0.8%
Depreciation & Amortisation 4,412 4,459 -1.1%
EBIT 5,822 5,692 2.3%
888 1,135 -21.8%
Tax 1,510 1,307 15.5%
Attributable NPAT 3,424 3,250 5.4%
Accrued capex 3,591 3,410 5.3%
5,197 5,477 -5.1%
SUMMARY FINANCIAL RESULTS REPORTED RESULTS
RESULTS ON A GUIDANCE BASIS*
CEO MESSAGE
adding 1.6 million Australian mobile customers.
service leading to strong customer retention and acquisition in the 12 months to 30 June 2012.
4G LTE coverage to more than 1,000 base stations serving more than 375,000 customers.
2012, returning $3.4 billion to shareholders.
We delivered on our commitments, met guidance and demonstrated greater resilience than other sectors in a
Capex to sales ratio of 14.2%
FY 2012 FY 2012 Guidance
Total revenue 1.3%
EBITDA 2.1%
Capex/sales 14.2% ~14%
$5.3bn $4.5 - 5.0bn
Dividend 28cps
TOTAL REVENUE GROWTH
FY09
2.7%
FY10
-2.3%
FY11
0.7%
FY12
1.1%
For
per
sona
l use
onl
y

Full year results and operations review - June 2012
Telstra Corporation Limited and controlled entities
4
KEY OUTCOMES AGAINST STRATEGIC PRIORITIESCustomer satisfaction
customers to understand charges, the introduction of an
via an Apple iPad^
improvements.
Growth in number of customers
1.6 million domestic mobile customers, to a total of 13.8 million;
million;336,000 customers on bundled plans, to a total of 1.4 million;475,000 Hong Kong mobile customers, to a total of 3.5 million.
Customers have activated more than 375,000 4G devices since launch.
Telstra’s domestic mobile business generated more than one third of revenue. Telstra has added more than three
6.1%.
Telstra’s business improvement programme remained on
enabling reinvestment in customer service initiatives. These
interactions.
Growth opportunities
signed providing a strong foundation for 2013. Major
Department of Human Services, Australia Post and NAB.
the move to online accelerated. Customer response to Sensis’ digital offers improved in recent months across metro and non-metro regions. Excluding Sensis and advertising, digital media
the Hong Kong mobile services (CSL) business and global
from Reach.
NATIONAL BROADBAND NETWORK (NBN)
commenced providing long term infrastructure access under
release sites.
HALF YEARLY REPORTED RESULTS
H2 2012 YoY change
H1 2012 YoY change
H2 2011 YoY change
H1 2011 YoY change
H2 2010 YoY change
Sales revenue 0.8% 1.2% 1.8% -0.5% -1.9%
Total revenue 1.1% 1.1% 1.9% -0.5% -1.7%
Operating expenses 2.6% -1.0% 3.0% 10.7% -1.8%
EBITDA -1.6% 3.7% 0.7% -13.9% -1.5%
-4.8% 22.5% -0.5% -36.0% -4.7%
For
per
sona
l use
onl
y

Full year results and operations review - June 2012
Telstra Corporation Limited and controlled entities
5
CAPITAL MANAGEMENT
to invest around $500 million of excess cash into its mobile
Telstra is not contemplating capital management initiatives at this time.
FINANCIAL OUTLOOK
expects capital expenditure to be around 15% of sales over
the sale of businesses and the cost of spectrum purchases. The foreign exchange impairment on TelstraClear expected on completion is also excluded.
is subject to the Board’s normal approval process for dividend declaration and there being no unexpected material events.
REPORTED RESULTS
or $275 million to $25,368 million.
Operating Expenses (before depreciation and amortisation)
a result of the impact of a movement in the government
substitution expense. Excluding the impact of the bond rate movement, labour and labour substitution expense decreased
Earnings before interest, tax, depreciation and amortisation
adjustments.
sales.
trade excluding entitlement to the dividend on 20 August 2012
PRODUCT PERFORMANCE
Measure Fiscal 2013 Guidance
Total income
EBITDA
Capex/sales Around 15%
$4.75-$5.25 billion
Dividend
FY 2013 GUIDANCE SUMMARY*
*
cost of spectrum purchases. The foreign exchange impairment on TelstraClear expected on completion is also excluded.
KEY PRODUCT REVENUE
FY 2012 ($m)
FY 2011 ($m)
YoY change
Fixed 7,488 7,972 -6.1%
Mobile 8,668 7,989 8.5%
Data and IP 3,122 3,147 -0.8%
NAS 1,263 1,143 10.5%
International 1,496 1,398 7.0%
Digital Media 2,377 2,629 -9.6%
For
per
sona
l use
onl
y

Full year results and operations review - June 2012
Telstra Corporation Limited and controlled entities
6
FIXED
continued PSTN revenue decline.
million.
a strong result given the intense competitive landscape, and
migrate their services to Telstra’s Unconditioned Local Loop (ULL) product.
revenue.
periods. Calling revenue deteriorated further as customer
their plan.
PSTN EBITDA margins increased one percentage point to
points to 37%.
MOBILE
million domestic mobile customers added. The breadth and ®
our customer service, focusing our brand and product
ultra-fast 4G LTE devices (smartphones, tablets and mobile broadband). Since launching 4G services in September,
cities and airports.
million postpaid handheld and 3.1 million mobile broadband
the impact of MRO, postpaid handheld ARPUs increased
FIXED BROADBAND REVENUE GROWTH
FY09
10.5%
FY10
1.8%
FY11
-2.9%
FY12
2.9%
MOBILE
GR
OW
TH
FIXED
FY12 PRODUCT SALES REVENUE BREAKDOWN
12%
Other 4%PSTN
Fixed Broadband
Mobile
IP & Data
NAS
Media
Other Fixed
International19%
6%
8%
3%
34%
5%
9%
For
per
sona
l use
onl
y

Full year results and operations review - June 2012
Telstra Corporation Limited and controlled entities
7
reduction in reported postpaid handheld ARPU in the current
include an unlimited SMS bundle. A reduction in mobile
on interconnection revenue. A larger positive impact from the
handheld deactivation rate improving to 12.2%.
Strong cost control has had a positive impact on mobile
DATA & IP
solutions increases in both the Enterprise and Small Business
not enough to offset the decline in ISDN and traditional data product revenues.
NETWORK APPLICATIONS & SERVICES
Department of Human Services, NAB and Australia Post.
for large organisations. These contracts are a testament to the trust corporations are placing in us to design, build and
The NAS sales pipeline remains strong. We are encouraged
as our participation in the rollout of NBN trial sites.
INTERNATIONAL
or $98 million to $1,496 million. This portfolio comprises the Hong Kong mobile services (CSL) business, the Telstra Global business and a number of digital media businesses in China.
24.5% to $508 million.
DIGITAL MEDIA
or $252 million to $2,377 million. This portfolio includes our domestic media assets and our Sensis directories business. Digital media revenue, excluding the Sensis and advertising
T-Box®
cable for FOXTEL services.
relates to the migration of the Sensis customer base from
MOBILE CUSTOMER ADDS (‘000)
FY09
856
FY10
364
FY11
1,668
FY12
1,567
For
per
sona
l use
onl
y

Full year results and operations review - June 2012
Telstra Corporation Limited and controlled entities
8
the rationalisation of our contact centre activities. These
GOODS AND SERVICES PURCHASED
in March 2011.
OTHER EXPENSES
discussed above and other service contracts and agreements.
charges and general and administration expenses.
Service contracts and agreements (excluding labour
an impairment in the LMobile Group of $56 million announced
EXPENSE PERFORMANCE
LABOUR Total labour and labour substitution expenses increased
compensation provisions. Short term incentive provisions also increased due to a better performance against targets.
inbound call volumes. IT professional services costs also
external suppliers.
OPERATING EXPENSES
FY 2012 ($m)
FY 2011 ($m)
YoY change
Labour 4,061 3,924 3.5%
Goods and services purchased 6,179 6,183 -0.1%
Other expenses 5,029 5,047 -0.4%
Total operating expenses 15,269 15,154 0.8%
PRODUCT PROFITABILITY - EBITDA MARGINS
FY 2012
FY 2011
H2 2012
H1 2012
H2 2011
Mobile 36% 33% 39% 34% 36%
Fixed Broadband 37% 31% 38% 35% 31%
PSTN 60% 59% 60% 60% 59%
Data and IP 64% 64% 64% 63% 64%
Sensis 47% 56% 60% 25% 65%
Telstra Group 40.6% 40.6% 40.6% 38.3% 43.8%
For
per
sona
l use
onl
y

Full year results and operations review - June 2012
Telstra Corporation Limited and controlled entities
9
levels of consumer debt defaults and an improved remediation of long outstanding debt. General and administration
FINANCE COSTS
the prior corresponding period.
due to a reduction in the volume of average net debt and a reduction in the average interest cost (from 7.22% to 7.01%).
a decrease of $24 million relating to capitalised interest.
FINANCIAL POSITION
CAPITAL EXPENDITURE AND CASH FLOW
and online self-serve channels, and order management for complex products. We have also increased our investment in initiatives to prepare us for the transition to NBN including remediation activities.
cash receipts of $300 million (net of tax) relating to the Information Campaign and Migration Deed and $100 million
increase in our cash used in investing activities. The increase
from the sale of investments after the sale of Soufun in the
acquisition of Austar and higher cash capital expenditure.
DEBT POSITION
an increase of $990 million from 30 June 2011. The increase
debt maturities.
a decrease of $318 million from 30 June 2011. The net debt
of $1,308 million. Our net debt gearing ratio (net debt to
range for net debt gearing ratio.
STATEMENT OF FINANCIAL POSITION
public bond issues totalling A$2,250 million (€1,750 million)
A$252 million (CHF 225 million) maturing in 2018. Some pre-
acquisition has also resulted in an increase to trade and
receivables.
and equipment and intangible assets declined as ongoing depreciation and retirements exceed the level of additions.
as a result of a shareholder loan to Foxtel and higher mobile
from measuring to fair value.
staff retraining.
FINANCIAL SETTINGS
Actual Target range
Debt Servicing 1.3x 1.5x to 1.9x
Gearing 53.2% 50% to 70%
Interest cover 10.3x >7x
For
per
sona
l use
onl
y

Full year results and operations review - June 2012
Telstra Corporation Limited and controlled entities
10
We report our segment information on the same basis as our
contribution excludes the effects of inter-segment balances
our Corporate areas, rather than being allocated to each
reporting period.
Further details about the performance of our business
TELSTRA CONSUMER AND COUNTRY WIDE
providing a full range of telecommunication products and services to consumer customers in metropolitan, regional, rural and remote areas of Australia.
SEGMENT PERFORMANCE
customer base of 12.8%, or 1.017 million. The success of our
TELSTRA BUSINESSTelstra Business is a business partner and one-stop shop providing communications solutions to small and medium
$3,523 million. The rate of EBITDA decline has improved
SEGMENT REVENUE SEGMENT EBITDA CONTRIBUTION
FY 2012 ($m)
FY 2011 ($m)
YoY change
Telstra Consumer and 10,267 9,915 3.6%
Telstra Business 4,676 4,720 -0.9%
Telstra Enterprise and Government 4,325 4,142 4.4%
Telstra Wholesale 2,101 2,194 -4.2%
Telstra Media Group 1,741 1,978 -12.0%
Telstra International Group 1,643 1,336 23.0%
TelstraClear 502 514 -2.3%
Telstra Operations 73 113 -35.4%
Other 79 231 -65.8%
Total Telstra segments 25,407 25,143 1.0%
Other items excluded from segment results 96 161 -40.4%
Total Telstra Group (reported) 25,503 25,304 0.8%
FY 2012 ($m)
FY 2011 ($m)
YoY change
Telstra Consumer and 5,467 5,075 7.7%
Telstra Business 3,523 3,554 -0.9%
Telstra Enterprise and Government 3,453 3,331 3.7%
Telstra Wholesale 1,933 2,031 -4.8%
Telstra Media Group 764 999 -23.5%
Telstra International Group 312 230 35.7%
TelstraClear 99 84 17.9%
Telstra Operations -3,679 -3,744 -1.7%
Other -1,544 -1,506 2.5%
Total Telstra segments 10,328 10,054 2.7%
Other items excluded from segment results -94 97 -196.9%
Total Telstra Group (reported) 10,234 10,151 0.8%
For
per
sona
l use
onl
y

Full year results and operations review - June 2012
Telstra Corporation Limited and controlled entities
11
TELSTRA ENTERPRISE AND GOVERNMENTTelstra Enterprise and Government (TE&G) is a leading
million. TE&G has delivered another strong mobile services
acquisition and NAS costs.
TELSTRA WHOLESALETelstra Wholesale is responsible for the provision of telecommunication products and services delivered over
Telstra branded carriers, carriage service providers and internet service providers.
Income generated from our Wholesale business declined
impacts compounded the ongoing loss of resale revenue,
30,000 as carriers migrated to ULL services. Wholesale Line
102,000 Wholesale DSL lines. External expenses increased
TELSTRA OPERATIONS
revenue generating activities of our other segments. The
and Services.
TELSTRA MEDIA GROUP
and manage the transition to digital at our Sensis directories business. This group is responsible for the management and
and includes the management of leading information brands ®, White Pages®, and our investment in
Digital Media content and the FOXTEL partnership.
On a segment reporting basis, TMG external income aligns
the Consumer segment, and also includes distributions from FOXTEL, recognised in Other Revenue. The TMG EBITDA
due to the continued streamlining of the business.
TMG is provided in the Digital Media products section of this document.
TELSTRACLEAR
service telecommunications, products and services to the
number of months.
from the prior corresponding period. This result excludes the
TelstraClear.
TELSTRA INTERNATIONAL GROUPTelstra International Group encompasses our international
Kong mobile operator, CSL; our mainland China businesses
China, India, Europe and Africa, and has a total of 14 carrier
International Group as a result of the Reach transaction,
International product revenue of $1,496 million. Further
International Group is provided in the International product section of this document.
OTHERFor
per
sona
l use
onl
y

Telstra Corporation Limited and controlled entities
12
Full year results and operations review - June 2012
(i) Other revenue primarily consists of distributions received from FOXTEL and rental income.(ii) Other income includes gains and losses on asset and investment sales, USO levy receipts, subsidies and other miscellaneous items.(iii) Basic and diluted earnings per share are impacted by the effect of shares held in trust for employee share plans and instruments held under executive remuneration
plans.
Results of operations
Year ended 30 June2012 2011 Change Change
$m $m $m %
Sales revenue . . . . . . . . . . . . . . . . . . . . . . . . . . . . . . . . . . . . . 25,232 24,983 249 1.0Other revenue (i) . . . . . . . . . . . . . . . . . . . . . . . . . . . . . . . . . . . . 136 110 26 23.6Total revenue . . . . . . . . . . . . . . . . . . . . . . . . . . . . . . . . . . . . . . 25,368 25,093 275 1.1Other income (ii) . . . . . . . . . . . . . . . . . . . . . . . . . . . . . . . . . . . . 135 211 (76) (36.0)Total income (excl. finance income) . . . . . . . . . . . . . . . . . . . . . . . . . 25,503 25,304 199 0.8
Labour . . . . . . . . . . . . . . . . . . . . . . . . . . . . . . . . . . . . . . . . . 4,061 3,924 137 3.5Goods and services purchased . . . . . . . . . . . . . . . . . . . . . . . . . . . . 6,179 6,183 (4) (0.1)Other expenses . . . . . . . . . . . . . . . . . . . . . . . . . . . . . . . . . . . . 5,029 5,047 (18) (0.4)Operating expenses . . . . . . . . . . . . . . . . . . . . . . . . . . . . . . . . . . 15,269 15,154 115 0.8Share of net profit from jointly controlled and associated entities . . . . . . . . . . . 0 (1) 1 100.0Earnings before interest, income tax expense, depreciation and amortisation (EBITDA) . . . . . . . . . . . . . . . . . . . . . . . . . . . . . . . . . . . . . . . . 10,234 10,151 83 0.8Depreciation and amortisation . . . . . . . . . . . . . . . . . . . . . . . . . . . . . 4,412 4,459 (47) (1.1)Earnings before interest and income tax expense (EBIT) . . . . . . . . . . . . . 5,822 5,692 130 2.3Net finance costs . . . . . . . . . . . . . . . . . . . . . . . . . . . . . . . . . . . . 888 1,135 (247) (21.8)Profit before income tax expense . . . . . . . . . . . . . . . . . . . . . . . . . . 4,934 4,557 377 8.3Income tax expense . . . . . . . . . . . . . . . . . . . . . . . . . . . . . . . . . . 1,510 1,307 203 15.5Profit for the period . . . . . . . . . . . . . . . . . . . . . . . . . . . . . . . . . . 3,424 3,250 174 5.4
Attributable to:Equity holders of the Telstra Entity . . . . . . . . . . . . . . . . . . . . . . . . . . . 3,405 3,231 174 5.4Non-controlling interests . . . . . . . . . . . . . . . . . . . . . . . . . . . . . . . . 19 19 0 0.0
3,424 3,250 174 5.4
Effective tax rate . . . . . . . . . . . . . . . . . . . . . . . . . . . . . . . . . . . . 30.6% 28.7% 1.9 ppEBITDA margin on sales revenue . . . . . . . . . . . . . . . . . . . . . . . . . . . 40.6% 40.6% 0.0 ppEBIT margin on sales revenue . . . . . . . . . . . . . . . . . . . . . . . . . . . . . 23.1% 22.8% 0.3 pp
cents centsChange
centsChange
%Basic earnings per share (iii) . . . . . . . . . . . . . . . . . . . . . . . . . . . . . . 27.5 26.1 1.4 5.4%Diluted earnings per share (iii) . . . . . . . . . . . . . . . . . . . . . . . . . . . . . 27.4 26.1 1.3 5.0%
Dividends per ordinary share:Interim dividend . . . . . . . . . . . . . . . . . . . . . . . . . . . . . . . . . . . . 14.0 14.0Final dividend. . . . . . . . . . . . . . . . . . . . . . . . . . . . . . . . . . . . . . 14.0 14.0Total . . . . . . . . . . . . . . . . . . . . . . . . . . . . . . . . . . . . . . . . . . 28.0 28.0
For
per
sona
l use
onl
y
Telstra Corporation Limited and controlled entities
13
Full year results and operations review - June 2012
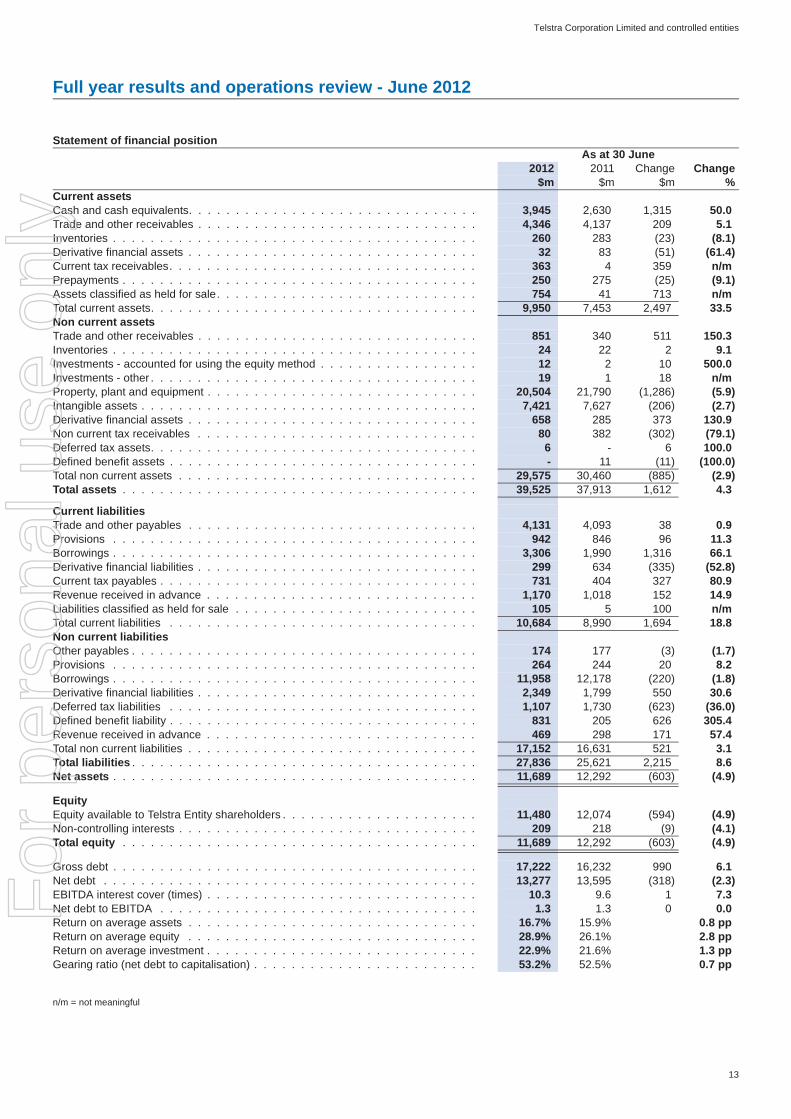
Statement of financial positionAs at 30 June
2012 2011 Change Change$m $m $m %
Current assetsCash and cash equivalents. . . . . . . . . . . . . . . . . . . . . . . . . . . . . . . 3,945 2,630 1,315 50.0Trade and other receivables . . . . . . . . . . . . . . . . . . . . . . . . . . . . . . 4,346 4,137 209 5.1Inventories . . . . . . . . . . . . . . . . . . . . . . . . . . . . . . . . . . . . . . . 260 283 (23) (8.1)Derivative financial assets . . . . . . . . . . . . . . . . . . . . . . . . . . . . . . . 32 83 (51) (61.4)Current tax receivables. . . . . . . . . . . . . . . . . . . . . . . . . . . . . . . . . 363 4 359 n/mPrepayments . . . . . . . . . . . . . . . . . . . . . . . . . . . . . . . . . . . . . . 250 275 (25) (9.1)Assets classified as held for sale. . . . . . . . . . . . . . . . . . . . . . . . . . . . 754 41 713 n/mTotal current assets. . . . . . . . . . . . . . . . . . . . . . . . . . . . . . . . . . . 9,950 7,453 2,497 33.5Non current assetsTrade and other receivables . . . . . . . . . . . . . . . . . . . . . . . . . . . . . . 851 340 511 150.3Inventories . . . . . . . . . . . . . . . . . . . . . . . . . . . . . . . . . . . . . . . 24 22 2 9.1Investments - accounted for using the equity method . . . . . . . . . . . . . . . . . 12 2 10 500.0Investments - other . . . . . . . . . . . . . . . . . . . . . . . . . . . . . . . . . . . 19 1 18 n/mProperty, plant and equipment . . . . . . . . . . . . . . . . . . . . . . . . . . . . . 20,504 21,790 (1,286) (5.9)Intangible assets . . . . . . . . . . . . . . . . . . . . . . . . . . . . . . . . . . . . 7,421 7,627 (206) (2.7)Derivative financial assets . . . . . . . . . . . . . . . . . . . . . . . . . . . . . . . 658 285 373 130.9Non current tax receivables . . . . . . . . . . . . . . . . . . . . . . . . . . . . . . 80 382 (302) (79.1)Deferred tax assets. . . . . . . . . . . . . . . . . . . . . . . . . . . . . . . . . . . 6 - 6 100.0Defined benefit assets . . . . . . . . . . . . . . . . . . . . . . . . . . . . . . . . . - 11 (11) (100.0)Total non current assets . . . . . . . . . . . . . . . . . . . . . . . . . . . . . . . . 29,575 30,460 (885) (2.9)Total assets . . . . . . . . . . . . . . . . . . . . . . . . . . . . . . . . . . . . . . 39,525 37,913 1,612 4.3
Current liabilitiesTrade and other payables . . . . . . . . . . . . . . . . . . . . . . . . . . . . . . . 4,131 4,093 38 0.9Provisions . . . . . . . . . . . . . . . . . . . . . . . . . . . . . . . . . . . . . . . 942 846 96 11.3Borrowings . . . . . . . . . . . . . . . . . . . . . . . . . . . . . . . . . . . . . . . 3,306 1,990 1,316 66.1Derivative financial liabilities . . . . . . . . . . . . . . . . . . . . . . . . . . . . . . 299 634 (335) (52.8)Current tax payables . . . . . . . . . . . . . . . . . . . . . . . . . . . . . . . . . . 731 404 327 80.9Revenue received in advance . . . . . . . . . . . . . . . . . . . . . . . . . . . . . 1,170 1,018 152 14.9Liabilities classified as held for sale . . . . . . . . . . . . . . . . . . . . . . . . . . 105 5 100 n/mTotal current liabilities . . . . . . . . . . . . . . . . . . . . . . . . . . . . . . . . . 10,684 8,990 1,694 18.8Non current liabilitiesOther payables . . . . . . . . . . . . . . . . . . . . . . . . . . . . . . . . . . . . . 174 177 (3) (1.7)Provisions . . . . . . . . . . . . . . . . . . . . . . . . . . . . . . . . . . . . . . . 264 244 20 8.2Borrowings . . . . . . . . . . . . . . . . . . . . . . . . . . . . . . . . . . . . . . . 11,958 12,178 (220) (1.8)Derivative financial liabilities . . . . . . . . . . . . . . . . . . . . . . . . . . . . . . 2,349 1,799 550 30.6Deferred tax liabilities . . . . . . . . . . . . . . . . . . . . . . . . . . . . . . . . . 1,107 1,730 (623) (36.0)Defined benefit liability . . . . . . . . . . . . . . . . . . . . . . . . . . . . . . . . . 831 205 626 305.4Revenue received in advance . . . . . . . . . . . . . . . . . . . . . . . . . . . . . 469 298 171 57.4Total non current liabilities . . . . . . . . . . . . . . . . . . . . . . . . . . . . . . . 17,152 16,631 521 3.1Total liabilities . . . . . . . . . . . . . . . . . . . . . . . . . . . . . . . . . . . . . 27,836 25,621 2,215 8.6Net assets . . . . . . . . . . . . . . . . . . . . . . . . . . . . . . . . . . . . . . . 11,689 12,292 (603) (4.9)
EquityEquity available to Telstra Entity shareholders . . . . . . . . . . . . . . . . . . . . . 11,480 12,074 (594) (4.9)Non-controlling interests . . . . . . . . . . . . . . . . . . . . . . . . . . . . . . . . 209 218 (9) (4.1)Total equity . . . . . . . . . . . . . . . . . . . . . . . . . . . . . . . . . . . . . . 11,689 12,292 (603) (4.9)
Gross debt . . . . . . . . . . . . . . . . . . . . . . . . . . . . . . . . . . . . . . . 17,222 16,232 990 6.1Net debt . . . . . . . . . . . . . . . . . . . . . . . . . . . . . . . . . . . . . . . . 13,277 13,595 (318) (2.3)EBITDA interest cover (times) . . . . . . . . . . . . . . . . . . . . . . . . . . . . . 10.3 9.6 1 7.3Net debt to EBITDA . . . . . . . . . . . . . . . . . . . . . . . . . . . . . . . . . . 1.3 1.3 0 0.0Return on average assets . . . . . . . . . . . . . . . . . . . . . . . . . . . . . . . 16.7% 15.9% 0.8 ppReturn on average equity . . . . . . . . . . . . . . . . . . . . . . . . . . . . . . . 28.9% 26.1% 2.8 ppReturn on average investment . . . . . . . . . . . . . . . . . . . . . . . . . . . . . 22.9% 21.6% 1.3 ppGearing ratio (net debt to capitalisation) . . . . . . . . . . . . . . . . . . . . . . . . 53.2% 52.5% 0.7 pp
n/m = not meaningful
For
per
sona
l use
onl
y

Telstra Corporation Limited and controlled entities
14
Full year results and operations review - June 2012
n/m = not meaningful
Statement of cash flowsYear ended 30 June
2012 2011 Change Change$m $m $m %
Cash flows from operating activitiesReceipts from customers (inclusive of goods and services tax (GST)) . . . . . . . . 28,364 27,389 975 3.6Payments to suppliers and to employees (inclusive of GST) . . . . . . . . . . . . . (17,491) (17,860) 369 (2.1)Net cash generated by operations . . . . . . . . . . . . . . . . . . . . . . . . . . . 10,873 9,529 1,344 14.1Income taxes paid . . . . . . . . . . . . . . . . . . . . . . . . . . . . . . . . . . . (1,597) (1,511) (86) 5.7Net cash provided by operating activities. . . . . . . . . . . . . . . . . . . . . . 9,276 8,018 1,258 15.7
Cash flows from investing activitiesPayments for:- property, plant and equipment . . . . . . . . . . . . . . . . . . . . . . . . . . . . (3,006) (2,342) (664) 28.4- intangible assets . . . . . . . . . . . . . . . . . . . . . . . . . . . . . . . . . . . (942) (909) (33) 3.6Capital expenditure (before investments) . . . . . . . . . . . . . . . . . . . . . . . (3,948) (3,251) (697) 21.4- shares in controlled entities (net of cash acquired) . . . . . . . . . . . . . . . . . . 0 (36) 36 (100.0)- payments for associates . . . . . . . . . . . . . . . . . . . . . . . . . . . . . . . (9) 0 (9) (100.0)- payments for other investments . . . . . . . . . . . . . . . . . . . . . . . . . . . (18) 0 (18) (100.0)Total capital expenditure . . . . . . . . . . . . . . . . . . . . . . . . . . . . . . . (3,975) (3,287) (688) 20.9Proceeds from:- sale of property, plant and equipment . . . . . . . . . . . . . . . . . . . . . . . . 17 16 1 6.3- sale of intangible assets . . . . . . . . . . . . . . . . . . . . . . . . . . . . . . . 2 0 2 100.0- sale of shares in controlled entities (net of cash disposed) . . . . . . . . . . . . . . (9) 288 (297) (103.1)- sale of businesses (net of cash disposed) . . . . . . . . . . . . . . . . . . . . . . (2) 14 (16) (114.3)- sale of associates . . . . . . . . . . . . . . . . . . . . . . . . . . . . . . . . . . . 0 23 (23) (100.0)Proceeds from finance lease principal amounts . . . . . . . . . . . . . . . . . . . . 54 74 (20) (27.0)Repayments of loans to jointly controlled and associated entities . . . . . . . . . . . 3 2 1 50.0Loans to jointly controlled and associated entities . . . . . . . . . . . . . . . . . . . (443) 0 (443) n/mInterest received . . . . . . . . . . . . . . . . . . . . . . . . . . . . . . . . . . . . 117 122 (5) (4.1)Settlement of hedges of net investments. . . . . . . . . . . . . . . . . . . . . . . . 49 96 (47) (49.0)Dividends received . . . . . . . . . . . . . . . . . . . . . . . . . . . . . . . . . . . 0 41 (41) (100.0)Distributions received from FOXTEL Partnership . . . . . . . . . . . . . . . . . . . 108 70 38 54.3Net cash used in investing activities . . . . . . . . . . . . . . . . . . . . . . . . (4,079) (2,541) (1,538) 60.5Operating cash flows less investing cash flows . . . . . . . . . . . . . . . . . . 5,197 5,477 (280) (5.1)
Cash flows from financing activitiesProceeds from borrowings . . . . . . . . . . . . . . . . . . . . . . . . . . . . . . . 3,049 2,340 709 30.3Repayment of borrowings . . . . . . . . . . . . . . . . . . . . . . . . . . . . . . . (2,224) (2,536) 312 (12.3)Repayment of finance lease principal amounts . . . . . . . . . . . . . . . . . . . . (52) (61) 9 (14.8)Staff repayments of share loans . . . . . . . . . . . . . . . . . . . . . . . . . . . . 3 8 (5) (62.5)Finance costs paid . . . . . . . . . . . . . . . . . . . . . . . . . . . . . . . . . . . (1,154) (1,135) (19) 1.7Acquisition of non-controlling interests . . . . . . . . . . . . . . . . . . . . . . . . . (37) 0 (37) n/mDividends paid to equity holders of Telstra Entity . . . . . . . . . . . . . . . . . . . (3,475) (3,475) 0 0.0Dividends paid to non-controlling interests . . . . . . . . . . . . . . . . . . . . . . . (16) (14) (2) 14.3Net cash used in financing activities . . . . . . . . . . . . . . . . . . . . . . . . (3,906) (4,873) 967 (19.8)
Net increase in cash and cash equivalents . . . . . . . . . . . . . . . . . . . . . 1,291 604 687 113.7Cash and cash equivalents at the beginning of the year . . . . . . . . . . . . . . . . 2,637 2,105 532 25.3Effects of exchange rate changes on cash and cash equivalents . . . . . . . . . . . 17 (72) 89 (123.6)Cash and cash equivalents at the end of the year . . . . . . . . . . . . . . . . . 3,945 2,637 1,308 49.6
For
per
sona
l use
onl
y
Telstra Corporation Limited and controlled entities
15
Full year results and operations review - June 2012
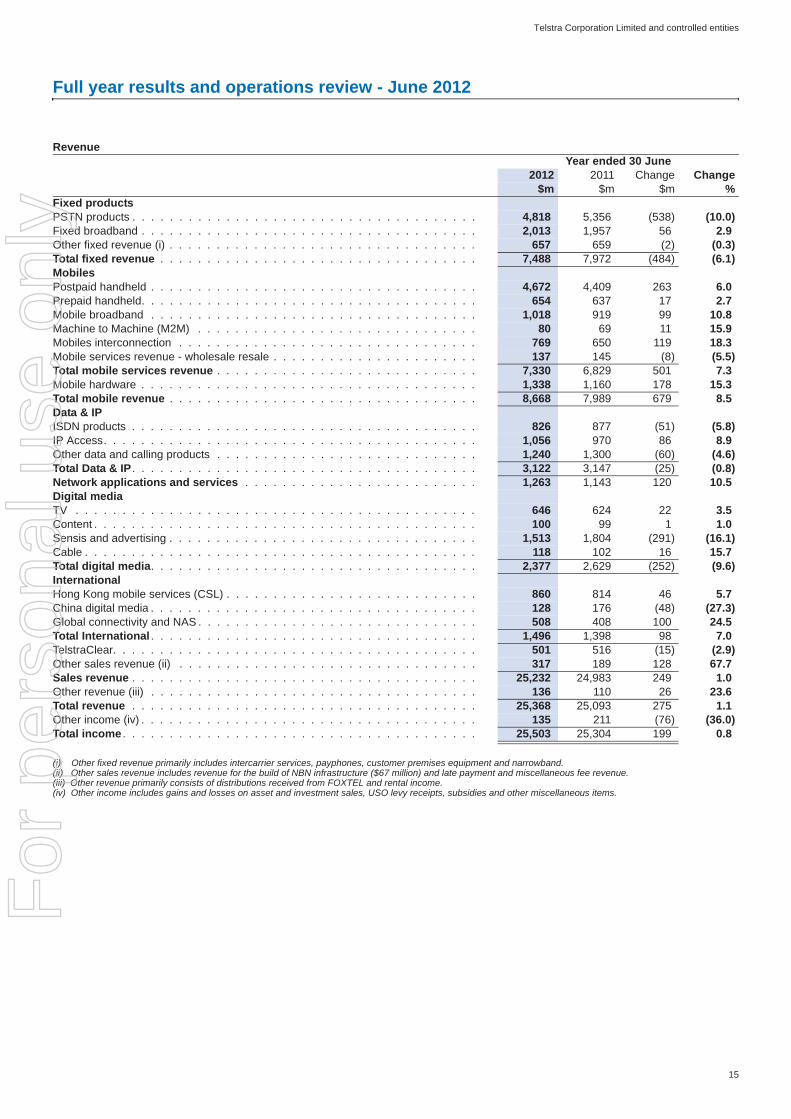
(i) Other fixed revenue primarily includes intercarrier services, payphones, customer premises equipment and narrowband.(ii) Other sales revenue includes revenue for the build of NBN infrastructure ($67 million) and late payment and miscellaneous fee revenue.(iii) Other revenue primarily consists of distributions received from FOXTEL and rental income.(iv) Other income includes gains and losses on asset and investment sales, USO levy receipts, subsidies and other miscellaneous items.
RevenueYear ended 30 June
2012 2011 Change Change$m $m $m %
Fixed productsPSTN products . . . . . . . . . . . . . . . . . . . . . . . . . . . . . . . . . . . . . 4,818 5,356 (538) (10.0)Fixed broadband . . . . . . . . . . . . . . . . . . . . . . . . . . . . . . . . . . . . 2,013 1,957 56 2.9Other fixed revenue (i) . . . . . . . . . . . . . . . . . . . . . . . . . . . . . . . . . 657 659 (2) (0.3)Total fixed revenue . . . . . . . . . . . . . . . . . . . . . . . . . . . . . . . . . . 7,488 7,972 (484) (6.1)MobilesPostpaid handheld . . . . . . . . . . . . . . . . . . . . . . . . . . . . . . . . . . . 4,672 4,409 263 6.0Prepaid handheld. . . . . . . . . . . . . . . . . . . . . . . . . . . . . . . . . . . . 654 637 17 2.7Mobile broadband . . . . . . . . . . . . . . . . . . . . . . . . . . . . . . . . . . . 1,018 919 99 10.8Machine to Machine (M2M) . . . . . . . . . . . . . . . . . . . . . . . . . . . . . . 80 69 11 15.9Mobiles interconnection . . . . . . . . . . . . . . . . . . . . . . . . . . . . . . . . 769 650 119 18.3Mobile services revenue - wholesale resale . . . . . . . . . . . . . . . . . . . . . . 137 145 (8) (5.5)Total mobile services revenue . . . . . . . . . . . . . . . . . . . . . . . . . . . . 7,330 6,829 501 7.3Mobile hardware . . . . . . . . . . . . . . . . . . . . . . . . . . . . . . . . . . . . 1,338 1,160 178 15.3Total mobile revenue . . . . . . . . . . . . . . . . . . . . . . . . . . . . . . . . . 8,668 7,989 679 8.5Data & IPISDN products . . . . . . . . . . . . . . . . . . . . . . . . . . . . . . . . . . . . . 826 877 (51) (5.8)IP Access. . . . . . . . . . . . . . . . . . . . . . . . . . . . . . . . . . . . . . . . 1,056 970 86 8.9Other data and calling products . . . . . . . . . . . . . . . . . . . . . . . . . . . . 1,240 1,300 (60) (4.6)Total Data & IP . . . . . . . . . . . . . . . . . . . . . . . . . . . . . . . . . . . . . 3,122 3,147 (25) (0.8)Network applications and services . . . . . . . . . . . . . . . . . . . . . . . . . 1,263 1,143 120 10.5Digital mediaTV . . . . . . . . . . . . . . . . . . . . . . . . . . . . . . . . . . . . . . . . . . . 646 624 22 3.5Content . . . . . . . . . . . . . . . . . . . . . . . . . . . . . . . . . . . . . . . . . 100 99 1 1.0Sensis and advertising . . . . . . . . . . . . . . . . . . . . . . . . . . . . . . . . . 1,513 1,804 (291) (16.1)Cable . . . . . . . . . . . . . . . . . . . . . . . . . . . . . . . . . . . . . . . . . . 118 102 16 15.7Total digital media. . . . . . . . . . . . . . . . . . . . . . . . . . . . . . . . . . . 2,377 2,629 (252) (9.6)InternationalHong Kong mobile services (CSL) . . . . . . . . . . . . . . . . . . . . . . . . . . . 860 814 46 5.7China digital media . . . . . . . . . . . . . . . . . . . . . . . . . . . . . . . . . . . 128 176 (48) (27.3)Global connectivity and NAS . . . . . . . . . . . . . . . . . . . . . . . . . . . . . . 508 408 100 24.5Total International . . . . . . . . . . . . . . . . . . . . . . . . . . . . . . . . . . . 1,496 1,398 98 7.0TelstraClear. . . . . . . . . . . . . . . . . . . . . . . . . . . . . . . . . . . . . . . 501 516 (15) (2.9)Other sales revenue (ii) . . . . . . . . . . . . . . . . . . . . . . . . . . . . . . . . 317 189 128 67.7Sales revenue . . . . . . . . . . . . . . . . . . . . . . . . . . . . . . . . . . . . . 25,232 24,983 249 1.0Other revenue (iii) . . . . . . . . . . . . . . . . . . . . . . . . . . . . . . . . . . . 136 110 26 23.6Total revenue . . . . . . . . . . . . . . . . . . . . . . . . . . . . . . . . . . . . . 25,368 25,093 275 1.1Other income (iv) . . . . . . . . . . . . . . . . . . . . . . . . . . . . . . . . . . . . 135 211 (76) (36.0)Total income . . . . . . . . . . . . . . . . . . . . . . . . . . . . . . . . . . . . . . 25,503 25,304 199 0.8
For
per
sona
l use
onl
y

Telstra Corporation Limited and controlled entities
16
Full year results and operations review - June 2012
Accrued capital expenditure is defined as additions to property, equipment and intangible assets, including capital lease additions, measured on an accrued basis.
ExpensesYear ended 30 June
2012 2011 Change Change$m $m $m %
Salary and associated costs . . . . . . . . . . . . . . . . . . . . . . . . . . . . . . 3,505 3,326 179 5.4Redundancy . . . . . . . . . . . . . . . . . . . . . . . . . . . . . . . . . . . . . . 162 224 (62) (27.7)Other labour expenses . . . . . . . . . . . . . . . . . . . . . . . . . . . . . . . . . 394 374 20 5.3Total labour . . . . . . . . . . . . . . . . . . . . . . . . . . . . . . . . . . . . . . 4,061 3,924 137 3.5Cost of goods sold . . . . . . . . . . . . . . . . . . . . . . . . . . . . . . . . . . . 2,551 2,644 (93) (3.5)Network payments . . . . . . . . . . . . . . . . . . . . . . . . . . . . . . . . . . . 1,948 1,943 5 0.3Other . . . . . . . . . . . . . . . . . . . . . . . . . . . . . . . . . . . . . . . . . . 1,680 1,596 84 5.3Total goods and services purchased 6,179 6,183 (4) (0.1)Service contracts and other agreements . . . . . . . . . . . . . . . . . . . . . . . . 2,135 2,359 (224) (9.5)Labour substitution (incl. in service contracts and other agreements) . . . . . . . . . 906 1,030 (124) (12.0)Impairment and diminution expenses . . . . . . . . . . . . . . . . . . . . . . . . . 544 446 98 22.0Other operating expenses . . . . . . . . . . . . . . . . . . . . . . . . . . . . . . . 2,350 2,242 108 4.8Total other expenses . . . . . . . . . . . . . . . . . . . . . . . . . . . . . . . . . 5,029 5,047 (18) (0.4)
Total Operating expenses . . . . . . . . . . . . . . . . . . . . . . . . . . . . . . 15,269 15,154 115 0.8
Salary and associated costs . . . . . . . . . . . . . . . . . . . . . . . . . . . . . . 3,505 3,326 179 5.4Redundancy . . . . . . . . . . . . . . . . . . . . . . . . . . . . . . . . . . . . . . 162 224 (62) (27.7)Other labour expenses . . . . . . . . . . . . . . . . . . . . . . . . . . . . . . . . . 394 374 20 5.3Labour substitution (incl. in other expenses) . . . . . . . . . . . . . . . . . . . . . . 906 1,030 (124) (12.0)Total labour and labour substitution 4,967 4,954 13 0.3
Depreciation . . . . . . . . . . . . . . . . . . . . . . . . . . . . . . . . . . . . . . 3,305 3,454 (149) (4.3)Amortisation . . . . . . . . . . . . . . . . . . . . . . . . . . . . . . . . . . . . . . 1,107 1,005 102 10.1Total depreciation and amortisation . . . . . . . . . . . . . . . . . . . . . . . . . 4,412 4,459 (47) (1.1)
Net Finance CostsYear ended 30 June
2012 2011 Change Change$m $m $m %
Borrowing costs . . . . . . . . . . . . . . . . . . . . . . . . . . . . . . . . . . . . 1,120 1,174 (54) (4.6)Finance leases . . . . . . . . . . . . . . . . . . . . . . . . . . . . . . . . . . . . . 12 12 0 n/mFinance income . . . . . . . . . . . . . . . . . . . . . . . . . . . . . . . . . . . . (134) (127) (7) 5.5Net Borrowing Costs . . . . . . . . . . . . . . . . . . . . . . . . . . . . . . . . . 998 1,059 (61) (5.8)Other . . . . . . . . . . . . . . . . . . . . . . . . . . . . . . . . . . . . . . . . . . (110) 76 (186) (244.7)Net Finance Costs . . . . . . . . . . . . . . . . . . . . . . . . . . . . . . . . . . 888 1,135 (247) (21.8)
n/m = not meaningful
Accrued capexYear ended 30 June
2012 2011 Change Change$m $m $m %
New revenue/growth . . . . . . . . . . . . . . . . . . . . . . . . . . . . . . . . . . 313 318 (5) (1.6)Business improvement . . . . . . . . . . . . . . . . . . . . . . . . . . . . . . . . . Customer demand and experience. . . . . . . . . . . . . . . . . . . . . . . . . . .
639 574 65 11.31,971 1,554 417 26.8
Lifecycle maintenance . . . . . . . . . . . . . . . . . . . . . . . . . . . . . . . . . 299 545 (246) (45.1)Legal and regulatory compliance. . . . . . . . . . . . . . . . . . . . . . . . . . . . 5 6 (1) (16.7)Sensis . . . . . . . . . . . . . . . . . . . . . . . . . . . . . . . . . . . . . . . . . 106 134 (28) (20.9)International . . . . . . . . . . . . . . . . . . . . . . . . . . . . . . . . . . . . . . 258 279 (21) (7.5)Accrued capital expenditure . . . . . . . . . . . . . . . . . . . . . . . . . . . . . 3,591 3,410 181 5.3
For
per
sona
l use
onl
y

Telstra Corporation Limited and controlled entities
17
Full year results and operations review - June 2012
(i) In fiscal 2012, we have changed our approach to the recognition of Reach transactions for internal management purposes and have not restated the prior year results. Income from external customers for the Telstra International Group includes $136 million of inter-segment income treated as external cost in our Retail units and is eliminated in the Other segment. External expenses in the Telstra International Group includes $33 million of inter-segment expenses treated as external income in Wholesale and is eliminated in the Other segment. In 2011, $12 million of inter-segment costs from Telstra Wholesale were treated as negative revenue and $34 million of inter-segment revenue with our Retail units was treated as negative expense in the Telstra International Group results.
(ii) Internally, we monitor our segment performance excluding the impact of certain revenue and expense items such as sales of major businesses and investments, sales of land and buildings and impairment write-offs.
(iii) Other items excluded from the segment results for the full year ended 30 June 2012 include the write back of deferred consideration relating to LMobile, revenue for the build of NBN infrastructure ($67 million), impairment expenses relating to our investments and the profit/loss on sale of businesses during the year.
Segment InformationTotal external incomeYear ended 30 June Year ended 30 June
2012 2011 Change 2012 2011 Change$m $m % $m $m %
Telstra Consumer and Country Wide. . . . . . . 10,267 9,915 3.6 5,467 5,075 7.7Telstra Business . . . . . . . . . . . . . . . . . 4,676 4,720 (0.9) 3,523 3,554 (0.9)Telstra Enterprise and Government . . . . . . . 4,325 4,142 4.4 3,453 3,331 3.7Telstra Wholesale . . . . . . . . . . . . . . . . 2,101 2,194 (4.2) 1,933 2,031 (4.8)Telstra Media Group . . . . . . . . . . . . . . . 1,741 1,978 (12.0) 764 999 (23.5)Telstra International Group (i) . . . . . . . . . . 1,643 1,336 23.0 312 230 35.7TelstraClear. . . . . . . . . . . . . . . . . . . . 502 514 (2.3) 99 84 17.9Telstra Operations . . . . . . . . . . . . . . . . 73 113 (35.4) (3,679) (3,744) (1.7)Other . . . . . . . . . . . . . . . . . . . . . . . 79 231 (65.8) (1,544) (1,506) 2.5Total Telstra segments (ii) . . . . . . . . . . . 25,407 25,143 1.0 10,328 10,054 2.7
Other items excluded from segment results (iii) . 96 161 (40.4) (94) 97 (196.9)Total Telstra Group (reported) . . . . . . . . . 25,503 25,304 0.8 10,234 10,151 0.8
Revenue by Business SegmentYear ended 30 June
2012 2011 Change Change$m $m $m %
Telstra Consumer and Country WidePSTN products . . . . . . . . . . . . . . . . . . . . . . . . . . . . . . . . . . . . . 2,746 3,025 (279) (9.2)Fixed broadband . . . . . . . . . . . . . . . . . . . . . . . . . . . . . . . . . . . . 1,305 1,178 127 10.8Mobile services revenue . . . . . . . . . . . . . . . . . . . . . . . . . . . . . . . . 3,995 3,622 373 10.3
Telstra BusinessPSTN products . . . . . . . . . . . . . . . . . . . . . . . . . . . . . . . . . . . . . 1,211 1,333 (122) (9.2)Fixed broadband . . . . . . . . . . . . . . . . . . . . . . . . . . . . . . . . . . . . 302 315 (13) (4.1)Mobile services revenue . . . . . . . . . . . . . . . . . . . . . . . . . . . . . . . . 2,155 2,097 58 2.8Network applications and services . . . . . . . . . . . . . . . . . . . . . . . . . . . 223 186 37 19.9
Telstra Enterprise and GovernmentMobile services revenue . . . . . . . . . . . . . . . . . . . . . . . . . . . . . . . . 1,031 927 104 11.2IP access and data services . . . . . . . . . . . . . . . . . . . . . . . . . . . . . . 1,114 1,070 44 4.1Network applications and services . . . . . . . . . . . . . . . . . . . . . . . . . . . 1,017 925 92 9.9
For
per
sona
l use
onl
y

Telstra Corporation Limited and controlled entities
18
Full year results and operations review - June 2012
Sensis financial summaryYear ended 30 June
2012 2011 Change Change$m $m $m %
Sales revenue . . . . . . . . . . . . . . . . . . . . . . . . . . . . . . . . . . . . . 1,471 1,787 (316) (17.7)Total income . . . . . . . . . . . . . . . . . . . . . . . . . . . . . . . . . . . . . . 1,471 1,787 (316) (17.7)Operating expenses (excl. depreciation & amortisation) . . . . . . . . . . . . . . . . 781 793 (12) (1.5)EBITDA contribution . . . . . . . . . . . . . . . . . . . . . . . . . . . . . . . . . . 690 994 (304) (30.6)Depreciation and amortisation . . . . . . . . . . . . . . . . . . . . . . . . . . . . . 140 123 17 13.8EBIT contribution . . . . . . . . . . . . . . . . . . . . . . . . . . . . . . . . . . . . 550 871 (321) (36.9)Capital expenditure. . . . . . . . . . . . . . . . . . . . . . . . . . . . . . . . . . . 106 134 (28) (20.9)
EBITDA margin on sales revenue . . . . . . . . . . . . . . . . . . . . . . . . . . . 46.9% 55.6% (8.7) pp
Amounts included for the Sensis represent the contribution to Telstra’s consolidated result.
Sensis total income is split into the following categories:Year ended 30 June
2012 2011 Change Change$m $m $m %
- Yellow Pages revenue . . . . . . . . . . . . . . . . . . . . . . . . . . . . . . . . 861 1,119 (258) (23.1)- White Pages revenue . . . . . . . . . . . . . . . . . . . . . . . . . . . . . . . . . 442 436 6 1.4- Voice . . . . . . . . . . . . . . . . . . . . . . . . . . . . . . . . . . . . . . . . . 124 131 (7) (5.3)- Other revenue. . . . . . . . . . . . . . . . . . . . . . . . . . . . . . . . . . . . . 44 101 (57) (56.4)Sensis total income . . . . . . . . . . . . . . . . . . . . . . . . . . . . . . . . . . 1,471 1,787 (316) (17.7)
For
per
sona
l use
onl
y
Telstra Corporation Limited and controlled entities
19
Full year results and operations review - June 2012
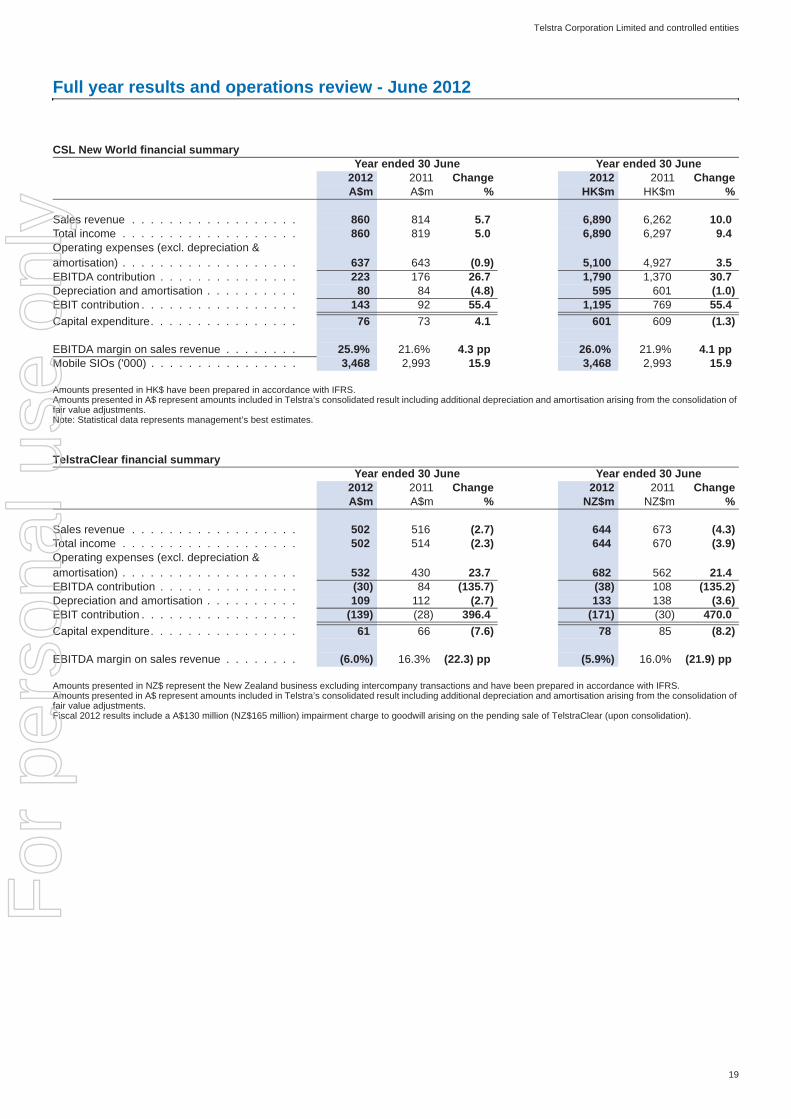
Amounts presented in HK$ have been prepared in accordance with IFRS.Amounts presented in A$ represent amounts included in Telstra’s consolidated result including additional depreciation and amortisation arising from the consolidation of fair value adjustments.Note: Statistical data represents management’s best estimates.
Amounts presented in NZ$ represent the New Zealand business excluding intercompany transactions and have been prepared in accordance with IFRS.Amounts presented in A$ represent amounts included in Telstra’s consolidated result including additional depreciation and amortisation arising from the consolidation of fair value adjustments.Fiscal 2012 results include a A$130 million (NZ$165 million) impairment charge to goodwill arising on the pending sale of TelstraClear (upon consolidation).
CSL New World financial summaryYear ended 30 June Year ended 30 June
2012 2011 Change 2012 2011 ChangeA$m A$m % HK$m HK$m %
Sales revenue . . . . . . . . . . . . . . . . . . 860 814 5.7 6,890 6,262 10.0Total income . . . . . . . . . . . . . . . . . . . 860 819 5.0 6,890 6,297 9.4Operating expenses (excl. depreciation & amortisation) . . . . . . . . . . . . . . . . . . . 637 643 (0.9) 5,100 4,927 3.5EBITDA contribution . . . . . . . . . . . . . . . 223 176 26.7 1,790 1,370 30.7Depreciation and amortisation . . . . . . . . . . 80 84 (4.8) 595 601 (1.0)EBIT contribution . . . . . . . . . . . . . . . . . 143 92 55.4 1,195 769 55.4Capital expenditure. . . . . . . . . . . . . . . . 76 73 4.1 601 609 (1.3)
EBITDA margin on sales revenue . . . . . . . . 25.9% 21.6% 4.3 pp 26.0% 21.9% 4.1 ppMobile SIOs ('000) . . . . . . . . . . . . . . . . 3,468 2,993 15.9 3,468 2,993 15.9
TelstraClear financial summaryYear ended 30 June Year ended 30 June
2012 2011 Change 2012 2011 ChangeA$m A$m % NZ$m NZ$m %
Sales revenue . . . . . . . . . . . . . . . . . . 502 516 (2.7) 644 673 (4.3)Total income . . . . . . . . . . . . . . . . . . . 502 514 (2.3) 644 670 (3.9)Operating expenses (excl. depreciation & amortisation) . . . . . . . . . . . . . . . . . . . 532 430 23.7 682 562 21.4EBITDA contribution . . . . . . . . . . . . . . . (30) 84 (135.7) (38) 108 (135.2)Depreciation and amortisation . . . . . . . . . . 109 112 (2.7) 133 138 (3.6)EBIT contribution . . . . . . . . . . . . . . . . . (139) (28) 396.4 (171) (30) 470.0Capital expenditure. . . . . . . . . . . . . . . . 61 66 (7.6) 78 85 (8.2)
EBITDA margin on sales revenue . . . . . . . . (6.0%) 16.3% (22.3) pp (5.9%) 16.0% (21.9) pp
For
per
sona
l use
onl
y
Telstra Corporation Limited and controlled entities
20
Full year results and operations review - June 2012
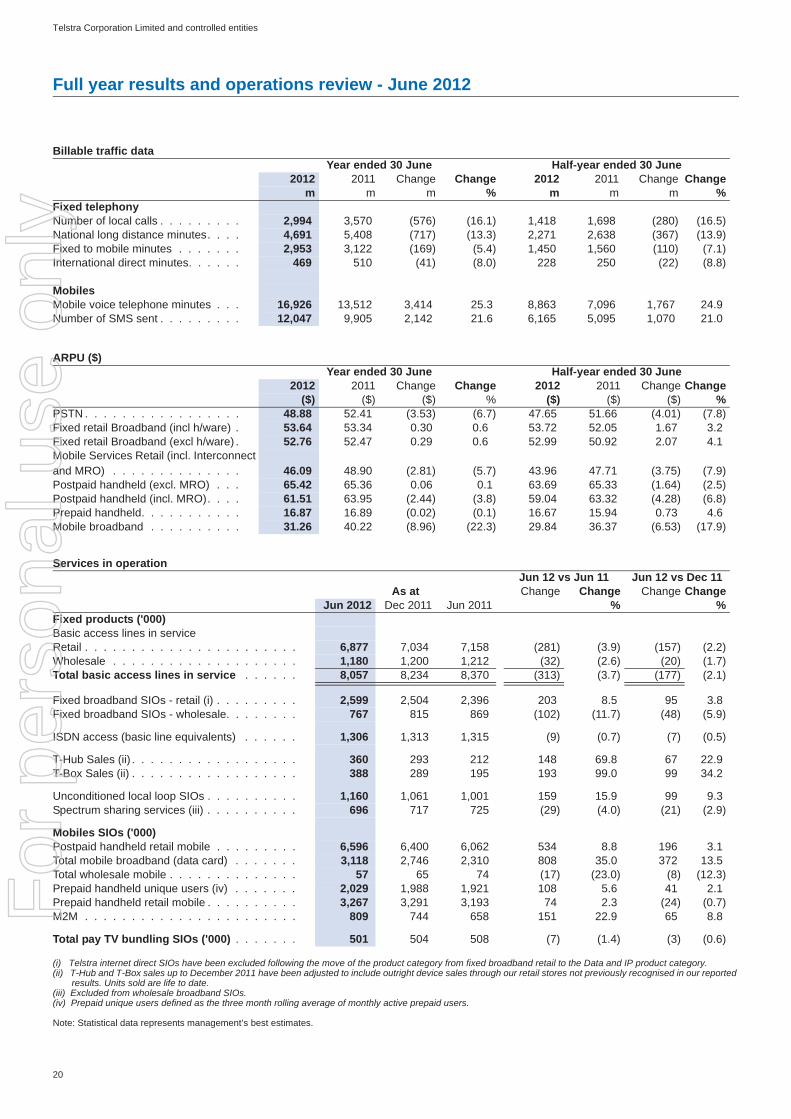
(i) Telstra internet direct SIOs have been excluded following the move of the product category from fixed broadband retail to the Data and IP product category.(ii) T-Hub and T-Box sales up to December 2011 have been adjusted to include outright device sales through our retail stores not previously recognised in our reported
results. Units sold are life to date.(iii) Excluded from wholesale broadband SIOs.(iv) Prepaid unique users defined as the three month rolling average of monthly active prepaid users.
Note: Statistical data represents management’s best estimates.
Billable traffic dataYear ended 30 June Half-year ended 30 June
2012 2011 Change Change 2012 2011 Change Changem m m % m m m %
Fixed telephonyNumber of local calls . . . . . . . . . 2,994 3,570 (576) (16.1) 1,418 1,698 (280) (16.5)National long distance minutes. . . . 4,691 5,408 (717) (13.3) 2,271 2,638 (367) (13.9)Fixed to mobile minutes . . . . . . . 2,953 3,122 (169) (5.4) 1,450 1,560 (110) (7.1)International direct minutes. . . . . . 469 510 (41) (8.0) 228 250 (22) (8.8)
MobilesMobile voice telephone minutes . . . 16,926 13,512 3,414 25.3 8,863 7,096 1,767 24.9Number of SMS sent . . . . . . . . . 12,047 9,905 2,142 21.6 6,165 5,095 1,070 21.0
ARPU ($)Year ended 30 June Half-year ended 30 June
2012 2011 Change Change 2012 2011 Change Change($) ($) ($) % ($) ($) ($) %
PSTN . . . . . . . . . . . . . . . . . 48.88 52.41 (3.53) (6.7) 47.65 51.66 (4.01) (7.8)Fixed retail Broadband (incl h/ware) . 53.64 53.34 0.30 0.6 53.72 52.05 1.67 3.2Fixed retail Broadband (excl h/ware) . 52.76 52.47 0.29 0.6 52.99 50.92 2.07 4.1Mobile Services Retail (incl. Interconnect and MRO) . . . . . . . . . . . . . . 46.09 48.90 (2.81) (5.7) 43.96 47.71 (3.75) (7.9)Postpaid handheld (excl. MRO) . . . 65.42 65.36 0.06 0.1 63.69 65.33 (1.64) (2.5)Postpaid handheld (incl. MRO). . . . 61.51 63.95 (2.44) (3.8) 59.04 63.32 (4.28) (6.8)Prepaid handheld. . . . . . . . . . . 16.87 16.89 (0.02) (0.1) 16.67 15.94 0.73 4.6Mobile broadband . . . . . . . . . . 31.26 40.22 (8.96) (22.3) 29.84 36.37 (6.53) (17.9)
Services in operationJun 12 vs Jun 11 Jun 12 vs Dec 11
As at Change Change Change ChangeJun 2012 Dec 2011 Jun 2011 % %
Fixed products ('000)Basic access lines in serviceRetail . . . . . . . . . . . . . . . . . . . . . . . 6,877 7,034 7,158 (281) (3.9) (157) (2.2)Wholesale . . . . . . . . . . . . . . . . . . . . 1,180 1,200 1,212 (32) (2.6) (20) (1.7)Total basic access lines in service . . . . . . 8,057 8,234 8,370 (313) (3.7) (177) (2.1)
Fixed broadband SIOs - retail (i) . . . . . . . . . 2,599 2,504 2,396 203 8.5 95 3.8Fixed broadband SIOs - wholesale. . . . . . . . 767 815 869 (102) (11.7) (48) (5.9)
ISDN access (basic line equivalents) . . . . . . 1,306 1,313 1,315 (9) (0.7) (7) (0.5)
T-Hub Sales (ii) . . . . . . . . . . . . . . . . . . 360 293 212 148 69.8 67 22.9T-Box Sales (ii) . . . . . . . . . . . . . . . . . . 388 289 195 193 99.0 99 34.2
Unconditioned local loop SIOs . . . . . . . . . . 1,160 1,061 1,001 159 15.9 99 9.3Spectrum sharing services (iii) . . . . . . . . . . 696 717 725 (29) (4.0) (21) (2.9)
Mobiles SIOs ('000)Postpaid handheld retail mobile . . . . . . . . . 6,596 6,400 6,062 534 8.8 196 3.1Total mobile broadband (data card) . . . . . . . 3,118 2,746 2,310 808 35.0 372 13.5Total wholesale mobile . . . . . . . . . . . . . . 57 65 74 (17) (23.0) (8) (12.3)Prepaid handheld unique users (iv) . . . . . . . 2,029 1,988 1,921 108 5.6 41 2.1Prepaid handheld retail mobile . . . . . . . . . . 3,267 3,291 3,193 74 2.3 (24) (0.7)M2M . . . . . . . . . . . . . . . . . . . . . . . 809 744 658 151 22.9 65 8.8
Total pay TV bundling SIOs ('000) . . . . . . . 501 504 508 (7) (1.4) (3) (0.6)
For
per
sona
l use
onl
y
Telstra Corporation Limited and controlled entities
21
Full year results and operations review - June 2012
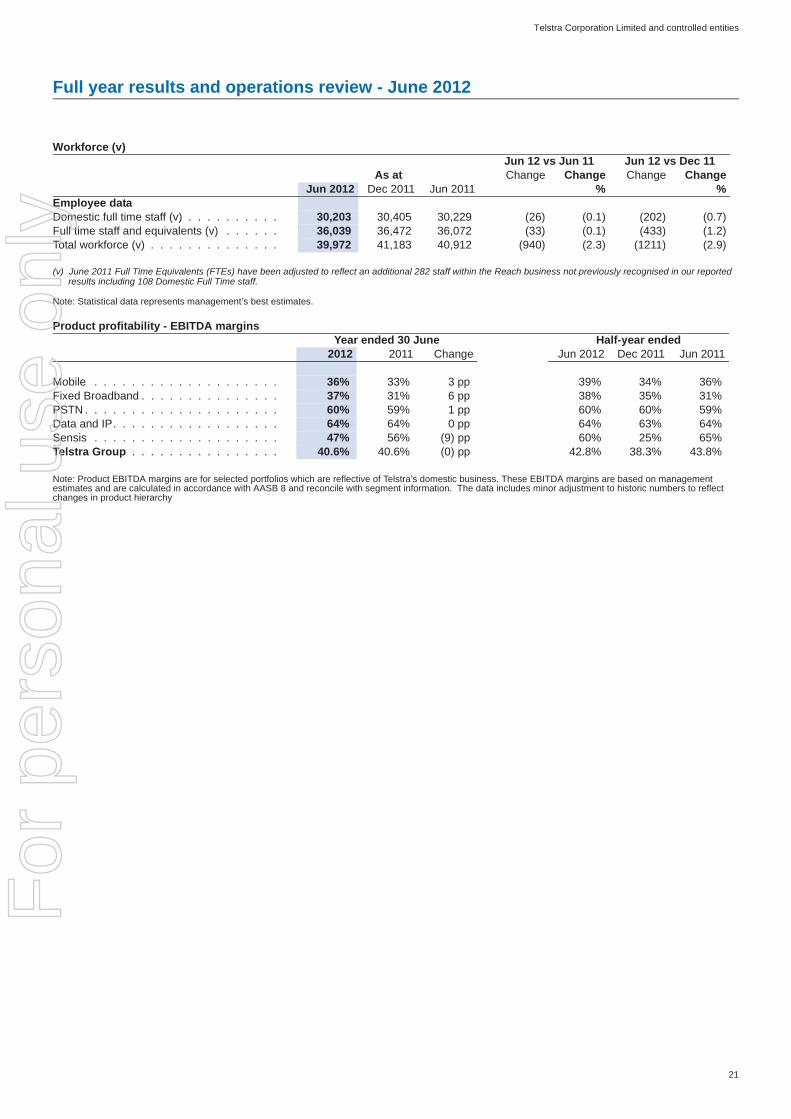
(v) June 2011 Full Time Equivalents (FTEs) have been adjusted to reflect an additional 282 staff within the Reach business not previously recognised in our reported results including 108 Domestic Full Time staff.
Note: Statistical data represents management’s best estimates.
Workforce (v)Jun 12 vs Jun 11 Jun 12 vs Dec 11
As at Change Change Change ChangeJun 2012 Dec 2011 Jun 2011 % %
Employee dataDomestic full time staff (v) . . . . . . . . . . 30,203 30,405 30,229 (26) (0.1) (202) (0.7)Full time staff and equivalents (v) . . . . . . 36,039 36,472 36,072 (33) (0.1) (433) (1.2)Total workforce (v) . . . . . . . . . . . . . . 39,972 41,183 40,912 (940) (2.3) (1211) (2.9)
Product profitability - EBITDA marginsYear ended 30 June Half-year ended
2012 2011 Change Jun 2012 Dec 2011 Jun 2011
Mobile . . . . . . . . . . . . . . . . . . . . 36% 33% 3 pp 39% 34% 36%Fixed Broadband . . . . . . . . . . . . . . . 37% 31% 6 pp 38% 35% 31%PSTN . . . . . . . . . . . . . . . . . . . . . 60% 59% 1 pp 60% 60% 59%Data and IP. . . . . . . . . . . . . . . . . . 64% 64% 0 pp 64% 63% 64%Sensis . . . . . . . . . . . . . . . . . . . . 47% 56% (9) pp 60% 25% 65%Telstra Group . . . . . . . . . . . . . . . . 40.6% 40.6% (0) pp 42.8% 38.3% 43.8%
Note: Product EBITDA margins are for selected portfolios which are reflective of Telstra’s domestic business. These EBITDA margins are based on management estimates and are calculated in accordance with AASB 8 and reconcile with segment information. The data includes minor adjustment to historic numbers to reflect changes in product hierarchy
For
per
sona
l use
onl
y

Telstra Corporation Limited and controlled entities
22
Full year results and operations review - June 2012
Not
e:Th
ere
are
a nu
mbe
r of f
acto
rs th
at h
ave
impa
cted
our
resu
lts th
is y
ear.
In th
e ta
ble
abov
e, w
e ha
ve a
djus
ted
the
resu
lts fo
r:(i)
LM
obile
Gro
up im
pairm
ent,
writ
ebac
k of
def
erre
d co
nsid
erat
ion
and
loss
on
sale
adj
ustm
ent:
Adju
stm
ents
rela
ting
to th
e LM
obile
Gro
up re
flect
a re
view
of f
utur
e ca
shflo
ws
incl
udin
g th
e w
riteb
ack
of n
on c
urre
nt d
efer
red
cons
ider
atio
n of
$33
m a
nd im
pairm
ent o
f goo
dwill
$49
m a
nd o
ther
inta
ngib
le a
sset
s $7
m
(tota
l $56
m) u
nder
take
n du
ring
the
year
. Adj
ustm
ents
incl
ude
a $1
7m lo
ss o
n sa
le o
n th
e di
vest
men
t of L
mob
ile s
ubse
quen
t to
the
prev
ious
cas
hflo
w re
view
und
erta
ken.
(ii
) AC
CC
Fin
al A
cces
s D
eter
min
atio
n ad
just
men
t:Ad
just
men
ts fo
r AC
CC
Fin
al A
cces
s D
eter
min
atio
n (F
AD) p
ricin
g fo
r fix
ed s
ervi
ces.
(iii)
Mob
ile T
erm
inat
ing
Agr
eem
ent (
MTA
) adj
ustm
ent:
Adju
stm
ents
for t
he re
-pric
ing
of m
obile
term
inat
ing
rate
s fro
m 9
cen
ts to
6 c
ents
. (iv
) NB
N re
late
d ad
just
men
t:Ad
just
men
ts im
pact
ing
the
Inco
me
stat
emen
t are
ass
ocia
ted
with
reve
nue
for t
he b
uild
of N
BN
rela
ted
infra
stru
ctur
e.Ad
just
men
ts im
pact
ing
free
cash
flow
rela
te to
net
$30
0m c
ash
rece
ived
($32
1m n
et o
f cas
h im
pact
of t
ax p
aid)
rela
ted
to th
e bu
ild o
f NB
N in
frast
ruct
ure
and
$85m
cas
h re
ceiv
ed ($
100m
less
$15
m e
xpec
ted
in y
ear c
ash
rece
ipts
) und
er th
e R
etra
inin
g Fu
ndin
g D
eed
to e
stab
lish
a re
train
ing
arra
ngem
ent f
or e
mpl
oyee
s im
pact
ed b
y th
e ro
llout
of N
BN
.(v
) Tel
stra
Cle
ar im
pairm
ent a
djus
tmen
t:Ad
just
men
ts re
latin
g to
an
impa
irmen
t of g
oodw
ill o
f $13
0m a
risin
g fro
m th
e Te
lstra
Cle
ar s
ale
to V
odaf
one
New
Zea
land
.(v
i) FO
XTEL
loan
:Ad
just
men
t to
refle
ct $
443m
loan
pro
vide
d to
FO
XTE
L fo
r AU
STA
R a
cqui
sitio
n. T
he p
rovi
sion
of t
his
loan
is e
xclu
ded
from
Tel
stra
's c
ashf
low
gui
danc
e pu
rpos
e.
This
sch
edul
e de
tails
the
adju
stm
ents
mad
e to
the
repo
rted
resu
lts fo
r the
cur
rent
yea
r to
refle
ct th
e pe
rform
ance
of t
he b
usin
ess
on th
e ba
sis
whi
ch w
e pr
ovid
ed g
uida
nce
to th
e m
arke
t.(A
ssum
es w
hole
sale
pro
duct
pric
e st
abili
ty, n
o fis
cal 2
012
impa
irmen
ts to
inve
stm
ents
and
exc
lude
s an
y pr
ocee
ds o
n th
e sa
le o
f bus
ines
ses)
REP
OR
TED
AD
JUST
MEN
TG
UID
AN
CE
BA
SIS
Jun-
12$m
Jun-
11$m
Gro
wth
%
Jun-
12
Jun-
12$m
Jun-
11$m
Gro
wth
%
LMob
ile
(i) $m
AC
CC
FA
D (i
i)$m
MTA
(ii
i)$m
NB
N
(iv)
$m
TCle
ar(v
)$m
FOXT
EL
(vi)
$mS
ales
Rev
enue
. .
. .
. .
. .
. .
.25
,232
24,9
831.
0%48
75(6
7)25
,288
24,9
831.
2%To
tal R
even
ue.
. .
. .
. .
. .
. .
.25
,368
25,0
931.
1%48
75(6
7)25
,424
25,0
931.
3%To
tal i
ncom
e (e
xcl.
finan
ce in
com
e)25
,503
25,3
040.
8%16
4875
(67)
25,5
4325
,304
0.9%
Labo
ur .
. .
. .
. .
. .
. .
. .
. .
4,
061
3,92
43.
5%0
4,06
13,
924
3.5%
Goo
ds a
nd s
ervi
ces
purc
hase
d.
. .
6,17
96,
183
(0.1
%)
936,
272
6,18
31.
4%O
ther
exp
ense
s.
. .
. .
. .
. .
. .
5,02
95,
047
(0.4
%)
(56)
0(1
30)
4,84
35,
047
(4.0
%)
Ope
ratin
g ex
pens
es.
. .
. .
. .
. 15
,269
15,1
540.
8%(5
6)0
930
(130
)15
,176
15,1
540.
1%
Sha
re o
f net
pro
fit fr
om jo
intly
co
ntro
lled
and
asso
ciat
ed e
ntiti
es .
0(1
)(1
00.0
%)
0(1
)(1
00.0
%)
EBIT
DA
. .
. .
. .
. .
. .
. .
. .
. 10
,234
10,1
510.
8%40
48(1
8)(6
7)13
010
,367
10,1
512.
1%
Dep
reci
atio
n an
d am
ortis
atio
n .
. .
4,
412
4,45
9(1
.1%
)4,
412
4,45
9(1
.1%
)EB
IT .
. .
. .
. .
. .
. .
. .
. .
.5,
822
5,69
22.
3%40
48(1
8)(6
7)13
05,
955
5,69
24.
6%
Net
fina
nce
cost
s .
. .
. .
. .
. .
.88
81,
135
(21.
8%)
888
1,13
5(2
1.8%
)
Prof
it be
fore
inco
me
tax
expe
nse
4,93
44,
557
8.3%
4048
(18)
(67)
130
5,06
74,
557
11.2
%In
com
e ta
x ex
pens
e. .
. .
. .
. .
.1,
510
1,30
715
.5%
214
(5)
(20)
01,
501
1,30
714
.8%
Prof
it fo
r the
per
iod
. .
. .
. .
. .
3,42
43,
250
5.4%
3834
(13)
(47)
130
3,56
63,
250
9.7%
Attr
ibut
able
to:
Equ
ity h
olde
rs o
f the
Tel
stra
Ent
ity .
3,40
53,
231
5.4%
3834
(13)
(47)
130
3,54
73,
231
9.8%
Non
con
trolli
ng in
tere
sts
. .
. .
. .
1919
0.0%
1919
0.0%
Free
cas
hflo
w.
. .
. .
. .
. .
. .
.5,
197
5,47
7(5
.1%
)48
(18)
(385
)44
35,
285
5,44
7(3
.5%
)
This
tabl
e ha
s be
en s
ubje
ct to
revi
ew b
y ou
r aud
itors
.
For
per
sona
l use
onl
y

23
Telstra Corporation Limited and controlled entities
Corporate Governance Statement
Corporate Governance & Board Practices 2012 Good corporate governance is the hallmark of successful companies – it adds value to the Company through efficient oversight and risk management, while encouraging innovation and entrepreneurship within the Company.
Telstra’s Board is committed to excellence in corporate governance and enhancing shareholders’ interests. Telstra regularly reviews its corporate governance systems with the aim of ensuring that it continues its commitment to good corporate governance, having regard to developments in market practice expectations and regulation.
Telstra complies with the ASX Corporate Governance Principles and Recommendations as amended in 2010 (ASX Principles and Recommendations), and the disclosures set out in this statement reflect the current content of the Board and Board Committee Charters and key company policies.
Further information regarding Telstra’s corporate governance and Board practices, including copies of Telstra’s Charters and key policies, can be found on its website at www.telstra.com/abouttelstra/corp/governance/index.cfm.
For
per
sona
l use
onl
y

24
Telstra Corporation Limited and controlled entities
Corporate Governance Statement
THE BOARD OF DIRECTORS
Role and responsibilities of the Board
The Board is responsible, and is accountable to shareholders, for managing Telstra’s business. In addition to the matters required by law to be approved by the Board, the Board’s reserved powers and key responsibilities include:
• authorising all matters which are within the reserved powers of the Board and responsibility for which has not been delegated to management;
• approving Telstra’s strategy and monitoring its performance;• annually approving Telstra’s corporate plan and monitoring
the implementation of Telstra’s strategy and performance against the corporate plan;
• appointing, assessing the performance of, and determining the remuneration of, the CEO;
• approving the appointment and remuneration, and overseeing the performance of, the executives who report directly to the CEO and any other members of the senior management team that the Board or the Remuneration Committee determines should be subject to its supervision;
• approving Telstra’s overall remuneration framework, including any employee equity plans;
• overseeing Telstra’s financial position and approving decisions concerning the capital management policy of Telstra, including capital restructures, capital returns and share buy backs, dividend policy and the payment of dividends;
• overseeing Telstra’s external and internal audit activities, internal control framework and reporting systems and strategic risk management systems;
• monitoring and influencing Telstra’s culture, reputation, ethical standards and legal compliance, and overseeing Telstra’s corporate governance framework and the key supporting policies governing the operations of Telstra;
• monitoring Telstra’s work health and safety performance; and• approving Telstra’s policies in relation to diversity at all levels
of the Company (including the Board), and setting and assessing annually measurable objectives in relation to diversity and progress in achieving them.
The Board has adopted a Charter that details its role and responsibilities, and which is available in the Corporate Governance section of the Telstra website at www.telstra.com.au/abouttelstra/company-overview/governance/documents/.
The Board has delegated responsibility for day-to-day management of the Company to the CEO and there is a formal delegations structure in place which sets out the powers delegated to the CEO and those specifically retained by the Board. This is complemented by a formal delegations structure from the CEO to Telstra employees.
Board membership and size
Telstra’s Constitution requires a minimum of three Directors. Subject to the Corporations Act, the maximum number of Directors may not be more than 11 unless Telstra’s shareholders, in a general meeting, resolve otherwise. The Directors must not determine a maximum which is less than the number of Directors in office at the time the determination takes effect.
The Directors may appoint an individual to be a Director, either as an addition to the existing Directors or to fill a casual vacancy up to the maximum number. Any decision on the appointment of a new Director is made by the Board on the basis of advice received from the Nomination Committee. Any new Director appointed by the Board during the year is required to stand for election at the next annual general meeting (AGM). Individuals may also nominate themselves (prior to the AGM and in accordance with the process outlined in the Constitution) for election as a Director at the AGM.
The tenure of the CEO as a Director is linked to his or her executive office. Under Telstra’s Constitution, no non-executive Director may hold office for more than three years or beyond the third AGM following their appointment (whichever is the later) without re-election. In accordance with the ASX Listing Rules, the Company must hold an election of Directors each year. If no Director would otherwise be required by Telstra’s Constitution to submit for election or re-election, then the procedure in rule 23.4(b) of Telstra’s Constitution must be followed.
A recommendation to re-elect a Director at the end of their term is not automatic. Prior to each AGM, the Board determines if it will recommend to shareholders that they vote in favour of the re-election of the Directors standing for re-election. This decision is made by the Board, having regard to the Directors’ annual performance reviews and any other matters it considers relevant.
Board composition
The Board considers that it has an appropriate mix of diversity (including gender diversity), skills, experience and expertise, to enable it to effectively discharge its responsibilities and to be well equipped to help the Company navigate the range of challenges that it faces.
The Board has developed a Board Skills Matrix which it utilises continuously to identify areas of focus to maintain the appropriate mix of diversity, skills, experience and expertise. The skills, experience and expertise which the Board considers to be particularly relevant include those in the areas of telecommunications, information technology, multimedia, advertising, retail and sales, infrastructure, Government relations, Australian and international business, finance and legal.
Two new non-executive Directors were appointed to the Telstra Board during fiscal 2012: Mr Timothy Y. Chen and Ms Margaret Seale. Details regarding these appointments can be found below in the section entitled “Diversity and Inclusion at Telstra”.
For
per
sona
l use
onl
y

25
Telstra Corporation Limited and controlled entities
Corporate Governance Statement
In respect of both appointments, the Board undertook a formal selection process and engaged an executive search firm to assist in the process. The Board established criteria regarding the general qualifications and experience, as well as the specific qualifications a candidate should possess to ensure the Telstra Board maintained the appropriate mix of diversity, skills, experience and expertise. Formal letters of appointment are provided to all new Directors setting out the key terms and conditions of their appointment.
All new Directors participate in a formal induction process co-ordinated by the Company Secretary. This induction process includes briefings on the Company’s financial, strategic, operational and risk management position, the Company’s governance framework, culture and values and key developments in the Company and the industry and environment in which it operates. Telstra also has in place a continuing education program for Directors which is incorporated in the annual Board cycle, with specific sessions scheduled around Board meeting dates.
A brief biography of each Director setting out their experience, expertise and membership of Telstra Board Committees, together with details of the year of initial appointment and re-election, (where applicable), is included in the Directors’ Report.
Role of the Chairman
The Chairman must be an independent Director and is appointed by the Board. Telstra’s Chairman, Catherine Livingstone, is an independent non-executive Director. She has been a Director of Telstra since 2000 and was elected Chairman in 2009.
The Chairman’s overarching responsibilities are to provide appropriate leadership to the Board and Telstra and to ensure the Board fulfils its obligations under its Charter. The Chairman also has specific responsibilities to:
• chair Board meetings, non-executive Directors’ meetings and shareholders’ meetings, and facilitate discussion within each meeting;
• represent the views of the Board and Telstra to shareholders and the public and to ensure the Board understands the views of the major shareholders;
• maintain a regular dialogue and mentoring relationship with the CEO and senior management, serving as a primary link between the Board and management and providing continuity between Board meetings; and
• work with the CEO in relation to the Board’s requirements for information to contribute effectively to the Board decision making process and to monitor the effective implementation of Board decisions.
Director Independence
The Board recognises the important contribution independent Directors make to good corporate governance. All Directors, whether independent or not, are required to act in the best interests of the Company and to exercise unfettered and independent judgment. The Board intends that the CEO is to be the only executive Director and that all non-executive Directors should also be independent Directors.
The Board assesses, at least annually, the independence of each Director. Telstra considers that an independent Director is a non-executive Director who is free of any business or other relationship that could materially interfere with or could reasonably be perceived to materially interfere with the exercise of his or her unfettered and independent judgement and ability to act in the best interests of Telstra. Materiality is assessed on a case-by-case basis from the perspective of both Telstra and the relevant Director and consideration is given to both qualitative and quantitative factors.
When assessing the independent status of a Director, the Board considers the relationships potentially affecting the independent status of a director as described in Box 2.1 of the ASX Corporate Governance Council’s Corporate Governance Principles and Recommendations. The Board may determine that a Director is independent notwithstanding the existence of a relationship of the kind referred to above. However, the Board will state the reasons for making its determination in such a case.
With the exception of the CEO, all Directors are non-executive Directors and have been determined by the Board to be independent. During fiscal 2012, no non-executive Director had any relationship that could materially interfere with, or be perceived to materially interfere with, his or her unfettered and independent judgement and ability to act in the best interests of the Company.
If at any time during the year a Director ceases or may have ceased to be independent he/she is required to advise the Chairman immediately. Where the Board determines a Director is no longer independent an announcement will be made to the market.
Board Meetings
The Board meets regularly to discuss matters relating to, among other things, strategy and performance, financial position, risk management, people, sustainability and governance. It has routinely scheduled meetings and meets on other occasions to deal with specific matters that need attention as required. The Board liaises with senior management outside Board meetings where appropriate, and may consult with other Telstra employees and advisers and seek additional information.
Details regarding the number of meetings held by the Board during fiscal 2012, and attendance by Board members, are set out in the Directors’ Report.
For
per
sona
l use
onl
y

26
Telstra Corporation Limited and controlled entities
Corporate Governance Statement
The Board and the Company Secretary
The Company Secretary reports directly to the Board through the Chairman, and all Directors have access to the Company Secretary. The Board is supported in governance and administration by the Company Secretary whose responsibilities include coordinating all Board business, (including meetings, agendas, board papers and minutes, and monitoring the completion of actions arising from Board meetings), retaining independent professional advisers at the request of the Board, Board Committee or as permitted under the Board Charter, and attending to certain statutory requirements relating to Telstra.
Board access to management and independent professional advice
Directors have complete access to Telstra’s senior management through the Chairman, CEO or Company Secretary at any time. In addition to regular presentations by senior management to Board meetings, Directors may seek briefings from senior management on specific matters.
The Board has the authority to conduct or direct any investigation required to fulfil its responsibilities and has the ability to retain, at Telstra’s expense, such legal, accounting or other advisers, consultants or experts as it considers necessary from time to time in the performance of its duties. All Committees of the Board have access to independent professional advice on this basis.
In certain circumstances, each Director has the right to seek independent professional advice at Telstra’s expense within specified limits.
Performance Evaluation
The Board reviews its performance annually (including its performance against the requirements of its Charter), the performance of individual Committees and the performance of individual Directors, including the performance of the Chairman as Chairman of the Board.
In recent years, these performance reviews have been conducted both internally and externally, generally on an alternating basis. In line with this approach and on the basis that the fiscal 2011 review was conducted internally, led by the Chairman, the fiscal 2012 review was facilitated by an external consultant. The process incorporated a number of components, including:
• a document review (such as Board agendas and Charters);• a Board performance survey of Directors and key members
of senior management;• an in-depth structured interview with each Director and key
members of senior management in relation to Board, Committee and individual Director/Chairman performance;
• overall Board performance feedback; • individual feedback to Directors relating to their performance
from the external consultant; and• a separate consideration by the Board of the performance
review findings in relation to the Chairman, in the absence of
the Chairman, with feedback provided to the Chairman in the presence of non-executive Directors.
The review included consideration of matters relating to:
• the effectiveness of discussions and debate at Board and Committee meetings;
• the relationship between the Board and management, including the level of engagement and flow of information; and
• Board processes, including level and timeliness of information provided to the Board.
The findings and recommendations of the external consultant’s review were provided to the Board. The external consultant also met separately with each Director to review individual feedback. As noted above, the Board makes recommendations to shareholders regarding the re-election of Directors having regard to the outcome of these reviews.
The overall conclusion of the review was positive and the recommendations arising from it will be implemented during fiscal 2013 to support the continued effectiveness of the Board’s performance.
During fiscal 2012, the Board also implemented the recommendations arising from the fiscal 2011 performance reviews.
Declaration of interests
Directors are required to take all reasonable steps to avoid actual, potential or perceived conflicts of interest. The Corporations Act, Telstra’s Constitution and Telstra’s Directors’ Interests Policy require the Directors to disclose any conflicts of interest and, in certain circumstances, to abstain from participating in any discussion or voting on matters in which they have a material personal interest.
If a Director believes that he or she may have a conflict of interest or material personal interest in a matter, the Director is required to disclose the matter in accordance with the requirements of the Corporations Act and the Constitution, and must follow the procedures set out in Telstra’s Directors’ Interests Policy to deal with such circumstances.
BOARD COMMITTEES
Four standing Committees assisted the Board during fiscal 2012:
• Audit Committee;• Nomination Committee;• Remuneration Committee; and • Technology Committee.
The members of each Committee, their qualifications and their attendance at Committee meetings during the year are set out in the Directors’ Report. Following each Committee meeting, the Board receives a report from that Committee on its deliberations, conclusions and recommendations.
For
per
sona
l use
onl
y

27
Telstra Corporation Limited and controlled entities
Corporate Governance Statement
Each Committee operates in accordance with a written Charter approved by the Board. The Board appoints the members and the Chairman of each Committee. With the exception of the Technology Committee, it is a Board requirement that only independent Directors can serve on Board Committees.
The role, Charter, performance and membership of each Committee are reviewed each year. Copies of the current Charters of Telstra’s Board Committees are available in the Corporate Governance section of Telstra’s website at www.telstra.com.au/abouttelstra/company-overview/governance/documents/index.htm.
In addition, the NBN Due Diligence Committee was established during fiscal 2011. The role of the Committee was to assist the Board in discharging its responsibilities by co-ordinating and overseeing the due diligence process required in connection with the NBN related resolution put to shareholders at Telstra’s 2011 AGM. The Committee ceased operation during the second half of fiscal 2012.
Audit Committee
Role and responsibilities of the Audit Committee
The Audit Committee:
• assists the Board in discharging its responsibilities by monitoring and advising on matters relating to financial reporting, risk management, internal control, internal and external audit, corporate governance, compliance and matters that may significantly impact the financial condition or affairs of the business;
• provides a forum for communication between the Board, management and both the internal and external auditors; and
• provides a conduit to the Board for external advice on audit, risk management and compliance matters.
Composition and membership of the Audit Committee
The Audit Committee comprises at least three Board members, all of whom must be independent non-executive Directors. Each member shall:
• be financially literate (i.e. able to read and understand financial statements) and have sufficient financial knowledge to allow them to discharge their duties and actively challenge information presented by management, internal and external auditors;
• have reasonable knowledge of Telstra, the industries in which it operates and its risks and controls;
• not serve on more than two other public company audit committees (unless the Board determines that such responsibilities will not impair the Director’s ability to serve on the Telstra Audit Committee); and
• have the capacity to devote the required time and attention to prepare for and attend Committee meetings.
The Chairman of the Audit Committee is an independent Director who is not Chairman of the Board. In addition, at least one member is a qualified accountant or other finance professional with experience of financial and accounting matters.
Meetings of the Audit Committee
Audit Committee meetings are held on a regular basis, as determined annually in advance by the Board, and scheduled to correspond with Telstra’s financial reporting cycle. Special meetings may be convened as required. Other members of the Board may attend Audit Committee meetings and the Audit Committee may ask management, the external auditor and others to attend meetings and provide any required advice.
The Audit Committee regularly meets with the internal auditor and the external auditor in the absence of management.
Relationship with external auditor
The Audit Committee oversees the relationship with the external auditor including:
• reviewing and agreeing on the terms of engagement and fees for the external auditor;
• reviewing the external auditor’s proposed annual audit scope and audit approach, including materiality levels;
• reviewing and assessing the performance, independence and objectivity of the external auditor; and
• monitoring management’s adherence to the policy on audit and non-audit services provided by the external auditor.
During the most recent fiscal year, the Audit Committee provided an annual, formal, written report detailing the nature and amount of any non-audit services rendered by the external auditor and an explanation of how the provision of those non-audit services are compatible with auditor independence. Details of amounts paid or payable to the auditor for non-audit services provided during the year are disclosed in Note 8 to the financial statements.
Telstra shareholders appointed Ernst & Young as the Company’s external auditor at the 2007 AGM following the resignation of the Australian National Audit Office at the conclusion of T3. The Board, on recommendation of the Audit Committee, extended Ernst & Young’s tenure as external auditor to the 2010 financial year. The Audit Committee offered the external audit to tender during fiscal 2010 and, following this process, the Board (on recommendation of the Audit Committee) reappointed Ernst & Young as the Company's external auditor. Ernst & Young is appointed as the Company’s external auditor until the end of the 2013 fiscal year.
In accordance with the Corporations Act, the lead Ernst & Young partner on the audit is required to rotate at the completion of a five year term. This occurred on signing of the fiscal 2007 audit opinion. A rotation occurred after the fiscal 2011 half year accounts were signed as the lead partner retired from Ernst & Young. The Board undertook a process with Ernst & Young and agreed upon the new lead partner.
The external auditor attends the AGM and is available to answer shareholder questions about the conduct of the audit and the preparation and content of the auditor’s report.
For
per
sona
l use
onl
y
28
Telstra Corporation Limited and controlled entities
Corporate Governance Statement
Nomination Committee
Role and responsibilities of the Nomination Committee
The Nomination Committee monitors and advises on:
• composition and performance of the Board, including Board diversity;
• Director independence;• appointment of the CEO and CEO succession planning;• CEO and Company Secretary performance; and• outside directorship requests from executives in relation to
publicly listed companies or managers of listed managed investment schemes.
Composition and membership of the Nomination Committee
The Nomination Committee comprises at least three independent Directors including the Chairman of the Board. Each member is expected to have:
• a reasonable knowledge of Telstra and the industries in which it operates; and
• the capacity to devote the required time and attention to prepare for, and attend, Committee meetings.
Meetings of the Nomination Committee
Nomination Committee meetings are held on a regular basis, as determined annually in advance by the Board. Special meetings may be convened as required.
Other members of the Board may attend Nomination Committee meetings and the Committee can invite others, including any Telstra employees, to attend all or part of its meetings as it deems necessary or appropriate. However, if a person has a material personal interest in a matter that is being considered at a meeting, they must not be present for consideration of that matter.
The Board’s policy and procedure for the selection, nomination and appointment of Directors is discussed in more detail in the sections above entitled “Board membership and size” and “Board composition”.
Remuneration Committee
Role and responsibilities of the Remuneration Committee
The Remuneration Committee monitors and advises on:
• remuneration of the Board, CEO and Company Secretary;• performance and remuneration of senior management;• remuneration strategies, practices and disclosures generally;• work health and safety;• diversity (excluding Board diversity); • employee equity plans; and• management succession, capability and talent development.
The Committee also exercises the administrative powers delegated to it by the Board under Telstra’s equity plans and, in certain circumstances, makes offers to employees under those plans.
Composition and membership of the Remuneration Committee
The Remuneration Committee comprises at least three Board members including the Chairman of the Board, all of whom must be independent non-executive Directors. Each member is expected to:
• be familiar with the legal and regulatory disclosure requirements in relation to remuneration;
• have adequate knowledge of executive remuneration issues, including executive retention and termination policies, and short term and long term incentive arrangements;
• have a reasonable knowledge of Telstra and the industries in which it operates; and
• have the capacity to devote the required time and attention to prepare for, and attend, Committee meetings.
Telstra’s Remuneration Committee structure complies with the ASX Listing Rules.
Meetings of the Remuneration Committee
Remuneration Committee meetings are held on a regular basis as determined annually in advance by the Board and scheduled to correspond with Telstra’s remuneration review and reporting cycle. Special meetings may be convened as required.
Other members of the Board may attend Remuneration Committee meetings and the Remuneration Committee may invite other people, including any Telstra employees, to attend all or part of its meetings, as it deems necessary or appropriate. However, if a person has a material personal interest in a matter that is being considered at a meeting, that person must not be present for consideration of that matter. This ensures that no senior executive is directly involved in deciding their own remuneration.
Telstra’s Remuneration Framework
Information in relation to Telstra’s remuneration framework (including information regarding the remuneration strategy and policies and their relationship to Company performance), can be found in the Remuneration Report which forms part of the Directors’ Report, together with details of the remuneration paid to:
• Board members; and• senior executives who were the key management personnel
of the Company during fiscal 2012.
The Remuneration Committee obtains external advice from independent remuneration consultants in determining Telstra’s remuneration practices where considered appropriate.
For
per
sona
l use
onl
y

29
Telstra Corporation Limited and controlled entities
Corporate Governance Statement
Telstra does not provide retirement benefits for non-executive Directors other than statutory superannuation contributions.
Each year, the Board reviews the CEO’s performance against agreed measures, broader expectations and other relevant factors. The CEO undertakes a similar exercise in relation to senior management. The results of the CEO's annual performance review of senior management are considered by the Board. The process for evaluating the performance of the CEO and senior executives is discussed in greater detail in Telstra’s Remuneration Report (particularly in the context of determining levels of compensation and awards). In fiscal 2012, the performance of the CEO and key management personnel was reviewed in the manner set out in the Remuneration Report.
Technology Committee
The Technology Committee allows the Board to review technology developments which may be relevant to Telstra’s business in greater detail than is possible at Board meetings. The Committee regularly reviews product development activities, including proposed new technology products and timelines to market. The Committee's primary purpose is educative and all Directors are encouraged to attend Committee meetings, which are scheduled to coincide with Board meetings.
SHAREHOLDER COMMUNICATIONS
Telstra is committed to:
• open, clear, accurate and timely communications with its shareholders about matters affecting the value of their investment in the Company;
• making appropriate use of technology to inform and engage its shareholders; and
• ensuring all communications are consistent with Telstra’s continuous disclosure and other applicable legal obligations.
Telstra values a direct, two-way dialogue with shareholders and believes it is important not only to provide relevant information as quickly and efficiently as possible, but also to listen, understand shareholders’ perspectives and respond to their feedback.
The specific initiatives Telstra has put in place to make that easier include:
• maintaining an investor relations website; • writing directly to shareholders on significant issues that
affect their investment;• placing all announcements made to the market, including
transcripts of investor briefings and related information, on its website after this information has been released to ASX;
• webcasting important events such as briefings and the AGM; and
• using electronic communications to advise those shareholders who have provided their email address, of significant matters.
RISK OVERSIGHT AND MANAGEMENT
Management of risks
Telstra faces a variety of risks due to the complexity of its business and the dynamic business environment in which it operates. The effective management of risks enhances Telstra’s ability to achieve its financial, customer and people goals and to meet its legal and compliance responsibilities, thereby protecting and enhancing shareholder value. Telstra’s commitment is to manage those risks that arise in the course of Telstra’s business to an acceptable level, so as to maximise opportunities and minimise negative outcomes. Recognising this, Telstra continues to improve its approach for managing, monitoring and reporting risks related to the successful pursuit of its business objectives. Risks are monitored and reported on regularly throughout the year by management and the Board as part of the strategic planning, business planning, budgeting and performance management processes.
This approach is supported by Telstra’s Risk Management framework which includes the Telstra Risk Management Policy and Risk Management methodology and tools. The framework aligns with ISO 31000 Risk Management – Principles and Guidelines, the global standard for risk management, and is also supported by Telstra’s Business Principles and a number of other policies that seek to manage risks including: Credit Management Transactions; Regulatory Risk Management and Strategy Policy; Tax Risk Management and Assurance Policy; and Treasury Transactions.
Telstra regularly reviews its Risk Management framework to ensure that it continues to effectively promote and enable the identification, management and monitoring of risks across the Company.
Risk management roles and responsibilities
Risk management occurs at all levels of the Company. The Board has ultimate responsibility for reviewing Telstra’s actual and potential material business risks, approving the risk management framework policy and overseeing Telstra’s strategic risk management and internal control framework and reporting system.
The Audit Committee assists the Board in discharging these responsibilities by monitoring and advising on matters relating to risk management including:
• overseeing management’s design and implementation of Telstra’s risk management systems; and
• reviewing and monitoring the adequacy and effectiveness of management’s reporting and risk management responses and internal control systems.
The CEO, supported by the CEO Leadership Team, is accountable for ensuring that Telstra management implements an effective risk management and internal control framework to identify, manage and monitor the company’s risks and reports to the Board on whether those risks are being managed effectively.
For
per
sona
l use
onl
y
30
Telstra Corporation Limited and controlled entities
Corporate Governance Statement
For the financial year ended 30 June 2012, the CEO and CFO have provided the Board with the certifications required by the Corporations Act and the ASX Principles and Recommendations. Specifically, the Board has received:
• reports from management as to the effectiveness of the Company’s management of its material business risks;
• the declaration from the CEO and CFO required in accordance with section 295A of the Corporations Act; and
• assurance from the CEO and CFO that the section 295A declaration was founded on a sound system of risk management and internal control and that the system is operating effectively in all material respects in relation to financial reporting risks.
LEGAL AND REGULATORY COMPLIANCE
Telstra conducts its activities in accordance with the law and its regulatory obligations. This is achieved through, among other things, the Compliance & Corporate Ethics Framework (C&CEF) which brings together Telstra’s business units and the individual subject matter specific compliance programs in an integrated, consistent and collaborative way.
Telstra maintains a comprehensive program-based approach to compliance, which is a key element of the C&CEF. Every Compliance Program is managed by a subject matter expert, who works with the business units to help them understand the various legal and regulatory obligations and responsibilities of the Company and translate them into appropriate practice. Currently there are 15 programs under the C&CEF, including Health, Safety and Wellbeing, Environment, Privacy, Competition and Consumer, Diversity and Inclusion, Disability Services, Fraud, Regulatory, Information Security, Structural Separation Undertaking, Financial Reporting Framework, Records Management, Whistleblowing, Policy Governance, and Continuous Disclosure.
This program-based approach at a corporate level is supported by a network of senior personnel appointed to perform the functions of Business Unit Compliance Manager. They are supported by business unit personnel who implement the compliance programs within their business unit.
The Audit Committee assists the Board in discharging its responsibilities by overseeing Telstra’s approach to achieving compliance with applicable laws and obligations. This oversight is facilitated by the preparation of regular compliance reports which are presented to the Audit Committee, highlighting aspects of the C&CEF.
TELSTRA VALUES, THE TELSTRA GROUP CODE OF CONDUCT & BUSINESS PRINCIPLES AND OTHER COMPANY POLICIES
Telstra Values, the Telstra Group Code of Conduct & Business Principles (TGCoC&BPs) and Telstra’s company policies promote and provide guidance on ethical and responsible decision making and behaviour. The TGCoC&BPs underpins the Telstra Values and sets out Telstra’s commitments to good corporate governance, responsible business practice, its customers, its workforce, society and the environment. Telstra’s company policies give effect to the principles embodied in the TGCoC&BP. A mandatory training program for all employees is also in place to reinforce Telstra’s legal, regulatory and compliance responsibilities.
The Telstra Values, TGCoC&BPs and some of Telstra’s key Company Policies (or summaries of them) are available on the Telstra website at www.telstra.com.au/abouttelstra /company-overview/governance/.
Privacy at Telstra
Telstra is serious about its commitment to protect the privacy of its customers, including the information that they provide to Telstra. Telstra has adopted a policy and a set of privacy principles in accordance with the Commonwealth Privacy Act 1988 and Telecommunication Act 1997, which set out Telstra’s commitment to the protection of its customers’ personal information. They outline the ways Telstra protects customer personal information, how and why Telstra collects it, how Telstra may use and disclose it, how Telstra keeps it secure and accurate, as well as how customers may access it. Telstra’s Privacy Statement, which it gives to its customers, also describes how Telstra collects, uses, discloses and secures the personal information it collects from individuals.
Further information on Privacy at Telstra is available in the sustainability reporting included in this Annual Report and at www.telstra.com.au/privacy/privacy-at-telstra/index.htm (including copies of Telstra’s Privacy Policy, Privacy Principles and Privacy Statement).
Whistleblowing
Telstra has a Whistleblowing policy and a confidential whistleblowing service which provides its staff with an avenue to report suspected unethical, illegal or improper behaviour. The whistleblowing process is supported by an independent service provider specialising in receiving sensitive reports or disclosures. All reports or disclosures are treated as confidential and can be made anonymously. Telstra’s Ethics Committee, which is made up of senior managers, monitors all reports and disclosures made under this process. This Committee also monitors all investigations, recommendations and the implementation of actions.
The Audit Committee oversees the whistleblowing program, receives reports from the Ethics Committee, and provides an escalation channel for the Ethics Committee where required.
For
per
sona
l use
onl
y

31
Telstra Corporation Limited and controlled entities
Corporate Governance Statement
Anti Bribery & Anti Corruption
Telstra’s policy on anti bribery and anti corruption aims to ensure that Telstra complies with applicable anti bribery and anti corruption laws and regulations. It states that employees and contractors of Telstra must show integrity and be honest and trustworthy in all their dealings with others. It provides that bribes, pay-offs, secret commissions, kick backs and any like payments (including facilitation payments) are strictly prohibited and staff should never make or accept, or agree to make or accept, such payments. The policy also provides that when staff give or receive a gift, prize, or hospitality, they must consider the implications of the giving or acceptance of that gift, prize or hospitality, to ensure that it cannot reasonably be considered a bribe, pay-off or kick-back, or be construed as being likely to improperly influence a business outcome.
In addition, Telstra’s policy on gifts, prizes and hospitality provides a process for employees and contractors to obtain approval for, and notify details of, certain gifts, prizes and hospitality that they are offered as a result of, or in connection with, their employment or engagement by Telstra.
Telstra also has a policy in place regarding conflicts of interest and outside activities, which provides a process to manage conflicts of interest, and assist employees, contractors and managers to understand what Telstra considers to be a conflict of interest and how to deal with any actual or potential conflicts.
Securities Trading
Telstra’s securities trading policy sets out the procedure relating to buying, selling and otherwise dealing in Telstra securities by Directors, the CEO, senior management and certain other designated employees (Designated Persons), through a trading windows approach.
Under the policy, Designated Persons must not buy, sell or otherwise deal in Telstra securities if they possess non-public, price-sensitive information and may generally only deal during a period of one month commencing 24 hours following the release of the annual results, the release of the half-yearly results or the close of the AGM.
Designated Persons are also prohibited from using Telstra shares as collateral in any financial transaction (including margin loan arrangements), engaging in any stock lending arrangements in relation to Telstra shares, and buying, selling or otherwise dealing in Telstra shares on a short-term trading basis. Further, Designated Persons are prohibited from entering into arrangements which effectively operate to limit the economic risk of their security holdings in Telstra allocated under Telstra’s equity plans during the period the shares are held in trust on their behalf by the trustee or prior to the exercise of any security.
Market Disclosure
Telstra has policies and procedures in place which are intended to ensure that it complies with its continuous disclosure obligations and releases price-sensitive information in a timely fashion to the various stock exchanges on which its shares and debt securities are listed. In particular, a continuous disclosure policy is in place and is reviewed and updated on a regular basis. The policy outlines responsibilities and sets out the process for the approval of ASX announcements, including where Board approval is required in respect of announcements that relate to certain significant matters. The policy also outlines the role of the CEO, CFO and Continuous Disclosure Committee in relation to disclosure matters.
The Continuous Disclosure Committee (consisting of the Company Secretary, the General Counsel - Finance & Strategy, the Deputy CFO, the Director - Investor Relations and a representative of Corporate Affairs, or their delegates) is responsible for monitoring potentially disclosable information provided by management and overseeing systems to ensure that material information is identified and reported to the ASX as required. Telstra has implemented several practices internally to keep the Continuous Disclosure Committee informed about potentially disclosable matters and to reinforce the importance of its continuous disclosure obligations.
Telstra’s Investor Relations Communication Policy governs communications and the provision of information to shareholders, brokers and analysts. The aim of this policy is to ensure that Telstra provides investors and the financial community with appropriate and timely information whilst at the same time ensuring that the Company fulfils its statutory reporting obligations under the Corporations Act and the ASX Listing Rules.
Telstra provides advance notification of significant group briefings, such as its results announcements, and makes them widely accessible through the use of webcasting and placing all announcements made to the market on its website.
Telstra's 3Rs of Social Media Engagement
Social media offers opportunities for people to gather online to share, connect and engage with like-minded people and communities. Telstra embraces social media as an important tool to engage with staff, customers and the public every day. With the rapid growth and application of social media, Telstra recognises the need to have a policy that ensures employees and contractors who use social media, either as part of their job or in a personal capacity, have guidance. They need to understand Telstra's expectations as a staff member when they talk online about Telstra, its products and services, its people, its competitors and/or other business related individuals or organisations. F
or p
erso
nal u
se o
nly
32
Telstra Corporation Limited and controlled entities
Corporate Governance Statement
Telstra’s 3Rs of Social Media Engagement policy requires employees and contractors to be aware of the guidelines when engaging in social media, stipulating that they be clear about who they are representing, that they take responsibility for ensuring any references to Telstra are factually correct, accurate and do not breach confidentiality requirements, and that they show respect for the individuals and communities they interact with.
Approval and accreditation is required before employees or contractors can become authorised to use social media for business purposes on behalf of Telstra. The 3Rs policy also covers the requirements for the personal use of social media if references are made to Telstra, its people, products or services, business partners or its competitors.
SUSTAINABILITY AT TELSTRA
As a large telecommunications company with a presence across Australia and an international footprint, Telstra’s responsibility is to manage its business ethically to produce an overall positive impact on its customers, employees, shareholders and other stakeholders, as well as the wider community and the natural environment.
Telstra’s primary corporate responsibilities are to:
• increase shareholder value and protect shareholder interests;
• serve the needs of its customers;• make Telstra a great place to work;• provide good stewardship of the environment;• contribute resources - people, money, technology, products
and services - to support the communities in which it operates; and
• advance the national interest by strengthening the capability of the nation's telecommunications infrastructure, and thereby providing a strong foundation for economic growth, productivity improvement, sustainable prosperity and global competitive advantage.
Governance of Telstra’s sustainability strategy and performance is provided by the Telstra Sustainability Council, which is chaired by the CEO and comprises the Company’s Executive Leadership team. Reports on progress are provided regularly to the CEO and the Telstra Board. Telstra’s Chief Sustainability Officer provides strategic leadership for Sustainability and is responsible for the implementation of its approach and programs.
Political Donations
Telstra does not make political donations. However, in line with other major publicly listed companies, it does pay fees to attend events organised by political parties where those events allow for discussion on major policy issues with key opinion leaders and policy makers.
Other Donations
Telstra makes donations and contributes funds to community and non-profit organisations as part of its approach to community investment and sustainability.
Further information on Telstra’s approach and progress in relation to sustainability, including the work of the Telstra Foundation and Telstra’s support of community and non-profit organisations, can be found in the sustainability reporting included in this Annual Report and on Telstra’s website at www.telstra.com.au/sustainability.
DIVERSITY AND INCLUSION AT TELSTRA
At Telstra, diversity includes differences that relate to gender, age, ethnicity, disability, sexual orientation and cultural background. It also includes differences in background and life experience, communication styles, interpersonal skills, education, functional expertise and problem solving skills.
Having a diverse range of employees better enables Telstra to provide the best in service to its customers. It enables it to foster greater innovation, stronger problem solving capability, greater customer connection, increased morale, motivation and engagement.
Diversity and inclusion at Telstra are business imperatives. Telstra’s approach is based on three strategic pillars:
• our customers – to leverage diversity as a business driver; • our communities – to be a leader in diversity and inclusion in
the broader community;• our people – to attract, recruit, engage and retain diverse
talent, and embed inclusive practices within each part of Telstra’s employee life-cycle.
Telstra’s diversity and inclusion framework has five core principles – meritocracy, fairness and equality, contribution to commercial success, that it’s everyone’s business, and that, at Telstra, it’s a part of who we are.
Diversity and inclusion at Telstra is led by Telstra's CEO Leadership Team, who convene as the Telstra Diversity Council on a quarterly basis. This group is chaired by the CEO.
On 30 June 2010, the ASX Corporate Governance Council released the Amended ASX Principles and Recommendations, which included amendments in relation to diversity. While the changes did not apply to Telstra until this financial year, the Company had already taken steps to adopt key provisions of the ASX Principles and Recommendations as disclosed in previous annual reports. These steps included:
• establishing measurable objectives for achieving diversity at all levels of the Company in respect of fiscal 2012;
• formally adopting policies in relation to diversity at Board level and at all levels below the Board, reflecting the principles and practices Telstra has had in place for a number of years – this provided the framework for measurable objectives to be set by the Board. These policies are available on Telstra’s website at www.telstra.com.au/abouttelstra/company-overview/governance/; and
• including responsibility for diversity in the Board Charter, the Nomination Committee Charter (Board diversity) and the Remuneration Committee Charter (diversity at all levels of the Company below Board level).
For
per
sona
l use
onl
y
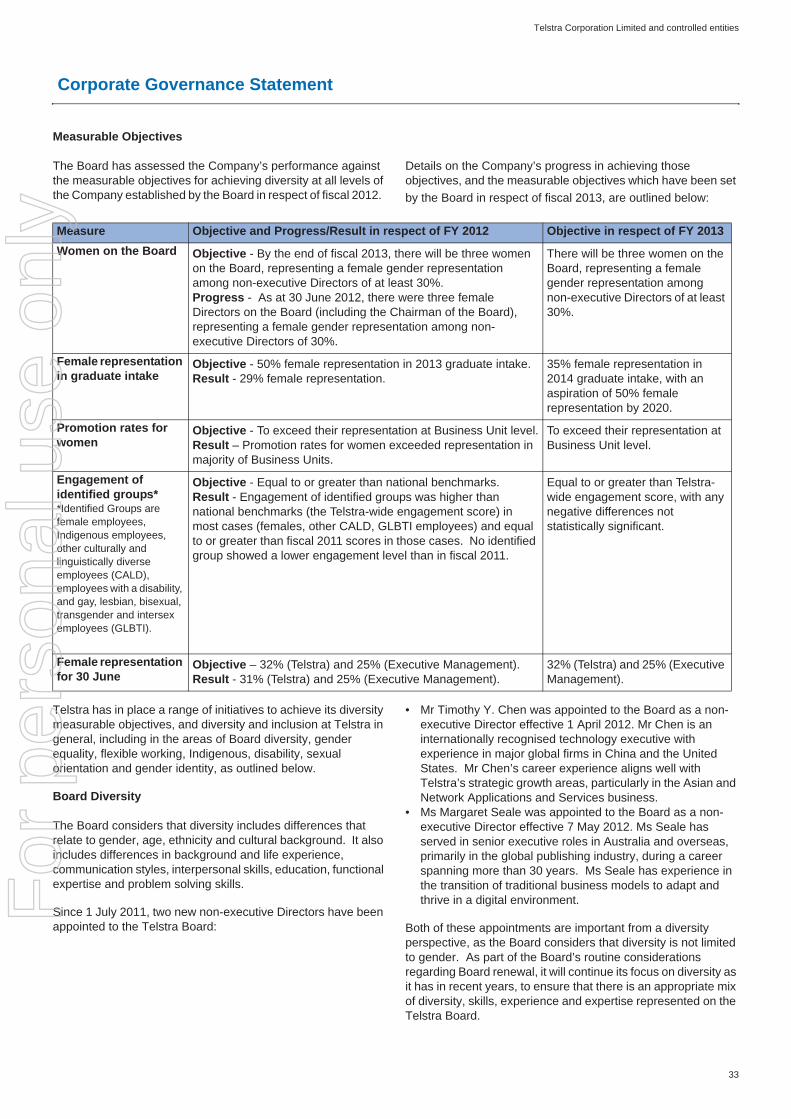
33
Telstra Corporation Limited and controlled entities
Corporate Governance Statement
Measurable Objectives
The Board has assessed the Company’s performance against the measurable objectives for achieving diversity at all levels of the Company established by the Board in respect of fiscal 2012.
Details on the Company’s progress in achieving those objectives, and the measurable objectives which have been set by the Board in respect of fiscal 2013, are outlined below:
Telstra has in place a range of initiatives to achieve its diversity measurable objectives, and diversity and inclusion at Telstra in general, including in the areas of Board diversity, gender equality, flexible working, Indigenous, disability, sexual orientation and gender identity, as outlined below.
Board Diversity
The Board considers that diversity includes differences that relate to gender, age, ethnicity and cultural background. It also includes differences in background and life experience, communication styles, interpersonal skills, education, functional expertise and problem solving skills.
Since 1 July 2011, two new non-executive Directors have been appointed to the Telstra Board:
• Mr Timothy Y. Chen was appointed to the Board as a non-executive Director effective 1 April 2012. Mr Chen is an internationally recognised technology executive with experience in major global firms in China and the United States. Mr Chen’s career experience aligns well with Telstra’s strategic growth areas, particularly in the Asian and Network Applications and Services business.
• Ms Margaret Seale was appointed to the Board as a non-executive Director effective 7 May 2012. Ms Seale has served in senior executive roles in Australia and overseas, primarily in the global publishing industry, during a career spanning more than 30 years. Ms Seale has experience in the transition of traditional business models to adapt and thrive in a digital environment.
Both of these appointments are important from a diversity perspective, as the Board considers that diversity is not limited to gender. As part of the Board’s routine considerations regarding Board renewal, it will continue its focus on diversity as it has in recent years, to ensure that there is an appropriate mix of diversity, skills, experience and expertise represented on the Telstra Board.
Measure Objective and Progress/Result in respect of FY 2012 Objective in respect of FY 2013Women on the Board Objective - By the end of fiscal 2013, there will be three women
on the Board, representing a female gender representation among non-executive Directors of at least 30%.Progress - As at 30 June 2012, there were three female Directors on the Board (including the Chairman of the Board), representing a female gender representation among non-executive Directors of 30%.
There will be three women on the Board, representing a female gender representation among non-executive Directors of at least 30%.
Female representation in graduate intake
Objective - 50% female representation in 2013 graduate intake.Result - 29% female representation.
35% female representation in 2014 graduate intake, with an aspiration of 50% female representation by 2020.
Promotion rates for women
Objective - To exceed their representation at Business Unit level.Result – Promotion rates for women exceeded representation in majority of Business Units.
To exceed their representation at Business Unit level.
Engagement of identified groups* *Identified Groups are female employees, Indigenous employees, other culturally and linguistically diverse employees (CALD), employees with a disability, and gay, lesbian, bisexual, transgender and intersex employees (GLBTI).
Objective - Equal to or greater than national benchmarks.Result - Engagement of identified groups was higher than national benchmarks (the Telstra-wide engagement score) in most cases (females, other CALD, GLBTI employees) and equal to or greater than fiscal 2011 scores in those cases. No identified group showed a lower engagement level than in fiscal 2011.
Equal to or greater than Telstra-wide engagement score, with any negative differences not statistically significant.
Female representation for 30 June
Objective – 32% (Telstra) and 25% (Executive Management).Result - 31% (Telstra) and 25% (Executive Management).
32% (Telstra) and 25% (Executive Management).
For
per
sona
l use
onl
y

34
Telstra Corporation Limited and controlled entities
Corporate Governance Statement
There are a number of initiatives the Board has in place to meet its strategic imperative of ensuring the Company has a diverse Board and to achieve its measurable objective regarding Board diversity. These include:
• ensuring a diverse range of qualified candidates are considered for Board appointments;
• developing a pipeline of potential Board candidates;• evolving a Board skills matrix and using the matrix to identify
any gaps in the experience, skills and background, including gender and diversity generally, of Directors on the Board;
• considering diversity at Nomination Committee and Board meetings;
• reporting on the use of professional intermediaries (such as external search firms) to identify and assess qualified candidates (as disclosed earlier in the section entitled “Board composition”); and
• participating in programs to assist in the development of a broader pool of skilled and experienced Board candidates, including support for the AICD ASX 200 Chairmen’s Mentoring Program.
Gender equality
At Telstra, it is critical that gender is not a barrier to participation, success and opportunity. The Company’s approach to gender equality is to involve both women and men in creating an inclusive environment. The achievements of Telstra Corporation Limited in fiscal 2012 include:
• Telstra was a winner of the 2011 Australian HR Award for Best Workplace Diversity Strategy and Winner of the 2012 Australian HR Institute Award for Gender Equity, with individual recognition as winner in the CEO and HR Champion categories;
• Telstra’s CEO continued his involvement in the “Male Champions of Change” group, convened by Australia’s Sex Discrimination Commissioner, Elizabeth Broderick. This group models effective leadership by male executives in relation to gender equality in some of Australia’s largest corporate and government organisations;
• ongoing implementation of a specific employment brand and website to increase the attraction of women into roles at Telstra;
• further closure of the gender pay equity gap through close analysis and deliberate action to correct differences in pay that cannot be explained by differences in length of service or levels of performance when comparing people doing the same jobs;
• embedding of inclusive practice across the employee life-cycle, into the responsibilities of middle and senior managers;
• Telstra’s continued support of its women and men participating in development events and programs, and partnering with organisations such as Catalyst, Sustaining Women in Business, Business Chicks, Women in Engineering, Chief Executive Women and Females in Information Technology and Telecommunications; and
• Telstra men continued as ambassadors and supporters of the White Ribbon Foundation campaign to eliminate violence against women; and
• Telstra was included on the 2012 Women on Boards Traffic Light Index on gender diversity with a “green” rating. The index evaluates companies’ responses to the revised Principle 3 of the ASX Corporate Governance Principles and Recommendations.
.
* Includes full time and part time staff paid by Telstra Corporation Limited and Sensis Pty Ltd, excluding casual staff and agency staff.
Representation of Women in the Telstra Group*– as at 30 June 2012
*Includes full time and part time staff in entities within the Telstra Group, excluding casual staff and agency staff. For a list of the entities in the Telstra Group, please refer to Note 25 of the Financial Statements.
Women at Telstra*– as at 30 June 2012
As at 30 June 2012 As at 30 June 2011Role By Number By Percentage By Number By PercentageExecutive Management 63 25% 56 23%Middle Management 2,198 27% 2,064 27%Operational 8,083 33% 8,256 33%TOTAL 10,343 31% 10,385 31%
As at 30 June 2012Women 11,857 31%
For
per
sona
l use
onl
y
35
Telstra Corporation Limited and controlled entities
Corporate Governance Statement
Flexible Work and Careers
New policies covering Flexible Working and Working outside the Office were launched within the Company in December 2011. These policies provide a platform for further promotion of flexible work and careers and active practice of inclusion, particularly for women and men with caring responsibilities. Wide consultations were conducted throughout the Company, and companywide education and awareness sessions were commenced on flexible working, to continue to bring the Company’s policies into practice.
Other Initiatives
The Company’s commitment to, and work in, other areas of Diversity and Inclusion during fiscal 2012 has also resulted in achievements in each of the following areas:
Indigenous Australians – The Company commenced developing its specific Indigenous employment brand and completed an Indigenous Employment Plan which was endorsed by the Australian Government Department of Education, Employment and Workplace Relations. As part of this Plan, Telstra completed a feasibility study that identifies the opportunities it has to increase Indigenous career pathways and job readiness. Telstra’s Employment Plan outlines how it will achieve this through traineeships, cadetships and graduate recruitment, among other approaches.
The intake of Indigenous trainees in Telstra Operations and Customer Sales and Service increased in fiscal 2012 as a result of targeted recruitment initiatives and candidate care, meeting the targets Telstra set for this year. 17 of the 20 Indigenous employees who joined Telstra during fiscal 2012 remain employed at Telstra as at 30 June 2012. Voluntary separation of Indigenous employees remains consistently below representation.
Disability – Telstra employs people at all levels in the Company who identify as living with a disability, in a variety of roles and Business Units, from operational to Executive levels. In fiscal 2012, Telstra continued its partnership with the National Disability Recruitment Coordinator (NDRC) to support candidates with a disability to have great careers at Telstra. Between 1 July 2010 and 30 June 2012, 52 new Telstra employees have identified as living with a disability, representing a 14% increase on initial numbers. Telstra’s voluntary separation rates of employees with a disability are consistently lower than their representation rates and the engagement of this group increased over the past year. Telstra has also continued the employment of people with a disability working in a supported program to help in the maintenance of Telstra Exchanges. Its work on employment of people with a disability was recognised as Finalists in the 2012 AHRI Diversity Awards in the “Disability Employment” category.
GLBTI Inclusion – Telstra supported the Aids Trust of Australia with its Red Ribbon SMS service for World Aids Day 2011, its GLBTI employees contributed their stories by video to the global “It Gets Better” campaign to support GLBTI youth and Telstra continued its support of the Midsumma Festival in Melbourne. Engagement of GLBTI employees at Telstra remains very high.
Telstra believes that the benefits of its activities and initiatives around Diversity and Inclusion accrue in many ways in its business. Most importantly, improving diversity and flexibility within its workforce has seen increased employee engagement, which is a key driver for productivity and providing great customer service. It also helps Telstra remain innovative in the ever-changing markets in which it operates. In addition, improving the diversity of its workforce and being an inclusive place to work has meant that Telstra has been able to build stronger connections in the communities it serves and in which its employees live, and has been able to effect beneficial changes for them. Telstra’s plans in these areas are focussed on continuing to connect with its diverse customer base, contribute within the community and be a place where diverse people can be engaged and productive in delivering against Telstra’s strategy.
Further information regarding Telstra’s customer and community diversity and inclusion initiatives can be found in the sustainability reporting included in this Annual Report and on Telstra’s website at www.telstra.com.au/sustainability.
For
per
sona
l use
onl
y

36
Telstra Corporation Limited and controlled entities
Corporate Governance Statement
Compliance with the ASX Principles and Recommendations
The table below is provided to facilitate your understanding of Telstra’s compliance with the ASX Principles and Recommendations*.
Recommendation Please refer to the following sections of the Corporate Governance Statement
Recommendation 1.1:Companies should establish the functions reserved to the board and those delegated to senior executives and disclose those functions.
See “Role and responsibilities of the Board”.See also the Board Charter which is available on Telstra’s website.
Recommendation 1.2:Companies should disclose the process for evaluating the performance of senior executives.
See the Remuneration Report (in particular, page 55) which forms part of the Directors’ Report.
Recommendation 2.1:A majority of the board should be independent directors.
See “Director Independence”.
Recommendation 2.2:The chair should be an independent director.
See “Role of the Chairman".
Recommendation 2.3:The roles of chair and chief executive officer should not be exercised by the same individual.
See “Role of the Chairman".
Recommendation 2.4:The board should establish a nomination committee.
See “Nomination Committee”.See also the Nomination Committee Charter which is available on Telstra’s website.
Recommendation 2.5:Companies should disclose the process for evaluating the performance of the board, its committees and individual directors.
See “Performance Evaluation”.
Recommendation 3.1:Companies should establish a code of conduct and disclose the code or a summary of the code as to:
• the practices necessary to maintain confidence in the company’s integrity;
• the practices necessary to take into account their legal obligations and the reasonable expectations of their stakeholders; and
• the responsibility and accountability of individuals for reporting and investigating reports of unethical practices.
See “Telstra Values, the Telstra Group Code of Conduct & Business Principles, and other Company Policies”.See also the Telstra Group Code of Conduct & Business Principles which are available on Telstra’s website.
Recommendation 3.2:Companies should establish a policy concerning diversity and disclose the policy or a summary of that policy. The policy should include requirements for the board to establish measurable objectives for achieving gender diversity and assess annually both the objectives and progress in achieving them.
See “Diversity and Inclusion at Telstra”. See also Telstra’s diversity policies which are available on its website.
Recommendation 3.3:Companies should disclose in each annual report the measurable objectives for achieving gender diversity set by the board in accordance with the diversity policy and progress towards achieving them.
See “Diversity and Inclusion at Telstra”.
Recommendation 3.4:Companies should disclose in each annual report the proportion of women employees in the whole organisation, women in senior executive positions and women on the board.
See “Diversity and Inclusion at Telstra”.
Recommendation 4.1:The board should establish an audit committee.
See “Audit Committee”.
* The table includes all recommendations in the ASX Principles and Recommendations other than the “Guide to Reporting” recommendations.
For
per
sona
l use
onl
y

37
Telstra Corporation Limited and controlled entities
Corporate Governance Statement
Recommendation Please refer to the following sections of the Corporate Governance Statement
Recommendation 4.2:The audit committee should be structured so that it:• consists only of non-executive directors;• consists of a majority of independent directors;• is chaired by an independent chair, who is not chair of the
board; and• has at least three members.
See “Audit Committee”.
Recommendation 4.3The audit committee should have a formal charter.
See “Audit Committee”.See also the Audit Committee Charter which is available on Telstra’s website.
Recommendation 5.1:Companies should establish written policies designed to ensure compliance with ASX Listing Rule disclosure requirements and to ensure accountability at a senior executive level for that compliance and disclose those policies or a summary of those policies.
See the “Market Disclosure” section in “Telstra Values, the Telstra Group Code of Conduct & Business Principles, and other Company Policies”.
Recommendation 6.1:Companies should design a communications policy for promoting effective communication with shareholders and encouraging their participation at general meetings and disclose their policy or a summary of that policy.
See “Shareholder Communications”.See also the Telstra Group Code of Conduct & Business Principles which are available on Telstra’s website.
Recommendation 7.1:Companies should establish policies for the oversight and management of material business risks and disclose a summary of those policies.
See “Risk Oversight and Management”.See also the Telstra Group Code of Conduct & Business Principles which are available on Telstra’s website.
Recommendation 7.2:The board should require management to design and implement the risk management and internal control system to manage the company’s material business risks and report to it on whether those risks are being managed effectively. The board should disclose that management has reported to it as to the effectiveness of the company’s management of its material business risks.
See “Risk Oversight and Management”.
Recommendation 7.3:The board should disclose whether it has received assurance from the chief executive officer (or equivalent) and the chief financial officer (or equivalent) that the declaration provided in accordance with section 295A of the Corporations Act is founded on a sound system of risk management and internal control and that the system is operating effectively in all material respects in relation to financial reporting risks.
See “Risk Oversight and Management”.
Recommendation 8.1:The board should establish a remuneration committee.
See “Remuneration Committee”.See also the Remuneration Committee Charter which is available on Telstra’s website.
Recommendation 8.2:The remuneration committee should be structured so that it:• consists of a majority of independent directors• is chaired by an independent chair• has at least three members.
See “Remuneration Committee”.See also the Remuneration Committee Charter which is available on Telstra’s website.
Recommendation 8.3:Companies should clearly distinguish the structure of non-executive directors’ remuneration from that of executive directors and senior executives.
See the Remuneration Report (in particular pages 57 and 61) which forms part of the Directors’ Report.
For
per
sona
l use
onl
y

38
Telstra Corporation Limited and controlled entities
Shareholder Information
Listing Information
Markets in which our shares are traded
We are listed, and all our issued shares are quoted on the Australian Securities Exchange (ASX) and the New Zealand Stock Exchange (NZX).
Markets on which our debt securities are listed
We also have debt securities listed on the ASX, the London Stock Exchange, the Singapore Stock Exchange and the Swiss Stock Exchange.
Distribution of securities and security holdings
The following table shows the number of listed shares on issue at 6 August 2012:
Distribution of shares
The following table summaries the distribution of our listed shares as at 6 August 2012:
The number of shareholders holding less than a marketable parcel of shares was 12,620 holding 840,491 shares.
Title of classIdentity of person or group Amount owned %
Listed Shares Listed shareholders 12,443,074,357 100.00
Size of Holding Number of Shareholders % Number of Shares %1-1,000 662,973 48.09 382,345,595 3.071,001-2,000 241,573 17.52 352,304,426 2.832,001-5,000 264,097 19.16 847,119,295 6.815,001-10,000 116,692 8.46 823,315,196 6.6210,001-100,000 89,777 6.51 2,125,093,751 17.08100,001 and over 3,490 0.25 7,912,896,094 63.59Total 1,378,602 100.00 12,443,074,357 100.00
For
per
sona
l use
onl
y

39
Telstra Corporation Limited and controlled entities
Shareholder Information
Substantial shareholders
As at 6 August 2012, we are not aware of any substantial shareholders.
Twenty largest shareholders as at 6 August 2012
The following table sets out the Top 20 holders of our shares (when multiple holdings are grouped together):
Voting Rights
Shareholders (whether residents or non-residents of Australia) may vote at a meeting of shareholders in person, directly or by proxy, attorney or representative, depending on whether the shareholder is an individual or a company.
Subject to any rights or restrictions attaching to our shares, on a show of hands each shareholder present in person or by proxy, attorney or representative has one vote and, on a poll, has one vote for each fully paid share held. Presently, we have only one class of fully paid ordinary shares and these do not have any voting restrictions. If shares are not fully paid, on a poll the number of votes attaching to the shares is pro-rated accordingly.
Shareholders Number of Shares % of Issued Capital1 HSBC CUSTODY NOMINEES (AUSTRALIA) LIMITED 2,051,414,797 16.492 NATIONAL NOMINEES LIMITED 1,731,941,580 13.923 J P MORGAN NOMINEES AUSTRALIA LTD 1,430,229,877 11.494 COGENT NOMINEES PTY LIMITED 305,846,874 2.465 CITICORP NOMINEES PTY LIMITED 286,557,842 2.306 RBC GLOBAL SERVICES AUSTRALIA NOMINEES PTY LTD 193,921,065 1.567 CITICORP NOMINEES PTY LIMITED <COLONIAL FIRST STATE INV A/C> 169,401,819 1.368 JP MORGAN NOMINEES AUSTRALIA LIMITED <CASH INCOME A/C> 125,819,768 1.019 AMP LIFE LIMITED 115,005,150 0.92
10 UBS WEALTH MANAGEMENT AUSTRALIA NOMINEES PTY LTD 64,482,443 0.5211 AUSTRALIAN FOUNDATION INVESTMENT COMPANY LIMITED 53,695,000 0.4312 UBS NOMINEES PTY LTD 49,882,459 0.4013 NEWECONOMY COM AU NOMINEES PTY LIMITED 36,418,851 0.2914 TELSTRA GROWTHSHARE PTY LTD 29,272,227 0.2415 ARGO INVESTMENTS LIMITED 29,204,800 0.2316 QUESTOR FINANCIAL SERVICES LIMITED 25,665,758 0.2117 QUEENSLAND INVESTMENT CORPORATION 25,479,545 0.2018 NAVIGATOR AUSTRALIA LTD 21,384,639 0.1719 SHARE DIRECT NOMINEES PTY LTD 20,127,287 0.1620 NULIS NOMINEES (AUSTRALIA) LIMITED 18,532,139 0.15
Total for Top 20 6,784,283,920 54.52
For
per
sona
l use
onl
y

Telstra Corporation Limited and controlled entities
40
Directors’ Report
In accordance with a resolution of the Board, the Directors present their report on the consolidated entity (Telstra Group) consisting of Telstra Corporation Limited and the entities it controlled at the end of, or during the year ended, 30 June 2012. Financial comparisons used in this report are of results for the year ended 30 June 2012 compared with the year ended 30 June 2011.
The historical financial information included in this Directors' Report that has been extracted from the Annual Report accompanying this Directors' Report has been subject to review by our Auditors.
Principal activity
Our principal activity during the financial year was to provide telecommunications and information services for domestic and international customers. There has been no significant change in the nature of this activity during the year.
Strategy Update
Telstra continues to implement its strategy to improve customer satisfaction, increase our customer base, simplify the business and invest in new growth businesses. The strategic initiatives commenced almost two years ago continue to deliver financial benefits with growth in revenue, earnings before interest, tax, depreciation and amortisation (EBITDA), net profit and strong growth in the number of customers.
Customer satisfaction
TIO level 1 complaints relating to Telstra reduced by 26% and consumer call volumes by 21%. Customer service improvements introduced over the last year include a new consumer bill format, making it simpler and clearer for customers to understand charges, the introduction of an application which enables customers to access their account via an Apple iPad^ and Facebook and many other operational improvements.
Growth in number of customers
Telstra's product offers and network investments continued to attract new customers during the year, adding:
• 1.6 million domestic mobile customers, to a total of 13.8 million;
• 203,000 retail fixed broadband customers, to a total of 2.6 million;
• 336,000 customers on bundled plans, to a total of 1.4 million;• 475,000 Hong Kong mobile customers, to a total of 3.5
million.
Telstra's 4G network build accelerated during the year and now covers approximately 40% of Australia's population. Customers have activated more than 375,000 4G devices since launch.
Telstra's domestic mobile business generated more than one third of revenue. Telstra has added more than three million new mobile customers over the past two years. Mobile revenue growth of 8.5% was achieved while margins increased by three percentage points to 36%.
Growth in retail broadband partly offset declines in wholesale revenues, which included the impact of regulatory access determinations. Fixed line revenue decline was steady at 6.1%.
Simplification
Telstra's business improvement programme remained on track and delivered benefits in fiscal 2012 of $1.1 billion, enabling reinvestment in customer service initiatives. These benefits included improvements in labour productivity, reduced customer call volumes and growth in online customer interactions.
Growth opportunities
Network Application and Services (NAS) revenue grew by 10.5% to $1,263 million, with several significant contracts signed providing a strong foundation for 2013. Major customers signed within the NAS portfolio included the Department of Human Services, Australia Post and NAB.
Across the Media portfolio, Foxtel's acquisition of Austar was an important milestone. Sensis revenue declined by 17.7% as the move to online accelerated. Customer response to Sensis' digital offers improved in recent months across metro and non-metro regions. Excluding Sensis and advertising, digital media product revenue increased 4.7% over the year.
In the Telstra International Group, which incorporates Telstra's investments in Asia, revenue grew by 7% driven by growth in the Hong Kong mobile services (CSL) business and global connectivity and international NAS products (Telstra Global), as the company benefited from integrating assets acquired from Reach.
National Broadband Network (NBN)
In March 2012, Telstra finalised the NBN agreements with the Commonwealth and NBN Co, including ACCC acceptance of Telstra's Structural Separation Undertaking, and commenced providing long term infrastructure access under the Infrastructure Services Agreement (ISA). Telstra recently handed over stage one of the transit network (dark fibre and exchange rack spaces) to NBN Co. The company continues to work collaboratively with NBN Co on the building of its access network. Telstra has also launched retail and wholesale services over the NBN following successful trials in the early release sites.
Review and results of operations
Information on the operations, financial position and outlook for the Telstra Group is set out on pages 3 to 22 of the Financial Highlights accompanying this Directors' Report.
For
per
sona
l use
onl
y
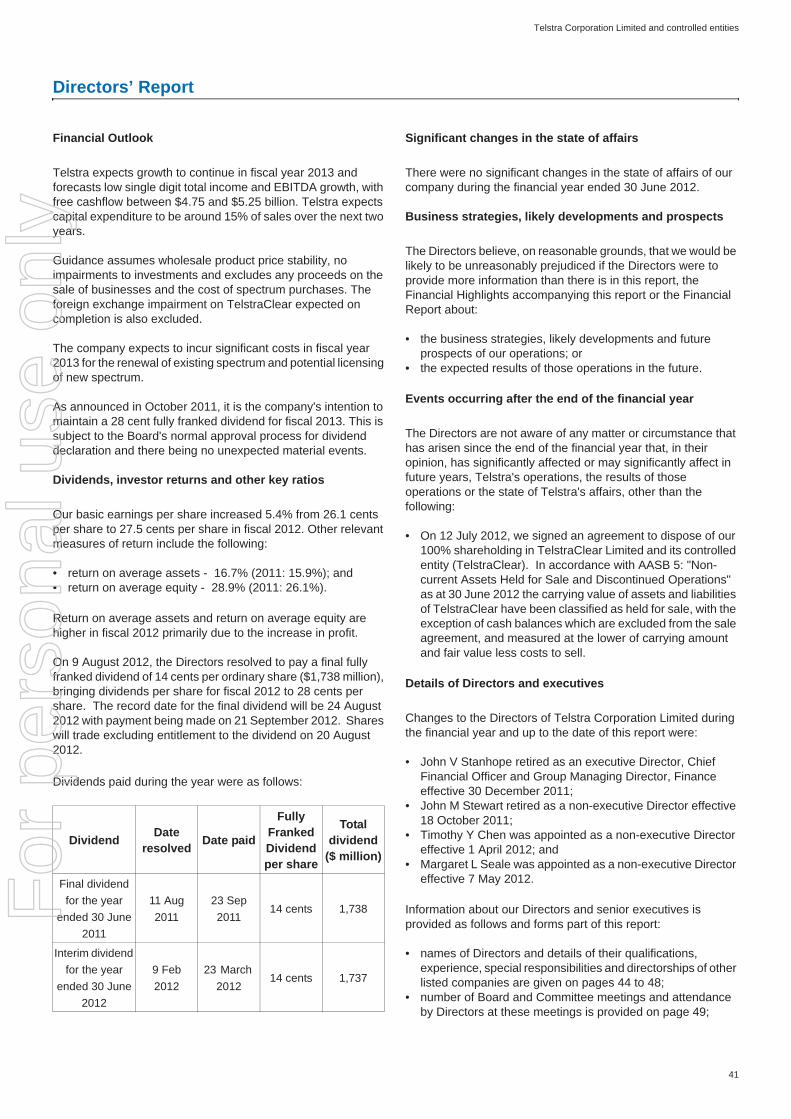
Telstra Corporation Limited and controlled entities
41
Directors’ Report
Financial Outlook
Telstra expects growth to continue in fiscal year 2013 and forecasts low single digit total income and EBITDA growth, with free cashflow between $4.75 and $5.25 billion. Telstra expects capital expenditure to be around 15% of sales over the next two years.
Guidance assumes wholesale product price stability, no impairments to investments and excludes any proceeds on the sale of businesses and the cost of spectrum purchases. The foreign exchange impairment on TelstraClear expected on completion is also excluded.
The company expects to incur significant costs in fiscal year 2013 for the renewal of existing spectrum and potential licensing of new spectrum.
As announced in October 2011, it is the company's intention to maintain a 28 cent fully franked dividend for fiscal 2013. This is subject to the Board's normal approval process for dividend declaration and there being no unexpected material events.
Dividends, investor returns and other key ratios
Our basic earnings per share increased 5.4% from 26.1 cents per share to 27.5 cents per share in fiscal 2012. Other relevant measures of return include the following:
• return on average assets - 16.7% (2011: 15.9%); and• return on average equity - 28.9% (2011: 26.1%).
Return on average assets and return on average equity are higher in fiscal 2012 primarily due to the increase in profit.
On 9 August 2012, the Directors resolved to pay a final fully franked dividend of 14 cents per ordinary share ($1,738 million), bringing dividends per share for fiscal 2012 to 28 cents per share. The record date for the final dividend will be 24 August 2012 with payment being made on 21 September 2012. Shares will trade excluding entitlement to the dividend on 20 August 2012.
Dividends paid during the year were as follows:
Significant changes in the state of affairs
There were no significant changes in the state of affairs of our company during the financial year ended 30 June 2012.
Business strategies, likely developments and prospects
The Directors believe, on reasonable grounds, that we would be likely to be unreasonably prejudiced if the Directors were to provide more information than there is in this report, the Financial Highlights accompanying this report or the Financial Report about:
• the business strategies, likely developments and future prospects of our operations; or
• the expected results of those operations in the future.
Events occurring after the end of the financial year
The Directors are not aware of any matter or circumstance that has arisen since the end of the financial year that, in their opinion, has significantly affected or may significantly affect in future years, Telstra's operations, the results of those operations or the state of Telstra's affairs, other than the following:
• On 12 July 2012, we signed an agreement to dispose of our 100% shareholding in TelstraClear Limited and its controlled entity (TelstraClear). In accordance with AASB 5: "Non-current Assets Held for Sale and Discontinued Operations" as at 30 June 2012 the carrying value of assets and liabilities of TelstraClear have been classified as held for sale, with the exception of cash balances which are excluded from the sale agreement, and measured at the lower of carrying amount and fair value less costs to sell.
Details of Directors and executives
Changes to the Directors of Telstra Corporation Limited during the financial year and up to the date of this report were:
• John V Stanhope retired as an executive Director, Chief Financial Officer and Group Managing Director, Finance effective 30 December 2011;
• John M Stewart retired as a non-executive Director effective 18 October 2011;
• Timothy Y Chen was appointed as a non-executive Director effective 1 April 2012; and
• Margaret L Seale was appointed as a non-executive Director effective 7 May 2012.
Information about our Directors and senior executives is provided as follows and forms part of this report:
• names of Directors and details of their qualifications, experience, special responsibilities and directorships of other listed companies are given on pages 44 to 48;
• number of Board and Committee meetings and attendance by Directors at these meetings is provided on page 49;
Dividend Date resolved Date paid
Fully Franked Dividend per share
Total dividend
($ million)
Final dividend for the year
ended 30 June 2011
11 Aug 2011
23 Sep 2011
14 cents 1,738
Interim dividend for the year
ended 30 June 2012
9 Feb 2012
23 March 2012
14 cents 1,737
For
per
sona
l use
onl
y

Telstra Corporation Limited and controlled entities
42
Directors’ Report
• details of Director shareholdings in Telstra are shown on page 49; and
• details of Director and senior executive remuneration is detailed in the Remuneration Report on pages 51 to 70.
Company Secretary
The qualifications and experience of our Company Secretary are detailed on page 48 and form part of this report.
Directors' and officers' indemnity
Constitution
Telstra's constitution provides for it to indemnify each officer, to the maximum extent permitted by law, for any liability and legal costs incurred as an officer of Telstra or a related body corporate.
If one of Telstra's officers or employees is asked by Telstra to be a Director or other officer of a company which is not related to it, Telstra's constitution provides for it to indemnify the officer or employee for any liability he or she incurs. This indemnity only applies if the liability was incurred in the officer's or employee's capacity as an officer of that other company. Telstra's constitution also allows it to indemnify employees and outside officers in some circumstances. The terms "officer", "employee" and "outside officer" are defined in Telstra's constitution.
Deeds of indemnity in favour of Directors, officers and employees
Telstra has also executed deeds of indemnity in favour of (amongst others):
• Directors of Telstra (including past Directors);• secretaries and executive officers of Telstra (other than
Telstra Directors) and Directors, secretaries and executive officers of Telstra's wholly owned subsidiaries;
• Directors, secretaries and executive officers of a related body corporate of Telstra (other than a wholly owned subsidiary) while the Director, secretary or executive officer was also an employee of Telstra or a Director or employee of a wholly owned subsidiary of Telstra (other than Telstra Directors); and
• the officers listed above (other than Telstra Directors) and certain employees of Telstra or a related body corporate of Telstra who are appointed as Directors of a company which is not a related body corporate of Telstra, at the request of Telstra.
Each of these deeds provides an indemnity as permitted under Telstra's constitution and the Corporations Act 2001. The term "executive officer" is defined in the relevant deed of indemnity. The deeds in favour of Directors of Telstra also give Directors certain rights of access to Telstra's books and require it to maintain insurance cover for the Directors.
Additionally, Telstra has executed an indemnity in favour of employees (including officers other than Directors) in respect of certain liabilities incurred in the formulation, entering into or carrying out, of a Telstra Sale Scheme (as defined in the Telstra Corporation Act 1991 (Cwlth)). This indemnity is provided as permitted under Telstra's constitution and the Corporations Act 2001. Although all Telstra Sale Schemes conducted by the Commonwealth Government have been completed, the indemnity will remain in place while it is possible for claims to arise under a Telstra Sale Scheme.
Telstra has also executed a deed of indemnity in favour of certain employees (including certain officers), in respect of liabilities and legal costs which may be incurred as part of the NBN transaction. The indemnity is to the maximum extent permitted by law and is subject to the employee performing his or her duties such as acting in good faith and complying with all applicable laws.
Directors' and officers' insurance
Telstra maintains a Directors' and officers' insurance policy that, subject to some exceptions, provides worldwide insurance cover to past, present or future Directors, secretaries or officers and certain employees of Telstra and its subsidiaries. Telstra has paid the premium for the policy. The Directors' and officers' insurance policy prohibits disclosure of the premium payable under the policy and the nature of the liabilities insured.
Environmental regulation and performance
Telstra's operations are subject to significant environmental regulation under Commonwealth, State and Territory law, particularly with regard to:
• the impact of the installation and maintenance of telecommunications infrastructure;
• energy and water efficiency;• reporting of a range of environmental matters including
energy use and greenhouse gas emissions;• packaging of products;• procurement of services;• site contamination and pollution; and• waste management.
Telstra is subject to the Energy Efficiency Opportunities Act 2006 (Cwlth). Telstra registered on 31 March 2007 and has submitted annual public and bi-annual government reports to the Department of Resource Energy and Tourism, meeting all legislative requirements. Telstra completed its first 5 year cycle in 2011 and will transition into the second 5 year cycle with the Assessment and Reporting Schedule due by 31 December 2012.
Telstra is required to report on its greenhouse gas emissions, energy consumption and energy production under the National Greenhouse and Energy Reporting Act 2007 (Cwlth). Telstra registered by 31 August 2009 and has reported to the Department of Climate Change and Energy Efficiency annually. The next report is due on 31 October 2012.
For
per
sona
l use
onl
y

Telstra Corporation Limited and controlled entities
43
Directors’ Report
Telstra has well established procedures to monitor and manage compliance with existing environmental regulations and new regulations as they come into force. Telstra has not been fined or prosecuted for, or convicted of, any significant breaches of environmental regulation during the financial year.
The Australian Government's Clean Energy Legislation introduced a carbon pricing mechanism from 1 July 2012. The carbon pricing mechanism requires companies with operations that emit greenhouse gas emissions above a certain threshold to purchase carbon emissions permits, at an initial price of $23 for each tonne of carbon dioxide equivalent greenhouse gas they emit. Telstra is not directly liable to purchase emission permits, but the position will continue to be monitored. Telstra will, however, experience an indirect cost impact as a result of the impacts on electricity prices, and may experience other cost impacts associated with the Telstra supply chain.
Non-audit services
During fiscal 2012,Telstra's auditor Ernst & Young has been employed on assignments additional to its statutory audit duties. Details of the amounts paid or payable to Ernst & Young for audit and non-audit services provided during the year are detailed in note 8 to the financial statements.
The Directors are satisfied that the provision of non-audit services during fiscal 2012 is compatible with the general standard of independence for auditors imposed by the Corporations Act 2001 (the Act), and that the nature and scope of each type of non-audit service provided did not compromise the auditor independence requirements of the Act for the following reasons:
• all recurring audit engagements are approved by the Audit Committee each year through the Audit Committee's approval of the annual audit plan;
• additional audit and non-audit services up to $100,000 require approval from the Chief Financial Officer which is communicated to the Audit Committee at the next meeting;
• additional audit and non-audit services between $100,000 and $250,000 require approval from the Chairman of the Audit Committee and services greater than $250,000 require approval from the Audit Committee;
• where the nature or scope of an external engagement changes such that the prior approval obtained is insufficient, subsequent approval of the revised engagement must be obtained. The same approval levels noted above apply;
• all additional engagements approved as per the above points are reported to the Audit Committee at the next meeting;
• fees earned from non-audit work undertaken by Ernst & Young are capped at 1.0 times the total audit fee; and
• the provision of non-audit services by Ernst & Young is monitored by the Audit Committee via quarterly reports to the Audit Committee.
Ernst & Young is specifically prohibited from performing any of the following services:
• bookkeeping services and other services related to preparing our accounting records or financial statements;
• financial information system design and implementation services;
• operation or supervision of IT systems;• appraisal or valuation services, fairness opinions, or
contribution in kind reports;• actuarial services;• internal audit services;• management or human resources functions including the
provision of advice and benchmarking services in relation to executive remuneration;
• temporary staff assignments;• broker or dealer, investment advisor, or investment banking
services; • legal services or expert services unrelated to the audit;• tax planning and strategy services; and• receiver/liquidation services.
A copy of the auditors' independence declaration is set out on page 50 and forms part of this report.
Rounding of amounts
The Telstra Entity is a company of the kind referred to in the Australian Securities and Investments Commission Class Order 98/100, dated 10 July 1998 and issued pursuant to section 341(1) of the Corporations Act 2001. As a result, amounts in this report and the accompanying financial report have been rounded to the nearest million dollars ($m), except where otherwise indicated.
This report is made on 9 August 2012 in accordance with a resolution of the Directors.
Catherine B Livingstone AO
Chairman
9 August 2012
David I Thodey
Chief Executive Officer and Executive Director
9 August 2012For
per
sona
l use
onl
y

Telstra Corporation Limited and controlled entities
44
Directors’ Report
Directors' profiles
As at 9 August 2012, our Directors were as follows:
(1) Other than the CEO, directors may not hold office for more than three years or beyond the third annual general meeting (AGM) following their appointment (whichever is the later) without re-election. A Director appointed to fill a casual vacancy must stand for election at the next AGM.
A brief biography for each of the Directors as at 9 August 2012 is presented below:
Catherine B Livingstone - AO, BA (Hons), Hon DSc (Murdoch), Hon DBus (Macquarie), FCA, FTSE, FAICD
Ms Livingstone joined Telstra as a non-executive Director in November 2000 and was appointed as Chairman in May 2009. She is the Chairman of the Nomination Committee and a member of the Remuneration, Audit and Technology Committees. She was a member of the NBN Due Diligence Committee whilst it was operative.
Experience:
Ms Livingstone is a Chartered Accountant and has held several finance and general management roles predominantly in the medical devices sector. Ms Livingstone was the Chief Executive of Cochlear Limited (1994 - 2000).
Directorships of other listed companies - current:
Director, Macquarie Bank Limited (2003 - ), Macquarie Group Limited (2007 - ) and WorleyParsons Ltd (2007 - ).
Directorships of listed companies - past three years:
Nil
Other:
Current: Member, New South Wales Innovation Council (2007 - ), President of the Australian Museum Trust (2012 - ) and Director, The George Institute (2012 - ).
Former: Chairman, CSIRO (2001 - 2006); Chairman and Director, Australian Business Foundation (2000 - 2005); Director, Future Directions International Pty Ltd (2007 - 2011), Goodman Fielder Ltd (2000 - 2003), Rural Press Limited (2000 - 2003), Macquarie Graduate School of Management Pty Ltd (2007 - 2008) and Sydney Institute (1998 - 2005). Previously, also Member, Department of Accounting and Finance Advisory Board Macquarie University, Business/Industry/Higher Education Collaboration Committee (BIHECC), Federal Government's National Innovation System Review Panel and The Royal Institution of Australia Council.
David I Thodey - BA, FAICD
Mr Thodey became Chief Executive Officer and an executive director in May 2009.
Experience:
Mr Thodey joined Telstra in April 2001 as Group Managing Director of Telstra Mobiles. He was appointed to the position of Group Managing Director Telstra Enterprise and Government in December 2002 and was responsible for the company's corporate, government and large business customers in Australia, TelstraClear in New Zealand and Telstra's International sales division. Before joining Telstra, Mr Thodey was Chief Executive Officer of IBM Australia/New Zealand and previously held several senior executive positions in marketing and sales with IBM across Asia Pacific. He holds a Bachelor of Arts in Anthropology and English from Victoria University in New Zealand. Mr Thodey attended the Kellogg Post-Graduate School General Management Program at Northwestern University in Chicago.
Directorships of other listed companies - current:
Nil
Name Age Position Year of initial appointment
Year last re-elected (1)
Catherine B Livingstone . . . . . 56 Chairman, Non-executive Director 2000 2011David I Thodey . . . . . . . . . . 58 Chief Executive Officer, Executive Director 2009 -Timothy Y Chen . . . . . . . . . . 56 Non-executive Director 2012 -Geoffrey A Cousins . . . . . . . . 69 Non-executive Director 2006 2009Russell A Higgins . . . . . . . . . 62 Non-executive Director 2009 -John P Mullen. . . . . . . . . . . 57 Non-executive Director 2008 2011Nora L Scheinkestel . . . . . . . 52 Non-executive Director 2010 -Margaret L Seale . . . . . . . . . 51 Non-executive Director 2012 -John W Stocker . . . . . . . . . . 67 Non-executive Director 1996 2009Steven M Vamos . . . . . . . . . 54 Non-executive Director 2009 -John D Zeglis . . . . . . . . . . . 65 Non-executive Director 2006 2009
For
per
sona
l use
onl
y

Telstra Corporation Limited and controlled entities
45
Directors’ Report
Directorships of listed companies - past three years:
Nil
Other:
Current: Nil
Former: Chairman, TelstraClear New Zealand (2003 - 2009) and Chairman, Basketball Australia (2008 - 2010).
Timothy Y Chen - BSc (Applied Mathematics), MSc (Computer Science, Mathematics), MBA
Mr Chen joined the Telstra Board as a non-executive Director in April 2012. He is also a member of the Audit Committee.
Experience:
Mr Chen has over 20 years experience as a technology executive with major global firms in China and the United States. He is currently a Beijing based partner with private equity firm GL Capital Group.
Previously, he was Chief Executive Officer for the National Basketball Association China from 2007 to 2010. Mr Chen was Corporate Vice President of Microsoft and CEO of the Greater China region from 2003 to 2007. From 2001 to 2003, he was Corporate Vice President of Motorola Inc as well as Chairman and President of Motorola (China) Electronics. Prior to 2001, Mr Chen was CEO of 21 CN Cybernet, a listed company in Hong Kong and also spent 8 years in China, also with Motorola, including serving as general manager responsible for marketing and sales operations for the Greater China Cellular Infrastructure Division. Before that, Mr Chen spent 9 years at AT&T Bell Laboratories in the United States.
Directorships of Other Listed Companies - current:
Sinopac Financial Holdings Co. Ltd, Taiwan (2008 - ), E-Link Holdings Inc., Taiwan (2011 - ), Longmaster Information and Technology Co. Ltd, PRC (2011 - ).
Directorships of Listed Companies - past three years:
Nil
Other:
Current: Director, E-silicon Corporation, USA (2011- ).
Former: Chief Executive Officer, 21 CN Cybernet (2000 -2001); Corporate Vice President, Motorola, China President and Chairman of Motorola China Electronics Ltd (2001 - 2003); Corporate Vice President, Microsoft, CEO of Greater China Region (2003 - 2007) and Chief Executive Officer, NBA China (2007 - 2010); Director LSI Corporation, USA (2006 - 2008).
Geoffrey A Cousins
Mr Cousins joined Telstra as a non-executive Director in November 2006. He is a member of the Nomination and Remuneration Committees.
Experience:
Mr Cousins has more than 26 years experience as a company director. Mr Cousins was previously the Chairman of George Patterson Australia and is a former Director of Publishing and Broadcasting Limited, the Seven Network, Hoyts Cinemas group and NM Rothschild & Sons Limited. He was the first Chief Executive of Optus Vision and before that held a number of executive positions at George Patterson, including Chief Executive of George Patterson Australia.
Directorships of other listed companies - current:
Nil
Directorships of listed companies - past three years:
Nil
Other:
Current: Chairman, St. James Ethics Foundation (2010 - ).
Former: Chairman, Cure Cancer Australia (2004 - 2007); Director, Insurance Australia Group Ltd (2000 - 2007), The Starlight Foundation (1988 - 1994), Museum of Contemporary Art (1990 - 1994), Globe International Limited (2001 - 2003), Sydney Theatre Company Ltd (1990 - 1996), St George Foundation Ltd (1989 - 1995) and The Smith Family (1988 - 1994); President, The Shore Foundation Ltd (1992 - 1994).
Mr Cousins was previously a consultant to the Prime Minister.
Russell A Higgins - AO, BEc, FAICD
Mr Higgins joined the Telstra Board as a non-executive Director in September 2009. He is a member of the Audit Committee. He was a member of the NBN Due Diligence Committee whilst it was operative.
Experience:
Mr Higgins is an experienced company director who has worked at very senior levels of both government and private sectors. He is Chairman of the Global Carbon Capture and Storage Institute, a global initiative to accelerate the worldwide development of carbon capture and storage technologies. From 2003 to 2004, he was Chairman of the then Prime Minister's Energy Task Force. Prior to that he was Secretary of the Department of Industry, Science and Resources.
For
per
sona
l use
onl
y
Telstra Corporation Limited and controlled entities
46
Directors’ Report
Directorships of other listed companies - current:
Director, APA Group (2004 - ), Ricegrowers Limited (SunRice) (2005 - ) and Argo Investments Limited (2011 - ).
Directorships of listed companies - past three years:
Nil
Other:
Current: Chairman, Global Carbon Capture and Storage Institute (2009 - ); Chair, CSIRO Energy Transformed Flagship Advisory Committee (2005 - ); Director, St. James Ethics Foundation (2010 - ).
Former: Chairman, Snowy Hydro-Electric Scheme (1992 - 1997), CRC for Coal in Sustainable Development (2004 - 2008), APEC Energy Working Group (1993 - 1997); Director, Australian Biodiesel Group (2006 - 2007), Export Finance and Insurance Corporation (1997 - 2002), CSIRO (1997 - 2002), Austrade (1997 - 2002), Australian Tourist Commission (1997 - 2002) and Australian Sports Commission (1997 - 2002).
John P Mullen
Mr Mullen joined Telstra as a non-executive Director in July 2008. He is the Chairman of the Remuneration Committee and a member of the Nomination Committee.
Experience:
Mr Mullen has worked for over two decades in a multitude of senior positions with different multinationals. His corporate experience includes 10 years with the TNT Group, with two years as its Chief Operating Officer. From 1991 to 1994, he held the position of Chief Executive Officer of TNT Express Worldwide, based in the Netherlands. Mr Mullen joined Deutsche Post World Net (DPWN) as an Advisor in 1994, becoming Chief Executive Officer of DHL Express Asia Pacific in 2002 and Joint Chief Executive Officer, DHL Express in 2005. From 2006 to 2009, Mr Mullen was Global Chief Executive Officer, DHL Express. Mr Mullen was appointed in 2011 as the Managing Director and Chief Executive Officer of Asciano Ltd.
Directorships of other listed companies - current:
Director, Asciano Ltd (2011 - ).
Directorships of listed companies - past three years:
Director, Brambles Limited (2009 - 2011), MAp Airports Limited (2010 - 2011), Deutsche Post World Net, Board of Management, Germany (2005 - 2009) and Embarq Corporation USA (2006 - 2009).
Other:
Current: Member, Australian Graduate School of Management (2005 - ).
Former: Chairman, National Foreign Trade Council (Washington DC) (2008 - 2010); Director, International Swimming Hall of Fame (USA) (2005 - 2008).
Nora L Scheinkestel - LLB(Hons), PhD, FAICD
Dr Scheinkestel joined Telstra as a non-executive Director in August 2010. She is Chairman of the Audit Committee and was Chairman of the NBN Due Diligence Committee whilst it was operative.
Experience:
Dr Nora Scheinkestel is an experienced company director having served in a wide range of industry sectors and in the public, government and private spheres. Dr Scheinkestel is also an Associate Professor at the Melbourne Business School at Melbourne University and a member of the Takeovers Panel. Dr Scheinkestel's executive background is as a senior banking executive in international and project financing, responsible for the development and financing of major projects in Australasia and South East Asia. Her current consulting practice assists government, corporate and institutional clients in areas such as corporate governance, strategy and finance. In 2003, Dr Scheinkestel was awarded a centenary medal for services to Australian society in business leadership.
Directorships of other listed companies - current:
Director, AMP Limited (2003 - ), Orica Limited (2006 - ) and Pacific Brands Limited (2009 - ).
Directorships of listed companies - past three years:
Director, PaperlinX Ltd (2000 - 2009).
Other:
Current: Director, AMP Capital Holdings Limited (2005 - ).
Former: Chairman, South East Water Limited (2002 - 2005) and Energy21 and Stratus Networks Gas Group (1997 - 1999); Director, IOOF Funds Management (1998 - 2001), Medical Benefits Fund of Australia Ltd (1997 - 2001), Hydro Tasmania (2001 - 2004), City West Water Ltd (1995 - 2002), Docklands Authority (1998 - 2003), Newcrest Mining Limited (2000 - 2007), Mayne Pharma Limited (2005 - 2007), Mayne Group Limited (2005), North Limited (1996 - 2000), AMP Capital Investors Limited (2004 - 2011) and AMP Bank Limited (2006 - 2012).
Margaret L Seale - BA, GAICD
Ms Seale joined the Telstra Board as a non-executive Director in May 2012.
For
per
sona
l use
onl
y

Telstra Corporation Limited and controlled entities
47
Directors’ Report
Experience:
Ms Seale has over 20 years experience in senior executive roles in Australia and overseas. She is currently the Managing Director of Random House, Australia and NZ and President, Asia Development for Random House Inc, the global company.
Previously, she was Chief Executive Officer for The Macquarie Dictionary and Lansdowne Publishing from 1997-1999. Ms Seale was the Chief Executive Officer for the Juvenile Diabetes Research Foundation from 1994 to 1997.
Directorships of Other Listed Companies - current:
Nil
Directorships of Listed Companies - past three years:
Nil
Other:
Current: Director, Sydney Writers Festival (2011 - ).
Former: Director, then Vice President, Australian Publishers Association (2004 - 2012); Trustee, Powerhouse Museum (2004 - 2011) and Chair, Scholarship Committee, Chief Executive Women (2011- 2012).
John W Stocker - AO, MB BS, BMedSc, PhD, FRACP, FTSE
Dr Stocker joined Telstra as a non-executive Director in October 1996. He is a member of the Audit and Technology Committees, and served as Chairman of the Audit Committee from December 2001 until June 2012. He was a member of the NBN Due Diligence Committee whilst it was operative.
Experience:
Dr Stocker has had a distinguished career in pharmaceutical research and extensive experience in management of research and development, and its commercialisation including in his roles as Chief Executive of CSIRO (1990 - 1995) and subsequently, as Chief Scientist for the Commonwealth of Australia (1996 - 1999).
Directorships of other listed companies - current:
Nil
Directorships of listed companies - past three years:
Chairman, Sigma Pharmaceuticals Ltd (2005 - 2010) and Director, Nufarm Limited (1998 - 2011).
Other:
Current: Principal, Foursight Associates Pty Ltd (1996 - ).
Former: Chairman, Grape and Wine Research and Development Corporation (1997 - 2004), Sigma Company Ltd (1998 - 2005), CSIRO (2007 - 2010) and The Australian Wine Research Institute Ltd (2009 - 2010); Director, Cambridge Antibody Technology Group plc (1995 - 2006), Circadian Technologies Ltd (1996 - 2008).
Steven M Vamos - BEng (Hons)
Mr Vamos joined the Telstra Board as a non-executive Director in September 2009. He is also a member of the Remuneration and Nomination Committees.
Experience:
Mr Vamos has over 30 years experience in the information technology, internet and online industry. He led Microsoft Australia and New Zealand from 2003 to January 2007 before moving to the United States to become the company's online business head of worldwide Sales and International Operations. Previously, he was Chief Executive Officer of ninemsn. Mr Vamos also worked for Apple Computer in the 1990s after spending 14 years in senior management roles at IBM Australia. He is the founding President of the Society for Knowledge Economics (SKE), a not-for-profit think tank that encourages new and better practices in leadership and management.
Directorships of other listed companies - current:
Director, David Jones (2012 - ).
Directorships of listed companies - past three years:
Nil
Other:
Current: President, Society for Knowledge Economics (2005 - ); Director, eGeneration Investments Pty Limited (1999 - ), Medibank Private Limited (2011 - ), Australian Health Management Group Pty Limited (2011 - ) and BDB Soti Pty Ltd (2012 - ).
Former: Chief Executive Officer, ninemsn (1998 - 2002); Vice President, Australia and New Zealand, Microsoft (2003 - 2007).
John D Zeglis - BSc Finance, JD Law
Mr Zeglis joined Telstra as a non-executive Director in May 2006. He is Chairman of the Technology Committee.
Experience:
Mr Zeglis has a legal background, and became partner with the law firm Sidley & Austin in 1978. He was General Counsel of AT&T from 1986 - 1998. His qualifications include a BSc in Finance from the University of Illinois, and a JD in Law from Harvard.
For
per
sona
l use
onl
y

Telstra Corporation Limited and controlled entities
48
Directors’ Report
Mr Zeglis has had a long and distinguished career in the US telecommunications sector. He joined AT&T in 1984, and was elected as President of AT&T in 1998 and Chairman and Chief Executive Officer of the AT&T Wireless Group in 1999. He continued as CEO of AT&T Wireless until retiring in November 2004 following the company's sale to Cingular Wireless.
Directorships of other listed companies - current:
Director, Helmerich & Payne Corporation (1989 - ).
Directorships of listed companies - past three years:
Nil
Other:
Current: Director, The Duchossois Group (including AMX) (2011 - ) and State Farm Automobile Insurance (2004 - ).
Former: Director, Georgia Pacific Corporation (2001 - 2005); Sara Lee Corporation (1998 - 2000); and Illinois Power Company (1992 - 1996).
Former Directors
Brief biographies of the former directors are presented below:
John V Stanhope
Mr Stanhope joined Telstra in 1967. He was appointed as an executive Director on 8 May 2009. He was appointed to the role of Chief Financial Officer (CFO) and Group Managing Director, Finance and Administration in October 2003. Mr Stanhope ceased as executive Director, Chief Financial Officer and Group Managing Director, Finance on 30 December 2011.
John M Stewart
Mr Stewart joined Telstra as a non-executive Director in April 2008. He was a member of the Audit Committee. Mr Stewart ceased as director on 18 October 2011.
Company Secretary
Damien Coleman - BEc, LLB (Hons)
Mr Coleman was appointed Company Secretary of Telstra Corporation Limited effective 1 January 2012.
Mr Coleman joined Telstra in 1998 and has served in senior legal roles across the company including Sensis, Mergers & Acquisitions, Telstra Operations and, most recently, as General Counsel, Finance and Administration, Office of the Company Secretary and NBN. In that role he has been responsible for Telstra's continuous disclosure compliance, all legal aspects of the Annual Report preparation and Annual General Meeting, as well as annual financial results announcements. Mr Coleman also played a key role in the negotiation of the Definitive Agreements for Telstra's participation in the rollout of the National Broadband Network. Before joining Telstra, Mr Coleman was a senior lawyer at a leading Australian law firm. He holds a Bachelor of Laws (Hons) and a Bachelor of Economics from the Australian National University.
For
per
sona
l use
onl
y
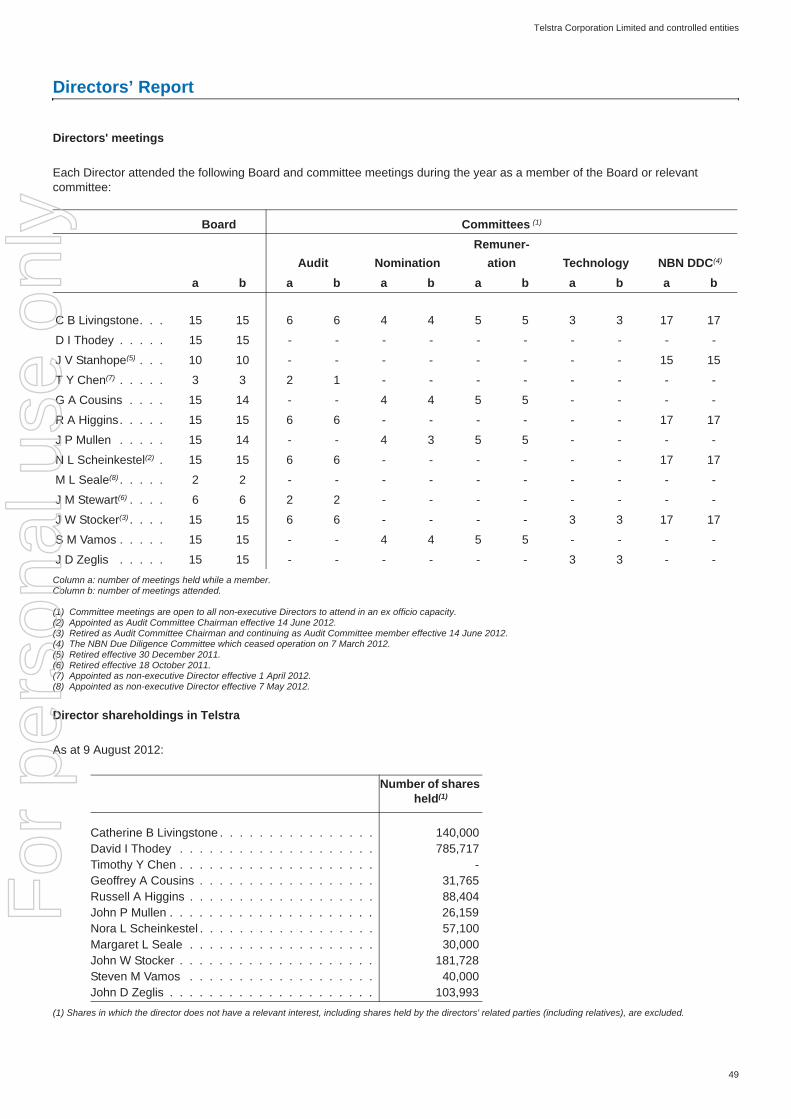
Telstra Corporation Limited and controlled entities
49
Directors’ Report
Directors' meetings
Each Director attended the following Board and committee meetings during the year as a member of the Board or relevant committee:
Column a: number of meetings held while a member.Column b: number of meetings attended.
(1) Committee meetings are open to all non-executive Directors to attend in an ex officio capacity.(2) Appointed as Audit Committee Chairman effective 14 June 2012. (3) Retired as Audit Committee Chairman and continuing as Audit Committee member effective 14 June 2012.(4) The NBN Due Diligence Committee which ceased operation on 7 March 2012.(5) Retired effective 30 December 2011.(6) Retired effective 18 October 2011.(7) Appointed as non-executive Director effective 1 April 2012.(8) Appointed as non-executive Director effective 7 May 2012.
Director shareholdings in Telstra
As at 9 August 2012:
(1) Shares in which the director does not have a relevant interest, including shares held by the directors' related parties (including relatives), are excluded.
Board Committees (1)
Audit NominationRemuner-
ation Technology NBN DDC(4) a b a b a b a b a b a b
C B Livingstone. . . 15 15 6 6 4 4 5 5 3 3 17 17
D I Thodey . . . . . 15 15 - - - - - - - - - -
J V Stanhope(5) . . . 10 10 - - - - - - - - 15 15
T Y Chen(7) . . . . . 3 3 2 1 - - - - - - - -
G A Cousins . . . . 15 14 - - 4 4 5 5 - - - -
R A Higgins. . . . . 15 15 6 6 - - - - - - 17 17
J P Mullen . . . . . 15 14 - - 4 3 5 5 - - - -
N L Scheinkestel(2) . 15 15 6 6 - - - - - - 17 17
M L Seale(8) . . . . . 2 2 - - - - - - - - - -
J M Stewart(6) . . . . 6 6 2 2 - - - - - - - -
J W Stocker(3) . . . . 15 15 6 6 - - - - 3 3 17 17
S M Vamos . . . . . 15 15 - - 4 4 5 5 - - - -
J D Zeglis . . . . . 15 15 - - - - - - 3 3 - -
Number of shares held(1)
Catherine B Livingstone . . . . . . . . . . . . . . . . 140,000David I Thodey . . . . . . . . . . . . . . . . . . . . 785,717Timothy Y Chen . . . . . . . . . . . . . . . . . . . . -Geoffrey A Cousins . . . . . . . . . . . . . . . . . . 31,765Russell A Higgins . . . . . . . . . . . . . . . . . . . 88,404John P Mullen . . . . . . . . . . . . . . . . . . . . . 26,159Nora L Scheinkestel . . . . . . . . . . . . . . . . . . 57,100Margaret L Seale . . . . . . . . . . . . . . . . . . . 30,000John W Stocker . . . . . . . . . . . . . . . . . . . . 181,728Steven M Vamos . . . . . . . . . . . . . . . . . . . 40,000John D Zeglis . . . . . . . . . . . . . . . . . . . . . 103,993
For
per
sona
l use
onl
y

50
Auditor's Independence Declaration to the Directors of Telstra Corporation Limited
In relation to our audit of the financial report of Telstra Corporation Limited for the financial year ended 30 June 2012, to the best of my knowledge and belief, there have been no contraventions of the auditor independence requirements of the Corporations Act 2001 or any applicable code of professional conduct.
Ernst & Young
SJ FergusonPartnerMelbourne, Australia9 August 2012
For
per
sona
l use
onl
y

51
Telstra Corporation Limited and controlled entities
Remuneration Report
Dear Shareholder,
Telstra is pleased to present its remuneration report for FY 2012, which we believe again demonstrates that executive remuneration in Telstra is closely aligned to the company’s performance and to the interests of its shareholders.
The Telstra Board has ensured that senior executive remuneration at Telstra reflects our financial and customer achievements, whilst at the same time enabling us to attract and keep global senior executives, thus creating sustainable value for the company and for its shareholders.
Telstra executed its strategy with consistency in FY 2012 and delivered strong results in line with its guidance to the market. These positive outcomes for shareholders are reflected – as they should be – in improved remuneration outcomes for the company’s executives.
As well as full-year results showing growth in both revenue and earnings, the company finalised the NBN agreements with NBN Co and the Commonwealth. Shareholders also saw the company’s share price increase from $2.89 to $3.69 during FY 2012, delivering a total shareholder return of 37% for the year. Furthermore, our focus on customer satisfaction and simplifying our business can be seen in improved customer feedback.
While there have been no fundamental changes in remuneration structure and only modest fixed remuneration increases, as a result of this significantly improved performance, the short term incentive payout is higher than the prior year and two of the long term incentive plans have partially vested.
Effective governance is important and the provision of clear and concise reporting is essential to keeping you informed on how we compensate and retain our senior executives. To this end, we have further refined our remuneration report this year to more clearly describe remuneration strategies, and have included tables to highlight the difference between total remuneration entitlements for the year as defined by the accounting standards and actual remuneration received, as these differences can be confusing.
On behalf of the Board, I invite you to review the full report, and thank you for your interest.
John MullenChairman, Remuneration Committee
For
per
sona
l use
onl
y
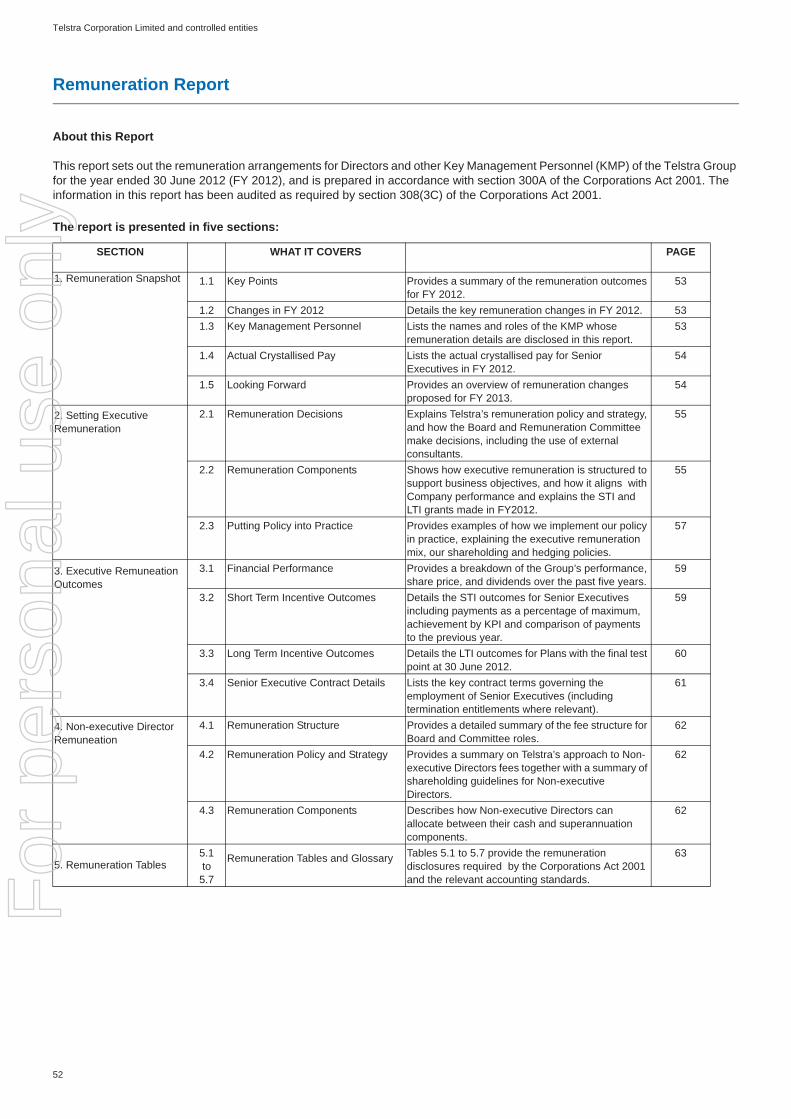
52
Telstra Corporation Limited and controlled entities
Remuneration Report
About this Report
This report sets out the remuneration arrangements for Directors and other Key Management Personnel (KMP) of the Telstra Group for the year ended 30 June 2012 (FY 2012), and is prepared in accordance with section 300A of the Corporations Act 2001. The information in this report has been audited as required by section 308(3C) of the Corporations Act 2001.
The report is presented in five sections:
SECTION WHAT IT COVERS PAGE
1. Remuneration Snapshot 1.1 Key Points Provides a summary of the remuneration outcomes for FY 2012.
53
1.2 Changes in FY 2012 Details the key remuneration changes in FY 2012. 531.3 Key Management Personnel Lists the names and roles of the KMP whose
remuneration details are disclosed in this report. 53
1.4 Actual Crystallised Pay Lists the actual crystallised pay for Senior Executives in FY 2012.
54
1.5 Looking Forward
Provides an overview of remuneration changes proposed for FY 2013.
54
2. Setting Executive Remuneration
2.1 Remuneration Decisions
Explains Telstra’s remuneration policy and strategy, and how the Board and Remuneration Committee make decisions, including the use of external consultants.
55
2.2 Remuneration Components Shows how executive remuneration is structured to support business objectives, and how it aligns with Company performance and explains the STI and LTI grants made in FY2012.
55
2.3 Putting Policy into Practice
Provides examples of how we implement our policy in practice, explaining the executive remuneration mix, our shareholding and hedging policies.
57
3. Executive Remuneation Outcomes
3.1 Financial Performance Provides a breakdown of the Group’s performance, share price, and dividends over the past five years.
59
3.2 Short Term Incentive Outcomes Details the STI outcomes for Senior Executives including payments as a percentage of maximum, achievement by KPI and comparison of payments to the previous year.
59
3.3 Long Term Incentive Outcomes Details the LTI outcomes for Plans with the final test point at 30 June 2012.
60
3.4 Senior Executive Contract Details Lists the key contract terms governing the employment of Senior Executives (including termination entitlements where relevant).
61
4. Non-executive Director Remuneation
4.1 Remuneration Structure Provides a detailed summary of the fee structure for Board and Committee roles.
62
4.2 Remuneration Policy and Strategy Provides a summary on Telstra’s approach to Non-executive Directors fees together with a summary of shareholding guidelines for Non-executive Directors.
62
4.3 Remuneration Components Describes how Non-executive Directors can allocate between their cash and superannuation components.
62
5. Remuneration Tables5.1 to
5.7
Remuneration Tables and Glossary Tables 5.1 to 5.7 provide the remuneration disclosures required by the Corporations Act 2001 and the relevant accounting standards.
63
For
per
sona
l use
onl
y

53
Telstra Corporation Limited and controlled entities
Remuneration Report
1. Remuneration Snapshot
1.1 Key Points
1.2 Changes during FY 2012
The overall structure and philosophy of Telstra’s approach to remuneration has remained consistent through FY 2012.
Some minor changes have however been made to improve the operation of Telstra’s remuneration policies:
• The Executive Share Ownership Policy requiring Senior Executives to hold Telstra shares to the value of 100 per cent of their fixed remuneration has been amended. Section 2.3.4 explains the Policy in further detail.
• Under the STI Deferral Plan, retirement no longer results in the forfeiture of deferred shares but the shares remain subject to the original deferral period. This change takes effect for the portion of the FY 2012 STI payment to be deferred as shares in September 2012. Section 2.2.2 provides further information on the STI deferral plan.
Proposed changes to Telstra’s remuneration policy for FY 2013 are set out in section 1.5.
1.3 Key Management Personnel (KMP)
KMP comprise the Directors of the Company and Senior Executives. The term “Senior Executives” refers to the CEO and those executives with authority and responsibility for planning, directing and controlling the activities of the Company and the Group, directly or indirectly.
Key changes to the Senior Executive structure this year included the introduction of the Chief Customer Officer role (Gordon Ballantyne) and a new position of GMD Telstra Media (Rick Ellis).
The Senior Executives disclosed in this Report are:
Total Shareholder Return of 37.4%
Over FY 2012, Telstra’s share price increased and the company paid a 28c dividend for a total shareholder return of 37.4%
Chief Executive Officer (CEO) Remuneration
The Total Fixed Remuneration (TFR) increase of 6% was effective 1 October 2011 bringing the TFR to $2,438,000. The increase brought the TFR closer to the median for ASX 20 CEO positions and reflected the performance of Mr Thodey.
Total Remuneration increased from $5.1m to $7.6m primarily due to higher STI and LTI results based on stronger performance on the plan measures.
Short Term Incentive Outcomes
STI payout for Senior Executives was an average of 65.6% of the maximum opportunity due to the achievement of financial, customer and individual performance measures, which reflects Telstra’s strong results in line with market guidance and increased customer satisfaction.
Long Term Incentive Outcomes
22.1% of the FY 2009 LTI plan vested in the form of options with a $4.36 exercise price. 66% of the FY 2010 LTI Plan vested in the form of Restricted Shares subject to a further one year restriction period. This reflects the total shareholder return increase during the year and the achievement of the 17.1% Free Cashflow Return On Investment target over the three year plan period.
Non-Executive Director Remuneration
Board and Committee fees did not change during FY 2012.
Name Most Recent KMP Position TitleDavid Thodey Chief Executive Officer
Gordon Ballantyne Chief Customer Officer
Rick Ellis GMD Telstra Media
Stuart Lee GMD Telstra Wholesale
Kate McKenzie GMD Telstra Innovation, Products and Marketing
Andrew Penn Chief Financial Officer and GMD Finance and Strategy
Brendon Riley Chief Operations Officer
Former Senior Executives:Bruce Akhurst Former GMD Sensis
John Stanhope Former Chief Financial Officer and GMD Finance
For
per
sona
l use
onl
y

54
Telstra Corporation Limited and controlled entities
Remuneration Report
1.4 Actual Pay and Benefits Crystallised in FY2012 for Senior Executives Employed at 30 June 2012
This table has not been prepared in accordance with Australian Accounting Standards. Refer to Section 5 for tables prepared in accordance with Australian Accounting Standards.
(1) The sum of Salary and Fees and Superannuation as detailed in table 5.1.(2) Includes the value of personal home security services provided by Telstra and the value of the personal use of products and services related to Telstra.(3) The second and final tranche of a sign on bonus for Brendon Riley.(4) Amount relates to the STI earned for FY 2012, which will be paid in cash in September 2012.(5) Amount relates to the value of STI earned in prior fiscal years which has been deferred as shares and which has vested in FY 2012.(6) Options which vested in FY 2012 relate to the FY 2008 LTI plan (that plan had a final test date of 30 June 2011, and those options became exerciseable inAugust 2012) and
are valued at zero as the exercise price of $4.34 is greater than Telstra's share price of $3.69 on 30 June 2012. These options will lapse if not exercised by 30 June 2014.
Reporting remuneration values is complicated because accounting values required by the accounting standards and statutory requirements may not always reflect what a Senior Executive has actually received or which has crystallised in the year from prior periods, particularly due to the valuation of share based payments.
As a general principle, the accounting standards require the value of share based payments to be calculated at the time of grant, that is, before Restricted Shares or options vest (and even if they do not ultimately vest because the performance hurdles are not met).
We have sought to clarify this by providing a table that reflects the actual remuneration that our Senior Executives have received or became entitled to in FY 2012 with full beneficial ownership and with no further restriction during that year. This includes fixed remuneration, STI payable as cash for the FY 2012 STI plan, as well as any deferred STI or LTI that has vested in the year ended 30 June 2012 with no further restrictions.
The crystallised value of share based payments, that are currently subject to performance conditions or a restriction period, will be displayed in this table in future years once those performance conditions have been satisfied or the restriction period has expired.
1.5 Looking Forward
For FY 2013, the Board has approved an increase of 8.7% in Mr Thodey's fixed remuneration taking it to the ASX 20 CEO market median. The new fixed remuneration of $2,650,000 will be effective 1 October 2012.
The STI and LTI potential opportunity for the CEO as a percentage of fixed remuneration remains unchanged.
In response to feedback from shareholders and common market practice for CEO LTI equity allocations, shareholder approval will be sought for Mr Thodey's FY 2013 LTI allocation at the AGM. Details will be set out in the 2012 AGM Notice of Meeting.
We are also committed to ensuring that there is no windfall gain or loss to Senior Executive remuneration due to the impact of the NBN Transaction. Our approach is detailed in section 2.3.6.
An increase in the Non-executive Director fee pool from $3m to $3.5m will be recommended for approval by shareholders at the AGM. Further details may be found in section 4.1 of this report.
Name Fixed Remuneration
(1)
Non-monetary Benefits
(2)
($)
Sign-on Bonus
(3)
($)
Short Term Incentive
Payable as Cash(4)
($)
$ Value of STI Deferred
Shares that Vested in FY
2012 (5)
($)
$ Value of LTI Equity that
Vested in FY 2012 (6)
($)
FY 2012 Total
($)David Thodey 2,403,311 6,582 - 2,415,449 - - 4,825,342Gordon Ballantyne 1,212,295 12,918 - 1,294,688 - - 2,519,901Rick Ellis 399,249 4,641 - 395,556 - - 799,446Stuart Lee 941,677 19,070 - 623,492 - - 1,584,239Kate McKenzie 935,546 12,199 - 955,463 - - 1,903,208Andrew Penn 466,666 3,823 - 591,202 - - 1,061,691Brendon Riley 1,212,295 18,984 1,000,000 1,257,188 - - 3,488,467
For
per
sona
l use
onl
y

55
Telstra Corporation Limited and controlled entities
Remuneration Report
2. Setting Senior Executive Remuneration
2.1 Remuneration Decisions
The Remuneration Committee consists only of independent non-executive Directors and assists the Board in its responsibilities by monitoring and advising on Board, CEO and Senior Executive remuneration, giving due consideration to law and corporate governance principles.
The Remuneration Committee also reviews and makes recommendations to the Board on the overall remuneration strategy, policies and practices of Telstra, and monitors the effectiveness of Telstra's overall remuneration framework in achieving Telstra's remuneration strategy.
Our remuneration policy and strategy is to:
• provide market competitive remuneration to attract, motivate and retain highly skilled people;
• reinforce Telstra's values and cultural priorities;
• implement best practice programs to help drive the achievement of our strategic and financial objectives; and
• link a significant component of at-risk remuneration to annual performance results and the creation of long term shareholder value.
Telstra has adopted a protocol that requires external consultants to engage directly with the Remuneration Committee Chairman as the first point of contact whenever market data for Senior Executive positions is scoped or supplied to Telstra. To assess market competitiveness in FY 2012, the Committee engaged Guerdon Associates for the provision of ASX 20 market data but did not require a remuneration recommendation and, as such, no disclosures are required under the Corporations Act 2001.
The Committee reviews CEO and Senior Executive remuneration packages to ensure there is a balance between fixed and incentive pay, and that they reflect short and long-term performance objectives appropriate to Telstra's circumstances and goals.
Each year, the Board reviews the CEO's remuneration based on market practice, performance against agreed measures and other relevant factors.
The CEO undertakes a similar exercise in relation to Senior Executives. The results of the CEO's annual performance and remuneration review of senior management are approved by the Board.
The Committee oversees the process of setting robust performance measures and targets that encourage strong Senior Executive performance and ethical behaviour. STI and LTI performance measures are set at the beginning of each year. At the end of each fiscal year, the Board reviews the Company's audited financial results and the results of the other non-financial measures. The Board then assesses performance against each measure to determine the percentage of the STI that is payable, and the portion of the LTI plan and, when relevant, the CFO's performance shares that may vest. The Board considers that it is best positioned to assess whether the applicable measures have been met.
Each performance measure in the STI and LTI plans has been selected in the context of achieving outcomes of the business strategy and increasing shareholder value.
2.2 Remuneration Components
Our remuneration structure (detailed below), is designed to support our remuneration strategy and is consistent between the CEO and other Senior Executives in the KMP group. Some tailoring may occur to take into account unique circumstances of an individual role. Where this occurs, it is disclosed in this Report.
AT RISK
Attract, motivate and retain highly skilled people
Align to long term shareholder value creation
Reinforce values and cultural priorities
Reward achievement of financial and strategic objectives
FIXED
Fixed Remuneration
Base salary including superannuation.
Set based on market and internal relativities, performance, qualifications and experience.
Short Term IncentiveCASH DEFERRED
75% of STI outcome paid in September after the financial year end for the STI plan.
STI outcome based on Telstra’s financial, customer satisfaction and individual performance measures.
25% of the STI outcome is deferred into Telstra shares.
Half of the shares are deferred for 1 year & the other half for 2 years.
The shares are forfeited unless departure is for a permitted reason. The shares are subject to clawback at the discretion of the Board.
Long Term IncentiveEQUITY
Restricted shares subject to performance conditions and restriction period over 4 years.
Performance is measured over 3 years with an additional 1 year restriction period before vesting and full ownership.
50% subject to Relative Total ShareholderReturn50% subject to Free Cashflow Return on Investment.
Encourages sustainable performance in the medium to longer term and provides a retention elementBase level of reward competitive with the marketSection 2.2 provides a summary of the at-risk STI and LTI plan structure including clawback provisions and Section 2.3 summarises the percentage mix of fixed and at-risk components.
For
per
sona
l use
onl
y

56
Telstra Corporation Limited and controlled entities
Remuneration Report
2.2.1 Short Term Incentive (STI)
For all Senior Executives, the FY 2012 performance measures of the STI Plan were Free Cashflow, EBITDA, Total Income, Customer Satisfaction and Individual performance measures.
These performance measures were selected for the STI Plan as they are seen as a critical link between achieving the outcomes of the business strategy and increasing shareholder value. The performance measures of the STI plan operate independently of each other:
• Financial measures for FY 2012 were set in accordance with Telstra's financial plan and strategy.
• The inclusion of a Customer Satisfaction measure supports Telstra's strategy of improving customer service and the goal of delivering outstanding customer satisfaction. It helps drive a company wide focus on Telstra's customer strategy of improving customer satisfaction.
• Individual performance measures are set at the beginning of the fiscal year and are based on individual contribution to the achievement of Telstra strategy.
Depending on the role they perform, each Senior Executive has a maximum STI opportunity ranging from 150% to 200% of their fixed remuneration where stretch targets are met. However, if threshold performance for a measure is not met, the payment relative to that component is nil.
2.2.2 STI Deferral
Twenty five per cent of Senior Executives actual STI payment is deferred into Telstra shares.
During the deferral period, Senior Executives earn dividends on their deferred shares, because they have satisfied the performance hurdles of the STI plan, however they cannot sell or trade the deferred shares during the deferral period.
If a Senior Executive leaves Telstra for any reason, other than a Permitted Reason, prior to the end of the deferral period, the deferred shares are forfeited. A Permitted Reason is defined as death, total and permanent disablement, redundancy or retirement (if notice of retirement is given more than six months after the effective date of allocation).
Deferred shares may be forfeited if a clawback event occurs. A clawback event includes circumstances where a Senior Executive has engaged in fraud or gross misconduct, or where the financial results that led to the STI being earned or awarded are subsequently shown to be materially misstated. No clawback event occurred in FY 2012.
2.2.3 FY 2012 LTI Plan
Participation
All Senior Executives participated in the FY 2012 LTI plan with the exception of the Chief Customer Officer and the GMD Telstra Wholesale.
As previously disclosed in the FY 2011 Remuneration Report, the Chief Customer Officer is on a fixed term contract however his cash LTI plan is aligned to the FY 2011 LTI plan. Refer to Table 5.1 for further information.
The Structural Separation Undertaking (SSU) given by Telstra as part of the NBN Transaction requires the GMD Telstra Wholesale to participate only in plans that relate to Wholesale and non-retail objectives and performance. Alternative equity arrangements that are compliant with the SSU will be granted in the FY 2013 year for the GMD Wholesale and be disclosed in the 2013 Remuneration Report.
For all other Senior Executives, Restricted Shares form the basis of the reward. Senior Executives are not required to pay for the Restricted Shares. However, for any Restricted Shares to vest, threshold performance against the relevant measure must be satisfied. Section 5 provides further details of the Restricted Shares granted to Senior Executives in FY 2012.
Plan Structure
Plan Component DetailPerformance Measure Weighting
50% to RTSR50% to FCF ROI(These operate independently of each other)
Performance Period 1 July 2011 to 30 June 2014
Restriction Period 4 years after 19th August 2011 (19th August 2015)
Minimum Threshold for RTSR Vesting
50th percentile of peer group
RTSR Vesting Schedule 25% vests at 50th percentile, straight line vesting to 75th percentile where 100% vests
Minimum Threshold for FCF ROI Vesting
17.1%
FCF ROI Vesting Schedule 50% vests at target of 17.1%, straight line vesting to stretch of 18.7% where 100% vests
Retesting No
For
per
sona
l use
onl
y

57
Telstra Corporation Limited and controlled entities
Remuneration Report
Relative Total Shareholder Return (RTSR)
RTSR measures the performance of an ordinary Telstra share (including the value of any cash dividends and other shareholder benefits paid during the period) relative to the other companies in the comparator group over the same period.
The Board believes that RTSR is an appropriate performance hurdle because it links executive reward to Telstra’s share price performance relative to its global peers.
The comparator group for the FY 2012 LTI Plan includes the following large market capitalisation telecommunication firms: AT&T Inc; Belgacom Group; Bell Canada Enterprises Inc; BT Group plc; Deutsche Telekom AG; France Telecom SA; Koninklijke KPN N.V.; KT Corporation; Nippon Telegraph & Telephone Corp; NTT DoCoMo Inc; Portugal Telecom SGPS SA; Singapore Telecommunications Ltd; SK Telecom Co Ltd;
Sprint Nextel Corporation; Swisscom AG; Telekom Austria AG; Telecom Italia Sp.A.; Telecom Corporation of New Zealand Ltd; Telefonica S.A.; Telenor ASA; TeliaSonera AB; Verizon Communications Inc and Vodafone Group plc.
The Board has discretion to add or change members of the comparator group under the Plan terms.
No amendments were made to the comparator group in FY 2012. Telecom NZ has been adjusted for the demerger of Chorus in December 2011 and remains in the comparator group.
Free Cashflow Return On Investment (FCF ROI)
FCF ROI as determined by the Board is calculated by dividing the average annual free cashflow over the three year performance period by Telstra’s average investment over the same period.
The Board chose the FCF ROI measure as an absolute LTI target on the basis that cash generation by the business is central to the creation of shareholder value.
Vesting of Restricted Shares
At the end of FY 2014, the Board will review the Company’s audited financial results for FCF ROI and RTSR to determine the percentage of Restricted Shares that vest.
Until the Restricted Shares vest, a Senior Executive has no legal or beneficial interest, no entitlement to receive dividends and no voting rights in relation to any Restricted Shares granted under the Plan.
Any Restricted Shares that vest are subject to a further one year restriction period which prevents a Senior Executive from trading or disposing of their vested Restricted Shares.
In the event of cessation of employment for reasons of death, total and permanent disablement, medical related retirement or separation by mutual agreement, a pro rata number of unvested restricted shares will lapse based on the proportion of time remaining in the performance and restriction period. The portion relating to the Senior Executive’s completed service may still vest subject to achieving the performance measures of the Plan at the end of the applicable performance period.
In certain limited circumstances, such as a takeover event where 50 per cent or more of all issued fully paid shares are acquired, the Board may exercise discretion to vest Restricted Shares that have not lapsed.
2.3 Putting Policy into Practice
2.3.1 Remuneration Mix of Senior Executives
The graphs below show the FY 2012 remuneration mix for Senior Executives as at 30 June 2012. The variable components of STI and LTI are expressed at target. At target is fifty per cent of the maximum opportunity.
The STI and LTI plans will only vest (and provide a reward to a Senior Executive) if the performance measures of the relevant Plans are met.
Chief Executive Officer:
Other Senior Executives: (Chief Financial Officer and GMD Finance and Strategy, GMD Telstra Innovation, Products and Marketing, GMD Telstra Media, Chief Customer Officer, GMD Chief Operations Office
33.3%
33.3%
33.3%Fixed Remuneration
Short Term Incentive
Long Term Incentive
35.7%
35.7%
28.6% Fixed Remuneration
Short Term Incentive
Long Term Incentive
For
per
sona
l use
onl
y

58
Telstra Corporation Limited and controlled entities
Remuneration Report
GMD Telstra Wholesale:
2.3.2 Variation Guidelines
The Board may, in its absolute discretion, vary or amend the terms of the LTI plan or the targets of the STI plan where an unexpected event occurs that means the targets of the relevant plan are no longer appropriate. The application of such discretion is limited to:
• Material change of the strategic business plan;
• Material regulatory change; and
• Significant out of plan business development such as acquisitions and divestitures.
Adjustments made in relation to the FY 2012 STI are outlined in section 2.3.6.
2.3.3 Other Remuneration Arrangements
As part of his Service Agreement negotiated upon appointment, Mr Andrew Penn, Chief Financial Officer and GMD Finance and Strategy, was allocated 96,500 Performance Shares where 50 per cent vest after two years and the remaining 50 per cent vest after three years from the date of commencement. Mr Penn is not required to pay for the Performance Shares, and each Performance Share entitles Mr Penn to one Telstra Share on vesting. Vesting is subject to satisfactory performance as determined by the Board at the end of the relevant performance period. This performance measure has been selected in the context of achieving outcomes of the business strategy and increasing shareholder value. Mr Penn is not entitled to any dividends on unvested Performance Shares. The Performance Shares are forfeited in the event of resignation before vesting. In certain circumstances such as redundancy, a pro rata number of Performance Shares would vest. Refer to Table 5.3 for further information.
2.3.4 Executive Share Ownership Policy
Telstra’s Executive Share Ownership Policy requires Senior Executives to hold Telstra shares to the value of 100 per cent of their fixed remuneration by 30 June 2015 or within five years of first appointment to Senior Executive level.
In FY 2012 the policy was amended so that Senior Executives are not required to purchase additional shares to meet the ownership targets. The ownership target may now be met by
deferred shares and vested LTI equity, however Board permission must now be sought before the executive can sell vested shares if the ownership target has not been achieved. This change has been implemented as a result of the re-introduction in FY 2011 of the mandatory deferral of 25% of STI into Telstra shares which contributes to the original Policy objective of aligning a significant portion of executive remuneration to the creation of longer term shareholder value.
2.3.5 Restrictions and Governance
KMPs are prohibited from using Telstra shares as collateral in any financial transaction, (including margin loan arrangements), or any stock lending arrangement.
They are also prohibited from entering into arrangements which effectively operate to limit the economic risk of their security holdings allocated under Telstra’s equity plans during the period the securities are held on their behalf by the Trustee or prior to the date of exercise or lifting of the Restriction Period of the relevant securities. This ensures that KMPs are not permitted to hedge against participation in Telstra’s equity plans.
KMPs are also required to confirm on an annual basis that they comply with this policy restriction which enables Telstra to monitor and enforce the policy.
2.3.6 NBN and Remuneration
The NBN Transaction is being incorporated into Telstra’s established corporate planning processes which will continue to require Senior Executives to be accountable for achieving planned outcomes, including NBN cashflows. The approximate $11 billion value of the NBN Transaction is a post tax net present value1 of cashflows to be received over the next 30 years subject to a range of dependencies and assumptions.
Performance measures for future STI and LTI plans will be developed using the most up to date forecasts for the financial impacts of the NBN Transaction.
Subject to the actual impact of the NBN physical roll-out, the Board may adjust financial outcomes for testing against prior plans that have not incorporated the NBN Transaction Furthermore, adjustment may be necessary if, due to external factors, the NBN roll-out does not proceed according to NBN Co’s published business plan at the time the measures are developed.
If historical STI and LTI performance measures are affected by the NBN Transaction, the Board may use its discretion to amend incentive plans based on Telstra’s Variation Guidelines to ensure there are no unintended windfall gains or losses for Senior Executives.
The Board adjusted the STI for FY 2012 and the FCF ROI results for the FY 2010 LTI Plan to ensure that there was no windfall gains or losses for Senior Executives as a result of the NBN Transaction. See section 3.2.2 and 3.3.2 respectively.
1. As at 30 June 2010. Refer to Explanatory Memorandum dated 1 September 2011.
44.4%
33.3%
22.2% Fixed Remuneration
Short Term Incentive
Long Term Incentive
For
per
sona
l use
onl
y

59
Telstra Corporation Limited and controlled entities
Remuneration Report
3. Remuneration Outcomes
The table in section 3.1 provides a summary of the key financial results for Telstra over the past five financial years. The tables in sections 3.2 and 3.3 provide a summary of how those results have been reflected in the remuneration outcomes for Senior Executives.
3.1 Financial Performance
Details of Telstra Group performance, share price, and dividends over the past five years are summarised in the table below:
(1) Share prices are as at 30 June for the respective year.(2) The closing share price for FY 2007 was $4.59.
3.2 Short Term Incentive outcomes
3.2.1 Average STI Payment as a Percentage of Maximum STI opportunity
The average STI payment for Senior Executives as a percentage of maximum STI opportunity is shown in the following table:
3.2.2 STI FY 2012 Outcomes
At the end of each fiscal year, the Board reviews the Company’s audited financial results and the results of other performance measures. The Board then assesses performance against each measure to determine the percentage of STI that is payable.
Customer Satisfaction is based on asking Telstra’s customers to rate their level of satisfaction with Telstra out of a score of ten. The overall customer satisfaction result is the average of the surveys from Telstra’s Consumer, Business, Enterprise and Government customers. The surveys are undertaken by third party research companies. The measurement period for the FY 2012 results is based on the three month average across 1 April 2012 to 30 June 2012. The final result is audited by Telstra’s internal Audit team.
Wholesale Customer Satisfaction is based on a survey of Wholesale customers only, undertaken by a 3rd party research company during February to April each year. This result is applied to the customer component of all Wholesale employees including the GMD Wholesale.
The Board believes the methods of calculating the financial and customer satisfaction outcomes are appropriate and provided a rigorous assessment of Telstra’s performance.
The Remuneration Committee exercised its discretion to amend STI targets in accordance with the Variation Guidelines (as outlined in 2.3.2) during the final assessment of the results on 1 August 2012. The amendments were required to ensure that there was no windfall gain due to the NBN, to provide relief for the impacts of regulatory changes imposed by the ACCC, to reflect material changes in Telstra’s strategic portfolio management plan and the settlement of an outstanding historical litigation.
The adjustment for the NBN affected the financial results negatively but the other adjustments had an overall positive effect on the financial results. There was no change to the customer satisfaction measure.
Overall the STI outcome increased from 58.9% to 66% of the maximum opportunity as a result of the adjustment. Section 3.2.3 provides a summary of STI payments as a percentage of maximum for each individual Senior Executive.
Definitions for the STI financial measures of Total Income, EBITDA and Free Cashflow are provided in the Glossary at the end of the Remuneration Report.
Performance Measure
FY 2012$m
FY 2011$m
FY 2010$m
FY 2009$m
FY 2008 $m
EarningsTotal Income 25,503 25,304 25,029 25,614 25,002EBITDA 10,234 10,151 10,847 10,948 10,416Net profit 3,405 3,231 3,883 4,073 3,692Shareholder valueShare price ($) (1)(2) 3.69 2.89 3.25 3.39 4.24Total dividends paid/declared per share (cents)
28.0 28.0 28.0 28.0 28.0
Performance Measure
FY 2012
FY 2011
FY 2010
FY 2009
FY 2008
STI Received 65.6% 48.4% 22.7% 50.9% 81.9%
Measure Outcome (% of maximum)
Total Income 47.0%EBITDA 81.5%Free Cashflow 50.5%Telstra Customer Satisfaction 75.0%Telstra Wholesale Customer Satisfaction 50.0%
For
per
sona
l use
onl
y

60
Telstra Corporation Limited and controlled entities
Remuneration Report
3.2.3 STI Payment results for FY 2012
STI payments for FY 2012, compared to FY 2011, as a percentage of the maximum STI opportunity were as follows:
(1) The FY 2011 average total of 48.4% reflects the total disclosed in the 2011 Remuneration Report. Not all Senior Executives in FY 2011 qualified as Senior Executives in FY 2012.
The graph below demonstrates the link between actual STI payments and Total Revenue growth. For FY 2012, STI payments as a percentage of the maximum STI opportunity continues to broadly align with Telstra’s total revenue percentage growth over the previous four fiscal years.
Telstra believes that the strong customer satisfaction outcomes for FY 2012 will result in increased revenue growth over time and further strengthen the alignment of revenue growth and STI outcomes.
3.3 Long Term Incentive outcomes
Both the FY 2009 and FY 2010 LTI plans reached their final testing points on 30 June 2012. Options (with an exercise price of $4.36) that vest under the FY 2009 plan will expire 30 June 2014 if not exercised prior to that date. Vested shares under the FY 2010 LTI plan are subject to a further one year restriction period.
The following tables show the results of each plan against each measure and the percentage of options and restricted shares that have vested as a result. The results of Telstra’s TSR relative to the other companies in the peer group was calculated by an external provider and audited by Telstra’s internal Risk Management and Assurance team. The calculation of the FCF ROI result, as well as the adjustments referred to in section
2.3.6, were reviewed by Telstra’s Auditors Ernst & Young. The Board has determined that the vesting outcomes are in accordance with the results and the Plan rules.
3.3.1 FY 2009 LTI Plan Final Testing as at 30 June 2012
Sixty per cent of the FY 2009 LTI plan was tested in equal tranches as at the end of FY 2010 and FY 2011. The remaining forty per cent of the Plan was tested as at 30 June 2012.
As disclosed in Telstra’s 2009 Remuneration Report, the FY 2009 LTI plan is the last of Telstra’s LTI plans with a re-test provision. Under the re-test provision, 75% of the options that did not meet the RTSR performance hurdles at 30 June 2009 and 30 June 2010 may vest if Telstra exceeds the 50th percentile of the RTSR comparator group in the final plan test at 30 June 2012 and where the final test has exceeded the rank achieved in the relevant earlier performance periods. There is no re-test provision in relation to the ROI component of the Plan.
The vesting table for the entire FY 2009 plan including the re-test provisions is detailed in the following table. For the performance periods ending 30 June 2010 and 30 June 2011, the vested RTSR components of 5.85% reflects the portion that vested as a result of the RTSR result in FY 2012.
The RTSR vesting result was based on Telstra ranking at the 59th percentile of the global peer group.
FY 2009 LTI plan outcomes
The 22.1% of the Plan that has vested is in the form of options with an exercise price of $4.36 that will lapse by 30 June 2014 if not exercised before that date. Senior Executives will only benefit from these options if Telstra’s share price is greater than $4.36 before 30 June 2014.
3.3.2 FY 2010 LTI Plan Final Testing as at 30 June 2012
One hundred per cent of the FY 2010 LTI plan was tested as at 30 June 2012.
FY 2010 LTI plan outcomes
Name FY 2012 FY 2011 (1)David Thodey 66.1% 49.0%Gordon Ballantyne 69.1% 49.0%Rick Ellis 66.1% n/aStuart Lee 58.1% n/aKate McKenzie 67.1% 46.5%Andrew Penn 66.1% n/aBrendon Riley 67.1% 46.5%Average Total: 65.6% 48.4%
0%
10%
20%
30%
40%
50%
60%
70%
FY 2009 FY 2010 FY 2011 FY 2012-3%
-2%
-1%
0%
1%
2%
3%
% S
TI o
f max
imum
Tota
l rev
enue
gro
wth
Comparison of Total Revenue Growth to % of STI maximum paid
Total revenue growth % of STI Maximum Paid
Test Date Measure% of Plan
tested% of plan
vested
30-June-2010 RTSR 15.00% 5.85%ROI 15.00% 0.00%
30-June-2011 RTSR 15.00% 5.85%ROI 15.00% 0.00%
30-June-2012 RTSR 20.00% 10.40%ROI 20.00% 0.00%
Total 100.00% 22.10%
Test Date Measure% of Plan
tested% of plan
vested
30-June-2012 RTSR 50.0% 41.0%FCF ROI 50.0% 25.0%
Total 100.0% 66.0%
For
per
sona
l use
onl
y

61
Telstra Corporation Limited and controlled entities
Remuneration Report
For the RTSR measure, Telstra ranked at the 69th percentile of the global peer group, which resulted in 41% of the plan vesting due to the RTSR performance measure.
The FCF ROI was calculated and adjusted for the costs and revenues in relation to the NBN Transaction, to ensure there are no unintended windfall gains or losses for Senior Executives. This adjustment impacted the FCF ROI calculation positively and the target of 17.1% was achieved resulting in 25% of the plan vesting.
Therefore in total 66% of the FY 2010 plan vested.
Restricted Shares earned under this Plan are subject to a further restriction period that ends on 21 August 2013. Refer to section 5.3 for further details of Telstra’s Long Term Incentive Plans.
3.4 Senior Executive Contract Details
The key terms and conditions of service contracts for current Senior Executives are summarised in the table below.
Upon notice being given, Telstra can require a Senior Executive to work through the notice period or may terminate employment immediately by providing payment in lieu of notice. Any termination payment is calculated on fixed remuneration as at date of termination.
There will be no payment if termination is a result of serious misconduct; or redundancy in those cases where Telstra’s redundancy policy overrides the termination provisions of the service contract.
(1) In relation to David Thodey’s contract, if the Board forms the view that the CEO is not performing to the standard required of a CEO, Telstra may terminate by providing four months’ written notice.
(2) If Telstra terminates Gordon Ballantyne’s employment, his contract allows for a termination payment that is the lesser of 12 months fixed remuneration or the period from the termination date to the original completion date of his contract.
John Stanhope retired as the Chief Financial Officer and GMD Finance on 30 December 2011. To ensure a seamless transition on NBN related matters, he entered into a consultancy agreement with Telstra for a term of 12 months for a fee of $50,000 per month.
NameFixed
Remuneration at end of FY
2012
Notice Period Termination
Payment
David Thodey $2,438,000 6 months 12 months (1)Gordon Ballantyne $1,250,000 6 months footnote (2)Rick Ellis $875,000 6 months 6 monthsStuart Lee $954,720 6 months 12 monthsKate McKenzie $950,000 6 months 6 monthsAndrew Penn $1,400,000 6 months 6 monthsBrendon Riley $1,250,000 6 months 12 months
For
per
sona
l use
onl
y
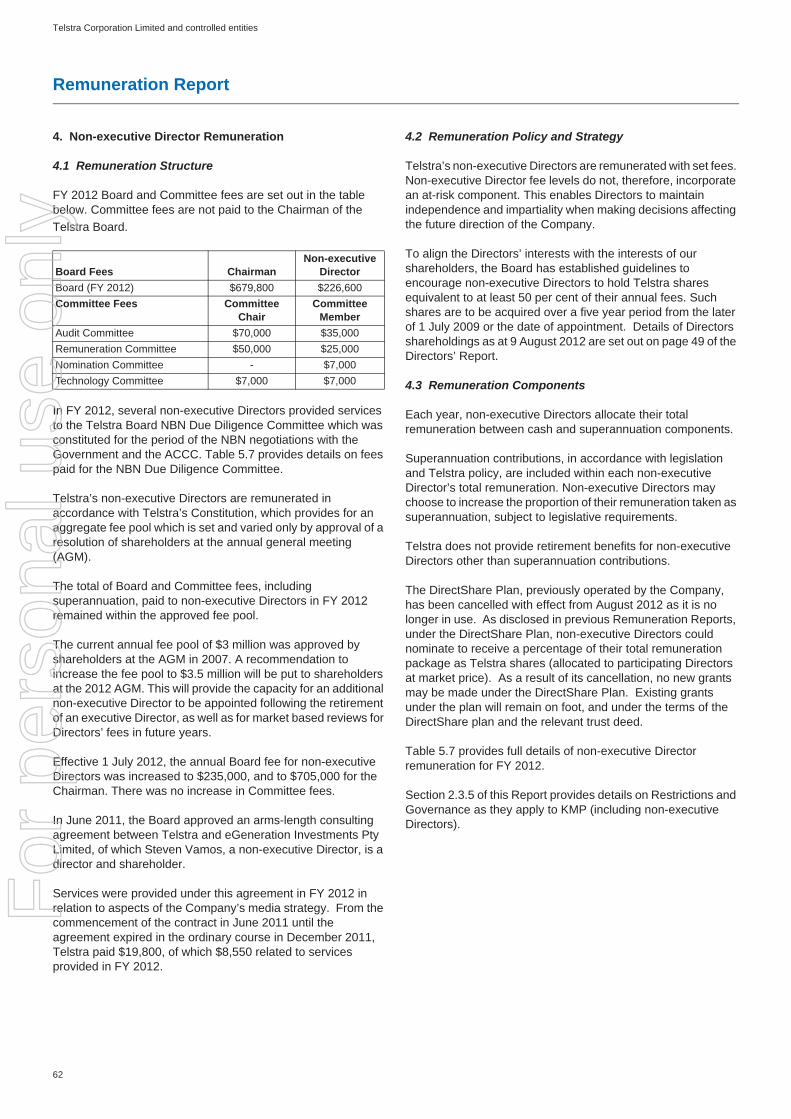
62
Telstra Corporation Limited and controlled entities
Remuneration Report
4. Non-executive Director Remuneration
4.1 Remuneration Structure
FY 2012 Board and Committee fees are set out in the table below. Committee fees are not paid to the Chairman of the Telstra Board.
In FY 2012, several non-executive Directors provided services to the Telstra Board NBN Due Diligence Committee which was constituted for the period of the NBN negotiations with the Government and the ACCC. Table 5.7 provides details on fees paid for the NBN Due Diligence Committee.
Telstra’s non-executive Directors are remunerated in accordance with Telstra’s Constitution, which provides for an aggregate fee pool which is set and varied only by approval of a resolution of shareholders at the annual general meeting (AGM).
The total of Board and Committee fees, including superannuation, paid to non-executive Directors in FY 2012 remained within the approved fee pool.
The current annual fee pool of $3 million was approved by shareholders at the AGM in 2007. A recommendation to increase the fee pool to $3.5 million will be put to shareholders at the 2012 AGM. This will provide the capacity for an additional non-executive Director to be appointed following the retirement of an executive Director, as well as for market based reviews for Directors’ fees in future years.
Effective 1 July 2012, the annual Board fee for non-executive Directors was increased to $235,000, and to $705,000 for the Chairman. There was no increase in Committee fees.
In June 2011, the Board approved an arms-length consulting agreement between Telstra and eGeneration Investments Pty Limited, of which Steven Vamos, a non-executive Director, is a director and shareholder.
Services were provided under this agreement in FY 2012 in relation to aspects of the Company’s media strategy. From the commencement of the contract in June 2011 until the agreement expired in the ordinary course in December 2011, Telstra paid $19,800, of which $8,550 related to services provided in FY 2012.
4.2 Remuneration Policy and Strategy
Telstra’s non-executive Directors are remunerated with set fees. Non-executive Director fee levels do not, therefore, incorporate an at-risk component. This enables Directors to maintain independence and impartiality when making decisions affecting the future direction of the Company.
To align the Directors’ interests with the interests of our shareholders, the Board has established guidelines to encourage non-executive Directors to hold Telstra shares equivalent to at least 50 per cent of their annual fees. Such shares are to be acquired over a five year period from the later of 1 July 2009 or the date of appointment. Details of Directors shareholdings as at 9 August 2012 are set out on page 49 of the Directors’ Report.
4.3 Remuneration Components
Each year, non-executive Directors allocate their total remuneration between cash and superannuation components.
Superannuation contributions, in accordance with legislation and Telstra policy, are included within each non-executive Director’s total remuneration. Non-executive Directors may choose to increase the proportion of their remuneration taken as superannuation, subject to legislative requirements.
Telstra does not provide retirement benefits for non-executive Directors other than superannuation contributions.
The DirectShare Plan, previously operated by the Company, has been cancelled with effect from August 2012 as it is no longer in use. As disclosed in previous Remuneration Reports, under the DirectShare Plan, non-executive Directors could nominate to receive a percentage of their total remuneration package as Telstra shares (allocated to participating Directors at market price). As a result of its cancellation, no new grants may be made under the DirectShare Plan. Existing grants under the plan will remain on foot, and under the terms of the DirectShare plan and the relevant trust deed.
Table 5.7 provides full details of non-executive Director remuneration for FY 2012.
Section 2.3.5 of this Report provides details on Restrictions and Governance as they apply to KMP (including non-executive Directors).
Board Fees ChairmanNon-executive
DirectorBoard (FY 2012) $679,800 $226,600Committee Fees Committee
ChairCommittee
MemberAudit Committee $70,000 $35,000Remuneration Committee $50,000 $25,000Nomination Committee - $7,000Technology Committee $7,000 $7,000
For
per
sona
l use
onl
y

63
Telstra Corporation Limited and controlled entities
Remuneration Report
5. R
emun
erat
ion
Tabl
es a
nd D
ata
5.1
Seni
or E
xecu
tives
rem
uner
atio
n (m
ain
tabl
e)
The
tabl
e be
low
has
bee
n pr
epar
ed in
acc
orda
nce
with
the
requ
irem
ents
of t
he C
orpo
ratio
ns A
ct 2
001
and
the
rele
vant
acc
ount
ing
stan
dard
s. T
he fi
gure
s pr
ovid
ed u
nder
the
colu
mns
Sho
rt Te
rm In
cent
ive
Sha
res
and
Acc
ount
ing
valu
e of
oth
er e
quity
for s
hare
bas
ed p
aym
ents
wer
e no
t act
ually
rece
ived
by
KMP
in F
Y 20
12. S
ee s
ectio
n 1.
4 fo
r va
lues
of a
ctua
l rem
uner
atio
n cr
ysta
llised
in F
Y 2
012.
The
tota
l of t
he K
MP
in F
Y 20
11 (a
s pe
r the
201
1 R
emun
erat
ion
Rep
ort)
was
$26
,442
,671
. The
FY
2011
tota
l dis
play
ed in
the
mai
n ta
ble
abov
e ($
17,5
91,8
67) d
oes
not i
nclu
de
KMP
who
had
nil
rem
uner
atio
n le
vels
in F
Y 20
12 o
r the
top
5 pa
id e
xecu
tives
whi
ch w
ere
prev
ious
ly re
quire
d to
be
disc
lose
d.
Shor
t Ter
m E
mpl
oyee
Ben
efits
Post
-em
ploy
men
t B
enef
its
Term
inat
ion
Ben
efits
Oth
er L
ong
Term
Ben
efits
Equi
ty S
ettle
d Sh
are-
base
d Pa
ymen
ts
Nam
e an
d P
erio
d of
FY
201
2 as
a
KM
PYe
arS
alar
y an
d Fe
es (1
)
($)
Sho
rt Te
rm
Ince
ntiv
es
(cas
h) (2
)
($)
Non
-m
onet
ary
Bene
fits
(3)
($)
Oth
er (4
)
($)
Sup
eran
nuat
ion
(5)
($)
Term
inat
ion
Ben
efits
($)
Acc
rued
Lon
g S
ervi
ce L
eave
($)
Shor
t Ter
m
Ince
ntiv
e S
hare
s (6
)
($)
Acco
untin
g Va
lue
of O
ther
E
quity
(a
t ris
k)
(7) (
8)($
)
Tota
l
($)
Dav
id T
hode
y 20
122,
387,
536
2,41
5,44
96,
582
-15
,775
-60
,083
805,
150
2,00
6,13
57,
696,
710
2011
2,05
8,87
51,
688,
775
7,60
9-
39,7
55-
52,4
6656
2,92
569
4,51
65,
104,
921
Gor
don
Bal
lant
yne
(9)
2012
1,19
6,52
01,
294,
688
12,9
18-
15,7
75-
30,3
0743
1,56
3-
2,98
1,77
120
111,
084,
801
807,
675
42,7
6560
0,00
015
,199
-27
,500
269,
225
-2,
847,
165
Ric
k E
llis(1
6 Ja
nuar
y 20
12 -
30 J
une
2012
)20
1239
2,05
139
5,55
64,
641
-7,
198
-9,
981
131,
852
61,6
201,
002,
899
2011
--
--
--
--
--
Stua
rt Le
e(6
Jul
y 20
11 -
30 J
une
2012
)20
1292
6,11
862
3,49
219
,070
-15
,559
-23
,542
207,
831
207,
954
2,02
3,56
620
11-
--
--
--
--
-
Kat
e M
cKen
zie
20
1287
4,27
195
5,46
312
,199
-61
,275
-23
,389
318,
488
525,
549
2,77
0,63
420
1182
7,42
646
6,38
79,
372
-60
,699
-22
,203
155,
462
147,
923
1,68
9,47
2A
ndre
w P
enn
(31
Dec
embe
r 201
1 - 3
0 Ju
ne 2
012)
2012
461,
408
591,
202
3,82
3-
5,25
8-
11,6
6719
7,06
753
,879
1,32
4,30
420
11-
--
--
--
--
-
Bre
ndon
Rile
y20
121,
196,
520
1,25
7,18
818
,984
1,00
0,00
015
,775
-30
,307
419,
063
385,
852
4,32
3,68
920
1136
5,56
325
8,27
517
,281
1,00
0,00
05,
122
-9,
267
86,0
92-
1,74
1,60
0B
ruce
Akh
urst
(1 J
uly
2011
- 15
Jan
uary
201
2)20
1258
9,83
9-
17,7
30-
150,
539
-18
,509
-51
7,21
01,
293,
827
2011
1,05
5,97
988
0,09
911
,029
-27
3,27
1-
33,2
3129
3,36
638
7,47
92,
934,
454
John
Sta
nhop
e (1
0)(1
Jul
y 20
11 -
30 D
ecem
ber 2
011)
2012
734,
829
-15
,825
-7,
888
744,
751
18,5
68-
49,6
611,
571,
522
2011
1,40
1,02
61,
048,
729
14,3
18-
15,1
99-
35,4
0634
9,57
641
0,00
13,
274,
255
TOTA
L C
UR
REN
T &
FO
RM
ER
KM
P20
128,
759,
092
7,53
3,03
811
1,77
21,
000,
000
295,
042
744,
751
226,
353
2,51
1,01
43,
807,
860
24,9
88,9
2220
116,
793,
670
5,14
9,94
010
2,37
41,
600,
000
409,
245
-18
0,07
31,
716,
646
1,63
9,91
917
,591
,867
Com
paris
on o
f Tot
al o
f FY
2012
to
FY 2
011
Rem
uner
atio
n R
epor
t20
128,
759,
092
7,53
3,03
811
1,77
21,
000,
000
295,
042
744,
751
226,
353
2,51
1,01
43,
807,
860
24,9
88,9
2220
119,
816,
684
6,43
6,25
915
6,12
01,
600,
000
900,
842
2,56
1,15
826
7,93
92,
145,
419
2,55
8,25
026
,442
,671
For
per
sona
l use
onl
y

64
Telstra Corporation Limited and controlled entities
Remuneration Report
Foot
note
s to
Tab
le 5
.1
(1)
Incl
udes
sal
ary,
sal
ary
sacr
ifice
ben
efits
(exc
ludi
ng s
alar
y sa
crifi
ce s
uper
annu
atio
n w
hich
is in
clud
ed u
nder
Sup
eran
nuat
ion)
and
frin
ge b
enef
its ta
x.(2
)S
hort
term
ince
ntiv
e re
late
s to
per
form
ance
in F
Y 2
011
and
FY 2
012
resp
ectiv
ely
and
is b
ased
on
actu
al p
erfo
rman
ce fo
r Tel
stra
and
the
indi
vidu
al.
(3)
Incl
udes
the
bene
fit o
f int
eres
t-fre
e lo
ans
unde
r TE
SO
P99
(whi
ch h
ave
not b
een
expe
nsed
as
they
wer
e is
sued
prio
r to
7 N
ovem
ber 2
002
and
wer
e th
eref
ore
incl
uded
in th
e ex
empt
ion
perm
itted
und
er A
AS
B 1
“Firs
t-tim
e A
dopt
ion
of
Aus
tralia
n E
quiv
alen
ts to
Inte
rnat
iona
l Fin
anci
al R
epor
ting
Sta
ndar
ds”)
, the
val
ue o
f per
sona
l hom
e se
curit
y se
rvic
es p
rovi
ded
by T
elst
ra a
nd th
e va
lue
of th
e pe
rson
al u
se o
f pro
duct
s an
d se
rvic
es re
late
d to
Tel
stra
em
ploy
men
t and
the
valu
e of
per
sona
l tra
vel c
osts
.(4
)In
clud
es th
e se
cond
and
fina
l tra
nche
of a
sig
n-on
bon
us fo
r Bre
ndon
Rile
y.(5
)R
epre
sent
s co
mpa
ny c
ontri
butio
ns to
sup
eran
nuat
ion
as w
ell a
s an
y ad
ditio
nal s
uper
annu
atio
n co
ntrib
utio
ns m
ade
thro
ugh
sala
ry s
acrif
ice
by S
enio
r Exe
cutiv
es.
(6)
This
incl
udes
the
valu
e of
STI
sha
res
allo
cate
d un
der t
he F
Y 2
012
STI
pla
n w
here
by 2
5 pe
r cen
t of t
he S
TI p
aym
ent w
as p
rovi
ded
as re
stric
ted
shar
es to
be
dist
ribut
ed o
ver 2
yea
rs a
t 12
mon
th in
terv
als.
(7
)In
acc
orda
nce
with
AA
SB
2, t
he a
ccou
ntin
g va
lue
repr
esen
ts a
por
tion
of th
e fa
ir va
lue
of o
ptio
ns, r
estri
cted
sha
res
and
perfo
rman
ce s
hare
s th
at h
ad n
ot y
et fu
lly v
este
d as
at t
he c
omm
ence
men
t of t
he fi
nanc
ial y
ear.
This
val
ue in
clud
es
an a
ssum
ptio
n th
at o
ptio
ns, r
estri
cted
sha
res
and
perfo
rman
ce s
hare
s w
ill v
est a
t the
end
of t
he v
estin
g pe
riod.
The
am
ount
incl
uded
as
rem
uner
atio
n is
not
rela
ted
to, n
or in
dica
tive
of th
e be
nefit
(if a
ny) t
hat m
ay u
ltim
atel
y be
real
ised
by
eac
h S
enio
r Exe
cutiv
e sh
ould
the
optio
ns b
ecom
e ex
erci
sabl
e or
the
rest
ricte
d sh
ares
bec
ome
rest
ricte
d tru
st s
hare
s. T
he a
ccou
ntin
g va
lue
incl
udes
the
nega
tive
amou
nt fo
r opt
ions
and
rest
ricte
d sh
ares
forfe
ited
or la
psed
dur
ing
the
year
that
faile
d to
sat
isfy
non
-mar
ket (
i.e.
non-
RTS
R) p
erfo
rman
ce ta
rget
s. R
efer
to T
able
5.4
for f
urth
er in
form
atio
n.(8
)A
s re
quire
d un
der A
AS
B 2
, acc
ount
ing
expe
nse
that
was
pre
viou
sly
reco
gnis
ed a
s re
mun
erat
ion
has
been
reve
rsed
in F
Y 2
012
and
FY 2
011.
For
FY
201
2, th
is h
as o
ccur
red
for t
he F
Y 2
009
and
FY 2
010
LTI p
lans
that
faile
d to
sat
isfy
no
n-m
arke
t (i.e
. non
-RTS
R) p
erfo
rman
ce ta
rget
s, re
sulti
ng in
equ
ity in
stru
men
ts la
psin
g. F
or m
arke
t bas
ed h
urdl
es (i
.e. R
TSR
) an
acco
untin
g va
lue
is re
cord
ed a
bove
, how
ever
the
rele
vant
KM
P re
ceiv
ed n
o va
lue
from
thos
e eq
uity
in
stru
men
ts th
at la
psed
.(9
)G
ordo
n B
alla
ntyn
e w
as n
ot g
rant
ed a
ny L
TI in
FY
201
2 an
d du
e to
the
fixed
term
nat
ure
(four
yea
rs) o
f Gor
don
Bal
lant
yne’
s em
ploy
men
t, he
was
gra
nted
a c
ash
base
d LT
I on
7 M
arch
201
1 (d
etai
ls o
f whi
ch a
re in
clud
ed in
Tel
stra
’s
2011
Rem
uner
atio
n re
port)
. The
max
imum
val
ue o
f his
gra
nt is
$4,
579,
548
if th
e pl
an m
easu
res
of F
CF
RO
I and
RTS
R a
re s
igni
fican
tly e
xcee
ded.
Thi
s pl
an is
in li
eu o
f par
ticip
atio
n in
Tel
stra
equ
ity L
TI p
lans
. Any
pay
men
t und
er th
is
plan
is s
ubje
ct to
the
sam
e te
rms
and
perfo
rman
ce c
riter
ia a
s Te
lstra
’s F
Y 2
011
LTI p
lan
that
app
lies
to o
ther
Sen
ior E
xecu
tives
as
deta
iled
in th
e 20
11 R
emun
erat
ion
Rep
ort.
If th
e P
erfo
rman
ce c
riter
ia fo
r FC
F R
OI a
nd R
TSR
are
not
m
et, t
hen
ther
e is
nil
paym
ent u
nder
this
pla
n. P
rior t
o 1
Aug
ust 2
011
whe
n he
bec
ame
Chi
ef C
usto
mer
Offi
cer,
Gor
don
Bal
lant
yne
was
Gro
up M
anag
ing
Dire
ctor
Tel
stra
Con
sum
er a
nd C
ount
ry W
ide
for t
he p
erio
d of
FY
201
2 1
July
20
11 to
31
July
201
1.(1
0)Te
rmin
atio
n B
enef
its fo
r Joh
n S
tanh
ope
incl
udes
a p
ro ra
ta a
t tar
get S
TI p
aym
ent o
f $74
4,75
1 un
der T
elst
ra’s
Sho
rt Te
rm In
cent
ive
Pol
icy.
For
per
sona
l use
onl
y

65
Telstra Corporation Limited and controlled entities
Remuneration Report
5.2 STI payments (cash and shares)
(1) The maximum potential STI refers to the maximum potential STI specific to FY 2012 and FY 2011 respectively, where the Senior Executive was a KMP, adjusted for any variation in fixed remuneration throughout FY 2012 and FY 2011 that impacts the maximum potential STI available.
(2) The current year grant of STI is pro rata adjusted to reflect the STI component that relates to the Senior Executive’s tenure as a KMP. Accordingly any STI component awarded that relates to a period of time where the Senior Executive was not a KMP is excluded from this table. If the minimum threshold performance is not met the minimum possible STI payment is nil.
(3) The STI for FY 2012 and FY 2011 was approved by the Board on 8 August 2012 and 11 August 2011 respectively. The restricted shares, which represent 25% of the STI award, vest in equal parts over one and two years on the anniversary of their allocation date, subject to the Senior Executive’s continued employment. Refer to Note 27 of the financial statements for further details.
(4) The grant date for both the cash and the equity component of the FY 2012 STI will be subsequent to the date of this Report.
Name Year Maximum Potential STI
(1)($)
Current Year Grant of STI
(2) (3)(4) ($)
% of the Maximum Potential
% Forfeited Total Grant of STI
($)
David Thodey 2012 4,876,000 3,220,599 66.1% 33.9% 3,220,5992011 4,600,000 2,251,700 49.0% 51.0% 2,251,700
Gordon Ballantyne 2012 2,500,000 1,726,251 69.1% 30.9% 1,726,2512011 2,200,000 1,076,900 49.0% 51.0% 1,076,900
Rick Ellis 2012 798,497 527,408 66.1% 33.9% 527,4082011 - - - - -
Stuart Lee 2012 1,432,080 831,323 58.1% 41.9% 831,3232011 - - - - -
Kate McKenzie 2012 1,900,000 1,273,951 67.1% 32.9% 1,273,9512011 1,338,750 621,849 46.5% 53.5% 621,849
Andrew Penn 2012 1,193,443 788,269 66.1% 33.9% 788,2692011 - - - - -
Brendon Riley 2012 2,500,000 1,676,251 67.1% 32.9% 1,676,2512011 741,370 344,367 46.5% 53.5% 344,367
Bruce Akhurst 2012 - - - - -2011 2,670,000 1,173,465 44.0% 56.0% 1,173,465
John Stanhope 2012 - - - - -2011 2,856,600 1,398,305 48.9% 51.1% 1,398,305
For
per
sona
l use
onl
y

66
Telstra Corporation Limited and controlled entities
Remuneration Report
5.3 Summary of LTI Plans and Other Equity Plans as at 30 June 2012:
(1) The 85% tested is represented by 40% for the 3rd performance period test and a retest of 75% of the original 30% available for testing for each of the 1st and 2nd performance periods.
(2) Represents the percentage of the grant that was forfeited/expired by the person, as service or performance criteria were not satisfied in the financial year.(3) The values included in the above table have been calculated by applying option valuation methodologies as described in Note 27 of the financial statements.(*) These KMP did not participate in equity settled LTI share based payment plans for FY 2012. (#) Andrew Penn was allocated 96,500 Performance Shares on 18 January 2012 as part of his service agreement.(^) For Bruce Akhurst, the maximum and minimum possible value yet to vest in future years for the Restricted Shares granted in FY 2012 is nil due to his separation from Telstra
before 30 June 2012.
Name Plan Type of Instrument
Granted
Performance Period % of Total Plan Tested
at 30/06/2012 (1)
% of Grant Forfeited/Expired in
Current Year (2)
Future Financial Years in
which Grants May Vest
Accounting Value Yet to Vest (3) (^)
Min ($) Max ($)
David Thodey Fiscal 2009 Options 1/07/2008 - 30/06/2012 85% 47% n/a n/a n/a
Fiscal 2009 Restricted Shares
1/07/2009 - 30/06/2012 40% 100% n/a n/a n/a
Fiscal 2010 Restricted Shares
1/07/2009 - 30/06/2012 100% 34% 30/06/2013 nil 318,681
Fiscal 2011 Restricted Shares
1/07/2010 - 30/06/2013 n/a n/a 30/06/2014 nil 1,183,051
Fiscal 2012 Restricted Shares
1/07/2011 - 30/06/2014 n/a n/a 30/06/2015 nil 2,822,123
Gordon Ballantyne (*)
- - - - - - - -
Rick Ellis Fiscal 2012 Restricted Shares
1/07/2011 - 30/06/2014 n/a n/a 30/06/2015 nil 405,144
Stuart Lee Fiscal 2009 Options 1/07/2008 - 30/06/2012 85% 47% n/a n/a n/a
Fiscal 2009 Restricted Shares
1/07/2009 - 30/06/2012 40% 100% n/a n/a n/a
Fiscal 2010 Restricted Shares
1/07/2009 - 30/06/2012 100% 34% 30/06/2013 nil 55,769
Fiscal 2011 Restricted Shares
1/07/2010 - 30/06/2013 n/a n/a 30/06/2014 nil 271,512
Kate McKenzie
Fiscal 2009 Options 1/07/2008 - 30/06/2012 85% 47% n/a n/a n/a
Fiscal 2009 Restricted Shares
1/07/2009 - 30/06/2012 40% 100% n/a n/a n/a
Fiscal 2010 Restricted Shares
1/07/2009 - 30/06/2012 100% 34% 30/06/2013 nil 83,654
Fiscal 2011 Restricted Shares
1/07/2010 - 30/06/2013 n/a n/a 30/06/2014 nil 263,970
Fiscal 2012 Restricted Shares
1/07/2011 - 30/06/2014 n/a n/a 30/06/2015 nil 879,743
Andrew Penn (#) (*)
Fiscal 2012 Performance Shares
14/12/2011 - 14/12/2014 n/a n/a 3/12/2014 nil 202,329
Brendon Riley Fiscal 2012 Restricted Shares
1/07/2011 - 30/06/2014 n/a n/a 30/06/2015 nil 1,157,555
Total 7,643,531
For
per
sona
l use
onl
y

67
Telstra Corporation Limited and controlled entities
Remuneration Report
5.4 Accounting value of all LTI instruments
(1) The value of each instrument is calculated by applying valuation methodologies as described in Note 27 to the financial statements and is then amortised over the relevant vesting period. The values included in the table relate to the current year amortised value of all LTI instruments detailed in the Equity Settled Share Based Payments section in the remuneration Table 5.1. Refer to Note 27 to the financial statements for details on employee share plans.
(2) When a vesting scale is used, the table reflects the maximum achievable allocation.(3) As required under AASB 2, accounting expense that was previously recognised as remuneration has been reversed in FY 2012 and FY 2011. For FY 2012, this has occurred
for the FY 2009 and FY 2010 LTI plans that failed to satisfy non-market (i.e. non-RTSR) performance targets, resulting in equity instruments lapsing. For market based hurdles, (i.e. RTSR) an accounting value is recorded above, however the relevant KMP received no value from those equity instruments that lapsed.
(4) Total Remuneration is the sum of short term employee benefits, post employment benefits, termination benefits, other long term benefits and equity settled share based payments as detailed in Table 5.1 of this Report.
Name Year Accounting Value of LTI Equity Allocations (1) (2) (3)
Total
($)
Accounting Value as a % of Total
Remuneration (4)Options
($)Restricted shares
($)Performance shares
($) (%)
David Thodey 2012 35,253 1,970,882 - 2,006,135 26.1%2011 49,113 645,403 - 694,516 13.6%
Gordon Ballantyne 2012 - - - - -2011 - - - - -
Rick Ellis 2012 - 61,620 - 61,620 6.1%2011 - - - - -
Stuart Lee 2012 7,280 200,674 - 207,954 10.3%2011 - - - - -
Kate McKenzie 2012 13,459 512,090 - 525,549 19.0%2011 6,510 141,413 - 147,923 8.8%
Andrew Penn 2012 - - 53,879 53,879 4.1%2011 - - - - -
Brendon Riley 2012 - 385,852 - 385,852 8.9%2011 - - - - -
Bruce Akhurst 2012 20,647 496,563 - 517,210 17.0%2011 52,909 334,570 - 387,479 13.2%
John Stanhope 2012 8,972 40,689 - 49,661 3.2%2011 38,951 371,050 - 410,001 12.5%
For
per
sona
l use
onl
y

68
Telstra Corporation Limited and controlled entities
Remuneration Report
5.5 Number of equity instruments granted, vested and exercised during FY 2012
(1) Restricted shares granted during FY 2012 relate to the FY 2012 LTI plan.(2) Restricted shares vested during FY 2012 relate to the FY 2010 LTI plan.(3) Options vested during FY 2012 relate to the FY 2009 LTI plan.(4) Deferred Incentive shares granted during FY 2012 relate to the FY 2011 STI plan which were allocated on 19 August 2011. However, the allocation of incentive shares under
the FY 2012 STI plan will be made subsequent to the reporting date of 30 June 2012, therefore they have not been included in the table above.(5) Incentive shares exercised during FY 2012 relate to the FY 2007 and FY 2008 STI plans which were released from restriction due to John Stanhope’s retirement.
5.6 Value of options, performance rights and restricted shares granted, exercised and lapsed/forfeited in FY 2012
(1) The grant date of the FY 2012 LTI plan was 31 December 2011. The fair value of the RTSR and FCF ROI restricted shares granted in FY 2012 at the grant date is $2.12 and $2.68 respectively. The fair value reflects the valuation approach required by AASB 2 using a Monte Carlo simulation option pricing model, as explained in Note 27 to the financial statements.
(2) The value of the equity instruments exercised reflects the market value at the date of exercise after deducting any exercise price paid. John Stanhope exercised 165,291 Incentive Shares at a market value of $3.33 on 30 December 2011.
(3) The value of equity instruments that have lapsed during the year represents the value foregone and is calculated at the date the equity instruments lapsed using an option pricing model and after deducting any exercise price that would have been payable. The expiry date of the restricted shares that expired during FY 2012 was 30 June 2012.
(4) As the options granted under the FY 2009 LTI plans had an exercise price that was greater than the market price of Telstra shares (i.e. were out of the money), there was no value associated with these lapsed options.
(5) The grant date of Mr Penn’s Performance Shares was 18 January 2012. The fair value of the Performance Shares at the grant date was $2.78 for 50% which vest after two years and $2.53 for the remaining 50% which vest after three years from the date of commencement. The fair value reflects the valuation approach required by AASB 2 using a Monte Carlo simulation option pricing model.
Name Restricted Shares Options Deferred Incentive Shares
Incentive Shares
Performance Shares
Granted (1) Vested (2) Vested (3) Granted (4) Exercised (5) GrantedDavid Thodey 1,567,846 725,274 337,990 181,004 - -Gordon Ballantyne - - - 86,568 - -Rick Ellis 225,080 - - - - -Stuart Lee - 126,923 70,762 51,416 - -Kate McKenzie 488,746 190,385 129,036 49,988 - -Andrew Penn - - - - - 96,500Brendon Riley 643,086 - - 27,682 - -Bruce Akhurst 700,552 - - 94,330 - -John Stanhope - - - 112,404 165,291 -
Name Granted during period (1)
($)
Exercised (2)($)
Expired/Forfeited Value Foregone (3) (4)
($)Restricted
SharesPerformance
SharesIncentive Shares Restricted Shares Options
David Thodey 3,762,830 - - 1,321,640 -Gordon Ballantyne - - - - -Rick Ellis 540,192 - - - -Stuart Lee - - - 241,000 -Kate McKenzie 1,172,990 - - 380,652 -Andrew Penn - 256,208 - - -Brendon Riley 1,543,406 - - - -Bruce Akhurst 1,681,325 - - - -John Stanhope - - 550,419 - -
For
per
sona
l use
onl
y

69
Telstra Corporation Limited and controlled entities
Remuneration Report
5.7 Non-executive Director Remuneration
(1) Includes fees for membership on Board Committees. In FY 2012, the fees also includes additional fees for services provided in relation to the NBN Due Diligence Committee. This amount includes $22,275 for John Stocker, $19,575 for Russell Higgins and $55,575 for Nora Scheinkestel. In FY 2011, the fees included additional fees for services provided in relation to the NBN Committee and the NBN Due Diligence Committee. This included an amount of $4,050 each for John Stocker, Russell Higgins and Steve Vamos.
(2) These payments refer to telecommunications and other services and equipment provided to non-executive Directors to assist them in performing their duties. From time to time Telstra may also make products and services available to non-executive Directors without charge to allow them to familiarise themselves with Telstra’s products and services and with recent technological developments.
(3) Timothy Chen qualifies as a KMP for period 1 April 2012 to 30 June 2012.(4) Margaret Seale qualifies as a KMP for the period 7 May 2012 to 30 June 2012.(5) John Stewart qualifies as a KMP for the period 1 July 2011 to 18 October 2011.
Short Term Employee BenefitsPost-employment
Benefits
Equity Settled Share-based
Payments
Name Year Salary and Fees (1)($)
Non-monetary Benefits (2)
($)
Superannuation
($)
Directshare
($)
Total
($)
Catherine B Livingstone Chairman
2012 664,025 4,641 15,775 - 684,441
2011 662,323 5,870 15,199 - 683,392
Timothy Y Chen (3)Director
2012 61,120 - 3,922 - 65,042
2011 - - - - -
Geoffrey A Cousins Director
2012 242,825 - 15,775 - 258,600
2011 242,066 - 15,199 - 257,265
Russell A Higgins Director
2012 265,400 333 15,775 - 281,508
2011 249,692 367 15,199 - 265,258
John P Mullen Director
2012 272,911 1,153 10,689 - 284,753
2011 281,690 1,028 - - 282,718
Nora L ScheinkestelDirector
2012 301,400 - 15,775 - 317,175
2011 218,048 - 13,450 - 231,498
Margaret L Seale (4)Director
2012 31,681 - 2,371 - 34,052
2011 - - - - -
John W Stocker Director
2012 310,100 164 15,775 - 326,039
2011 291,692 150 15,199 - 307,041
Steven M Vamos Director
2012 231,906 1,692 26,694 - 260,292
2011 241,290 1,955 26,118 - 269,363
John D Zeglis Director
2012 232,566 - 1,034 - 233,600
2011 232,841 - - - 232,841
John M Stewart (5)Director
2012 78,623 - - - 78,623
2011 258,259 - 2,582 - 260,841
Total2012 2,692,557 7,983 123,585 - 2,824,125
2011 2,677,901 9,370 102,946 - 2,790,217
For
per
sona
l use
onl
y

70
Telstra Corporation Limited and controlled entities
Remuneration Report
Glossary and abbreviations used in report
Average Investment for LTI Average investment over the period is the average of the sum of net debt and shareholders’ funds over the entire three year performance period.
Customer Satisfaction A non financial measure in Telstra’s STI plans. Refer to section 3.2.2 for further information.EBITDA Earnings Before Interest, Tax, Depreciation and Amortisation EBITDA for STI Earnings Before Interest, Tax, Depreciation and Amortisation (excluding profit/loss on Land &
Building disposals).Fixed Remuneration Base salary plus company and private salary sacrificed superannuation contributionsFree Cashflow (FCF) Cashflow from operating and investing activitiesFree Cashflow for STI Free Cashflow (excluding CAPEX for Investment and Spectrum; and proceeds from Land &
Building disposals) FCF for LTI FCF for these purposes is annual free cash flow less interest paid and adjusting for non-recurring
factors such as acquisitions and gains on the sale of assets. FCF ROI for LTI A ratio of the average annual free cashflow over the entire three year performance period by
Telstra’s average investment over the same period.GMD Group Managing DirectorGrowthshare A wholly owned entity of Telstra that administers employee equity plansKMP Key Management PersonnelLTI Long Term IncentiveNBN National Broadband NetworkNBN Transaction Agreements with NBN Co and the Government in relation to Telstra’s participation in the rollout of
the NBN.Restricted Shares A right to a share subject to the achievement of the performance hurdleRTSR Relative Total Shareholder ReturnSenior Executive Refers to the Chief Executive Officer and those executives with authority and responsibility for
planning, directing and controlling the activities of the Company and Group, directly or indirectlyService Agreement a Senior Executive’s contract of employmentSTI Short Term IncentiveSTI Deferral A program that requires executives to defer part of their cash incentive into sharesStraightline Vesting Describes the vesting calculation between target and stretch of an LTI planSSU Structural Separation UndertakingTotal Fixed Remuneration Identical to Fixed Remuneration – specifically defined this way in the CEO’s contract. Total Remuneration The sum of all the fixed and variable components of remuneration as detailed in Table 5.1Total Income Total Telstra Income excluding profit/loss on Land & Building disposals
For
per
sona
l use
onl
y

71
Telstra Corporation Limited and controlled entities
Telstra Corporation Limited and controlled entitiesAustralian Business Number (ABN): 33 051 775 556
Financial Report as at 30 June 2012
Page Number
Financial StatementsIncome Statement . . . . . . . . . . . . . . . . . . . . . . . . . . . . . . . . . . . . . . . . . . . . . . . . . . . . . . . . . . . 72Statement of Comprehensive Income . . . . . . . . . . . . . . . . . . . . . . . . . . . . . . . . . . . . . . . . . . . . . . . . . 73Statement of Financial Position . . . . . . . . . . . . . . . . . . . . . . . . . . . . . . . . . . . . . . . . . . . . . . . . . . . . 74Statement of Cash Flows. . . . . . . . . . . . . . . . . . . . . . . . . . . . . . . . . . . . . . . . . . . . . . . . . . . . . . . . 75Statement of Changes in Equity . . . . . . . . . . . . . . . . . . . . . . . . . . . . . . . . . . . . . . . . . . . . . . . . . . . . 76
Notes to the Financial StatementsNote 1 - Basis of preparation . . . . . . . . . . . . . . . . . . . . . . . . . . . . . . . . . . . . . . . . . . . . . . . . . 77Note 2 - Summary of significant accounting policies, estimates, assumptions and judgements . . . . . . . . . . . . . . . 78Note 3 - Earnings per share . . . . . . . . . . . . . . . . . . . . . . . . . . . . . . . . . . . . . . . . . . . . . . . . . 94Note 4 - Dividends . . . . . . . . . . . . . . . . . . . . . . . . . . . . . . . . . . . . . . . . . . . . . . . . . . . . . . 95Note 5 - Segment information . . . . . . . . . . . . . . . . . . . . . . . . . . . . . . . . . . . . . . . . . . . . . . . . 96Note 6 - Income. . . . . . . . . . . . . . . . . . . . . . . . . . . . . . . . . . . . . . . . . . . . . . . . . . . . . . . . 102Note 7 - Expenses . . . . . . . . . . . . . . . . . . . . . . . . . . . . . . . . . . . . . . . . . . . . . . . . . . . . . . 103Note 8 - Remuneration of auditors . . . . . . . . . . . . . . . . . . . . . . . . . . . . . . . . . . . . . . . . . . . . . . 105Note 9 - Income taxes . . . . . . . . . . . . . . . . . . . . . . . . . . . . . . . . . . . . . . . . . . . . . . . . . . . . 106Note 10 - Trade and other receivables. . . . . . . . . . . . . . . . . . . . . . . . . . . . . . . . . . . . . . . . . . . . . 108Note 11 - Inventories . . . . . . . . . . . . . . . . . . . . . . . . . . . . . . . . . . . . . . . . . . . . . . . . . . . . . . 110Note 12 - Non current assets held for sale. . . . . . . . . . . . . . . . . . . . . . . . . . . . . . . . . . . . . . . . . . . 111Note 13 - Property, plant and equipment. . . . . . . . . . . . . . . . . . . . . . . . . . . . . . . . . . . . . . . . . . . . 112Note 14 - Intangible assets. . . . . . . . . . . . . . . . . . . . . . . . . . . . . . . . . . . . . . . . . . . . . . . . . . . 114Note 15 - Trade and other payables . . . . . . . . . . . . . . . . . . . . . . . . . . . . . . . . . . . . . . . . . . . . . . 117Note 16 - Provisions . . . . . . . . . . . . . . . . . . . . . . . . . . . . . . . . . . . . . . . . . . . . . . . . . . . . . . 118Note 17 - Capital management and financial instruments . . . . . . . . . . . . . . . . . . . . . . . . . . . . . . . . . . . 121Note 18 - Financial risk management . . . . . . . . . . . . . . . . . . . . . . . . . . . . . . . . . . . . . . . . . . . . . 130Note 19 - Share capital. . . . . . . . . . . . . . . . . . . . . . . . . . . . . . . . . . . . . . . . . . . . . . . . . . . . . 147Note 20 - Notes to the statement of cash flows . . . . . . . . . . . . . . . . . . . . . . . . . . . . . . . . . . . . . . . . 148Note 21 - Impairment. . . . . . . . . . . . . . . . . . . . . . . . . . . . . . . . . . . . . . . . . . . . . . . . . . . . . . 151Note 22 - Expenditure commitments . . . . . . . . . . . . . . . . . . . . . . . . . . . . . . . . . . . . . . . . . . . . . . 153Note 23 - Contingent liabilities and contingent assets . . . . . . . . . . . . . . . . . . . . . . . . . . . . . . . . . . . . . 155Note 24 - Post employment benefits . . . . . . . . . . . . . . . . . . . . . . . . . . . . . . . . . . . . . . . . . . . . . . 156Note 25 - Investments in controlled entities . . . . . . . . . . . . . . . . . . . . . . . . . . . . . . . . . . . . . . . . . . 161Note 26 - Investments in jointly controlled and associated entities . . . . . . . . . . . . . . . . . . . . . . . . . . . . . . 169Note 27 - Employee share plans . . . . . . . . . . . . . . . . . . . . . . . . . . . . . . . . . . . . . . . . . . . . . . . . 174Note 28 - Key management personnel compensation . . . . . . . . . . . . . . . . . . . . . . . . . . . . . . . . . . . . . 189Note 29 - Related party disclosures . . . . . . . . . . . . . . . . . . . . . . . . . . . . . . . . . . . . . . . . . . . . . . 196Note 30 - Parent entity information. . . . . . . . . . . . . . . . . . . . . . . . . . . . . . . . . . . . . . . . . . . . . . . 199Note 31 - Events after reporting date . . . . . . . . . . . . . . . . . . . . . . . . . . . . . . . . . . . . . . . . . . . . . 201
Directors’ Declaration . . . . . . . . . . . . . . . . . . . . . . . . . . . . . . . . . . . . . . . . . . . . . . . . . . . . . . . . 202
Independent Audit Report . . . . . . . . . . . . . . . . . . . . . . . . . . . . . . . . . . . . . . . . . . . . . . . . . . . . . . 203
For
per
sona
l use
onl
y

Telstra Corporation Limited and controlled entities
72
The notes following the financial statements form part of the financial report.
Income Statementfor the year ended 30 June 2012
Telstra GroupYear ended 30 June
2012 2011Note $m $m
IncomeRevenue (excluding finance income). . . . . . . . . . . . . . . . . . . . . . . . . . . . . . . . . . . . 6 25,368 25,093Other income . . . . . . . . . . . . . . . . . . . . . . . . . . . . . . . . . . . . . . . . . . . . . . . . 6 135 211
25,503 25,304ExpensesLabour . . . . . . . . . . . . . . . . . . . . . . . . . . . . . . . . . . . . . . . . . . . . . . . . . . . . 4,061 3,924Goods and services purchased . . . . . . . . . . . . . . . . . . . . . . . . . . . . . . . . . . . . . . . 6,179 6,183Other expenses . . . . . . . . . . . . . . . . . . . . . . . . . . . . . . . . . . . . . . . . . . . . . . 7 5,029 5,047
15,269 15,154
Share of net (profit) from jointly controlled and associated entities . . . . . . . . . . . . . . . . . . . . 26 - (1)15,269 15,153
Earnings before interest, income tax expense, depreciation and amortisation (EBITDA) . . . . . . . . . . 10,234 10,151Depreciation and amortisation . . . . . . . . . . . . . . . . . . . . . . . . . . . . . . . . . . . . . . . 7 4,412 4,459Earnings before interest and income tax expense (EBIT) . . . . . . . . . . . . . . . . . . . . . . . . . . 5,822 5,692
Finance income . . . . . . . . . . . . . . . . . . . . . . . . . . . . . . . . . . . . . . . . . . . . . . 6 134 127Finance costs. . . . . . . . . . . . . . . . . . . . . . . . . . . . . . . . . . . . . . . . . . . . . . . . 7 1,022 1,262Net finance costs . . . . . . . . . . . . . . . . . . . . . . . . . . . . . . . . . . . . . . . . . . . . . . . 888 1,135
Profit before income tax expense . . . . . . . . . . . . . . . . . . . . . . . . . . . . . . . . . . . . . 4,934 4,557
Income tax expense . . . . . . . . . . . . . . . . . . . . . . . . . . . . . . . . . . . . . . . . . . . . 9 1,510 1,307
Profit for the year . . . . . . . . . . . . . . . . . . . . . . . . . . . . . . . . . . . . . . . . . . . . . . 3,424 3,250
Attributable to:Equity holders of Telstra Entity . . . . . . . . . . . . . . . . . . . . . . . . . . . . . . . . . . . . . . . . 3,405 3,231Non-controlling interests . . . . . . . . . . . . . . . . . . . . . . . . . . . . . . . . . . . . . . . . . . . 19 19
3,424 3,250
Earnings per share (cents per share) cents centsBasic . . . . . . . . . . . . . . . . . . . . . . . . . . . . . . . . . . . . . . . . . . . . . . . . . . . . 3 27.5 26.1Diluted . . . . . . . . . . . . . . . . . . . . . . . . . . . . . . . . . . . . . . . . . . . . . . . . . . . 3 27.4 26.1
For
per
sona
l use
onl
y

Telstra Corporation Limited and controlled entities
73
The notes following the financial statements form part of the financial report.
Statement of Comprehensive Incomefor the year ended 30 June 2012
Telstra GroupYear ended 30 June
2012 2011Note $m $m
Profit for the yearAttributable to equity holders of Telstra Entity . . . . . . . . . . . . . . . . . . . . . . . . . . . . . . . . 3,405 3,231Attributable to non-controlling interests . . . . . . . . . . . . . . . . . . . . . . . . . . . . . . . . . . . 19 19
3,424 3,250Items that will not be reclassified subsequently to profit or lossRetained profits:- actuarial (loss)/gain on defined benefit plans attributable to equity holders of Telstra Entity . . . . . . . 24 (752) 182- income tax on actuarial gain/(loss) on defined benefit plans . . . . . . . . . . . . . . . . . . . . . . . . 222 (54)- actuarial (loss)/gain on defined benefit plans attributable to non-controlling interests . . . . . . . . . . 24 (3) 1
(533) 129Items that may be reclassified subsequently to profit or lossForeign currency translation reserve:- translation differences of foreign operations attributable to equity holders of Telstra Entity . . . . . . . . 68 (328)- income tax on movements in the foreign currency translation reserve . . . . . . . . . . . . . . . . . . . 9 (42)- translation differences transferred to income statement on disposal of controlled entities . . . . . . . . . 9 11- income tax on translation differences transferred to income statement on disposal of controlled entities . - 4- translation differences of foreign operations attributable to non-controlling interests. . . . . . . . . . . . 11 (49)Cash flow hedging reserve:- changes in fair value of cash flow hedges . . . . . . . . . . . . . . . . . . . . . . . . . . . . . . . . . (587) (845)- changes in fair value transferred to other expenses . . . . . . . . . . . . . . . . . . . . . . . . . . . . 204 238- changes in fair value transferred to goods and services purchased . . . . . . . . . . . . . . . . . . . . 7 93- changes in fair value transferred to finance costs . . . . . . . . . . . . . . . . . . . . . . . . . . . . . 263 267- changes in fair value transferred to property, plant and equipment. . . . . . . . . . . . . . . . . . . . . 9 3- income tax on movements in the cash flow hedging reserve . . . . . . . . . . . . . . . . . . . . . . . . 31 73
24 (575)
Total other comprehensive income . . . . . . . . . . . . . . . . . . . . . . . . . . . . . . . . . . . . (509) (446)Total comprehensive income for the year . . . . . . . . . . . . . . . . . . . . . . . . . . . . . . . . . 2,915 2,804
Total comprehensive income attributable to equity holders of Telstra Entity . . . . . . . . . . . . . . . . . 2,888 2,833Total comprehensive income attributable to non-controlling interests . . . . . . . . . . . . . . . . . . . . 27 (29)
For
per
sona
l use
onl
y

Telstra Corporation Limited and controlled entities
74
The notes following the financial statements form part of the financial report.
Statement of Financial Positionas at 30 June 2012
Telstra GroupAs at 30 June
2012 2011Note $m $m
Current assetsCash and cash equivalents. . . . . . . . . . . . . . . . . . . . . . . . . . . . . . . . . . . . . . . . . 20 3,945 2,630Trade and other receivables . . . . . . . . . . . . . . . . . . . . . . . . . . . . . . . . . . . . . . . . 10 4,346 4,137Inventories . . . . . . . . . . . . . . . . . . . . . . . . . . . . . . . . . . . . . . . . . . . . . . . . . 11 260 283Derivative financial assets . . . . . . . . . . . . . . . . . . . . . . . . . . . . . . . . . . . . . . . . 17(f) 32 83Current tax receivables. . . . . . . . . . . . . . . . . . . . . . . . . . . . . . . . . . . . . . . . . . . . 363 4Prepayments . . . . . . . . . . . . . . . . . . . . . . . . . . . . . . . . . . . . . . . . . . . . . . . . . 250 275Assets classified as held for sale. . . . . . . . . . . . . . . . . . . . . . . . . . . . . . . . . . . . . . 12 754 41Total current assets. . . . . . . . . . . . . . . . . . . . . . . . . . . . . . . . . . . . . . . . . . . . . . 9,950 7,453Non current assetsTrade and other receivables . . . . . . . . . . . . . . . . . . . . . . . . . . . . . . . . . . . . . . . . 10 851 340Inventories . . . . . . . . . . . . . . . . . . . . . . . . . . . . . . . . . . . . . . . . . . . . . . . . . 11 24 22Investments - accounted for using the equity method . . . . . . . . . . . . . . . . . . . . . . . . . . . 26 12 2Investments - other . . . . . . . . . . . . . . . . . . . . . . . . . . . . . . . . . . . . . . . . . . . . . . 19 1Property, plant and equipment . . . . . . . . . . . . . . . . . . . . . . . . . . . . . . . . . . . . . . . 13 20,504 21,790Intangible assets . . . . . . . . . . . . . . . . . . . . . . . . . . . . . . . . . . . . . . . . . . . . . . 14 7,421 7,627Derivative financial assets . . . . . . . . . . . . . . . . . . . . . . . . . . . . . . . . . . . . . . . . 17(f) 658 285Non current tax receivables . . . . . . . . . . . . . . . . . . . . . . . . . . . . . . . . . . . . . . . . . 80 382Deferred tax assets. . . . . . . . . . . . . . . . . . . . . . . . . . . . . . . . . . . . . . . . . . . . . 9 6 -Defined benefit assets . . . . . . . . . . . . . . . . . . . . . . . . . . . . . . . . . . . . . . . . . . . 24 - 11Total non current assets . . . . . . . . . . . . . . . . . . . . . . . . . . . . . . . . . . . . . . . . . . . 29,575 30,460Total assets . . . . . . . . . . . . . . . . . . . . . . . . . . . . . . . . . . . . . . . . . . . . . . . . . 39,525 37,913
Current liabilitiesTrade and other payables . . . . . . . . . . . . . . . . . . . . . . . . . . . . . . . . . . . . . . . . . 15 4,131 4,093Provisions . . . . . . . . . . . . . . . . . . . . . . . . . . . . . . . . . . . . . . . . . . . . . . . . . 16 942 846Borrowings . . . . . . . . . . . . . . . . . . . . . . . . . . . . . . . . . . . . . . . . . . . . . . . 17(a) 3,306 1,990Derivative financial liabilities . . . . . . . . . . . . . . . . . . . . . . . . . . . . . . . . . . . . . . . 17(f) 299 634Current tax payables . . . . . . . . . . . . . . . . . . . . . . . . . . . . . . . . . . . . . . . . . . . . . 731 404Revenue received in advance . . . . . . . . . . . . . . . . . . . . . . . . . . . . . . . . . . . . . . . . 1,170 1,018Liabilities classified as held for sale . . . . . . . . . . . . . . . . . . . . . . . . . . . . . . . . . . . . 12 105 5Total current liabilities . . . . . . . . . . . . . . . . . . . . . . . . . . . . . . . . . . . . . . . . . . . . 10,684 8,990Non current liabilitiesOther payables . . . . . . . . . . . . . . . . . . . . . . . . . . . . . . . . . . . . . . . . . . . . . . . 15 174 177Provisions . . . . . . . . . . . . . . . . . . . . . . . . . . . . . . . . . . . . . . . . . . . . . . . . . 16 264 244Borrowings . . . . . . . . . . . . . . . . . . . . . . . . . . . . . . . . . . . . . . . . . . . . . . . 17(a) 11,958 12,178Derivative financial liabilities . . . . . . . . . . . . . . . . . . . . . . . . . . . . . . . . . . . . . . . 17(f) 2,349 1,799Deferred tax liabilities . . . . . . . . . . . . . . . . . . . . . . . . . . . . . . . . . . . . . . . . . . . 9 1,107 1,730Defined benefit liability . . . . . . . . . . . . . . . . . . . . . . . . . . . . . . . . . . . . . . . . . . . 24 831 205Revenue received in advance . . . . . . . . . . . . . . . . . . . . . . . . . . . . . . . . . . . . . . . . 469 298Total non current liabilities . . . . . . . . . . . . . . . . . . . . . . . . . . . . . . . . . . . . . . . . . . 17,152 16,631Total liabilities . . . . . . . . . . . . . . . . . . . . . . . . . . . . . . . . . . . . . . . . . . . . . . . . 27,836 25,621Net assets . . . . . . . . . . . . . . . . . . . . . . . . . . . . . . . . . . . . . . . . . . . . . . . . . . 11,689 12,292
EquityShare capital . . . . . . . . . . . . . . . . . . . . . . . . . . . . . . . . . . . . . . . . . . . . . . . . 19 5,635 5,610Reserves . . . . . . . . . . . . . . . . . . . . . . . . . . . . . . . . . . . . . . . . . . . . . . . . . . . (867) (843)Retained profits. . . . . . . . . . . . . . . . . . . . . . . . . . . . . . . . . . . . . . . . . . . . . . . . 6,712 7,307Equity available to Telstra Entity shareholders . . . . . . . . . . . . . . . . . . . . . . . . . . . . . . . . 11,480 12,074Non-controlling interests . . . . . . . . . . . . . . . . . . . . . . . . . . . . . . . . . . . . . . . . . . . 209 218Total equity . . . . . . . . . . . . . . . . . . . . . . . . . . . . . . . . . . . . . . . . . . . . . . . . . 11,689 12,292F
or p
erso
nal u
se o
nly

Telstra Corporation Limited and controlled entities
75
The notes following the financial statements form part of the financial report.
Statement of Cash Flowsfor the year ended 30 June 2012
Telstra GroupYear ended 30 June
2012 2011Note $m $m
Cash flows from operating activitiesReceipts from customers (inclusive of goods and services tax (GST)) . . . . . . . . . . . . . . . . . . . 28,364 27,389Payments to suppliers and to employees (inclusive of GST) . . . . . . . . . . . . . . . . . . . . . . . . (17,491) (17,860)Net cash generated by operations . . . . . . . . . . . . . . . . . . . . . . . . . . . . . . . . . . . . . . 10,873 9,529Income taxes paid . . . . . . . . . . . . . . . . . . . . . . . . . . . . . . . . . . . . . . . . . . . . . . (1,597) (1,511)Net cash provided by operating activities. . . . . . . . . . . . . . . . . . . . . . . . . . . . . . . . 20 9,276 8,018
Cash flows from investing activitiesPayments for:- property, plant and equipment . . . . . . . . . . . . . . . . . . . . . . . . . . . . . . . . . . . . . . . (3,006) (2,342)- intangible assets . . . . . . . . . . . . . . . . . . . . . . . . . . . . . . . . . . . . . . . . . . . . . . (942) (909)Capital expenditure (before investments) . . . . . . . . . . . . . . . . . . . . . . . . . . . . . . . . . . (3,948) (3,251)- shares in controlled entities (net of cash acquired) . . . . . . . . . . . . . . . . . . . . . . . . . . . . . - (36)- payments for associates . . . . . . . . . . . . . . . . . . . . . . . . . . . . . . . . . . . . . . . . . . (9) -- payments for other investments . . . . . . . . . . . . . . . . . . . . . . . . . . . . . . . . . . . . . . (18) -Total capital expenditure . . . . . . . . . . . . . . . . . . . . . . . . . . . . . . . . . . . . . . . . . . . (3,975) (3,287)Proceeds from:- sale of property, plant and equipment . . . . . . . . . . . . . . . . . . . . . . . . . . . . . . . . . . . 17 16- sale of intangible assets . . . . . . . . . . . . . . . . . . . . . . . . . . . . . . . . . . . . . . . . . . 2 -- sale of shares in controlled entities (net of cash disposed) . . . . . . . . . . . . . . . . . . . . . . . . . (9) 288- sale of businesses (net of cash disposed) . . . . . . . . . . . . . . . . . . . . . . . . . . . . . . . . . (2) 14- sale of associates . . . . . . . . . . . . . . . . . . . . . . . . . . . . . . . . . . . . . . . . . . . . . . - 23Proceeds from finance lease principal amounts . . . . . . . . . . . . . . . . . . . . . . . . . . . . . . . 54 74Repayment of loans to jointly controlled and associated entities . . . . . . . . . . . . . . . . . . . . . . 3 2Loans to jointly controlled and associated entities . . . . . . . . . . . . . . . . . . . . . . . . . . . . . . (443) -Interest received . . . . . . . . . . . . . . . . . . . . . . . . . . . . . . . . . . . . . . . . . . . . . . . 117 122Settlement of hedges in net investments. . . . . . . . . . . . . . . . . . . . . . . . . . . . . . . . . . . 49 96Dividends received . . . . . . . . . . . . . . . . . . . . . . . . . . . . . . . . . . . . . . . . . . . . . . - 41Distributions received from FOXTEL Partnership . . . . . . . . . . . . . . . . . . . . . . . . . . . . . 6 108 70Net cash used in investing activities . . . . . . . . . . . . . . . . . . . . . . . . . . . . . . . . . . . (4,079) (2,541)Operating cash flows less investing cash flows . . . . . . . . . . . . . . . . . . . . . . . . . . . . . 5,197 5,477
Cash flows from financing activitiesProceeds from borrowings . . . . . . . . . . . . . . . . . . . . . . . . . . . . . . . . . . . . . . . . . . 3,049 2,340Repayment of borrowings . . . . . . . . . . . . . . . . . . . . . . . . . . . . . . . . . . . . . . . . . . (2,224) (2,536)Repayment of finance lease principal amounts . . . . . . . . . . . . . . . . . . . . . . . . . . . . . . . (52) (61)Staff repayments of share loans . . . . . . . . . . . . . . . . . . . . . . . . . . . . . . . . . . . . . . . 3 8Finance costs paid . . . . . . . . . . . . . . . . . . . . . . . . . . . . . . . . . . . . . . . . . . . . . . (1,154) (1,135)Acquisition of non-controlling interests . . . . . . . . . . . . . . . . . . . . . . . . . . . . . . . . . . . . (37) -Dividends paid to equity holders of Telstra Entity . . . . . . . . . . . . . . . . . . . . . . . . . . . . . 4 (3,475) (3,475)Dividends paid to non-controlling interests . . . . . . . . . . . . . . . . . . . . . . . . . . . . . . . . . . (16) (14)Net cash used in financing activities . . . . . . . . . . . . . . . . . . . . . . . . . . . . . . . . . . . (3,906) (4,873)
Net increase in cash and cash equivalents . . . . . . . . . . . . . . . . . . . . . . . . . . . . . . . . 1,291 604Cash and cash equivalents at the beginning of the year . . . . . . . . . . . . . . . . . . . . . . . . . . . 2,637 2,105Effects of exchange rate changes on cash and cash equivalents . . . . . . . . . . . . . . . . . . . . . . 17 (72)Cash and cash equivalents at the end of the year . . . . . . . . . . . . . . . . . . . . . . . . . . . 20 3,945 2,637
For
per
sona
l use
onl
y

Telstra Corporation Limited and controlled entities
76
(a) The foreign currency translation reserve is used to record exchange differences arising from the conversion of the non-Australian controlled entities’ financial statements into Australian dollars. This reserve is also used to record our percentage share of exchange differences arising from equity accounting our non-Australian investments in jointly controlled and associated entities.
(b) The cash flow hedging reserve represents the effective portion of gains or losses on remeasuring the fair value of a hedge instrument, where the hedge qualifies for hedge accounting. These gains or losses are transferred to the income statement when the hedged item affects income, or in the case of forecast transactions, are included in the measurement of the initial cost of property, plant and equipment or inventory.
(c) The consolidation fair value reserve represents our share of the fair value adjustments to TelstraClear Limited’s net assets upon acquisition of a controlling interest. The reserve balance is amortised over the useful life of the underlying revalued assets.
(d) The general reserve represents other items we have taken directly to equity.
Statement of Changes in Equityfor the year ended 30 June 2012
Telstra GroupReserves
Foreigncurrency Consolid- Non-transla- Cash flow ation General controll-
Share tion hedging fair value reserve Retained ing Totalcapital (a) (b) (c) (d) profits Total interests Equity
$m $m $m $m $m $m $m $m $m
Balance at 1 July 2010 . 5,590 (482) 157 9 4 7,418 12,696 312 13,008Profit for the year . . . . . - - - - - 3,231 3,231 19 3,250Other comprehensive income - (355) (171) - - 128 (398) (48) (446)Total comprehensive incomefor the year . . . . . . . . - (355) (171) - - 3,359 2,833 (29) 2,804Dividends. . . . . . . . . - - - - - (3,475) (3,475) (14) (3,489)Non-controlling interests on disposals . . . . . . . . . - - - - - - - (51) (51)Transfers to retained profits - - - (5) - 5 - - -Amounts repaid on share loans provided to employees 8 - - - - - 8 - 8Share based payments. . 12 - - - - - 12 - 12Balance at 30 June 2011 5,610 (837) (14) 4 4 7,307 12,074 218 12,292
Profit for the year . . . . . - - - - - 3,405 3,405 19 3,424Other comprehensive income - 86 (73) - - (530) (517) 8 (509)Total comprehensive incomefor the year . . . . . . . . - 86 (73) - - 2,875 2,888 27 2,915Dividends. . . . . . . . . - - - - - (3,475) (3,475) (16) (3,491)Transactions with non-controlling interests. . . . - - - - (32) - (32) (5) (37)Non-controlling interests on disposals . . . . . . . . . - - - - - - - (24) (24)Transfers to retained profits - - - (4) (1) 5 - - -Amounts repaid on share loans provided to employees 3 - - - - - 3 - 3Share based payments. . 22 - - - - - 22 9 31Balance at 30 June 2012 5,635 (751) (87) - (29) 6,712 11,480 209 11,689
For
per
sona
l use
onl
y

Telstra Corporation Limited and controlled entities
77
Notes to the Financial Statements
In this financial report, we, us, our, Telstra and the Telstra Group - all mean Telstra Corporation Limited, an Australian corporation and its controlled entities as a whole. Telstra Entity is the legal entity, Telstra Corporation Limited. Telstra Entity is a company limited by shares incorporated in Australia whose shares are publicly traded on the Australian Stock Exchange.
Our financial or fiscal year ends on 30 June. Unless we state differently the following applies:
• year, fiscal year or financial year means the year ended 30 June;• reporting date means the date 30 June; and• 2012 means fiscal 2012 and similarly for other fiscal years.
The financial report of the Telstra Group for the year ended 30 June 2012 was authorised for issue in accordance with a resolution of the Telstra Board of Directors on 9 August 2012.
The principal accounting policies used in preparing the financial report of the Telstra Group are set out in note 2 to our financial statements.
1.1 Basis of preparation of the financial report
This financial report is a general purpose financial report, prepared by a for-profit entity, in accordance with the requirements of the Australian Corporations Act 2001, Accounting Standards applicable in Australia and other authoritative pronouncements of the Australian Accounting Standards Board. This financial report also complies with International Financial Reporting Standards and Interpretations published by the International Accounting Standards Board.
Both the functional and presentation currency of the Telstra Entity and its Australian controlled entities is Australian dollars. The functional currency of certain non Australian controlled entities is not Australian dollars. As a result, the results of these entities are translated to Australian dollars for presentation in the Telstra Group financial report.
This financial report is prepared in accordance with historical cost, except for some categories of investments and some financial instruments which are recorded at fair value. Cost is the fair value of the consideration given in exchange for net assets acquired.
In preparing this financial report, we are required to make judgements and estimates that impact:
• income and expenses for the year;• the reported amounts of assets and liabilities; and• the disclosure of off balance sheet arrangements, including
contingent assets and contingent liabilities.
We continually evaluate our judgements and estimates. We base our judgements and estimates on historical experience, various other assumptions we believe to be reasonable under the circumstances and, where appropriate, practices adopted by international telecommunications companies. Actual results may differ from our estimates.
1.2 Clarification of terminology used in our income statement
Under the requirements of AASB 101: “Presentation of Financial Statements”, we must classify all of our expenses (apart from any finance costs and our share of net profit/loss from jointly controlled and associated entities) according to either the nature (type) of the expense or the function (activity to which the expense relates). We have chosen to classify our expenses using the nature classification as it more accurately reflects the type of operations we undertake.
Earnings before interest, income tax expense, depreciation and amortisation (EBITDA) reflects our profit for the year prior to including the effect of net finance costs, income taxes, depreciation and amortisation. Depreciation and amortisation are calculated in accordance with AASB 116: “Property, Plant and Equipment” and AASB 138: “Intangible Assets” respectively. We believe that EBITDA is a relevant and useful financial measure used by management to measure the company’s operating performance.
Our management uses EBITDA and earnings before interest and income tax expense (EBIT), in combination with other financial measures, primarily to evaluate the company’s operating performance before financing costs, income tax and non-cash capital related expenses.
In consideration of the capital intensive nature of our business, EBITDA is a useful supplement to net profit in understanding cash flows generated from operations that are available for payment of income taxes, debt servicing and capital expenditure. In addition, we believe EBITDA is useful to investors because analysts and other members of the investment community largely view EBITDA as a key and widely recognised measure of operating performance.
EBIT is a similar measure to EBITDA, but takes into account the effect of depreciation and amortisation.
1.3 Rounding
All dollar amounts in this financial report (except where indicated) have been rounded to the nearest million dollars ($m) for presentation. This has been done in accordance with Australian Securities and Investments Commission (ASIC) Class Order 98/100, dated 10 July 1998, issued under section 341(1) of the Corporations Act 2001. Telstra is an entity to which this class order applies.
1. Basis of preparation
For
per
sona
l use
onl
y
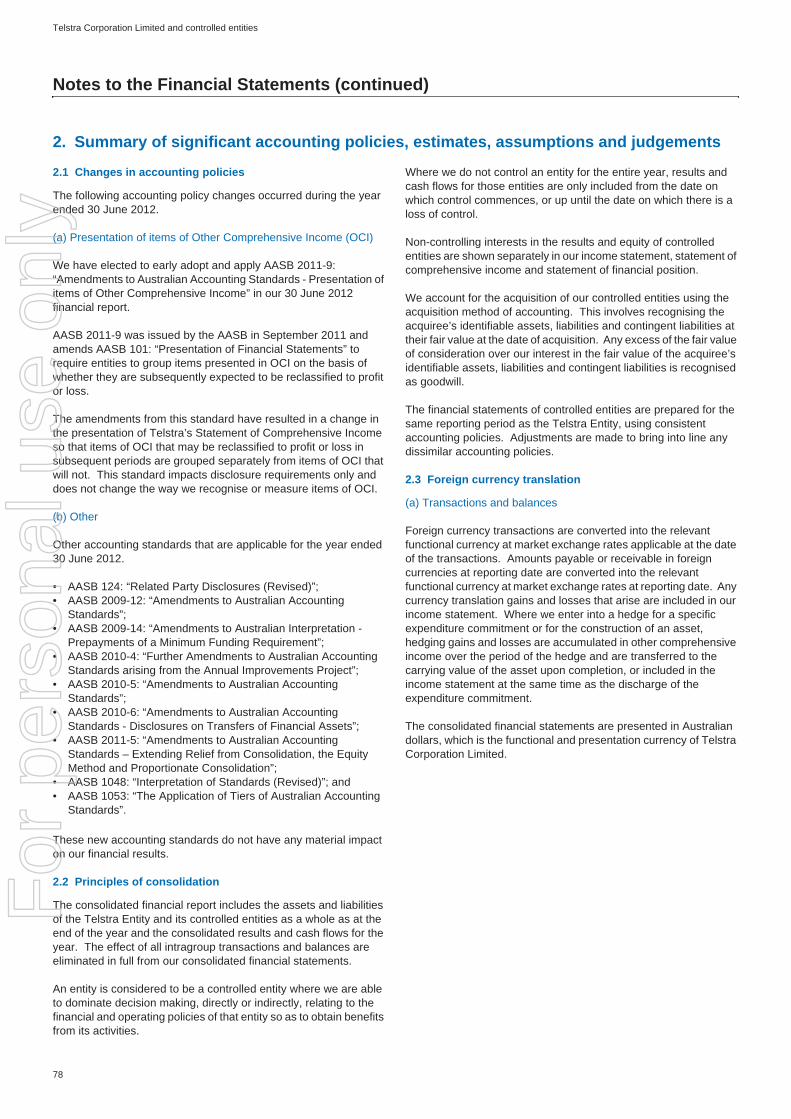
Telstra Corporation Limited and controlled entities
78
Notes to the Financial Statements (continued)
2.1 Changes in accounting policies
The following accounting policy changes occurred during the year ended 30 June 2012.
(a) Presentation of items of Other Comprehensive Income (OCI)
We have elected to early adopt and apply AASB 2011-9: “Amendments to Australian Accounting Standards - Presentation of items of Other Comprehensive Income” in our 30 June 2012 financial report.
AASB 2011-9 was issued by the AASB in September 2011 and amends AASB 101: “Presentation of Financial Statements” to require entities to group items presented in OCI on the basis of whether they are subsequently expected to be reclassified to profit or loss.
The amendments from this standard have resulted in a change in the presentation of Telstra’s Statement of Comprehensive Income so that items of OCI that may be reclassified to profit or loss in subsequent periods are grouped separately from items of OCI that will not. This standard impacts disclosure requirements only and does not change the way we recognise or measure items of OCI.
(b) Other
Other accounting standards that are applicable for the year ended 30 June 2012.
• AASB 124: “Related Party Disclosures (Revised)”;• AASB 2009-12: “Amendments to Australian Accounting
Standards”;• AASB 2009-14: “Amendments to Australian Interpretation -
Prepayments of a Minimum Funding Requirement”;• AASB 2010-4: “Further Amendments to Australian Accounting
Standards arising from the Annual Improvements Project”;• AASB 2010-5: “Amendments to Australian Accounting
Standards”;• AASB 2010-6: “Amendments to Australian Accounting
Standards - Disclosures on Transfers of Financial Assets”;• AASB 2011-5: “Amendments to Australian Accounting
Standards – Extending Relief from Consolidation, the Equity Method and Proportionate Consolidation”;
• AASB 1048: “Interpretation of Standards (Revised)”; and• AASB 1053: “The Application of Tiers of Australian Accounting
Standards”.
These new accounting standards do not have any material impact on our financial results.
2.2 Principles of consolidation
The consolidated financial report includes the assets and liabilities of the Telstra Entity and its controlled entities as a whole as at the end of the year and the consolidated results and cash flows for the year. The effect of all intragroup transactions and balances are eliminated in full from our consolidated financial statements.
An entity is considered to be a controlled entity where we are able to dominate decision making, directly or indirectly, relating to the financial and operating policies of that entity so as to obtain benefits from its activities.
Where we do not control an entity for the entire year, results and cash flows for those entities are only included from the date on which control commences, or up until the date on which there is a loss of control.
Non-controlling interests in the results and equity of controlled entities are shown separately in our income statement, statement of comprehensive income and statement of financial position.
We account for the acquisition of our controlled entities using the acquisition method of accounting. This involves recognising the acquiree’s identifiable assets, liabilities and contingent liabilities at their fair value at the date of acquisition. Any excess of the fair value of consideration over our interest in the fair value of the acquiree’s identifiable assets, liabilities and contingent liabilities is recognised as goodwill.
The financial statements of controlled entities are prepared for the same reporting period as the Telstra Entity, using consistent accounting policies. Adjustments are made to bring into line any dissimilar accounting policies.
2.3 Foreign currency translation
(a) Transactions and balances
Foreign currency transactions are converted into the relevant functional currency at market exchange rates applicable at the date of the transactions. Amounts payable or receivable in foreign currencies at reporting date are converted into the relevant functional currency at market exchange rates at reporting date. Any currency translation gains and losses that arise are included in our income statement. Where we enter into a hedge for a specific expenditure commitment or for the construction of an asset, hedging gains and losses are accumulated in other comprehensive income over the period of the hedge and are transferred to the carrying value of the asset upon completion, or included in the income statement at the same time as the discharge of the expenditure commitment.
The consolidated financial statements are presented in Australian dollars, which is the functional and presentation currency of Telstra Corporation Limited.
2. Summary of significant accounting policies, estimates, assumptions and judgements
For
per
sona
l use
onl
y

Telstra Corporation Limited and controlled entities
79
Notes to the Financial Statements (continued)
2.3 Foreign currency translation (continued)
(b) Financial reports of foreign operations that have a functional currency that is not Australian dollars
Our operations include subsidiaries, associates, and jointly controlled entities, the activities and operations of which are in an economic environment where the functional currency is not Australian dollars. The financial statements of these entities are translated to Australian dollars (our presentation currency) using the following method:
• assets and liabilities are translated into Australian dollars using market exchange rates at reporting date;
• equity at the date of investment is translated into Australian dollars at the exchange rate current at that date. Movements post-acquisition (other than retained profits/accumulated losses) are translated at the exchange rates current at the dates of those movements;
• income statements are translated into Australian dollars at average exchange rates for the year, unless there are significant identifiable transactions, which are translated at the exchange rate that existed on the date of the transaction; and
• currency translation gains and losses are recorded in other comprehensive income.
Refer to note 18 for details regarding our accounting policy for derivative financial instruments and foreign currency monetary items that are used to hedge our net investment in entities which have a functional currency that is not in Australian dollars.
2.4 Cash and cash equivalents
Cash and cash equivalents include cash at bank and on hand, bank deposits, bills of exchange and promissory notes that are held for the purposes of meeting short term cash commitments rather than investment purposes.
Bank deposits are recorded at amounts to be received. Bills of exchange and promissory notes are classified as ‘available-for-sale’ financial assets and are held at fair value. The carrying amount of these assets approximates their fair value due to the short term to maturity.
2.5 Trade and other receivables
Trade and other receivables are considered financial assets. They are initially recorded at the fair value of the amounts to be received and are subsequently measured at amortised cost using the effective interest method. These financial assets are derecognised when the rights to receive cash flows from the financial assets have expired or have been transferred and we have transferred substantially all the risks and rewards of ownership.
An allowance for doubtful debts is raised to reduce the carrying amount of trade receivables, based on a review of outstanding amounts at reporting date. The allowance for doubtful debts is based on historical trends and management's assessment of general economic conditions. An allowance for doubtful debts is raised when management considers there is a credit risk, insolvency risk or incapacity to pay a legally recoverable debt. Bad debts specifically provided for in previous years are eliminated against the allowance for doubtful debts. In all other cases, bad debts are eliminated directly against the carrying amount and written off as an expense in the income statement.
2.6 Inventories
Our finished goods include goods available for sale, and material and spare parts to be used in constructing and maintaining the telecommunications network. We value inventories at the lower of cost and net realisable value.
For the majority of inventory items, we assign cost using the weighted average cost basis. For materials used in the production of directories the ‘first in first out’ basis is used for assigning cost.
Net realisable value of items expected to be sold is the estimated selling price in the ordinary course of business, less estimated costs of completion and the estimated costs incurred in marketing, selling and distribution. It approximates fair value less costs to sell. We calculate net realisable value of inventories by making certain price assumptions to project selling prices into the future and assumptions about technologies at reporting date.
Net realisable value of items expected to be consumed, for example used in the construction of another asset, is the net value expected to be earned through future use.
2.7 Construction contracts
(a) Valuation
We record construction contracts in progress at cost (including any profits recognised) less progress billings and any provision for foreseeable losses. Cost includes:
• both variable and fixed costs directly related to specific contracts;• amounts which are attributable to contract activity in general and
which can be allocated to specific contracts on a reasonable basis; and
• costs expected to be incurred under penalty clauses, warranty provisions and other variances.
Where a significant loss is estimated to be made on completion, a provision for foreseeable losses is brought to account and recorded against the gross amount of construction work in progress.
2. Summary of significant accounting policies, estimates, assumptions and judgements (continued)
For
per
sona
l use
onl
y

Telstra Corporation Limited and controlled entities
80
Notes to the Financial Statements (continued)
2.7 Construction contracts (continued)
(b) Recognition of revenue and profit
Revenue and profit is recognised on an individual project basis using the percentage of completion method. The percentage of completion is calculated based on estimated costs of completion. Refer to note 2.17(d) for further details.
Profits are recognised when:
• the stage of contract completion can be reliably determined;• costs to date can be clearly identified; and• total contract revenues to be received and costs to complete can
be reliably estimated.
(c) Disclosure
The construction work in progress balance is recorded in current inventories after deducting progress billings. Where progress billings exceed the balance of construction work in progress, the net amount is shown as a current liability within trade and other payables.
2.8 Investments
(a) Jointly controlled and associated entities
(i) Jointly controlled entities
A jointly controlled entity is a contractual arrangement (in the form of an entity) whereby two or more parties take on an economic activity which is governed by joint control. Joint control involves the contractually agreed sharing of control over an entity where two or more parties must consent to all major decisions. Our interests in jointly controlled entities, including partnerships, are accounted for using the equity method of accounting in the Telstra Group financial statements.
Under the equity method of accounting, we adjust the initial recorded amount of the investment for our share of:
• profits or losses after tax for the year since the date of investment;
• reserve movements since the date of investment;• unrealised profits or losses;• dividends or distributions received; and• deferred profit brought to account.
Where the equity accounted amount of our investment in an entity falls below zero, we suspend the equity method of accounting and record the investment at zero. When this occurs, the equity method of accounting does not recommence until our share of profits and reserves exceeds the cumulative prior years’ share of losses and reserve reductions.
Where we have long term assets that in substance form part of our investment in equity accounted interests and the equity accounted amount of the investment falls below zero, we reduce the value of these long term assets in proportion with our cumulative losses.
(ii) Associated entities
Where we hold an interest in the equity of an entity, generally of between 20% and 50%, and are able to significantly influence the decisions of the entity, that entity is an associated entity. Associated entities are accounted for using the equity method of accounting in the Telstra Group financial statements.
(b) Jointly controlled assets
A jointly controlled asset involves the joint control of one or more assets acquired and dedicated for the purpose of a joint venture. The assets are used to obtain benefits for the venturers. Where the asset is significant we record our share of the asset. We record income and expenses based on our percentage ownership interest of the jointly controlled asset.
(c) Listed securities and investments in other corporations
Our investments in listed securities and in other corporations are classified as ‘available-for-sale’ financial assets and are measured at fair value at each reporting date. Fair values are calculated on the following basis:
• for listed securities traded in an organised financial market, we use the current quoted market bid price at reporting date; and
• for investments in unlisted entities whose securities are not traded in an organised financial market, we establish fair value by using valuation techniques, including reference to discounted cash flows and fair values of recent arms length transactions involving instruments that are substantially the same.
We remeasure the fair value of our investments in listed securities and other corporations at each reporting date. Any gains or losses are recognised in other comprehensive income until we dispose of the investment, or we determine it to be impaired, at which time we transfer all cumulative gains and losses to the income statement. Purchases and sales of investments are recognised on settlement date, being the date on which we receive or deliver an asset.
2.9 Impairment
(a) Non-financial assets
Our tangible and intangible assets (excluding inventories, assets arising from construction contracts, current and deferred tax assets, defined benefit assets and financial assets) are measured using the cost basis and are written down to recoverable amount where their carrying value exceeds recoverable amount.
Assets with an indefinite useful life are not subject to amortisation and are tested on an annual basis for impairment, or where an indication of impairment exists. Assets that are subject to amortisation are reviewed for impairment wherever events or changes in circumstances indicate that the carrying amount may not be recoverable.
2. Summary of significant accounting policies, estimates, assumptions and judgements (continued)
For
per
sona
l use
onl
y

Telstra Corporation Limited and controlled entities
81
Notes to the Financial Statements (continued)
2.9 Impairment (continued)
(a) Non-financial assets (continued)
The recoverable amount of an asset is the higher of its fair value less costs to sell or its value in use. Value in use represents the present value of the future amount expected to be recovered through the cash inflows and outflows arising from the asset’s continued use and subsequent disposal. We recognise any reduction in the carrying value as an expense in the income statement in the reporting period in which the impairment loss occurs.
In determining value in use, we apply management judgement in establishing forecasts of future operating performance, as well as the selection of growth rates, terminal rates and discount rates. These judgements are applied based on our understanding of historical information and expectations of future performance.
The expected net cash flows included in determining recoverable amounts of our assets are discounted to present values using a market determined, risk adjusted, discount rate. When determining an appropriate discount rate, we use the weighted average cost of capital (WACC) as an initial point of reference, adjusted for specific risks associated with each different category of assets assessed.
For assets that do not generate largely independent cash inflows, the recoverable amount is determined for the cash generating unit (CGU) to which that asset belongs. In addition, when goodwill is allocated to a CGU, the unit cannot be larger than an operating segment. Our CGUs are determined according to the lowest level of aggregation for which an active market exists and the assets involved generate largely independent cash inflows.
We apply management judgement to establish our CGUs. We have determined that assets which form part of our ubiquitous telecommunications network work together to generate net cash inflows. No one item of telecommunications equipment is of any value without the other assets to which it is connected in order to achieve the delivery of products and services. As a result, we have determined that the ubiquitous telecommunications network is a single CGU. We have referred to this CGU as the Telstra Entity CGU in our financial report.
The Telstra Entity CGU excludes the hybrid fibre coaxial (HFC) cable network, which we consider not to be integrated with the rest of our telecommunications network. Refer to note 21 for further details.
(b) Financial assets
At each reporting date we assess whether there is objective evidence to suggest that any of our financial assets are impaired.
For listed securities and investments in other corporations, we consider the financial asset to be impaired when there has been a significant or prolonged decline in the fair value of the financial asset below its acquisition cost. At this time, all revaluation losses in relation to impaired financial assets that have been accumulated within other comprehensive income are recognised in the income statement.
For financial assets held at cost or amortised cost, we consider the financial asset to be impaired when there is objective evidence as a result of one or more events that the present value of estimated discounted future cash flows is lower than the carrying value. Any impairment losses are recognised immediately in the income statement.
2.10 Property, plant and equipment
(a) Acquisition
Items of property, plant and equipment are recorded at cost and depreciated as described in note 2.10(b). The cost of our constructed property, plant and equipment is directly attributable in bringing the asset to the location and condition necessary for its intended use and includes:
• the cost of material and direct labour;• an appropriate proportion of direct and indirect overheads; and• where we have an obligation for removal of the asset or
restoration of the site, an estimate of the cost of restoration or removal if that cost can be reliably estimated.
Management judgement is required in the assessment of the types of costs that are directly attributable to the construction of our property, plant and equipment. Satisfying the directly attributable criteria requires an assessment of those unavoidable costs that, if not incurred, would result in the property, plant and equipment not being constructed. We capitalise borrowing costs that are directly attributable to the acquisition, construction or production of a qualifying asset.
We review our property, plant and equipment assets and property, plant and equipment under construction on a regular basis to ensure that the assets are still in use and that the projects are still expected to be completed. Refer to note 7 for details of impairment losses recognised on our property, plant and equipment.
Where settlement of any part of the cash consideration is deferred, the amounts payable in the future are discounted to their present value as at the date of acquisition. The unwinding of this discount is recorded within finance costs.
We account for our assets individually where it is practical, feasible and in line with commercial practice. Where it is not practical and feasible, we account for assets in groups. Group assets are automatically removed from our financial statements on reaching the group life. Therefore, any individual asset may be physically retired before or after the group life is attained. This is the case for certain communication assets as we assess our technologies to be replaced by a certain date.
2. Summary of significant accounting policies, estimates, assumptions and judgements (continued)
For
per
sona
l use
onl
y

Telstra Corporation Limited and controlled entities
82
Notes to the Financial Statements (continued)
2.10 Property, plant and equipment (continued)
(b) Depreciation
Items of property, plant and equipment, including buildings and leasehold property, but excluding freehold land, are depreciated on a straight line basis to the income statement over their estimated service lives. We start depreciating assets when they are installed and ready for use. The service lives of our significant items of property, plant and equipment are as follows:
The service lives and residual values of our assets are reviewed each year. We apply management judgement in determining the service lives of our assets. This assessment includes a comparison with international trends for telecommunications companies and, in relation to communication assets, includes a determination of when the asset may be superseded technologically or made obsolete.
Based on our assessments at 30 June 2011 and the fact that no significant changes have occurred since then, there are no measurement implications on service lives resulting from the National Broadband Network (NBN) transaction for the year ended 30 June 2012. Our assessment continues to show that the weighted average remaining service life (WARSL) for the existing network assets impacted by the disconnection obligations that will apply under the Definitive Agreements, falls within the anticipated rollout period of 10 years. As such, we have concluded that no further adjustments for fiscal 2012 are required, in addition to the annual service life reassessment, the results of which are noted below. Refer to note 21 for further discussion on the NBN.
The net effect of the reassessment of service lives for fiscal 2012 was a decrease in our depreciation expense of $248 million (2011: $79 million increase) for the Telstra Group.
Our major repairs and maintenance expenses relate to maintaining our exchange equipment and the customer access network. We charge the cost of repairs and maintenance, including the cost of replacing minor items which are not substantial improvements, to operating expenses.
2.11 Leased plant and equipment
We distinguish between finance leases, which effectively transfer substantially all the risks and benefits incidental to ownership of the leased asset from the lessor to the lessee, from operating leases under which the lessor effectively retains substantially all such risks and benefits.
(a) Telstra as a lessee
Where we acquire non current assets via a finance lease, the lower of the fair value of the asset and the present value of future minimum lease payments is capitalised as equipment under finance leases at the beginning of the lease term. Capitalised lease assets are depreciated on a straight line basis over the shorter of the lease term or the expected useful life of the assets. A corresponding liability is also established and each lease payment is allocated between the liability and finance charges.
Operating lease payments are charged to the income statement on a straight line basis over the term of the lease.
Where we lease properties, costs of improvements to these properties are capitalised as leasehold improvements and amortised over the shorter of the useful life of the improvements or the term of the lease.
2. Summary of significant accounting policies, estimates, assumptions and judgements (continued)
Telstra GroupAs at 30 June
2012 2011
Property, plant and equipmentService life
(years)Service life
(years)
BuildingsBuildings . . . . . . . . . . . . . . 52 - 53 52 - 53Fitouts . . . . . . . . . . . . . . . 10 - 20 10 - 20Leasehold improvements. . . . . . 4 - 40 5 - 40
Communication assetsNetwork land and buildings. . . . . 10 - 58 10 - 58Network support infrastructure . . . 3 - 52 3 - 52Access fixed . . . . . . . . . . . . 4 - 30 3 - 30Access mobile . . . . . . . . . . . 3 - 16 3 - 17Content/IP products - core . . . . . 4 - 10 4 - 10Core network - data . . . . . . . . 3 - 10 3 - 8Core network - switch . . . . . . . 2 - 26 2 - 25Core network - transport . . . . . . 5 - 30 5 - 30Specialised premise equipment . . 3 - 8 3 - 8International connect . . . . . . . . 11 - 21 11 - 21Managed service . . . . . . . . . . 4 - 13 3 - 12Network control layer . . . . . . . . 2 - 13 2 - 13Network product . . . . . . . . . . 2 - 9 2 - 9
Other plant and equipmentIT equipment . . . . . . . . . . . . 3 - 5 3 - 5Motor vehicles/trailer/caravan/huts . 5 - 15 5 - 15Other plant and equipment . . . . . 3 - 20 2 - 20
For
per
sona
l use
onl
y

Telstra Corporation Limited and controlled entities
83
Notes to the Financial Statements (continued)
2.11 Leased plant and equipment (continued)
(b) Telstra as a lessor
Where we lease non current assets via a finance lease, a lease receivable equal to the present value of the minimum lease payments receivable plus the present value of any unguaranteed residual value expected to accrue at the end of the lease term is recognised at the beginning of the lease term. Finance lease receipts are allocated between finance income and a reduction of the lease receivable over the term of the lease in order to reflect a constant periodic rate of return on the net investment outstanding in respect of the lease.
Rental income from operating leases is recognised on a straight line basis over the term of the relevant lease.
2.12 Intangible assets
Intangible assets are assets that have value, but do not have physical substance. In order to be recognised, an intangible asset must be either separable or arise from contractual or other legal rights.
(a) Goodwill
On the acquisition of investments in controlled entities, jointly controlled and associated entities, when we pay an amount greater than the fair value of the net identifiable assets of the entity, this excess is considered to be goodwill. We calculate the amount of goodwill as at the date of purchasing our ownership interest in the entity.
When we purchase an entity that we will control, the amount of goodwill is recorded in intangible assets. When we acquire a jointly controlled or associated entity, the goodwill amount is included as part of the cost of the investment.
Goodwill is not amortised but is tested for impairment in accordance with note 2.9 on an annual basis, or when an indication of impairment exists.
(b) Internally generated intangible assets
Research costs are recorded as an expense as incurred.
Management judgement is required to determine whether to capitalise development costs. Development costs are capitalised if the project is technically and commercially feasible, we are able to use or sell the asset, and we have sufficient resources and intent to complete the development.
Software assets
We record direct costs associated with the development of business software for internal use as software assets if the development costs satisfy the criteria for capitalisation described above.
Costs included in software assets developed for internal use are:
• external direct costs of materials and services consumed; and• payroll and direct payroll-related costs for employees (including
contractors) directly associated with the project.
We capitalise borrowing costs that are directly attributable to the acquisition, construction or production of a qualifying asset.
We review our software assets and software assets under development on a regular basis to ensure the assets are still in use and projects are still expected to be completed. Refer to note 7 for details of impairment losses recognised on our intangible assets.
Software assets developed for internal use have a finite life and are amortised on a straight line basis over their useful lives to us. Amortisation commences once the software is ready for use.
(c) Acquired intangible assets
We acquire other intangible assets either as part of a business combination or through separate acquisition. Intangible assets acquired in a business combination are recorded at their fair value at the date of acquisition and recognised separately from goodwill. We apply management judgement to determine the appropriate fair value of identifiable intangible assets.
Intangible assets that are considered to have a finite life are amortised on a straight line basis over the period of expected benefit. Intangible assets that are considered to have an indefinite life are not amortised but tested for impairment in accordance with note 2.9 on an annual basis, or where an indication of impairment exists.
(d) Deferred expenditure
Deferred expenditure mainly includes costs incurred for basic access installation and connection fees for in place and new services, and direct incremental costs of establishing a customer contract.
Significant items of expenditure are deferred to the extent that they are recoverable from future revenue and will contribute to our future earning capacity. Any costs in excess of future revenue are recognised immediately in the income statement. Handset subsidies are considered to be separate units of accounting and expensed as incurred.
We amortise deferred expenditure over the average period in which the related benefits are expected to be realised.
2. Summary of significant accounting policies, estimates, assumptions and judgements (continued)
For
per
sona
l use
onl
y
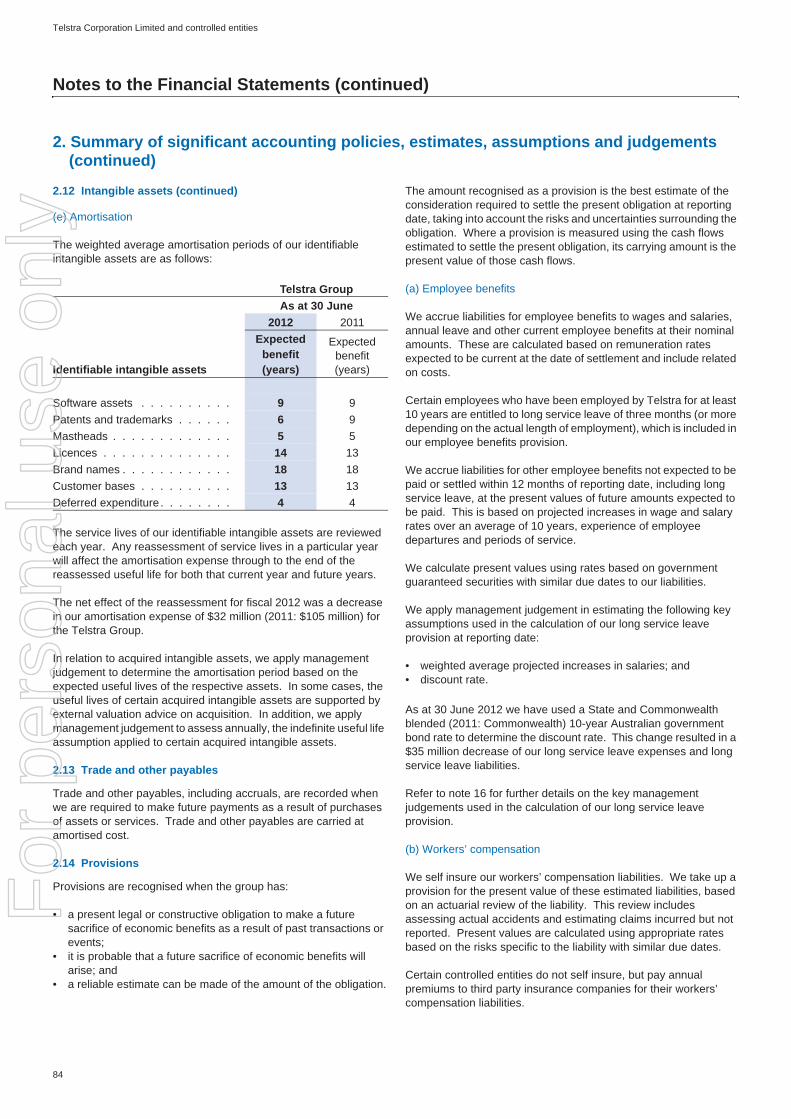
Telstra Corporation Limited and controlled entities
84
Notes to the Financial Statements (continued)
2.12 Intangible assets (continued)
(e) Amortisation
The weighted average amortisation periods of our identifiable intangible assets are as follows:
The service lives of our identifiable intangible assets are reviewed each year. Any reassessment of service lives in a particular year will affect the amortisation expense through to the end of the reassessed useful life for both that current year and future years.
The net effect of the reassessment for fiscal 2012 was a decrease in our amortisation expense of $32 million (2011: $105 million) for the Telstra Group.
In relation to acquired intangible assets, we apply management judgement to determine the amortisation period based on the expected useful lives of the respective assets. In some cases, the useful lives of certain acquired intangible assets are supported by external valuation advice on acquisition. In addition, we apply management judgement to assess annually, the indefinite useful life assumption applied to certain acquired intangible assets.
2.13 Trade and other payables
Trade and other payables, including accruals, are recorded when we are required to make future payments as a result of purchases of assets or services. Trade and other payables are carried at amortised cost.
2.14 Provisions
Provisions are recognised when the group has:
• a present legal or constructive obligation to make a future sacrifice of economic benefits as a result of past transactions or events;
• it is probable that a future sacrifice of economic benefits will arise; and
• a reliable estimate can be made of the amount of the obligation.
The amount recognised as a provision is the best estimate of the consideration required to settle the present obligation at reporting date, taking into account the risks and uncertainties surrounding the obligation. Where a provision is measured using the cash flows estimated to settle the present obligation, its carrying amount is the present value of those cash flows.
(a) Employee benefits
We accrue liabilities for employee benefits to wages and salaries, annual leave and other current employee benefits at their nominal amounts. These are calculated based on remuneration rates expected to be current at the date of settlement and include related on costs.
Certain employees who have been employed by Telstra for at least 10 years are entitled to long service leave of three months (or more depending on the actual length of employment), which is included in our employee benefits provision.
We accrue liabilities for other employee benefits not expected to be paid or settled within 12 months of reporting date, including long service leave, at the present values of future amounts expected to be paid. This is based on projected increases in wage and salary rates over an average of 10 years, experience of employee departures and periods of service.
We calculate present values using rates based on government guaranteed securities with similar due dates to our liabilities.
We apply management judgement in estimating the following key assumptions used in the calculation of our long service leave provision at reporting date:
• weighted average projected increases in salaries; and• discount rate.
As at 30 June 2012 we have used a State and Commonwealth blended (2011: Commonwealth) 10-year Australian government bond rate to determine the discount rate. This change resulted in a $35 million decrease of our long service leave expenses and long service leave liabilities.
Refer to note 16 for further details on the key management judgements used in the calculation of our long service leave provision.
(b) Workers’ compensation
We self insure our workers’ compensation liabilities. We take up a provision for the present value of these estimated liabilities, based on an actuarial review of the liability. This review includes assessing actual accidents and estimating claims incurred but not reported. Present values are calculated using appropriate rates based on the risks specific to the liability with similar due dates.
Certain controlled entities do not self insure, but pay annual premiums to third party insurance companies for their workers’ compensation liabilities.
2. Summary of significant accounting policies, estimates, assumptions and judgements (continued)
Telstra GroupAs at 30 June
2012 2011
Identifiable intangible assets
Expected benefit(years)
Expected benefit(years)
Software assets . . . . . . . . . . 9 9Patents and trademarks . . . . . . 6 9Mastheads . . . . . . . . . . . . . 5 5Licences . . . . . . . . . . . . . . 14 13Brand names . . . . . . . . . . . . 18 18Customer bases . . . . . . . . . . 13 13Deferred expenditure . . . . . . . . 4 4
For
per
sona
l use
onl
y
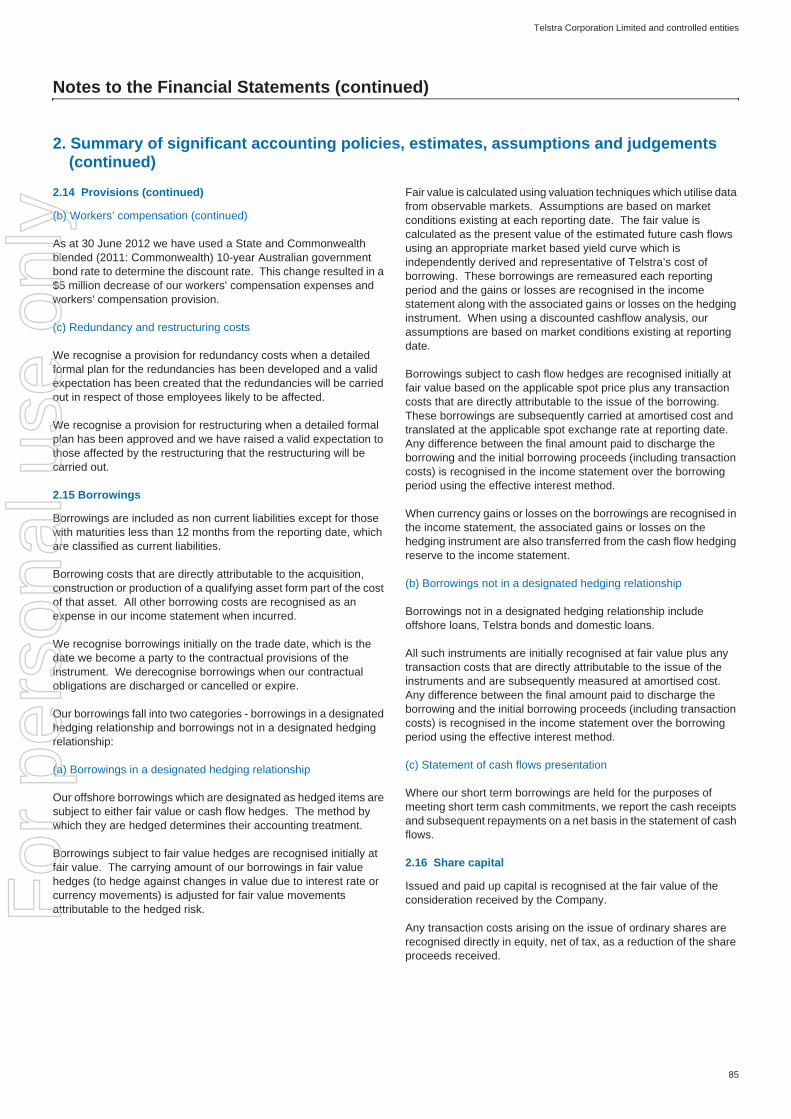
Telstra Corporation Limited and controlled entities
85
Notes to the Financial Statements (continued)
2.14 Provisions (continued)
(b) Workers’ compensation (continued)
As at 30 June 2012 we have used a State and Commonwealth blended (2011: Commonwealth) 10-year Australian government bond rate to determine the discount rate. This change resulted in a $5 million decrease of our workers' compensation expenses and workers' compensation provision.
(c) Redundancy and restructuring costs
We recognise a provision for redundancy costs when a detailed formal plan for the redundancies has been developed and a valid expectation has been created that the redundancies will be carried out in respect of those employees likely to be affected.
We recognise a provision for restructuring when a detailed formal plan has been approved and we have raised a valid expectation to those affected by the restructuring that the restructuring will be carried out.
2.15 Borrowings
Borrowings are included as non current liabilities except for those with maturities less than 12 months from the reporting date, which are classified as current liabilities.
Borrowing costs that are directly attributable to the acquisition, construction or production of a qualifying asset form part of the cost of that asset. All other borrowing costs are recognised as an expense in our income statement when incurred.
We recognise borrowings initially on the trade date, which is the date we become a party to the contractual provisions of the instrument. We derecognise borrowings when our contractual obligations are discharged or cancelled or expire.
Our borrowings fall into two categories - borrowings in a designated hedging relationship and borrowings not in a designated hedging relationship:
(a) Borrowings in a designated hedging relationship
Our offshore borrowings which are designated as hedged items are subject to either fair value or cash flow hedges. The method by which they are hedged determines their accounting treatment.
Borrowings subject to fair value hedges are recognised initially at fair value. The carrying amount of our borrowings in fair value hedges (to hedge against changes in value due to interest rate or currency movements) is adjusted for fair value movements attributable to the hedged risk.
Fair value is calculated using valuation techniques which utilise data from observable markets. Assumptions are based on market conditions existing at each reporting date. The fair value is calculated as the present value of the estimated future cash flows using an appropriate market based yield curve which is independently derived and representative of Telstra’s cost of borrowing. These borrowings are remeasured each reporting period and the gains or losses are recognised in the income statement along with the associated gains or losses on the hedging instrument. When using a discounted cashflow analysis, our assumptions are based on market conditions existing at reporting date.
Borrowings subject to cash flow hedges are recognised initially at fair value based on the applicable spot price plus any transaction costs that are directly attributable to the issue of the borrowing. These borrowings are subsequently carried at amortised cost and translated at the applicable spot exchange rate at reporting date. Any difference between the final amount paid to discharge the borrowing and the initial borrowing proceeds (including transaction costs) is recognised in the income statement over the borrowing period using the effective interest method.
When currency gains or losses on the borrowings are recognised in the income statement, the associated gains or losses on the hedging instrument are also transferred from the cash flow hedging reserve to the income statement.
(b) Borrowings not in a designated hedging relationship
Borrowings not in a designated hedging relationship include offshore loans, Telstra bonds and domestic loans.
All such instruments are initially recognised at fair value plus any transaction costs that are directly attributable to the issue of the instruments and are subsequently measured at amortised cost. Any difference between the final amount paid to discharge the borrowing and the initial borrowing proceeds (including transaction costs) is recognised in the income statement over the borrowing period using the effective interest method.
(c) Statement of cash flows presentation
Where our short term borrowings are held for the purposes of meeting short term cash commitments, we report the cash receipts and subsequent repayments on a net basis in the statement of cash flows.
2.16 Share capital
Issued and paid up capital is recognised at the fair value of the consideration received by the Company.
Any transaction costs arising on the issue of ordinary shares are recognised directly in equity, net of tax, as a reduction of the share proceeds received.
2. Summary of significant accounting policies, estimates, assumptions and judgements (continued)
For
per
sona
l use
onl
y
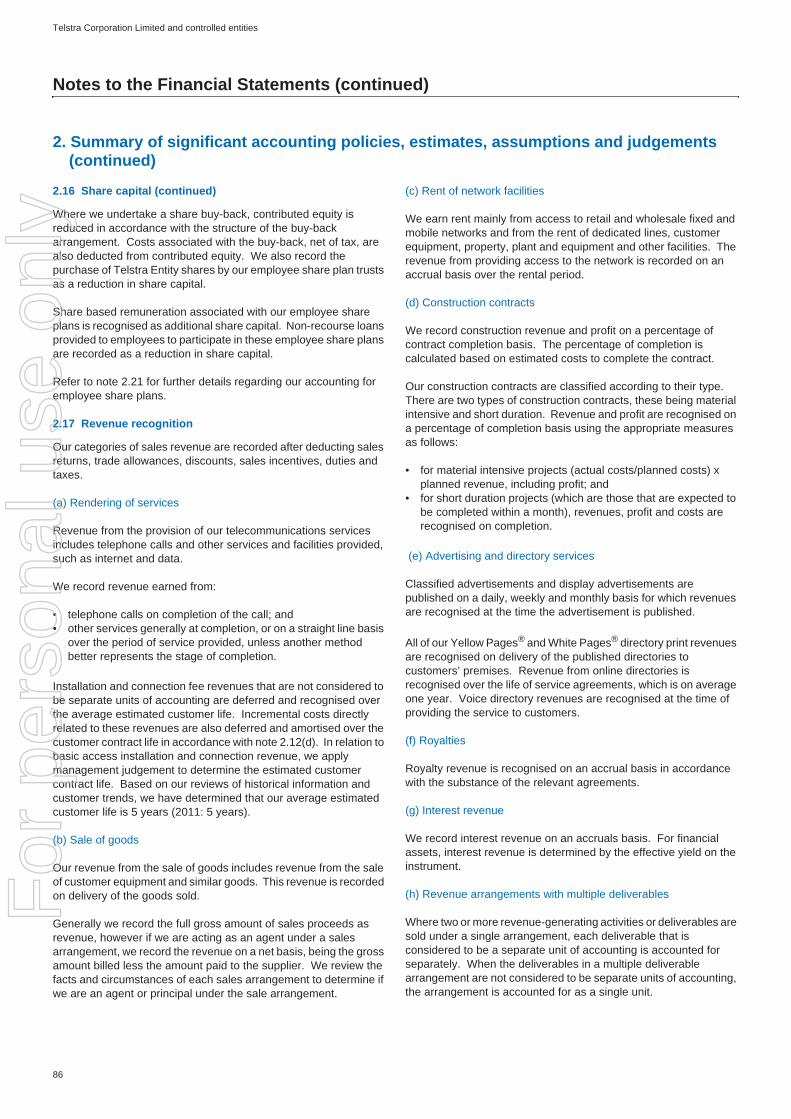
Telstra Corporation Limited and controlled entities
86
Notes to the Financial Statements (continued)
2.16 Share capital (continued)
Where we undertake a share buy-back, contributed equity is reduced in accordance with the structure of the buy-back arrangement. Costs associated with the buy-back, net of tax, are also deducted from contributed equity. We also record the purchase of Telstra Entity shares by our employee share plan trusts as a reduction in share capital.
Share based remuneration associated with our employee share plans is recognised as additional share capital. Non-recourse loans provided to employees to participate in these employee share plans are recorded as a reduction in share capital.
Refer to note 2.21 for further details regarding our accounting for employee share plans.
2.17 Revenue recognition
Our categories of sales revenue are recorded after deducting sales returns, trade allowances, discounts, sales incentives, duties and taxes.
(a) Rendering of services
Revenue from the provision of our telecommunications services includes telephone calls and other services and facilities provided, such as internet and data.
We record revenue earned from:
• telephone calls on completion of the call; and• other services generally at completion, or on a straight line basis
over the period of service provided, unless another method better represents the stage of completion.
Installation and connection fee revenues that are not considered to be separate units of accounting are deferred and recognised over the average estimated customer life. Incremental costs directly related to these revenues are also deferred and amortised over the customer contract life in accordance with note 2.12(d). In relation to basic access installation and connection revenue, we apply management judgement to determine the estimated customer contract life. Based on our reviews of historical information and customer trends, we have determined that our average estimated customer life is 5 years (2011: 5 years).
(b) Sale of goods
Our revenue from the sale of goods includes revenue from the sale of customer equipment and similar goods. This revenue is recorded on delivery of the goods sold.
Generally we record the full gross amount of sales proceeds as revenue, however if we are acting as an agent under a sales arrangement, we record the revenue on a net basis, being the gross amount billed less the amount paid to the supplier. We review the facts and circumstances of each sales arrangement to determine if we are an agent or principal under the sale arrangement.
(c) Rent of network facilities
We earn rent mainly from access to retail and wholesale fixed and mobile networks and from the rent of dedicated lines, customer equipment, property, plant and equipment and other facilities. The revenue from providing access to the network is recorded on an accrual basis over the rental period.
(d) Construction contracts
We record construction revenue and profit on a percentage of contract completion basis. The percentage of completion is calculated based on estimated costs to complete the contract.
Our construction contracts are classified according to their type. There are two types of construction contracts, these being material intensive and short duration. Revenue and profit are recognised on a percentage of completion basis using the appropriate measures as follows:
• for material intensive projects (actual costs/planned costs) x planned revenue, including profit; and
• for short duration projects (which are those that are expected to be completed within a month), revenues, profit and costs are recognised on completion.
(e) Advertising and directory services
Classified advertisements and display advertisements are published on a daily, weekly and monthly basis for which revenues are recognised at the time the advertisement is published.
All of our Yellow Pages® and White Pages® directory print revenues are recognised on delivery of the published directories to customers’ premises. Revenue from online directories is recognised over the life of service agreements, which is on average one year. Voice directory revenues are recognised at the time of providing the service to customers.
(f) Royalties
Royalty revenue is recognised on an accrual basis in accordance with the substance of the relevant agreements.
(g) Interest revenue
We record interest revenue on an accruals basis. For financial assets, interest revenue is determined by the effective yield on the instrument.
(h) Revenue arrangements with multiple deliverables
Where two or more revenue-generating activities or deliverables are sold under a single arrangement, each deliverable that is considered to be a separate unit of accounting is accounted for separately. When the deliverables in a multiple deliverable arrangement are not considered to be separate units of accounting, the arrangement is accounted for as a single unit.
2. Summary of significant accounting policies, estimates, assumptions and judgements (continued)
For
per
sona
l use
onl
y

Telstra Corporation Limited and controlled entities
87
Notes to the Financial Statements (continued)
2.17 Revenue recognition (continued)
(h) Revenue arrangements with multiple deliverables (continued)
We allocate the consideration from the revenue arrangement to its separate units based on the relative selling prices of each unit. If neither vendor specific objective evidence nor third party evidence exists for the selling price, then the item is measured based on the best estimate of the selling price of that unit. The revenue allocated to each unit is then recognised in accordance with our revenue recognition policies described above. For eligible mobile repayment option (MRO) and mobile cap plans, MRO bonus credits are credited to customer accounts on a monthly basis. MRO bonus credits are considered sales incentives and therefore are recorded as a reduction to revenue. Where they form part of a bundled arrangement, the reduction in revenue is allocated to both the handset and services revenue based on their relative selling prices, where they both contribute towards the customer earning the MRO bonus credits.
(i) Government grants
Grants from the government are recognised at their fair value where there is a reasonable assurance that the grant will be received and Telstra will comply with all attached conditions.
Government grants relating to costs are deferred and recognised in the profit or loss over the period necessary to match them with the costs that they are intended to compensate.
Government grants relating to the purchase of property, plant and equipment are included in non current liabilities as deferred income and are credited to profit or loss on a straight line basis over the expected lives of the related assets.
The benefit of a government loan at a below-market rate of interest is treated as a government grant. The loan is measured at amortised cost. The benefit of the below-market rate of interest is measured as the difference between the initial carrying value of the loan, which is measured at amortised cost, and the actual proceeds received. The benefit is accounted for in accordance with our accounting policy for government grants described above.
During the year, we received a government grant under the Retraining Funding Deed with the Commonwealth Government as part of the NBN agreements. The grant will be used to retrain certain employees over a period of eight to ten years. The grant is recognised as income based on actual costs of training incurred.
2.18 Taxation
(a) Income taxes
Our income tax expense represents the sum of current tax and deferred tax. Current tax is calculated on accounting profit after allowing for non-taxable and non-deductible items based on the amount expected to be paid to taxation authorities on taxable profit for the period. Deferred tax is calculated at the tax rates that are expected to apply to the period when the asset is realised or the liability is settled. Both our current tax and deferred tax are calculated using tax rates that have been enacted or substantively enacted at reporting date.
Our current and deferred tax is recognised as an expense in the income statement, except when it relates to items directly debited or credited to other comprehensive income or equity, in which case our current and deferred tax is also recognised directly in other comprehensive income or equity.
We apply the balance sheet liability method for calculating our deferred tax. Deferred tax is the expected tax payable or recoverable on all taxable and deductible temporary differences determined with reference to the tax bases of assets and liabilities and their carrying amount for financial reporting purposes as at the reporting date.
We generally recognise deferred tax liabilities for all taxable temporary differences, except to the extent that the deferred tax liability arises from:
• the initial recognition of goodwill; or• the initial recognition of an asset or liability in a transaction that
is not a business combination and affects neither our accounting profit nor taxable income at the time of the transaction.
In respect of our investments in subsidiaries, jointly controlled and associated entities, we recognise deferred tax liabilities for all taxable temporary differences, except where we are able to control the timing of our temporary difference reversal and it is probable that the temporary difference will not reverse in the foreseeable future.
Management judgement is required to determine the amount of deferred tax assets that can be recognised. Deferred tax assets are recognised to the extent that it is probable that taxable profit will be available against which the deductible temporary differences, and the carry forward of unused tax losses and tax credits, can be utilised.
The carrying amount of our deferred tax assets is reviewed at each reporting date. We reduce the carrying amount to the extent that it is no longer probable that sufficient taxable profit will be available to allow the benefit of part or all of the deferred tax asset to be utilised. At each reporting date, we subsequently reassess our unrecognised deferred tax assets to determine whether it has become probable that future taxable profit will allow this deferred tax asset to be recovered.
The Telstra Entity and its Australian resident wholly owned entities have formed a tax consolidated group. The Telstra Entity is the head entity and recognises, in addition to its transactions, the current tax liabilities and the deferred tax assets arising from unused tax losses and tax credits for all entities in the tax consolidated group. The Telstra Entity and the entities in the tax consolidated group account for their own current tax expense and deferred tax amounts arising from temporary differences. These tax amounts are measured as if each entity in the tax consolidated group continues to be a separate taxpayer.
2. Summary of significant accounting policies, estimates, assumptions and judgements (continued)
For
per
sona
l use
onl
y

Telstra Corporation Limited and controlled entities
88
Notes to the Financial Statements (continued)
2.18 Taxation (continued)
(a) Income taxes (continued)
We offset deferred tax assets and deferred tax liabilities in the statement of financial position where they relate to income taxes levied by the same taxation authority and to the extent that we intend to settle our current tax assets and liabilities on a net basis. Our deferred tax assets and deferred tax liabilities are netted within the tax consolidated group, as these deferred tax balances relate to the same taxation authority. We do not net deferred tax balances between controlled entities, apart from those within the tax consolidated group.
(b) Goods and Services Tax (GST) (including other value added taxes)
We record our revenue, expenses and assets net of any applicable GST, except where the amount of GST incurred is not recoverable from the Australian Taxation Office (ATO). In these circumstances the GST is recognised as part of the cost of acquisition of the asset or as part of the expense item.
Receivables and payables balances include GST where we have either included GST in our price charged to customers or a supplier has included GST in their price charged to us. The net amount of GST due, but not paid, to the ATO is included under payables.
2.19 Earnings per share
Basic earnings per share is determined by dividing the profit attributable to ordinary shareholders after tax, excluding any costs of servicing equity other than ordinary shares, by the weighted average number of ordinary shares outstanding during the period.
Diluted earnings per share is calculated by dividing the profit attributable to ordinary shareholders after tax by the weighted average number of ordinary shares outstanding during the period (adjusted for the effects of the instruments in the Telstra Growthshare Trust and the Telstra Employee Share Ownership Plans).
2.20 Post employment benefits
(a) Defined contribution plans
Our commitment to defined contribution plans is limited to making contributions in accordance with our minimum statutory requirements. We do not have any legal or constructive obligation to pay further contributions if the fund does not hold sufficient assets to pay all employee benefits relating to current and past employee services.
Contributions to defined contribution plans are recorded as an expense in the income statement as the contributions become payable. We recognise a liability when we are required to make future payments as a result of employee services provided.
(b) Defined benefit plans
We currently sponsor a number of post employment benefit plans. As these plans have elements of both defined contribution and defined benefit, these hybrid plans are treated as defined benefit plans.
At reporting date, where the fair value of the plan assets is less than the present value of the defined benefit obligations, the net deficit is recognised as a liability. If the fair value of the plan assets exceeds the present value of the defined benefit obligations, the net surplus is recognised as an asset. We recognise the asset as we have the ability to control this surplus to generate future funds that are available to us in the form of reductions in future contributions or as a cash refund. Fair value is used to determine the value of the plan assets at reporting date and is calculated by reference to the net market values of the plan assets.
Defined benefit obligations are based on the expected future payments required to settle the obligations arising from current and past employee services. This obligation is influenced by many factors, including final salaries and employee turnover. We engage qualified actuaries to calculate the present value of the defined benefit obligations. These obligations are measured gross of tax.
The actuaries use the projected unit credit method to determine the present value of the defined benefit obligations of each plan. This method determines each year of service as giving rise to an additional unit of benefit entitlement. Each unit is measured separately to calculate the final obligation. The present value is determined by discounting the estimated future cash outflows using rates based on government guaranteed securities with similar due dates to these expected cash flows.
We recognise all our defined benefit costs in the income statement with the exception of actuarial gains and losses that are recognised directly in other comprehensive income via retained profits. Components of defined benefit costs include current and past service cost, interest cost and expected return on assets. Past service cost is recognised immediately to the extent that the benefits are already vested, and otherwise is amortised on a straight line basis over the average period until the benefits become vested.
Actuarial gains and losses are based on an actuarial valuation of each defined benefit plan at reporting date. Actuarial gains and losses represent the differences between previous actuarial assumptions of future outcomes and the actual outcome, in addition to the effect of changes in actuarial assumptions.
We apply judgement in estimating the following key assumptions used in the calculation of our defined benefit liabilities and assets at reporting date:
• discount rates; • salary inflation rate; and• expected return on plan assets.
2. Summary of significant accounting policies, estimates, assumptions and judgements (continued)
For
per
sona
l use
onl
y

Telstra Corporation Limited and controlled entities
89
Notes to the Financial Statements (continued)
2.20 Post employment benefits (continued)
(b) Defined benefit plans (continued)
The estimates applied in the actuarial calculation have a significant impact on the reported amount of our defined benefit plan liabilities and assets. If the estimates prove to be incorrect, the carrying value may be materially impacted in the next reporting period. Additional volatility may also potentially be recorded in other comprehensive income to reflect differences between actuarial assumptions of future outcomes applied at the current reporting date and the actual outcome in the next annual reporting period.
As at 30 June 2012 we have used a State and Commonwealth blended (2011: Commonwealth) 10-year Australian government bond rate to determine the discount rate. This change resulted in a $219 million decrease in actuarial loss on defined benefit plans recognised in the other comprehensive income and the defined benefit liability.
Refer to note 24 for details on the key estimates used in the calculation of our defined benefit liabilities and assets.
2.21 Employee Share Plans
We own 100% of the equity of Telstra ESOP Trustee Pty Ltd, the corporate trustee for the Telstra Employee Share Ownership Plan Trust (TESOP97) and Telstra Employee Share Ownership Plan Trust II (TESOP99). We consolidate the results, position and cash flows of TESOP97 and TESOP99.
The Telstra Growthshare Trust (Growthshare) was established to allocate equity based instruments as required. Current equity based instruments include options, performance rights, restricted shares, incentive shares, Directshares and Ownshares. Restricted shares are subject to performance hurdles. Incentive shares are subject to a specified period of service. Options and performance rights can be subject to performance hurdles or a specified period of service.
We own 100% of the equity of Telstra Growthshare Pty Ltd, the corporate trustee for Growthshare. We also include the results, position and cash flows of Growthshare.
We recognise an expense for all share based remuneration determined with reference to the fair value at grant date of the equity instruments issued. The fair value of our equity instruments is calculated using a valuation technique that is consistent with the Black-Scholes methodology and utilises Monte Carlo simulations. The fair value is charged against profit or loss over the relevant vesting periods, adjusted to reflect actual and expected levels of vesting.
2.22 Derivative financial instruments
We use derivative financial instruments such as forward exchange contracts, cross currency swaps and interest rate swaps to hedge risks associated with foreign currency and interest rate fluctuations.
The use of hedging instruments is governed by the guidelines set by our Board of Directors.
Derivative financial instruments are included as non current assets or liabilities except for those with maturities less than 12 months from the reporting date, which are classified as current assets or liabilities.
Derivatives are initially recognised at fair value on the date a derivative contract is entered into and are subsequently remeasured to fair value. Refer to note 17 for details on the basis used for estimated fair value. The method of recognising the resulting remeasurement gain or loss depends on whether the derivative is designated as a hedging instrument, and if so, the nature of the item being hedged. Where we hold derivative financial instruments that are not designated as hedges, they are categorised as 'held for trading' financial instruments. All of our derivative financial instruments are stated at fair value.
Derivative assets are derecognised when the rights to receive cash flows from the derivative assets have expired or have been transferred and we have transferred substantially all the risks and rewards of ownership.
The carrying value of our cross currency and interest rate swaps refers to the fair value of our receivable or payable under the swap contract. We do not offset the receivable or payable with the underlying financial asset or financial liability being hedged, as the transactions are usually with different counterparties and are not generally settled on a net basis.
Where we have a legally recognised right to set off the derivative asset and the derivative liability, and we intend to settle on a net basis or simultaneously, we record this position on a net basis in our statement of financial position. Where we enter into master netting arrangements relating to a number of financial instruments, have a legal right of set off, and intend to do so, we also include this position on a net basis in our statement of financial position.
Our derivative instruments that are held to hedge exposures can be classified into three different types, depending on the reason we are holding them - fair value hedges, cash flow hedges and hedges of net investment in foreign operations.
Hedge accounting can only be utilised where effectiveness tests are met on both a prospective and retrospective basis. For all of our hedging instruments, any gains or losses on remeasuring to fair value any portion of the instrument not considered to be effective, are recognised directly in the income statement in the period in which they occur. The extent to which gains or losses on the hedged item and the hedge instrument do not offset represents ineffectiveness which may result in significant volatility in the income statement.
We formally designate and document at the inception of a transaction the relationship between hedging instruments and hedged items, as well as our risk management objective and strategy for undertaking various hedge transactions, together with the methods that will be used to assess the effectiveness of the hedge relationship. We also document our assessment, both at hedge inception and on an ongoing basis, of whether the hedging instruments that are used in hedging transactions have been, and will continue to be, highly effective in offsetting changes in fair values or cash flows of hedged items.
2. Summary of significant accounting policies, estimates, assumptions and judgements (continued)
For
per
sona
l use
onl
y

Telstra Corporation Limited and controlled entities
90
Notes to the Financial Statements (continued)
2.22 Derivative financial instruments (continued)
Purchases and sales of derivative instruments are recognised on the date on which we commit to purchase or sell an asset.
(a) Fair value hedges
We use fair value hedges to mitigate the risk of changes in the fair value of our foreign currency borrowings from foreign currency and interest rate fluctuations over the hedging period.
Where a fair value hedge qualifies for hedge accounting, gains or losses from remeasuring the fair value of the hedging instrument are recognised within finance costs in the income statement, together with gains and losses in relation to the hedged item where those gains or losses relate to the risks intended to be hedged.
(b) Cash flow hedges
We use cash flow hedges to mitigate the risk of variability of future cash flows attributable to foreign currency fluctuations over the hedging period associated with our foreign currency borrowings and our ongoing business activities, predominantly where we have highly probable purchase or settlement commitments in foreign currencies. We also use cash flow hedges to hedge variability in cash flows due to interest rate movements associated with some of our domestic borrowings.
Where a cash flow hedge qualifies for hedge accounting, the effective portion of gains or losses on remeasuring the fair value of the hedging instrument are recognised directly in other comprehensive income in the cash flow hedging reserve until such time as the hedged item affects profit or loss, then the gains or losses are transferred to the income statement. However, in our hedges of forecast transactions, when the forecast transaction that is hedged results in the recognition of a non-financial asset (for example, property, plant and equipment), the gains and losses previously deferred in other comprehensive income are transferred from other comprehensive income and included in the measurement of the initial cost or carrying amount of the asset. Gains or losses on any portion of the hedge determined to be ineffective are recognised immediately in the income statement. The application of hedge accounting will create some volatility in equity reserve balances.
When a hedging instrument expires or is sold or terminated, or when a hedge no longer meets the criteria for hedge accounting, any cumulative gains or losses existing in other comprehensive income at that time remain in other comprehensive income and are recognised when the hedged item is ultimately recognised in the income statement.
If a forecast hedged transaction is no longer expected to occur, the cumulative gains or losses on the hedging instrument that were reported in other comprehensive income are transferred immediately to the income statement.
(c) Hedges of a net investment in a foreign operation
Our investments in foreign operations are exposed to foreign currency risk, which arises when we translate the net assets of our foreign investments from their functional currency to Australian dollars. We hedge our net investments to mitigate exposure to this risk by using forward foreign currency contracts, cross currency swaps and/or borrowings in the relevant currency of the investment.
Gains and losses on remeasurement of our derivative instruments designated as hedges of foreign investments are recognised in the foreign currency translation reserve in equity to the extent they are considered to be effective.
The cumulative amount of the recognised gains or losses included in equity are transferred to the income statement when the foreign operation is sold.
(d) Derivatives and borrowings that are de-designated from fair value hedge relationships or not in a designated hedging relationship
Derivatives associated with borrowings de-designated from fair value hedge relationships or not in a designated hedge relationship for hedge accounting purposes are classified as ‘held for trading’.
For borrowings de-designated from fair value hedge relationships, from the date of de-designation the derivatives continue to be recognised at fair value and the borrowings are accounted for on an amortised cost basis consistent with a revised effective interest rate as at the de-designation date. The gains or losses on both the borrowings and derivatives are included within finance costs on the basis that the net result primarily reflects the impact of movements in interest rates and the discounting impact of future cash flows on the derivatives. The cumulative gains or losses previously recognised from the remeasurement of these borrowings as at the date of de-designation are unwound and amortised to the income statement over the remaining life of the borrowing. This amortisation expense is also included within finance costs.
For borrowings not in designated hedge relationships for hedge accounting purposes, the derivatives are recognised at fair value and the borrowings are accounted for on an amortised cost basis. The gains or losses on both the borrowings and derivatives are included within finance costs on the basis that the net result primarily reflects the impact of movements in interest rates and the discounting impact of future cash flows on the derivatives.
Any gains or losses on remeasuring to fair value forward exchange contracts that are not in a designated hedging relationship are recognised directly in the income statement in the period in which they occur within other expenses or other income.
(e) Embedded derivatives
Derivatives embedded in other financial instruments or other host contracts are treated as separate derivatives when their risks and characteristics are not closely related to those of the host contracts and the host contracts are not measured at fair value through profit or loss.
2. Summary of significant accounting policies, estimates, assumptions and judgements (continued)
For
per
sona
l use
onl
y
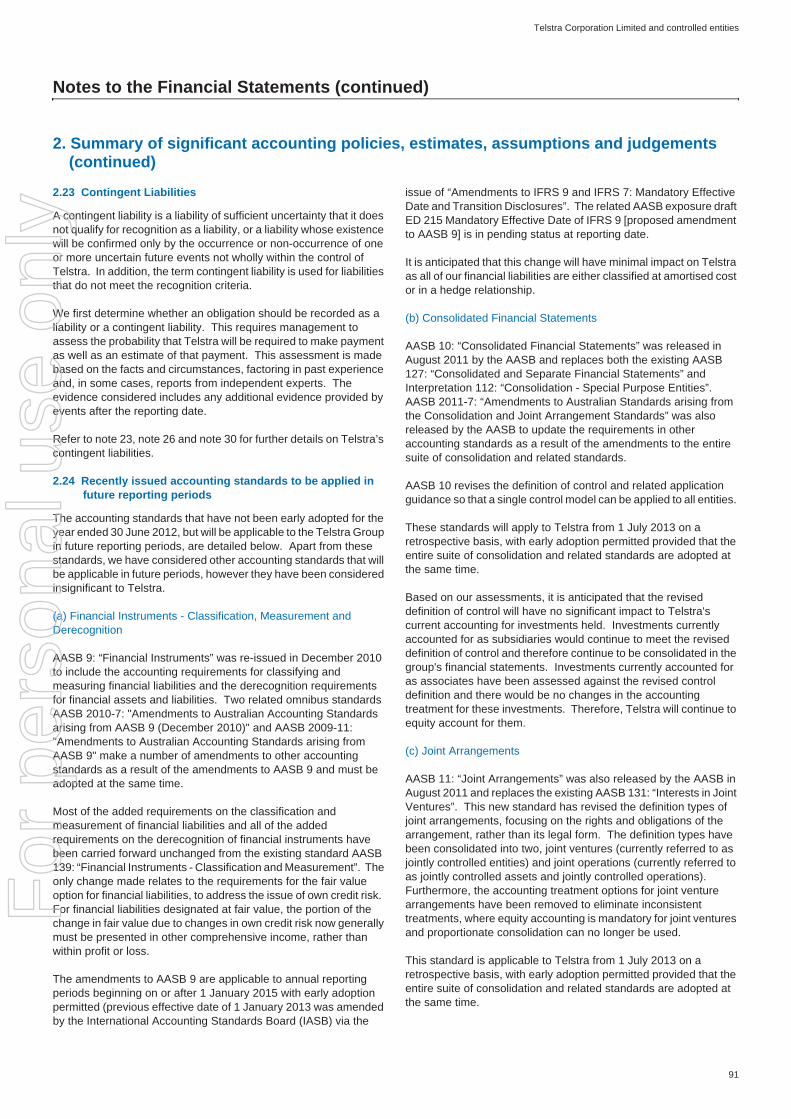
Telstra Corporation Limited and controlled entities
91
Notes to the Financial Statements (continued)
2.23 Contingent Liabilities
A contingent liability is a liability of sufficient uncertainty that it does not qualify for recognition as a liability, or a liability whose existence will be confirmed only by the occurrence or non-occurrence of one or more uncertain future events not wholly within the control of Telstra. In addition, the term contingent liability is used for liabilities that do not meet the recognition criteria.
We first determine whether an obligation should be recorded as a liability or a contingent liability. This requires management to assess the probability that Telstra will be required to make payment as well as an estimate of that payment. This assessment is made based on the facts and circumstances, factoring in past experience and, in some cases, reports from independent experts. The evidence considered includes any additional evidence provided by events after the reporting date.
Refer to note 23, note 26 and note 30 for further details on Telstra’s contingent liabilities.
2.24 Recently issued accounting standards to be applied in future reporting periods
The accounting standards that have not been early adopted for the year ended 30 June 2012, but will be applicable to the Telstra Group in future reporting periods, are detailed below. Apart from these standards, we have considered other accounting standards that will be applicable in future periods, however they have been considered insignificant to Telstra.
(a) Financial Instruments - Classification, Measurement and Derecognition
AASB 9: “Financial Instruments” was re-issued in December 2010 to include the accounting requirements for classifying and measuring financial liabilities and the derecognition requirements for financial assets and liabilities. Two related omnibus standards AASB 2010-7: "Amendments to Australian Accounting Standards arising from AASB 9 (December 2010)" and AASB 2009-11: "Amendments to Australian Accounting Standards arising from AASB 9" make a number of amendments to other accounting standards as a result of the amendments to AASB 9 and must be adopted at the same time.
Most of the added requirements on the classification and measurement of financial liabilities and all of the added requirements on the derecognition of financial instruments have been carried forward unchanged from the existing standard AASB 139: “Financial Instruments - Classification and Measurement”. The only change made relates to the requirements for the fair value option for financial liabilities, to address the issue of own credit risk. For financial liabilities designated at fair value, the portion of the change in fair value due to changes in own credit risk now generally must be presented in other comprehensive income, rather than within profit or loss.
The amendments to AASB 9 are applicable to annual reporting periods beginning on or after 1 January 2015 with early adoption permitted (previous effective date of 1 January 2013 was amended by the International Accounting Standards Board (IASB) via the
issue of “Amendments to IFRS 9 and IFRS 7: Mandatory Effective Date and Transition Disclosures”. The related AASB exposure draft ED 215 Mandatory Effective Date of IFRS 9 [proposed amendment to AASB 9] is in pending status at reporting date.
It is anticipated that this change will have minimal impact on Telstra as all of our financial liabilities are either classified at amortised cost or in a hedge relationship.
(b) Consolidated Financial Statements
AASB 10: “Consolidated Financial Statements” was released in August 2011 by the AASB and replaces both the existing AASB 127: “Consolidated and Separate Financial Statements” and Interpretation 112: “Consolidation - Special Purpose Entities”. AASB 2011-7: “Amendments to Australian Standards arising from the Consolidation and Joint Arrangement Standards” was also released by the AASB to update the requirements in other accounting standards as a result of the amendments to the entire suite of consolidation and related standards.
AASB 10 revises the definition of control and related application guidance so that a single control model can be applied to all entities.
These standards will apply to Telstra from 1 July 2013 on a retrospective basis, with early adoption permitted provided that the entire suite of consolidation and related standards are adopted at the same time.
Based on our assessments, it is anticipated that the revised definition of control will have no significant impact to Telstra's current accounting for investments held. Investments currently accounted for as subsidiaries would continue to meet the revised definition of control and therefore continue to be consolidated in the group's financial statements. Investments currently accounted for as associates have been assessed against the revised control definition and there would be no changes in the accounting treatment for these investments. Therefore, Telstra will continue to equity account for them.
(c) Joint Arrangements
AASB 11: “Joint Arrangements” was also released by the AASB in August 2011 and replaces the existing AASB 131: “Interests in Joint Ventures”. This new standard has revised the definition types of joint arrangements, focusing on the rights and obligations of the arrangement, rather than its legal form. The definition types have been consolidated into two, joint ventures (currently referred to as jointly controlled entities) and joint operations (currently referred to as jointly controlled assets and jointly controlled operations). Furthermore, the accounting treatment options for joint venture arrangements have been removed to eliminate inconsistent treatments, where equity accounting is mandatory for joint ventures and proportionate consolidation can no longer be used.
This standard is applicable to Telstra from 1 July 2013 on a retrospective basis, with early adoption permitted provided that the entire suite of consolidation and related standards are adopted at the same time.
2. Summary of significant accounting policies, estimates, assumptions and judgements (continued)
For
per
sona
l use
onl
y

Telstra Corporation Limited and controlled entities
92
Notes to the Financial Statements (continued)
2.24 Recently issued accounting standards to be applied in future reporting periods (continued)
(c) Joint Arrangements (continued)
Based on management’s current assessments, the revised definition types of joint arrangements will have no impact on Telstra's current joint arrangement classifications. The assessment of Telstra's material jointly controlled entities shows there are no jointly controlled entities that give Telstra direct rights over assets or obligations to settle liabilities, such that they should be classified as joint operations. As such, all of these jointly controlled entities would be classified as joint ventures and given that Telstra's current accounting policy for jointly controlled entities is to use the equity accounting method, these joint ventures will remain equity accounted for under AASB 11. Overall, there will be no impact on the measurement of any of Telstra's existing joint arrangements.
(d) Disclosures of Interests in Other Entities
AASB 12: “Disclosure of Interests in Other Entities” was issued by the AASB in August 2011 and is a new standard on disclosure requirements for all forms of interests in investments, including subsidiaries, associates, joint arrangements and consolidated and unconsolidated structured entities.
This standard is applicable to Telstra from 1 July 2013 on a retrospective basis, with early adoption permitted provided that the entire suite of consolidation and related standards are adopted at the same time.
Based on our current assessments, there may be additional disclosures required by Telstra as a result of AASB 12, in the following areas:
• controlled entities with non-controlling interests that are material to Telstra;
• interests in consolidated structured entities; and• unconsolidated structured entities.
(e) Separate Financial Statements
AASB 127: “Separate Financial Statements” has been released by the AASB in August 2011 to replace the current AASB 127 standard, now only containing the accounting requirements for preparation of separate financial statements of the parent.
This standard is applicable from 1 July 2013, with early adoption permitted provided that the entire suite of consolidation and related standards are adopted at the same time. There is no impact to Telstra’s financial statements as we already comply with the requirements in the standard.
(f) Investments in Associates and Joint Ventures
AASB 128: “Investments in Associates and Joint Ventures” was issued by the AASB in August 2011 and replaces the current AASB 128 standard. Limited amendments have been made to AASB 128 including, the application of AASB 5: "Non-current assets held for sale and discontinued operations" to interests in associates and joint ventures and how to account for changes in interests in joint ventures and associates.
This standard is applicable from 1 July 2013, with early adoption permitted provided that the entire suite of consolidation and related standards are adopted at the same time.
We have assessed that there will be no impact to Telstra’s financial statements as a result of this standard.
(g) Fair Value Measurement
AASB 13: “Fair Value Measurement” was released by the AASB in August 2011 and is a new standard providing a single source of guidance for all fair value measurements and a precise definition of fair value. It replaces all fair value measurement guidance in Australian Accounting Standards and Interpretations, but does not replace existing standards requirements on when fair values should be used. A related omnibus standard AASB 2011-8: “Amendments to Australian Accounting Standards arising from AASB 13” makes a number of definition and guidance amendments to other accounting standards as a result of the amendments in AASB 13 and must be adopted at the same time.
This standard is applicable to Telstra from 1 July 2013, with early adoption permitted.
Based on our assessment of this new standard, the predominant impact will be additional disclosures required by Telstra, specifically in the following areas:
• investments or assets held for sale, where the fair value less costs to sell is lower than the carrying amount;
• as part of a business combination, any assets and liabilities measured at fair value in the statement of financial position after initial recognition; and
• financial instruments, where the carrying amount differs from the fair value.
(h) Employee Benefits
AASB 119: “Employee Benefits” was released by the AASB in September 2011 and replaces the existing employee benefits standard. A related omnibus standard AASB 2011-10: “Amendments to Australian Accounting Standards arising from AASB 119” makes a number of amendments to other accounting standards and an Interpretation as a result of the amendments in AASB 119.
Both standards are applicable from 1 July 2013 on a retrospective basis, with early adoption permitted.
2. Summary of significant accounting policies, estimates, assumptions and judgements (continued)
For
per
sona
l use
onl
y
Telstra Corporation Limited and controlled entities
93
Notes to the Financial Statements (continued)
2.24 Recently issued accounting standards to be applied in future reporting periods (continued)
(h) Employee Benefits (continued)
Based on management’s assessment, AASB 119 will have an impact to Telstra’s financial statements, specifically in the following areas:
• the defined benefit expense will no longer contain the component of expected returns on planned assets, instead this will be replaced by a net interest income or expense calculated using a discount rate (based on government bonds) that is applied to the net defined benefit asset or liability;
• presentation of the defined benefit cost will be disaggregated into three components; service cost to be presented in profit or loss, net interest on the net defined benefit asset or liability in the profit or loss as part of finance costs and remeasurements to be presented in other comprehensive income; and
• additional disclosures about the characteristics and risks arising from our defined benefit plans.
(i) Other
In addition to the above recently issued accounting standards that are applicable in future years, we note the following new accounting standards that are applicable in future years:
• AASB 2010-8: “Amendments to Australian Accounting Standards - Deferred Tax: Recovery of Underlying Assets”;
• AASB 2011-4: “Amendments to Australian Accounting Standards to Remove Individual Key Management Personnel Disclosure Requirements”;
• AASB 2012-2: “Amendments to Australian Accounting Standards - Disclosures - Offsetting Financial Assets and Financial Liabilities”;
• AASB 2012-3: “Amendments to Australian Accounting Standards - Offsetting Financial Assets and Financial Liabilities”; and
• AASB 2012-5 “Amendments to Australian Accounting Standards arising from Annual Improvements 2009-2011 Cycle”.
We do not expect these accounting standards and interpretations to materially impact our financial results upon adoption.
2. Summary of significant accounting policies, estimates, assumptions and judgements (continued)
For
per
sona
l use
onl
y

Telstra Corporation Limited and controlled entities
94
Notes to the Financial Statements (continued)
(a) In order to underpin the equity instruments issued under the Growthshare plan, the Telstra Growthshare Trust purchases Telstra shares on the market. These shares are not considered to be outstanding for the purposes of calculating basic and diluted earnings per share.
(b) Share options issued under the Telstra Employee Share Ownership Plan Trust I (TESOP97) and II (TESOP99) are not considered outstanding for the purposes of calculating basic earnings per share.
(c) In fiscal 2012 and fiscal 2011, the following equity instruments are considered dilutive to earnings per share:
• incentive shares granted under the Growthshare short term incentive scheme;
• certain performance rights and restricted shares granted under the Growthshare long term incentive scheme; and
• share options issued under TESOP97.
In fiscal 2012 and fiscal 2011, the following equity instruments are not considered dilutive to earnings per share:
• certain performance rights, restricted shares and options issued under Growthshare; and
• share options issued under TESOP99.
Refer to note 27 for details regarding equity instruments issued under the Growthshare and TESOP share plans.
3. Earnings per share
Telstra GroupYear ended 30 June
2012 2011cents cents
Basic earnings per share . . . . . . . . . . . . . . . . . . . . . . . . . . . . . . . . . . . . . . . . . . 27.5 26.1
Diluted earnings per share . . . . . . . . . . . . . . . . . . . . . . . . . . . . . . . . . . . . . . . . . 27.4 26.1
$m $mEarnings used in the calculation of basic and diluted earnings per shareProfit for the year attributable to equity holders of Telstra Entity . . . . . . . . . . . . . . . . . . . . . . . 3,405 3,231
Number of sharesmillions
Weighted average number of ordinary sharesWeighted average number of ordinary shares on issue . . . . . . . . . . . . . . . . . . . . . . . . . . . 12,443 12,443Effect of shares held by employee share plan trusts (a)(b) . . . . . . . . . . . . . . . . . . . . . . . . . (45) (61)Weighted average number of ordinary shares used in the calculation of basic earnings per share . . . . . 12,398 12,382Effect of dilutive employee share instruments (c) . . . . . . . . . . . . . . . . . . . . . . . . . . . . . . 8 15Weighted average number of ordinary shares used in the calculation of diluted earnings per share . . . . 12,406 12,397
For
per
sona
l use
onl
y
Telstra Corporation Limited and controlled entities
95
Notes to the Financial Statements (continued)
Dividends paid are fully franked at a tax rate of 30%.
Dividends per share in respect of each fiscal year are detailed below:
(a) As the final dividend for fiscal 2012 was not determined or publicly recommended by the Board as at 30 June 2012, no provision for dividend has been raised in the statement of financial position. The final dividend has been reported as an event subsequent to reporting date. Refer to note 31 for further details.
(b) In relation to our exempting account, there are statutory restrictions placed on the distribution of credits from this account. As a result of these restrictions, it is unlikely that we will be able to distribute our exempting credits.
(c) Franking credits that will arise from the payment of income tax are expressed at the 30% tax rate on a tax paid basis.
We believe that our current balance in the franking account, combined with the franking credits that will arise on tax instalments expected to be paid, adjusted for franking debits arising from income tax refunds, will be sufficient to fully frank our final 2012 dividend.
4. Dividends
Telstra EntityYear ended 30 June
2012 2011$m $m
Dividends paidPrevious year final dividend paid . . . . . . . . . . . . . . . . . . . . . . . . . . . . . . . . . . . . . . . 1,738 1,737Interim dividend paid . . . . . . . . . . . . . . . . . . . . . . . . . . . . . . . . . . . . . . . . . . . . . 1,737 1,738Total dividends paid . . . . . . . . . . . . . . . . . . . . . . . . . . . . . . . . . . . . . . . . . . . . . 3,475 3,475
Dividends paid per ordinary share cents centsPrevious year final dividend paid . . . . . . . . . . . . . . . . . . . . . . . . . . . . . . . . . . . . . . . 14.0 14.0Interim dividend paid . . . . . . . . . . . . . . . . . . . . . . . . . . . . . . . . . . . . . . . . . . . . . 14.0 14.0Total dividends paid . . . . . . . . . . . . . . . . . . . . . . . . . . . . . . . . . . . . . . . . . . . . . 28.0 28.0
Telstra EntityYear ended 30 June
2012 2011cents cents
Dividends per ordinary shareInterim dividend paid . . . . . . . . . . . . . . . . . . . . . . . . . . . . . . . . . . . . . . . . . . . . . 14.0 14.0Final dividend to be paid (a) . . . . . . . . . . . . . . . . . . . . . . . . . . . . . . . . . . . . . . . . . 14.0 14.0Total dividends . . . . . . . . . . . . . . . . . . . . . . . . . . . . . . . . . . . . . . . . . . . . . . . . 28.0 28.0
Telstra EntityYear ended 30 June
2012 2011$m $m
The combined amount of exempting and franking credits available to us for the next fiscal year are:Franking account balance . . . . . . . . . . . . . . . . . . . . . . . . . . . . . . . . . . . . . . . . . . (54) (141)Exempting account (b) . . . . . . . . . . . . . . . . . . . . . . . . . . . . . . . . . . . . . . . . . . . . 24 24Franking credits that will arise from the payment of income tax payable as at 30 June (c) . . . . . . . . . 674 369Exempting credits that we may be prevented from distributing in the next fiscal year (b) . . . . . . . . . . (24) (24)
620 228
For
per
sona
l use
onl
y
Telstra Corporation Limited and controlled entities
96
Notes to the Financial Statements (continued)
Operating segments
We report our segment information on the same basis as our internal management reporting structure, which drives how our company is organised and managed.
During the year ended 30 June 2012, the following changes were made to our operating segments:
• a new business unit "Telstra Customer Sales and Service" (TCS&S) was created, headed by the Chief Customer Officer. It consolidates the results of all domestic retail business units, i.e. Telstra Business (TB), Telstra Consumer and Country Wide (TC&CW) and Telstra Enterprise and Government (TE&G), which all continue to be disclosed as separate reportable segments. The Chief Customer Officer has also assumed the responsibility for our New Zealand retail unit, TelstraClear (TClear) which also continues to be disclosed as a separate reportable segment. The TCS&S head office function (excluding the domestic retail business units and TClear results) has been included in the "All Other" category;
• a new business unit "Telstra Applications and Ventures Group" (TAVG) was created to invest and partner with other companies and government agencies at the forefront of innovation to provide a new range of digital services for business and consumers, including in health and education. TAVG has been included in the "All Other" category;
• Telstra's media businesses have been consolidated into a single division, "Telstra Media Group" (TMG) and reported as a separate segment. The new division is responsible for managing Telstra's end-to-end media capabilities including Sensis®, BigPond®, Trading Post®, IPTV, FOXTEL and other content arrangements. TMG includes Sensis which was reported as a separate segment in fiscal 2011. It also includes Telstra Digital Media (new business unit), Telstra Cable and Media Applications and Experience (both previously reported in "All Other" category) and FOXTEL (reported in the prior year as a reconciling item between the underlying EBITDA contribution and profit before tax);
• Telstra International changed its name to Telstra International Group (TIG);
• the financial results of the Reach operations acquired in fiscal 2011 and previously reported as a reconciling item to underlying results, are now included in the Telstra International Group (TIG) reportable segment; and
• SouFun's financial results, previously included in the "All Other" category, are now excluded from underlying results (following its disposal in fiscal 2011).
Segment results are reported according to the internal management reporting structure at the reporting date. Segment comparatives are restated (with the exception of Reach transactions as disclosed in footnote (a) in the segment results table) to reflect the changes described above as well as any organisational changes which have occurred since the prior reporting period to present a like-for-like view.
The Telstra Group for fiscal 2012 is organised into the following operating segments for internal management reporting purposes:
Telstra Consumer and Country Wide (TC&CW) is responsible for providing the full range of telecommunication products, services and solutions (across Mobiles, Fixed and Mobile Broadband, Telephony and Pay TV) to consumer customers in metropolitan, regional, rural and remote areas of Australia. This is achieved through inbound and outbound call centres, Telstra Shops (owned and licensed), Telstra Dealers and Telstra Digital. Telstra Digital is responsible for delivering self service capabilities for all Telstra customers, across all phases of the customer experience from browsing to buying and bill and service requests.
Telstra Business (TB) is responsible for providing Australia's small to medium enterprises with a full range of telecommunications products, services and solutions, including the latest in cloud computing.
Telstra Enterprise and Government (TE&G) is responsible for the provision of network services and applications and integrated voice, data and mobile solutions via Telstra Next Generation Services® to enterprise and government customers.
Telstra Operations (TOps) is responsible for:• overall planning, design, engineering and architecture of Telstra
networks, technology and information technology;• construction of infrastructure for our Company's fixed, mobile,
Internet protocol (IP) and data networks;• delivery of customer services across these networks;• operation, assurance and maintenance, including activation and
restoration of these networks;• supply and delivery of information technology solutions to
support our products, services, customer support functions and our internal needs; and
• delivery of network-centric professional services, managed services and outsourcing services for Telstra customers.
Telstra Wholesale (TW) is responsible for the provision of a wide range of telecommunication products and services delivered over Telstra networks and associated support systems to non-Telstra branded carriers, carriage service providers and internet service providers as well as NBN Co Limited.
5. Segment information
For
per
sona
l use
onl
y

Telstra Corporation Limited and controlled entities
97
Notes to the Financial Statements (continued)
Operating segments (continued)
Telstra Media Group (TMG) is responsible for:• the management and growth of the domestic directories and
advertising business, including print, voice and digital directories, digital mapping and satellite navigation, digital display advertising and business information services. This includes the management of leading information brands including Yellow Pages, White Pages, Whereis®, Citysearch®, 1234 and Quotify®; and
• the management of our investment in Digital Media content, services and applications, including Trading Post, Telstra Advertising Network, BigPond content including music, movies, sport and games, IPTV, online portals and the FOXTEL partnership.
The majority of TMG non-advertising revenue is reported in the domestic retail segments, i.e. TC&CW, TB and TE&G.
Telstra International Group (TIG) is responsible for managing Telstra's assets outside Australia and New Zealand, including:• CSL New World Mobility Limited, our 76.4% owned subsidiary in
Hong Kong, responsible for providing full mobile services including handset sales, voice, and data product to the Hong Kong market. These services are delivered over CSL's 3G and 4G LTE networks;
• Telstra China, our mainland China business providing digital media services in auto, IT and consumer electronics (this includes the Autohome and Sequel IT businesses); and
• Telstra Global, our managed services and international connectivity business, providing managed network services, international data and voice, and satellite across Asia Pacific, China, India, Europe, and Africa. Telstra Global has carrier licenses in 11 countries in Asia, with a total of 14 carrier licenses worldwide, and also manages our submarine cable networks and the assets acquired from Reach.
TelstraClear (TClear), our New Zealand subsidiary, is responsible for providing full telecommunications services to the New Zealand market. As at 30 June 2012 the carrying value of TClear assets and liabilities have been classified as assets held for sale. For further details refer to note 12.
Telstra Innovation, Products and Marketing (TIPM) is responsible for innovation, product, promotion and pricing across Telstra. TIPM is also responsible for the overall brand, sponsorship, promotion and advertising direction of Telstra, as well as maintaining good industry analyst relations and embedding marketing excellence across the company. This is done by delivering data-driven customer insights that put the customer at the centre of everything Telstra does.
Corporate areas include:• Legal Services - provides operational and strategic legal support
and advice across the Company;• Corporate Affairs - manages Telstra's public policy and
communications. This includes responsibility for government relations at every level, regulatory positioning and negotiation, and corporate social responsibility (including the Telstra Foundation);
• Finance and Strategy - encompasses the functions of corporate planning, accounting and administration, treasury, risk management and assurance, investor relations, mergers and acquisitions and corporate strategy. It also provides financial support to all business units and financial management of the majority of Telstra Entity's fixed assets (including network assets);
• the Telstra Board and the Office of the Company Secretary;• Human Resources - supports Telstra in organisational design
and change, implementation of people and culture initiatives, leadership development, talent and succession management, health, safety and wellbeing, professional development, workplace relations and all employment and remuneration policies;
• the Office of the CEO; and• Business Support and Improvement - encompasses the
functions of credit management, billing and procurement, as well as being responsible for driving change that improves the customer experience and delivering Telstra-wide productivity improvements.
In our segment financial results, the "All Other" category consists of various business units that do not qualify as reportable segments in their own right. These include:
• TIPM;• TCS&S head office function;• TAVG; and• our Corporate areas.
Finance and Strategy in the Corporate area is the main contributor to the result for the "All Other" category, which is primarily depreciation and amortisation charges as well as impairment of property, plant and equipment and software.
5. Segment information (continued)
For
per
sona
l use
onl
y
Telstra Corporation Limited and controlled entities
98
Notes to the Financial Statements (continued)
Segment results
The measurement of segment results is in line with the basis of information presented to management for internal management reporting purposes. The performance of each segment is measured based on its "underlying earnings before interest, income tax expense, depreciation and amortisation (EBITDA) contribution" to the Telstra Group. The underlying EBITDA contribution excludes the effects of all inter-segment balances and transactions (with the exception of fiscal 2011 and 2012 Reach transactions). As such, only transactions external to the Telstra Group are reported. Furthermore, certain items of income and expense are excluded from the segment results to show a measure of underlying performance, such as gains/losses on disposal of non-current assets, controlled entities, associated entities, and businesses, the impairment of goodwill and intangibles, and revenue for the build of NBN related infrastructure. These are separately disclosed in the reconciliation of total reportable segments to Telstra Group reported EBITDA, EBIT and profit before income tax expense in the financial statements.
Certain items of income and expense are recorded by our corporate areas, rather than being allocated to each segment. These items include the following:
• the adjustment to defer our basic access installation and connection fee revenues and costs in accordance with our accounting policy. Our reportable segments record these amounts upfront;
• the majority of redundancy expenses for the Telstra Entity; and • rental costs associated with printers and other related equipment
for the Telstra Entity.
In addition, the following narrative further explains how some items are allocated and managed, and as a result how they are reflected in our segment results:
• sales revenue associated with mobile handsets for TC&CW, TB and TE&G are mainly allocated to the TC&CW segment along with the associated costs of goods and services purchased. Ongoing prepaid and postpaid mobile revenues derived from our mobile usage is recorded in TC&CW, TB and TE&G depending on the type of customer serviced;
• TOps recognise certain expenses in relation to the installation and running of the hybrid fibre coaxial (HFC) cable network;
• domestic promotion and advertising expense for the Telstra Entity is recorded centrally in TIPM; and
• call centre costs associated with TB and TE&G are included in the TC&CW segment.
5. Segment information (continued)
For
per
sona
l use
onl
y

Telstra Corporation Limited and controlled entities
99
Notes to the Financial Statements (continued)
Segment results (continued)
The following tables detail the underlying results of our business segments, based on the reporting structure as at 30 June 2012:
(a) Revenue from external customers in TIG includes $136 million (2011: $12 million reduction in revenue) of inter-segment revenue treated as external expenses in Retail units (2011: $12 million treated as revenue in TW) which is eliminated in the “All Other” category. No eliminations were required in 2011.
External expenses in TIG also include $33 million (2011: $34 million reduction in expenses) of inter-segment expenses treated as external revenue in TW (2011: $34 million treated as expenses in Retail units) which is eliminated in the "All Other" category. No eliminations were required in 2011.
5. Segment information (continued)
Telstra GroupTC&CW TB TE&G TOps TW TMG TIG TClear All Other Total
Year ended 30 June 2012 $m $m $m $m $m $m $m $m $m $m
Revenue from external customers for operating segments (a)(g) . . 10,211 4,670 4,332 62 2,100 1,741 1,635 502 (135) 25,118Other non-operating segment revenue. . . . . . . . . . . . . . - - - - - - - - 183 183Other income . . . . . . . . . . . 56 6 (7) 11 1 - 8 - 31 106Total income . . . . . . . . . . . 10,267 4,676 4,325 73 2,101 1,741 1,643 502 79 25,407
Labour expenses . . . . . . . . . 535 124 228 1,439 70 443 247 100 875 4,061Goods and services purchased (a) 3,316 960 606 202 74 174 790 226 (169) 6,179Other expenses . . . . . . . . . 949 69 38 2,111 24 360 294 77 917 4,839Share of equity accounted profits - - - - - - - - - -Underlying EBITDA contribution 5,467 3,523 3,453 (3,679) 1,933 764 312 99 (1,544) 10,328
Telstra GroupTC&CW TB TE&G TOps TW TMG TIG TClear All Other Total
Year ended 30 June 2011 $m $m $m $m $m $m $m $m $m $m
Revenue from external customers for operating segments (a) . . . . 9,854 4,715 4,143 105 2,194 1,978 1,330 516 8 24,843Other non-operating segment revenue. . . . . . . . . . . . . . - - - - - - - - 193 193Other income . . . . . . . . . . . 61 5 (1) 8 - - 6 (2) 30 107Total income . . . . . . . . . . . 9,915 4,720 4,142 113 2,194 1,978 1,336 514 231 25,143
Labour expenses . . . . . . . . . 569 121 213 1,382 68 454 192 94 802 3,895Goods and services purchased (a) 3,205 976 567 228 74 181 688 256 29 6,204Other expenses . . . . . . . . . 1,066 69 32 2,247 21 344 226 80 906 4,991Share of equity accounted profits - - (1) - - - - - - (1)Underlying EBITDA contribution 5,075 3,554 3,331 (3,744) 2,031 999 230 84 (1,506) 10,054
For
per
sona
l use
onl
y

Telstra Corporation Limited and controlled entities
100
Notes to the Financial Statements (continued)
Segment results (continued)
A reconciliation of underlying EBITDA contribution for reportable segments to Telstra Group reported EBITDA, EBIT and profit before income tax expense is provided below:
(b) On 27 March 2012, we sold our 67% shareholding in LMobile for a total consideration of $3 million, resulting in a net loss of $17 million on disposal. Refer to note 20 for further details.
On 21 July 2011, we sold our 64.4% shareholding in Adstream (Aust) Pty Ltd for a total consideration of $24 million, resulting in a nil profit or loss on disposal. Refer to note 20 for further details.
On 17 September 2010, our controlled entity Telstra International Holdings sold its 50.6% shareholding in SouFun, resulting in a net gain of $69 million.
(c) We sold our 48.2% holding in Keycorp Limited on 8 December 2010 for a total consideration of $23 million, resulting in a gain on sale of $8 million.
(d) On 21 October 2011, our controlled entity Octave Investments Holdings Limited sold its ChinaM business for a total consideration of $5 million resulting in a loss on disposal of $1 million. Refer to note 20 for further details.
On 22 September 2010, our controlled entity Telstra Limited sold its UK voice customer business for a total consideration of $14 million, resulting in a loss on disposal of $16 million.
(e) The impairment of goodwill and intangibles of $189 million mainly relates to the TelstraClear Group (impairment of goodwill of $130 million) and LMobile Group (impairment of goodwill and other intangible assets of $56 million). Refer to note 21 for further details.
The 2011 impairment of goodwill and intangibles relates to the Octave Group (impairment of goodwill and customer base of $133 million) and the LMobile Group (impairment of goodwill of $27 million). Refer to note 21 for further details.
(f) The $33 million (2011: $30 million) gain from derecognition of contingent consideration relates to the fiscal 2010 acquisition of the LMobile Group. Refer to note 20 for further details.
(g) The $67 million (2011: nil) for the build of NBN related infrastructure has been recognised as revenue in the income statement, but excluded from reportable segment revenue.
(h) Revenue of $58 million and EBIT contribution of $6 million related to SouFun, which was disposed of on 17 September 2010, have been recorded in the income statement but excluded from reportable segments results.
5. Segment information (continued)
Telstra GroupYear ended 30 June
2012 2011 Note $m $m
Underlying EBITDA contribution for reportable segments . . . . . . . . . . . . . . . . . . . . . . . . . . . 11,872 11,560All other . . . . . . . . . . . . . . . . . . . . . . . . . . . . . . . . . . . . . . . . . . . . . . . . . . . . (1,544) (1,506)Total all segments . . . . . . . . . . . . . . . . . . . . . . . . . . . . . . . . . . . . . . . . . . . . . . . 10,328 10,054Amounts excluded from underlying results:- net gain on disposal of non current assets . . . . . . . . . . . . . . . . . . . . . . . . . . . . . . . . . . 15 12- net (loss)/gain on disposal of controlled entities (b) . . . . . . . . . . . . . . . . . . . . . . . . . . . . . (17) 69- net gain on disposal of associated entities (c) . . . . . . . . . . . . . . . . . . . . . . . . . . . . . . . . - 8- net loss on the disposal of businesses (d) . . . . . . . . . . . . . . . . . . . . . . . . . . . . . . . . . . (1) (16)- impairment in value of goodwill and intangibles (e) . . . . . . . . . . . . . . . . . . . . . . . . . . . . 14 (189) (160)- gain from derecognition of contingent consideration (f) . . . . . . . . . . . . . . . . . . . . . . . . . . 6 33 30- revenue for the build of NBN related infrastructure (g). . . . . . . . . . . . . . . . . . . . . . . . . . . . 67 -- EBIT contribution from SouFun operations (h) . . . . . . . . . . . . . . . . . . . . . . . . . . . . . . . . - 6- reversal of impairment in value of amount owed by joint ventures (i). . . . . . . . . . . . . . . . . . . . 7 - 147- other . . . . . . . . . . . . . . . . . . . . . . . . . . . . . . . . . . . . . . . . . . . . . . . . . . . . . (2) 1Telstra Group EBITDA (reported) . . . . . . . . . . . . . . . . . . . . . . . . . . . . . . . . . . . . . . 10,234 10,151- Depreciation and amortisation . . . . . . . . . . . . . . . . . . . . . . . . . . . . . . . . . . . . . . . 7 (4,412) (4,459)Telstra Group EBIT (reported) . . . . . . . . . . . . . . . . . . . . . . . . . . . . . . . . . . . . . . . . 5,822 5,692- Net finance costs . . . . . . . . . . . . . . . . . . . . . . . . . . . . . . . . . . . . . . . . . . . . . . . (888) (1,135)Telstra Group profit before income tax expense (reported) 4,934 4,557
For
per
sona
l use
onl
y

Telstra Corporation Limited and controlled entities
101
Notes to the Financial Statements (continued)
Segment results (continued)
(i) In 2011 as part of the restructure of Reach, Telstra's joint venture with PCCW, Telstra acquired a number of assets from Reach. The purchase price of $147 million was paid by an offset against the shareholder loan due from Reach, which was fully provided for by Telstra. As such, $147 million of the provision for the loan was reversed as it was no longer required.
(j) Our geographical operations are split between our Australian and offshore operations. Our offshore operations include CSL New World (Hong Kong), Autohome, Norstar Media and PCPop, Sharp Point and our international business, including Telstra Europe (UK), which are all part of the TIG segment, and TClear (New Zealand). No individual geographical area forms a significant part of our operations apart from our Australian operations.
(k) The carrying amount of our segment non current assets excludes derivative assets, defined benefit assets and deferred tax assets.
(l) Other sales revenue includes revenue for the build of NBN related infrastructure ($67 million), and late payment and miscellaneous fee revenue.
(m) Other revenue primarily consists of distributions from our FOXTEL Partnership and rental income.
(n) Other income includes gains and losses on asset and investment sales, USO levy receipts, subsidies and other miscellaneous items.
5. Segment information (continued)
Telstra GroupYear ended 30 June
2012 2011$m $m
Information about our geographic operations (j)
Revenue from external customersAustralian customers . . . . . . . . . . . . . . . . . . . . . . . . . . . . . . . . . . . . . . . . . . . . . 23,231 23,188Offshore customers . . . . . . . . . . . . . . . . . . . . . . . . . . . . . . . . . . . . . . . . . . . . . 2,137 1,905
25,368 25,093Carrying amount of non current assets (k)Located in Australia . . . . . . . . . . . . . . . . . . . . . . . . . . . . . . . . . . . . . . . . . . . . . 26,875 27,607Located offshore . . . . . . . . . . . . . . . . . . . . . . . . . . . . . . . . . . . . . . . . . . . . . . . 2,036 2,557
28,911 30,164
Telstra GroupYear ended 30 June
2012 2011Note $m $m
Information about our products and services
Fixed products . . . . . . . . . . . . . . . . . . . . . . . . . . . . . . . . . . . . . . . . . . . . . . . . 7,488 7,972Mobile services . . . . . . . . . . . . . . . . . . . . . . . . . . . . . . . . . . . . . . . . . . . . . . . . 7,330 6,829Mobile hardware . . . . . . . . . . . . . . . . . . . . . . . . . . . . . . . . . . . . . . . . . . . . . . . 1,338 1,160Data and IP access. . . . . . . . . . . . . . . . . . . . . . . . . . . . . . . . . . . . . . . . . . . . . . 3,122 3,147Network applications and services . . . . . . . . . . . . . . . . . . . . . . . . . . . . . . . . . . . . . . 1,263 1,143Digital media . . . . . . . . . . . . . . . . . . . . . . . . . . . . . . . . . . . . . . . . . . . . . . . . . 2,377 2,629International . . . . . . . . . . . . . . . . . . . . . . . . . . . . . . . . . . . . . . . . . . . . . . . . . 1,496 1,398TelstraClear. . . . . . . . . . . . . . . . . . . . . . . . . . . . . . . . . . . . . . . . . . . . . . . . . . 501 516Other sales revenue (l) . . . . . . . . . . . . . . . . . . . . . . . . . . . . . . . . . . . . . . . . . . . . 317 189Other revenue (m) . . . . . . . . . . . . . . . . . . . . . . . . . . . . . . . . . . . . . . . . . . . . . 6 136 110Other income (n) . . . . . . . . . . . . . . . . . . . . . . . . . . . . . . . . . . . . . . . . . . . . . . 6 135 211Total income (excluding finance income) . . . . . . . . . . . . . . . . . . . . . . . . . . . . . . . . 6 25,503 25,304F
or p
erso
nal u
se o
nly

Telstra Corporation Limited and controlled entities
102
Notes to the Financial Statements (continued)
(a) Non current assets includes property, plant and equipment, intangibles and investments.
6. Income
Telstra GroupYear ended 30 June
2012 2011Note $m $m
Sales revenueRendering of services . . . . . . . . . . . . . . . . . . . . . . . . . . . . . . . . . . . . . . . . . . . . 11,410 11,539Sale of goods. . . . . . . . . . . . . . . . . . . . . . . . . . . . . . . . . . . . . . . . . . . . . . . . . 1,854 1,690Rent of network facilities and access. . . . . . . . . . . . . . . . . . . . . . . . . . . . . . . . . . . . . 10,120 9,572Construction contracts . . . . . . . . . . . . . . . . . . . . . . . . . . . . . . . . . . . . . . . . . . . . 229 273Advertising and directory services . . . . . . . . . . . . . . . . . . . . . . . . . . . . . . . . . . . . . . 1,619 1,909
25,232 24,983Other revenue (excluding finance income)Distribution from FOXTEL Partnership . . . . . . . . . . . . . . . . . . . . . . . . . . . . . . . . . . . 29 108 70Rent from property . . . . . . . . . . . . . . . . . . . . . . . . . . . . . . . . . . . . . . . . . . . . . . 28 40
136 110Total revenue (excluding finance income) . . . . . . . . . . . . . . . . . . . . . . . . . . . . . . . . 25,368 25,093
Other incomeNet gain on disposal of non current assets (a) . . . . . . . . . . . . . . . . . . . . . . . . . . . . . . . . 5 75Gain from derecognition of contingent consideration . . . . . . . . . . . . . . . . . . . . . . . . . . . 20 33 30Other miscellaneous income . . . . . . . . . . . . . . . . . . . . . . . . . . . . . . . . . . . . . . . . . 97 106
135 211Total income (excluding finance income) . . . . . . . . . . . . . . . . . . . . . . . . . . . . . . . . . 25,503 25,304
Finance incomeInterest on cash and cash equivalents . . . . . . . . . . . . . . . . . . . . . . . . . . . . . . . . . 17(e) 111 117Interest on finance lease receivable . . . . . . . . . . . . . . . . . . . . . . . . . . . . . . . . . . . . . 11 10Interest on loans to jointly controlled and associated entities . . . . . . . . . . . . . . . . . . . . . . . 29 12 -
134 127Total income . . . . . . . . . . . . . . . . . . . . . . . . . . . . . . . . . . . . . . . . . . . . . . . . . 25,637 25,431
For
per
sona
l use
onl
y

Telstra Corporation Limited and controlled entities
103
Notes to the Financial Statements (continued)
7. Expenses
Telstra GroupYear ended 30 June
2012 2011Note $m $m
LabourIncluded in our labour expenses are the following:Employee redundancy . . . . . . . . . . . . . . . . . . . . . . . . . . . . . . . . . . . . . . . . . . . . 162 224Share based payments. . . . . . . . . . . . . . . . . . . . . . . . . . . . . . . . . . . . . . . . . . . . 31 12Defined benefit plan expense . . . . . . . . . . . . . . . . . . . . . . . . . . . . . . . . . . . . . . . 24 223 268
Cost of goods sold . . . . . . . . . . . . . . . . . . . . . . . . . . . . . . . . . . . . . . . . . . . . . 2,551 2,644
Other expensesImpairment losses:- impairment in value of inventories . . . . . . . . . . . . . . . . . . . . . . . . . . . . . . . . . . . . . 37 43- impairment in value of trade and other receivables. . . . . . . . . . . . . . . . . . . . . . . . . . . . . 370 421- impairment in value of property, plant and equipment . . . . . . . . . . . . . . . . . . . . . . . . . . 13 21 38- impairment in value of intangibles (a). . . . . . . . . . . . . . . . . . . . . . . . . . . . . . . . . . . 14 8 51- impairment in value of goodwill (a) . . . . . . . . . . . . . . . . . . . . . . . . . . . . . . . . . . . . 14 182 121
618 674Reversal of impairment losses:- reversal of impairment in value of trade and other receivables . . . . . . . . . . . . . . . . . . . . . . 10 (74) (80)- reversal of impairment in value of amount owed by joint ventures . . . . . . . . . . . . . . . . . . . . . - (147)
(74) (227)
Rental expense on operating leases . . . . . . . . . . . . . . . . . . . . . . . . . . . . . . . . . . . . . 583 561Net foreign currency translation losses/(gains). . . . . . . . . . . . . . . . . . . . . . . . . . . . . . . . 5 (1)Service contracts and other agreements . . . . . . . . . . . . . . . . . . . . . . . . . . . . . . . . . . . 2,135 2,359Promotion and advertising . . . . . . . . . . . . . . . . . . . . . . . . . . . . . . . . . . . . . . . . . . 327 334General and administration. . . . . . . . . . . . . . . . . . . . . . . . . . . . . . . . . . . . . . . . . . 985 902Other operating expenses . . . . . . . . . . . . . . . . . . . . . . . . . . . . . . . . . . . . . . . . . . 450 445
5,029 5,047
Depreciation of property, plant and equipment . . . . . . . . . . . . . . . . . . . . . . . . . . . . . 13 3,305 3,454Amortisation of intangible assets . . . . . . . . . . . . . . . . . . . . . . . . . . . . . . . . . . . . . 1,107 1,005
4,412 4,459
Finance costsInterest on borrowings . . . . . . . . . . . . . . . . . . . . . . . . . . . . . . . . . . . . . . . . . 17(e) 1,132 1,186Unwinding of discount on liabilities recognised at present value. . . . . . . . . . . . . . . . . . . . . . . 18 20Loss on fair value hedges - effective (b) . . . . . . . . . . . . . . . . . . . . . . . . . . . . . . . . . . . 9 27Gain on cash flow hedges - ineffective . . . . . . . . . . . . . . . . . . . . . . . . . . . . . . . . . . . . (2) (6)(Gain)/loss on transactions not in a designated hedge relationship/de-designated from fair valuehedge relationships (c) . . . . . . . . . . . . . . . . . . . . . . . . . . . . . . . . . . . . . . . . . . . . (14) 125Other . . . . . . . . . . . . . . . . . . . . . . . . . . . . . . . . . . . . . . . . . . . . . . . . . . . . . 7 14
1,150 1,366Less: interest on borrowings capitalised (d) . . . . . . . . . . . . . . . . . . . . . . . . . . . . . . . . . (128) (104)
1,022 1,262
Research and development expenses. . . . . . . . . . . . . . . . . . . . . . . . . . . . . . . . . . . 5 6For
per
sona
l use
onl
y

Telstra Corporation Limited and controlled entities
104
Notes to the Financial Statements (continued)
(a) We have recognised an impairment loss of $190 million (2011: $172 million) relating to impairment of goodwill ($182 million) and other intangible assets ($8 million) in Telstra Group financial statements. Refer to note 14 and note 21 for further details regarding impairment.
(b) We use our cross currency and interest rate swaps as fair value hedges to convert our foreign currency borrowings into Australian dollar floating rate borrowings.
The $9 million unrealised loss for the current year (2011: $27 million) reflects the following valuation impacts:
• movement in base market rates and Telstra’s borrowing margins between valuation dates;
• reduction in the number of future interest flows as we approach maturity of the financial instruments; and
• discount factor unwinding as borrowings move closer to maturity.
It is important to note that in general, it is our intention to hold our borrowings and associated derivative instruments to maturity. Accordingly, unrealised revaluation gains and losses will be recognised in our finance costs over the life of the financial instrument and for each transaction will progressively unwind to nil at maturity.
Refer to note 18 for further details regarding our hedging strategies.
(c) A combination of the following factors has resulted in a net unrealised gain of $14 million (2011: loss of $125 million) associated with financial instruments that are either not in a designated hedge relationship or were previously designated in a hedge relationship and no longer qualify for hedge accounting:
• the valuation impacts described at (b) above for fair value hedges;
• the different measurement bases of the borrowings (measured at amortised cost) and the associated derivatives (measured at fair value); and
• a net loss of $21 million (2011: $21 million) for the amortisation impact of unwinding previously recognised unrealised gains on those borrowings that were de-designated from hedge relationships.
Although these borrowings and the related derivative instruments do not satisfy the requirements for hedge accounting, they are in effective economic relationships based on contractual face value amounts and cash flows over the life of the transaction.
(d) Interest on borrowings has been capitalised using a capitalisation rate of 7.0% (2011: 7.2%). We applied the revised accounting standard AASB 123: “Borrowing Costs” prospectively for any new capital expenditure on qualifying assets incurred from 1 July 2009. The $24 million net increase from prior year (reduction in finance costs) is due to the progressive increase in the value of the qualifying asset base for which borrowing costs are capitalised.
7. Expenses (continued)
For
per
sona
l use
onl
y

Telstra Corporation Limited and controlled entities
105
Notes to the Financial Statements (continued)
Other services
Other services comprise audit related fees and non-audit services.
Audit related fees charged by Ernst & Young (EY) amounted to $0.840 million (2011: $0.396 million) and are for services that are reasonably related to the performance of the audit or review of our financial statements and other assurance engagements. These services include assurance services over debt raising prospectuses, additional control assessments, various accounting advice and additional audit services related to our controlled entities.
Non-audit services of $0.846 million (2011: $6.717 million) comprise the following:
• tax fees charged by EY which mainly relate to tax advisory and income tax return services; and
• other services that relate to all additional services performed by EY, other than those disclosed as auditing and reviewing the financial reports, audit related and tax. These services include various reviews and non assurance services across the Group, including risk assessments and IT environment related projects.
We have processes in place to maintain the independence of the external auditor, including the level of expenditure on non-audit services. EY also has specific internal processes in place to ensure auditor independence.
The Audit Committee approves the recurring audit and non-audit fees. The provision of additional audit and non-audit services by EY must be approved by either the Chief Financial Officer (CFO), the Chairman of the Audit Committee or the Audit Committee, depending upon the fees involved, if not covered by the Audit Committee pre-approval, subject to confirmation by both management and EY that the provision of these services does not compromise auditor independence. Our auditor independence guidelines clearly identify prohibited services. All additional EY engagements approved are reported to the Audit Committee at the next meeting.
8. Remuneration of auditors
Telstra GroupYear ended 30 June
2012 2011$m $m
Audit feesErnst & Young has charged the following amounts for auditing and reviewing the financial reports . . . . . 8.632 8.309
Other servicesOther services provided by Ernst & Young in their own right. . . . . . . . . . . . . . . . . . . . . . . . . 1.686 7.113
For
per
sona
l use
onl
y

Telstra Corporation Limited and controlled entities
106
Notes to the Financial Statements (continued)
(*) This includes the impact of foreign exchange movements in the deferred tax items recognised in the income statement.
9. Income taxes
Telstra GroupAs at 30 June
2012 2011$m $m
Major components of income tax expenseCurrent tax expense . . . . . . . . . . . . . . . . . . . . . . . . . . . . . . . . . . . . . . . . . . . . . 1,826 1,519Deferred tax resulting from the origination and reversal of temporary differences . . . . . . . . . . . . . . (337) (209)Under/(over) provision of tax in prior years. . . . . . . . . . . . . . . . . . . . . . . . . . . . . . . . . . 21 (3)
1,510 1,307
Notional income tax expense on profit differs from actual income tax expense recorded as follows:Profit before income tax expense . . . . . . . . . . . . . . . . . . . . . . . . . . . . . . . . . . . . . . 4,934 4,557
Notional income tax expense calculated at the Australian tax rate of 30% . . . . . . . . . . . . . . . . . 1,480 1,367
Which is adjusted by the tax effect of:Different rates of tax on overseas income . . . . . . . . . . . . . . . . . . . . . . . . . . . . . . . . . . (15) (17)Non assessable and non deductible items . . . . . . . . . . . . . . . . . . . . . . . . . . . . . . . . . . 63 (16)Amended assessments . . . . . . . . . . . . . . . . . . . . . . . . . . . . . . . . . . . . . . . . . . . (39) (24)Under/(over) provision of tax in prior years. . . . . . . . . . . . . . . . . . . . . . . . . . . . . . . . . . 21 (3)Income tax expense on profit. . . . . . . . . . . . . . . . . . . . . . . . . . . . . . . . . . . . . . . . . 1,510 1,307
Income tax recognised directly in other comprehensive income or equity during the year . . . . . . . . . (262) 19
Telstra GroupAs at 30 June
2012 2011$m $m
(Deferred tax liability)/deferred tax asset
Deferred tax items recognised in the income statement (*)Property, plant and equipment . . . . . . . . . . . . . . . . . . . . . . . . . . . . . . . . . . . . . . . . (1,241) (1,434)Intangible assets . . . . . . . . . . . . . . . . . . . . . . . . . . . . . . . . . . . . . . . . . . . . . . . (830) (876)Borrowings and derivative financial instruments . . . . . . . . . . . . . . . . . . . . . . . . . . . . . . . (59) (90)Provision for employee entitlements . . . . . . . . . . . . . . . . . . . . . . . . . . . . . . . . . . . . . 292 252Revenue received in advance . . . . . . . . . . . . . . . . . . . . . . . . . . . . . . . . . . . . . . . . 194 52Provision for workers' compensation . . . . . . . . . . . . . . . . . . . . . . . . . . . . . . . . . . . . . 20 21Allowance for doubtful debts . . . . . . . . . . . . . . . . . . . . . . . . . . . . . . . . . . . . . . . . . 57 64Defined benefit liability/asset (a) . . . . . . . . . . . . . . . . . . . . . . . . . . . . . . . . . . . . . . . 98 138Trade and other payables . . . . . . . . . . . . . . . . . . . . . . . . . . . . . . . . . . . . . . . . . . 111 135Other provisions . . . . . . . . . . . . . . . . . . . . . . . . . . . . . . . . . . . . . . . . . . . . . . . 49 52Income tax losses (b). . . . . . . . . . . . . . . . . . . . . . . . . . . . . . . . . . . . . . . . . . . . . 39 46Other . . . . . . . . . . . . . . . . . . . . . . . . . . . . . . . . . . . . . . . . . . . . . . . . . . . . . (32) (29)
(1,302) (1,669)Deferred tax items recognised in other comprehensive income or equity (c)Defined benefit liability/asset (a) . . . . . . . . . . . . . . . . . . . . . . . . . . . . . . . . . . . . . . . 148 (74)Derivative financial instruments . . . . . . . . . . . . . . . . . . . . . . . . . . . . . . . . . . . . . . . 53 13
201 (61)Net deferred tax liability . . . . . . . . . . . . . . . . . . . . . . . . . . . . . . . . . . . . . . . . . . (1,101) (1,730)
Our net deferred tax liability is split as follows:Deferred tax assets recognised in the statement of financial position . . . . . . . . . . . . . . . . . . . . 6 -Deferred tax liabilities recognised in the statement of financial position . . . . . . . . . . . . . . . . . . . (1,107) (1,730)
(1,101) (1,730)
For
per
sona
l use
onl
y

Telstra Corporation Limited and controlled entities
107
Notes to the Financial Statements (continued)
(a) Our net deferred tax asset on our defined benefit liability for the Telstra Group is $246 million (2011: $64 million).
(b) We have recognised a deferred tax asset for the unused tax losses of our offshore controlled entities to the extent that it is probable that future taxable profit will be available against which the unused tax losses can be utilised. We have prepared a management budget in line with our current knowledge of future events to support our view of sufficient future taxable profits being available to offset our unused tax losses.
(c) When the underlying transactions to which our deferred tax relates are recognised directly in other comprehensive income or equity, the temporary differences associated with these adjustments are also recognised directly in other comprehensive income or equity.
(d) Our deferred tax assets not recognised in the statement of financial position may be used in future years if the following criteria are met:
• our controlled entities have sufficient future taxable profit to enable the income tax losses and temporary differences to be offset against that taxable profit;
• we have sufficient future capital gains to be offset against those capital losses;
• we continue to satisfy the conditions required by tax legislation to be able to use the tax losses; and
• there are no future changes in tax legislation that will adversely affect us in using the benefit of the tax losses.
Tax consolidation
The Telstra Entity and its Australian resident wholly owned entities previously elected to form a tax consolidated group. As a consequence of the election to enter tax consolidation, the tax consolidated group is treated as a single entity for income tax purposes.
The Telstra Entity, as the head entity in the tax consolidated group, recognises, in addition to its own transactions, the current tax liabilities and the deferred tax assets arising from unused tax losses and tax credits for all entities in the group. However, the Telstra Entity and its Australian resident wholly owned entities account for their own current tax expense and deferred tax amounts.
Upon tax consolidation, the entities within the tax consolidated group entered into a tax sharing agreement. The terms of this agreement specified the methods of allocating any tax liability in the event of default by the Telstra Entity on its group payment obligations and the treatment where a subsidiary member exits the group. The tax liability of the group otherwise remains with the Telstra Entity for tax purposes.
A tax funding arrangement is also in place for entities within the tax consolidated group under which:
• the Telstra Entity compensates its Australian resident wholly owned controlled entities for any current tax receivable assumed;
• the Telstra Entity compensates its Australian resident wholly owned controlled entities for any deferred tax assets relating to unused tax losses and tax credits; and
• Australian resident wholly owned entities compensate the Telstra Entity for any current tax payable assumed.
The funding amounts are based on the amounts recorded in the financial statements of the wholly owned entities.
Amounts receivable of $11 million (2011: $14 million) to the Telstra Entity and amounts payable by the Telstra Entity of $211 million (2011: $206 million) under the tax funding arrangements are due in the next financial year upon final settlement of the current tax payable for the tax consolidated group.
9. Income taxes (continued)
Telstra GroupAs at 30 June
2012 2011$m $m
Deferred tax assets not recognised (d)Income tax losses . . . . . . . . . . . . . . . . . . . . . . . . . . . . . . . . . . . . . . . . . . . . . . 46 55Capital tax losses. . . . . . . . . . . . . . . . . . . . . . . . . . . . . . . . . . . . . . . . . . . . . . . 161 172Deductible temporary differences . . . . . . . . . . . . . . . . . . . . . . . . . . . . . . . . . . . . . . 307 308
514 535
For
per
sona
l use
onl
y
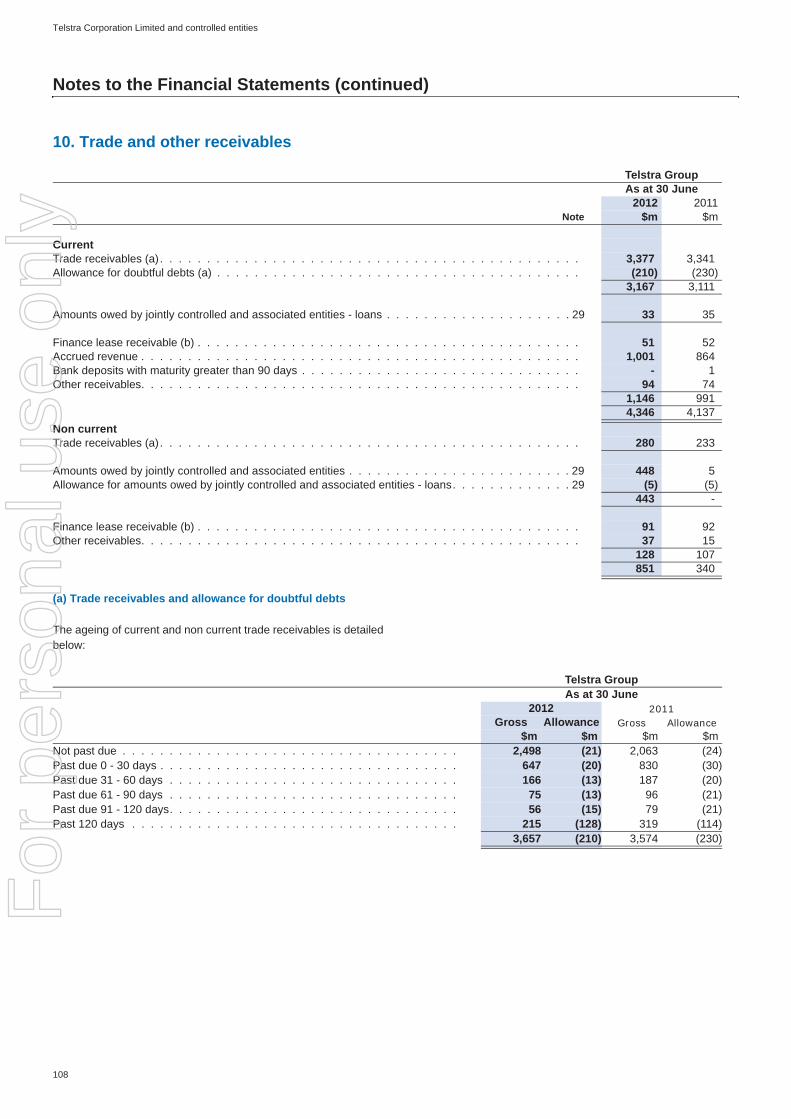
Telstra Corporation Limited and controlled entities
108
Notes to the Financial Statements (continued)
(a) Trade receivables and allowance for doubtful debts
The ageing of current and non current trade receivables is detailed below:
10. Trade and other receivables
Telstra GroupAs at 30 June
2012 2011Note $m $m
CurrentTrade receivables (a). . . . . . . . . . . . . . . . . . . . . . . . . . . . . . . . . . . . . . . . . . . . . 3,377 3,341Allowance for doubtful debts (a) . . . . . . . . . . . . . . . . . . . . . . . . . . . . . . . . . . . . . . . (210) (230)
3,167 3,111
Amounts owed by jointly controlled and associated entities - loans . . . . . . . . . . . . . . . . . . . . 29 33 35
Finance lease receivable (b) . . . . . . . . . . . . . . . . . . . . . . . . . . . . . . . . . . . . . . . . . 51 52Accrued revenue . . . . . . . . . . . . . . . . . . . . . . . . . . . . . . . . . . . . . . . . . . . . . . . 1,001 864Bank deposits with maturity greater than 90 days . . . . . . . . . . . . . . . . . . . . . . . . . . . . . . - 1Other receivables. . . . . . . . . . . . . . . . . . . . . . . . . . . . . . . . . . . . . . . . . . . . . . . 94 74
1,146 9914,346 4,137
Non currentTrade receivables (a). . . . . . . . . . . . . . . . . . . . . . . . . . . . . . . . . . . . . . . . . . . . . 280 233
Amounts owed by jointly controlled and associated entities . . . . . . . . . . . . . . . . . . . . . . . . 29 448 5Allowance for amounts owed by jointly controlled and associated entities - loans. . . . . . . . . . . . . 29 (5) (5)
443 -
Finance lease receivable (b) . . . . . . . . . . . . . . . . . . . . . . . . . . . . . . . . . . . . . . . . . 91 92Other receivables. . . . . . . . . . . . . . . . . . . . . . . . . . . . . . . . . . . . . . . . . . . . . . . 37 15
128 107851 340
Telstra GroupAs at 30 June
2012 2011Gross Allowance Gross Allowance
$m $m $m $mNot past due . . . . . . . . . . . . . . . . . . . . . . . . . . . . . . . . . . . . 2,498 (21) 2,063 (24)Past due 0 - 30 days . . . . . . . . . . . . . . . . . . . . . . . . . . . . . . . . 647 (20) 830 (30)Past due 31 - 60 days . . . . . . . . . . . . . . . . . . . . . . . . . . . . . . . 166 (13) 187 (20)Past due 61 - 90 days . . . . . . . . . . . . . . . . . . . . . . . . . . . . . . . 75 (13) 96 (21)Past due 91 - 120 days. . . . . . . . . . . . . . . . . . . . . . . . . . . . . . . 56 (15) 79 (21)Past 120 days . . . . . . . . . . . . . . . . . . . . . . . . . . . . . . . . . . . 215 (128) 319 (114)
3,657 (210) 3,574 (230)
For
per
sona
l use
onl
y

Telstra Corporation Limited and controlled entities
109
Notes to the Financial Statements (continued)
(a) Trade receivables and allowance for doubtful debts (continued)
The movement in the allowance for doubtful debts in respect of trade receivables is detailed below:
Our policy requires customers to pay us in accordance with agreed payment terms. Depending on the customer segment, our settlement terms are generally 14 to 30 days from date of invoice. All credit and recovery risk associated with trade receivables has been provided for in the statement of financial position.
Our trade receivables include our customer deferred debt and White Pages® directory charges. Our customer deferred debt allows eligible customers the opportunity to repay the cost of their mobile handset, other hardware and approved accessories monthly over 12, 18 or 24 months. The loan is provided interest free to our mobile postpaid customers. Similarly, the White Pages® directory entries can be repaid over 12 months.
Trade receivables have been aged according to their original due date in the above ageing analysis, including where repayment terms for certain long outstanding trade receivables have been renegotiated.
We hold security for a number of trade receivables, including past due or impaired receivables in the form of guarantees, deeds of undertaking, letters of credit and deposits. During fiscal 2012, the securities we called upon were insignificant.
We have used the following basis to assess the allowance loss for trade receivables:
• a statistical approach to apply risk segmentation to the debt, and applying the historical impairment rate to each segment at the end of the reporting period;
• an individual account by account assessment based on past credit history; and
• any prior knowledge of debtor insolvency or other credit risk.
As at 30 June 2012, trade receivables with a carrying amount of $970 million (2011: $1,305 million) for the Telstra Group were past due but not impaired.
These trade receivables, along with our trade receivables that are neither past due nor impaired, comprise customers who have a good debt history and are considered recoverable.
(b) Finance lease receivable
We enter into finance leasing arrangements predominantly for communication assets dedicated to solutions management and outsourcing services that we provide to our customers. The average term of finance leases entered into is between 2 to 5 years (2011: 2 to 5 years).
The interest rate inherent in the leases is fixed at the contract date for the entire lease term. The average effective interest rate contracted is 7.8% (2011: 7.5%) per annum.
10. Trade and other receivables (continued)
Telstra GroupYear ended 30 June
2012 2011$m $m
Opening balance . . . . . . . . . . . . . . . . . . . . . . . . . . . . . . . . . . . . . . . . . . . . . . (230) (231) - additional allowance . . . . . . . . . . . . . . . . . . . . . . . . . . . . . . . . . . . . . . . . . . . . (61) (84) - addition due to acquisition . . . . . . . . . . . . . . . . . . . . . . . . . . . . . . . . . . . . . . . . . - (2) - amount used . . . . . . . . . . . . . . . . . . . . . . . . . . . . . . . . . . . . . . . . . . . . . . . . 4 5 - amount reversed . . . . . . . . . . . . . . . . . . . . . . . . . . . . . . . . . . . . . . . . . . . . . . 74 80 - foreign currency exchange differences. . . . . . . . . . . . . . . . . . . . . . . . . . . . . . . . . . . (1) 2 - transfer of TelstraClear’s balance to assets held for sale . . . . . . . . . . . . . . . . . . . . . . . . . 4 - Closing balance . . . . . . . . . . . . . . . . . . . . . . . . . . . . . . . . . . . . . . . . . . . . . . (210) (230)
Telstra GroupAs at 30 June
2012 2011$m $m
Amounts receivable under finance leasesWithin 1 year. . . . . . . . . . . . . . 59 59Within 1 to 5 years. . . . . . . . . . . 96 99After 5 years . . . . . . . . . . . . . . 5 1Total minimum lease payments . . . . 160 159Less unearned finance income . . . . (18) (15)Present value of minimum lease payments 142 144
Included in the financial statements as:Current finance lease receivables . . . 51 52Non current finance lease receivables 91 92
142 144For
per
sona
l use
onl
y

Telstra Corporation Limited and controlled entities
110
Notes to the Financial Statements (continued)
11. Inventories
Telstra GroupAs at 30 June
2012 2011$m $m
CurrentFinished goods recorded at cost . . . . . . . . . . . . . . . . . . . . . . . . . . . . . . . . . . . . . . . 144 169Finished goods recorded at net realisable value . . . . . . . . . . . . . . . . . . . . . . . . . . . . . . . 60 48Total finished goods . . . . . . . . . . . . . . . . . . . . . . . . . . . . . . . . . . . . . . . . . . . . . 204 217
Raw materials and stores recorded at cost . . . . . . . . . . . . . . . . . . . . . . . . . . . . . . . . . 9 15Construction contracts (a) . . . . . . . . . . . . . . . . . . . . . . . . . . . . . . . . . . . . . . . . . . 47 51
260 283
Non currentFinished goods recorded at net realisable value . . . . . . . . . . . . . . . . . . . . . . . . . . . . . . . 24 22
24 22
(a) Construction contract disclosures are shown as follows:Contract costs incurred and recognised profits . . . . . . . . . . . . . . . . . . . . . . . . . . . . . . . 478 353Progress billings . . . . . . . . . . . . . . . . . . . . . . . . . . . . . . . . . . . . . . . . . . . . . . . (432) (302)
46 51
For
per
sona
l use
onl
y

Telstra Corporation Limited and controlled entities
111
Notes to the Financial Statements (continued)
On 12 July 2012, we signed an agreement to dispose of our 100% shareholding in TelstraClear Limited and its controlled entity (TelstraClear). In accordance with AASB 5: “Non-current Assets Held for Sale and Discontinued Operations” as at 30 June 2012 the carrying value of assets and liabilities of TelstraClear have been classified as held for sale, with the exception of cash balances which are excluded from the sale agreement, and measured at the lower of carrying amount and fair value less costs to sell.
Based on the sale price of $658 million (NZ$840 million), estimated completion adjustments and subject to final completion adjustments, the carrying value of the TelstraClear goodwill was impaired by $130 million. Refer to note 21 for further details.
The conditions precedent to completion of the disposal include approval from the New Zealand Commerce Commission, Overseas Investment Office and Ministry of Business, Innovation and Employment.
If the conditions precedent are satisfied and the disposal of TelstraClear occurs, in fiscal 2013 the foreign currency translation reserve arising from our investment in TelstraClear will be reclassified to the Telstra Group income statement increasing our loss on disposal. The foreign currency translation reserve balance at 30 June 2012 was $130 million. Refer to note 31 for further details.
TelstraClear’s operating and investing cash flows were $107 million inflow (2011: $108 million) and an outflow of $51 million (2011: $57 million) respectively. The investing cash outflows exclude the related party transactions disclosed in note 29.
At 30 June 2011, we were committed to dispose of our 64.4% shareholding in Adstream (Aust) Pty Ltd (Adstream). The disposal was subsequently completed on 21 July 2011. Refer to note 20 for further details.
TelstraClear is included in the TelstraClear reportable segment and Adstream is included in the Telstra Media Group reportable segment in our segment information disclosures in note 5.
12. Non current assets held for sale
Telstra GroupAs at 30 June
2012 2011Note $m $m
Current assetsCash and cash equivalents. . . . . . . . . . . . . . . . . . . . . . . . . . . . . . . . . . . . . . . . . 20 - 7Trade and other receivables . . . . . . . . . . . . . . . . . . . . . . . . . . . . . . . . . . . . . . . . . 73 3Inventories . . . . . . . . . . . . . . . . . . . . . . . . . . . . . . . . . . . . . . . . . . . . . . . . . . 2 -Prepayments . . . . . . . . . . . . . . . . . . . . . . . . . . . . . . . . . . . . . . . . . . . . . . . . . 8 -Total current assets. . . . . . . . . . . . . . . . . . . . . . . . . . . . . . . . . . . . . . . . . . . . . . 83 10Non current assetsProperty, plant and equipment . . . . . . . . . . . . . . . . . . . . . . . . . . . . . . . . . . . . . . . 13 516 1Intangible assets . . . . . . . . . . . . . . . . . . . . . . . . . . . . . . . . . . . . . . . . . . . . . . 14 155 29Deferred tax assets. . . . . . . . . . . . . . . . . . . . . . . . . . . . . . . . . . . . . . . . . . . . . . - 1Total non current assets . . . . . . . . . . . . . . . . . . . . . . . . . . . . . . . . . . . . . . . . . . . 671 31Total assets . . . . . . . . . . . . . . . . . . . . . . . . . . . . . . . . . . . . . . . . . . . . . . . . . 754 41
Current liabilitiesTrade and other payables . . . . . . . . . . . . . . . . . . . . . . . . . . . . . . . . . . . . . . . . . . 70 2Provisions . . . . . . . . . . . . . . . . . . . . . . . . . . . . . . . . . . . . . . . . . . . . . . . . . . 6 1Revenue received in advance . . . . . . . . . . . . . . . . . . . . . . . . . . . . . . . . . . . . . . . . 26 1Total current liabilities . . . . . . . . . . . . . . . . . . . . . . . . . . . . . . . . . . . . . . . . . . . . 102 4Non current liabilitiesProvisions . . . . . . . . . . . . . . . . . . . . . . . . . . . . . . . . . . . . . . . . . . . . . . . . . . 3 -Deferred tax liabilities . . . . . . . . . . . . . . . . . . . . . . . . . . . . . . . . . . . . . . . . . . . . - 1Total non current liabilities . . . . . . . . . . . . . . . . . . . . . . . . . . . . . . . . . . . . . . . . . . 3 1Total liabilities . . . . . . . . . . . . . . . . . . . . . . . . . . . . . . . . . . . . . . . . . . . . . . . . 105 5Net assets . . . . . . . . . . . . . . . . . . . . . . . . . . . . . . . . . . . . . . . . . . . . . . . . . . 649 36F
or p
erso
nal u
se o
nly

Telstra Corporation Limited and controlled entities
112
Notes to the Financial Statements (continued)
13. Property, plant and equipment
Telstra GroupAs at 30 June
2012 2011$m $m
Land and site improvementsAt cost . . . . . . . . . . . . . . . . . . . . . . . . . . . . . . . . . . . . . . . . . . . . . . . . . . . . 38 40
Buildings (including leasehold improvements)At cost . . . . . . . . . . . . . . . . . . . . . . . . . . . . . . . . . . . . . . . . . . . . . . . . . . . . 1,077 1,040Accumulated depreciation and impairment. . . . . . . . . . . . . . . . . . . . . . . . . . . . . . . . . . (536) (541)
541 499
Communication assets (including leasehold improvements)At cost . . . . . . . . . . . . . . . . . . . . . . . . . . . . . . . . . . . . . . . . . . . . . . . . . . . . 56,353 56,025Accumulated depreciation and impairment. . . . . . . . . . . . . . . . . . . . . . . . . . . . . . . . . . (36,921) (35,397)
19,432 20,628
Communication assets under finance leaseAt cost . . . . . . . . . . . . . . . . . . . . . . . . . . . . . . . . . . . . . . . . . . . . . . . . . . . . 266 287Accumulated depreciation and impairment. . . . . . . . . . . . . . . . . . . . . . . . . . . . . . . . . . (257) (272)
9 15
Other plant, equipment and motor vehiclesAt cost . . . . . . . . . . . . . . . . . . . . . . . . . . . . . . . . . . . . . . . . . . . . . . . . . . . . 1,604 1,667Accumulated depreciation and impairment. . . . . . . . . . . . . . . . . . . . . . . . . . . . . . . . . . (1,120) (1,059)
484 608
Equipment under finance leaseAt cost . . . . . . . . . . . . . . . . . . . . . . . . . . . . . . . . . . . . . . . . . . . . . . . . . . . . 1 1Accumulated depreciation and impairment. . . . . . . . . . . . . . . . . . . . . . . . . . . . . . . . . . (1) (1)
- -
Total property, plant and equipmentAt cost . . . . . . . . . . . . . . . . . . . . . . . . . . . . . . . . . . . . . . . . . . . . . . . . . . . . 59,339 59,060Accumulated depreciation and impairment. . . . . . . . . . . . . . . . . . . . . . . . . . . . . . . . . . (38,835) (37,270)
20,504 21,790
For
per
sona
l use
onl
y
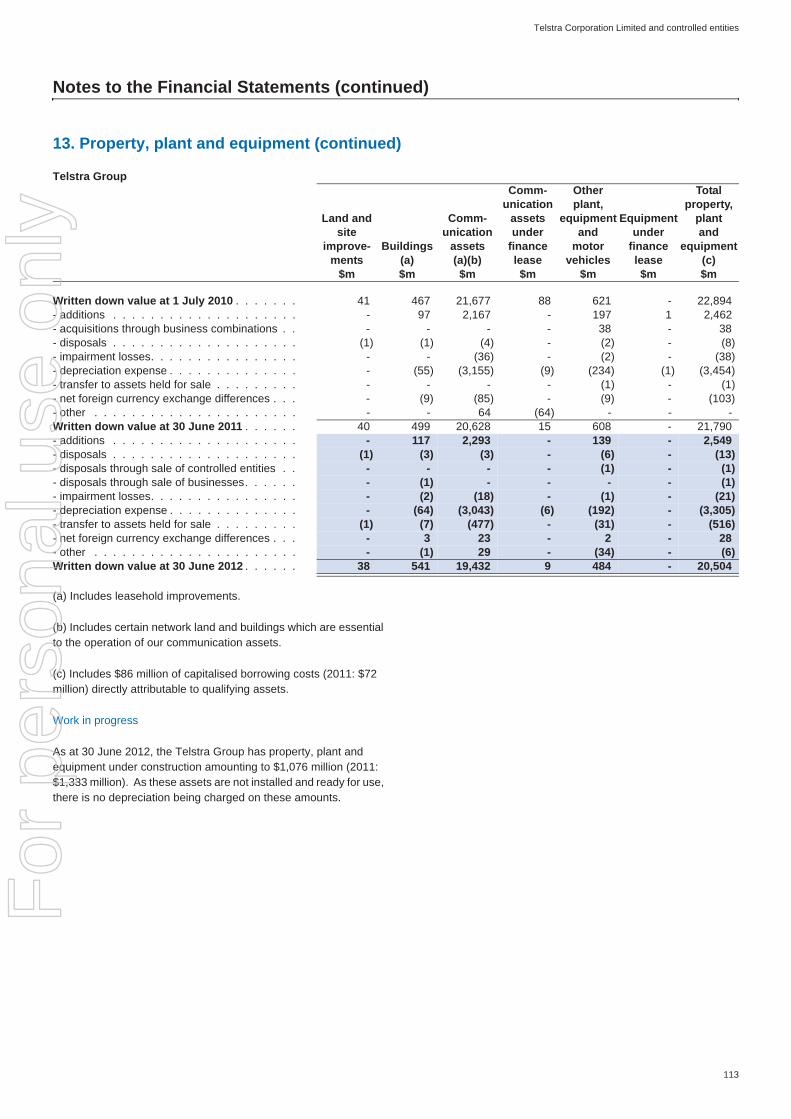
Telstra Corporation Limited and controlled entities
113
Notes to the Financial Statements (continued)
(a) Includes leasehold improvements.
(b) Includes certain network land and buildings which are essential to the operation of our communication assets.
(c) Includes $86 million of capitalised borrowing costs (2011: $72 million) directly attributable to qualifying assets.
Work in progress
As at 30 June 2012, the Telstra Group has property, plant and equipment under construction amounting to $1,076 million (2011: $1,333 million). As these assets are not installed and ready for use, there is no depreciation being charged on these amounts.
13. Property, plant and equipment (continued)
Telstra GroupComm- Other Total
unication plant, property,Land and Comm- assets equipment Equipment plant
site unication under and under andimprove- Buildings assets finance motor finance equipment
ments (a) (a)(b) lease vehicles lease (c)$m $m $m $m $m $m $m
Written down value at 1 July 2010 . . . . . . . 41 467 21,677 88 621 - 22,894- additions . . . . . . . . . . . . . . . . . . . . - 97 2,167 - 197 1 2,462- acquisitions through business combinations . . - - - - 38 - 38- disposals . . . . . . . . . . . . . . . . . . . . (1) (1) (4) - (2) - (8)- impairment losses. . . . . . . . . . . . . . . . - - (36) - (2) - (38)- depreciation expense . . . . . . . . . . . . . . - (55) (3,155) (9) (234) (1) (3,454)- transfer to assets held for sale . . . . . . . . . - - - - (1) - (1)- net foreign currency exchange differences . . . - (9) (85) - (9) - (103)- other . . . . . . . . . . . . . . . . . . . . . . - - 64 (64) - - -Written down value at 30 June 2011 . . . . . . 40 499 20,628 15 608 - 21,790- additions . . . . . . . . . . . . . . . . . . . . - 117 2,293 - 139 - 2,549- disposals . . . . . . . . . . . . . . . . . . . . (1) (3) (3) - (6) - (13)- disposals through sale of controlled entities . . - - - - (1) - (1)- disposals through sale of businesses. . . . . . - (1) - - - - (1)- impairment losses. . . . . . . . . . . . . . . . - (2) (18) - (1) - (21)- depreciation expense . . . . . . . . . . . . . . - (64) (3,043) (6) (192) - (3,305)- transfer to assets held for sale . . . . . . . . . (1) (7) (477) - (31) - (516)- net foreign currency exchange differences . . . - 3 23 - 2 - 28- other . . . . . . . . . . . . . . . . . . . . . . - (1) 29 - (34) - (6)Written down value at 30 June 2012 . . . . . . 38 541 19,432 9 484 - 20,504
For
per
sona
l use
onl
y

Telstra Corporation Limited and controlled entities
114
Notes to the Financial Statements (continued)
14. Intangible assets
Telstra GroupAs at 30 June
2012 2011$m $m
Goodwill . . . . . . . . . . . . . . . . . . . . . . . . . . . . . . . . . . . . . . . . . . . . . . . . . . . 1,289 1,415
Internally generated intangible assetsSoftware assets developed for internal use (a) . . . . . . . . . . . . . . . . . . . . . . . . . . . . . . . 8,201 7,499Accumulated amortisation and impairment. . . . . . . . . . . . . . . . . . . . . . . . . . . . . . . . . . (3,388) (2,843)
4,813 4,656Acquired intangible assetsMastheads . . . . . . . . . . . . . . . . . . . . . . . . . . . . . . . . . . . . . . . . . . . . . . . . . . 337 337Accumulated amortisation and impairment. . . . . . . . . . . . . . . . . . . . . . . . . . . . . . . . . . (202) (135)
135 202
Patents and trademarks . . . . . . . . . . . . . . . . . . . . . . . . . . . . . . . . . . . . . . . . . . . 34 36Accumulated amortisation and impairment. . . . . . . . . . . . . . . . . . . . . . . . . . . . . . . . . . (12) (11)
22 25
Licences . . . . . . . . . . . . . . . . . . . . . . . . . . . . . . . . . . . . . . . . . . . . . . . . . . . 770 810Accumulated amortisation and impairment. . . . . . . . . . . . . . . . . . . . . . . . . . . . . . . . . . (491) (459)
279 351
Customer bases . . . . . . . . . . . . . . . . . . . . . . . . . . . . . . . . . . . . . . . . . . . . . . . 157 643Accumulated amortisation and impairment. . . . . . . . . . . . . . . . . . . . . . . . . . . . . . . . . . (142) (485)
15 158
Brand names . . . . . . . . . . . . . . . . . . . . . . . . . . . . . . . . . . . . . . . . . . . . . . . . . 161 193Accumulated amortisation and impairment. . . . . . . . . . . . . . . . . . . . . . . . . . . . . . . . . . (82) (87)
79 106Total acquired intangible assets . . . . . . . . . . . . . . . . . . . . . . . . . . . . . . . . . . . . . . 530 842
Deferred expenditureDeferred expenditure . . . . . . . . . . . . . . . . . . . . . . . . . . . . . . . . . . . . . . . . . . . . . 1,286 1,494Accumulated amortisation and impairment. . . . . . . . . . . . . . . . . . . . . . . . . . . . . . . . . . (497) (780)
789 714Total intangible assetsAt cost . . . . . . . . . . . . . . . . . . . . . . . . . . . . . . . . . . . . . . . . . . . . . . . . . . . . 12,235 12,427Accumulated amortisation and impairment. . . . . . . . . . . . . . . . . . . . . . . . . . . . . . . . . . (4,814) (4,800)
7,421 7,627
For
per
sona
l use
onl
y
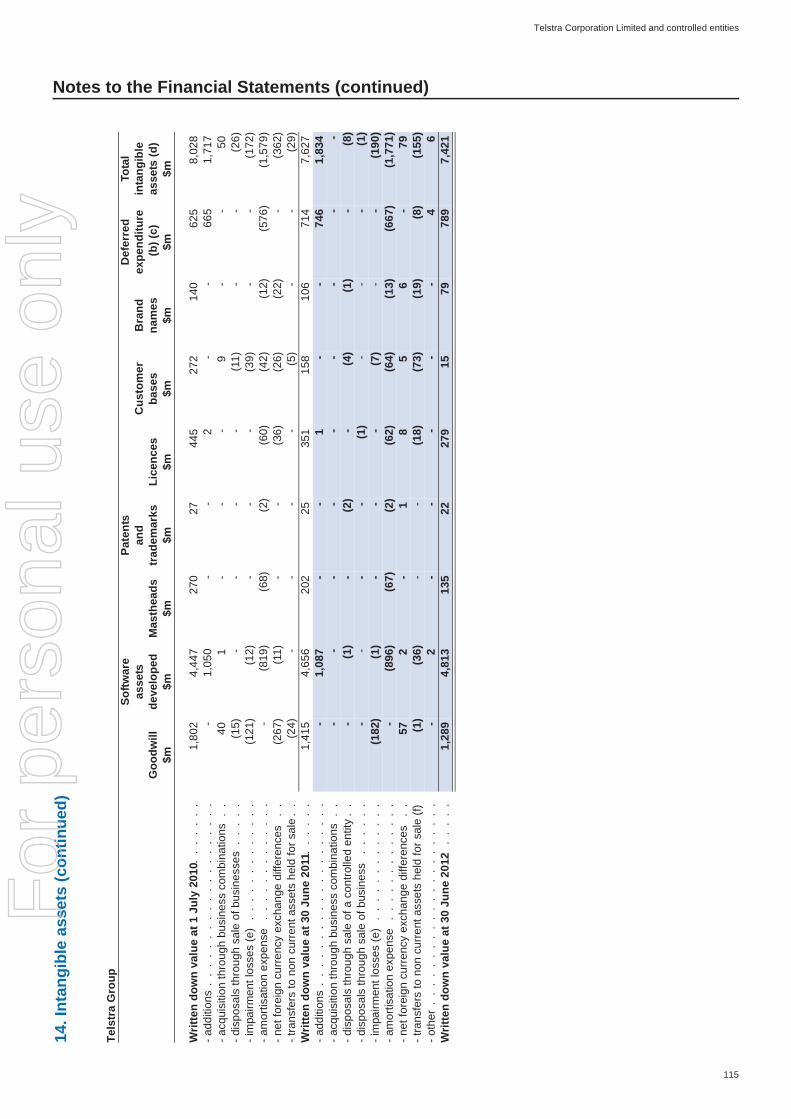
Telstra Corporation Limited and controlled entities
115
Notes to the Financial Statements (continued)14
. Int
angi
ble
asse
ts (c
ontin
ued)
Tels
tra
Gro
upSo
ftwar
ePa
tent
sD
efer
red
Tota
las
sets
and
Cus
tom
erB
rand
expe
nditu
rein
tang
ible
Goo
dwill
deve
lope
dM
asth
eads
trad
emar
ksLi
cenc
esba
ses
nam
es (b
) (c)
asse
ts (d
) $m
$m$m
$m$m
$m$m
$m$m
Writ
ten
dow
n va
lue
at 1
Jul
y 20
10 . .
. .
. .
. .
1,80
24,
447
270
2744
527
214
062
58,
028
- add
ition
s .
. .
. .
. .
. .
. .
. .
. .
. .
. .
.-
1,05
0-
-2
--
665
1,71
7- a
cqui
sitio
n th
roug
h bu
sine
ss c
ombi
natio
ns .
.40
1-
--
9-
-50
- dis
posa
ls th
roug
h sa
le o
f bus
ines
ses
. .
. .
.(1
5)-
--
-(1
1)-
-(2
6)- i
mpa
irmen
t los
ses
(e)
. .
. .
. .
. .
. .
. .
.(1
21)
(12)
--
-(3
9)-
-(1
72)
- am
ortis
atio
n ex
pens
e .
. .
. .
. .
. .
. .
. .
-(8
19)
(68)
(2)
(60)
(42)
(12)
(576
)(1
,579
)- n
et fo
reig
n cu
rren
cy e
xcha
nge
diffe
renc
es .
.(2
67)
(11)
--
(36)
(26)
(22)
-(3
62)
- tra
nsfe
rs to
non
cur
rent
ass
ets
held
for s
ale
. .
(24)
--
--
(5)
--
(29)
Writ
ten
dow
n va
lue
at 3
0 Ju
ne 2
011
. .
. .
. .
.1,
415
4,65
620
225
351
158
106
714
7,62
7- a
dditi
ons
. .
. .
. .
. .
. .
. .
. .
. .
. .
. .
-1,
087
--
1-
-74
61,
834
- acq
uisi
tion
thro
ugh
busi
ness
com
bina
tions
. .
--
--
--
--
-- d
ispo
sals
thro
ugh
sale
of a
con
trolle
d en
tity
. .
-(1
)-
(2)
-(4
)(1
)-
(8)
- dis
posa
ls th
roug
h sa
le o
f bus
ines
s .
. .
. .
.-
--
-(1
)-
--
(1)
- im
pairm
ent l
osse
s (e
) .
. .
. .
. .
. .
. .
. .
(182
)(1
)-
--
(7)
--
(190
)- a
mor
tisat
ion
expe
nse
. .
. .
. .
. .
. .
. .
.-
(896
)(6
7)(2
)(6
2)(6
4)(1
3)(6
67)
(1,7
71)
- net
fore
ign
curr
ency
exc
hang
e di
ffere
nces
. .
572
-1
85
6-
79- t
rans
fers
to n
on c
urre
nt a
sset
s he
ld fo
r sal
e (f)
(1)
(36)
--
(18)
(73)
(19)
(8)
(155
)- o
ther
. .
. .
. .
. .
. .
. .
. .
. .
. .
. .
. .
-2
--
--
-4
6W
ritte
n do
wn
valu
e at
30
June
201
2 .
. .
. .
1,28
94,
813
135
2227
915
7978
97,
421
For
per
sona
l use
onl
y

Telstra Corporation Limited and controlled entities
116
Notes to the Financial Statements (continued)
(a) As at June 2012, we had software assets under development amounting to $509 million (2011: $593 million). As these assets were not installed and ready for use, there is no amortisation being charged on the amounts.
(b) During fiscal 2005, we entered into an arrangement with our jointly controlled entity, Reach Ltd (Reach), and our co-shareholder PCCW, whereby Reach's international cable capacity was allocated between us and PCCW under an indefeasible right of use (IRU) agreement, including committed capital expenditure for the period until 2018.
The IRU is amortised over the contract periods for the capacity on the various international cable systems, which range from 5 to 22 years. The IRU is deemed to be an extension of our investment in Reach. The IRU has a carrying value of nil in the consolidated financial statements due to the recognition of equity accounted losses in Reach.
(c) The majority of the deferred expenditure relates to the deferral of basic access installation costs, which are amortised to goods and services purchased in the income statement. In addition, the deferred expenditure also includes direct incremental costs of establishing a customer contract.
(d) Includes $42 million (2011: $32 million) of capitalised borrowing costs directly attributable to qualifying assets.
(e) We have recognised an impairment charge of $189 million against goodwill ($182 million) and customer bases ($7 million) for the TelstraClear, LMobile Group and CitySearch CGUs (2011: $160 million against goodwill ($121 million) and customer bases ($39 million) for the Octave and LMobile Group CGUs). Refer to note 21 for further details regarding these impairments.
(f) As at 30 June 2012 assets and liabilities of TelstraClear Limited have been classified as held for sale. Refer to note 12 for further details.
14. Intangible assets (continued)
For
per
sona
l use
onl
y
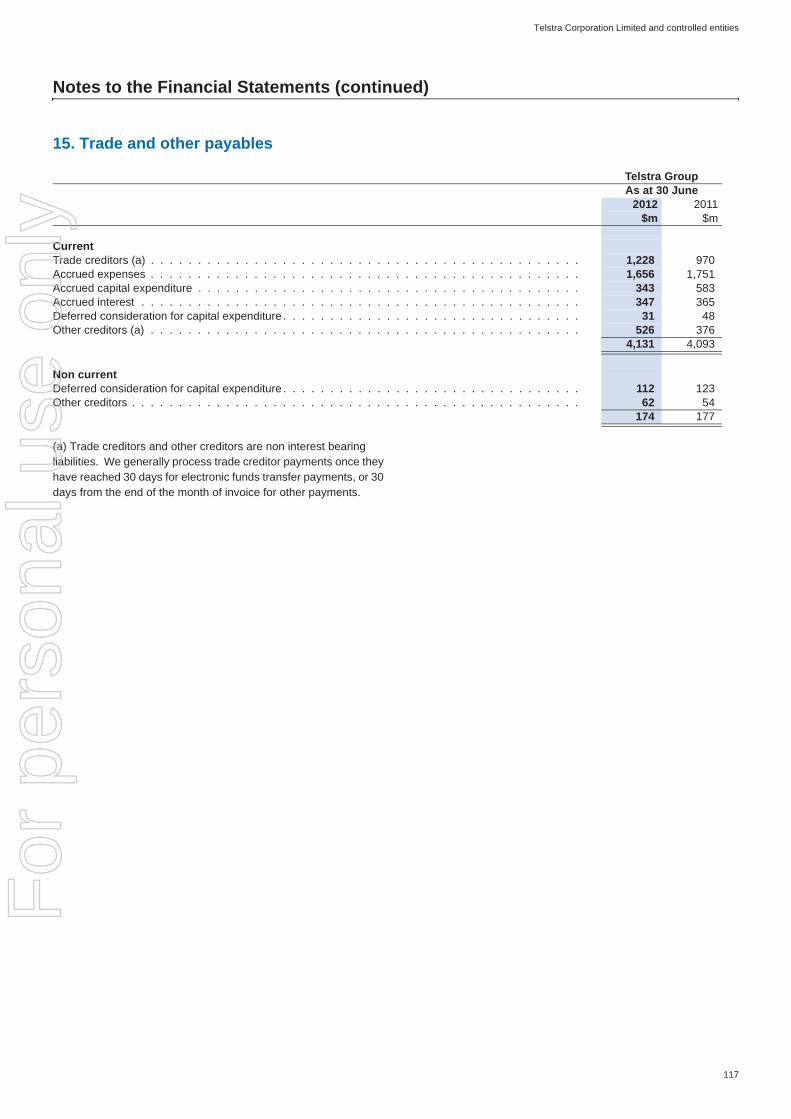
Telstra Corporation Limited and controlled entities
117
Notes to the Financial Statements (continued)
(a) Trade creditors and other creditors are non interest bearing liabilities. We generally process trade creditor payments once they have reached 30 days for electronic funds transfer payments, or 30 days from the end of the month of invoice for other payments.
15. Trade and other payables
Telstra GroupAs at 30 June
2012 2011$m $m
CurrentTrade creditors (a) . . . . . . . . . . . . . . . . . . . . . . . . . . . . . . . . . . . . . . . . . . . . . . 1,228 970Accrued expenses . . . . . . . . . . . . . . . . . . . . . . . . . . . . . . . . . . . . . . . . . . . . . . 1,656 1,751Accrued capital expenditure . . . . . . . . . . . . . . . . . . . . . . . . . . . . . . . . . . . . . . . . . 343 583Accrued interest . . . . . . . . . . . . . . . . . . . . . . . . . . . . . . . . . . . . . . . . . . . . . . . 347 365Deferred consideration for capital expenditure . . . . . . . . . . . . . . . . . . . . . . . . . . . . . . . . 31 48Other creditors (a) . . . . . . . . . . . . . . . . . . . . . . . . . . . . . . . . . . . . . . . . . . . . . . 526 376
4,131 4,093
Non currentDeferred consideration for capital expenditure . . . . . . . . . . . . . . . . . . . . . . . . . . . . . . . . 112 123Other creditors . . . . . . . . . . . . . . . . . . . . . . . . . . . . . . . . . . . . . . . . . . . . . . . . 62 54
174 177
For
per
sona
l use
onl
y
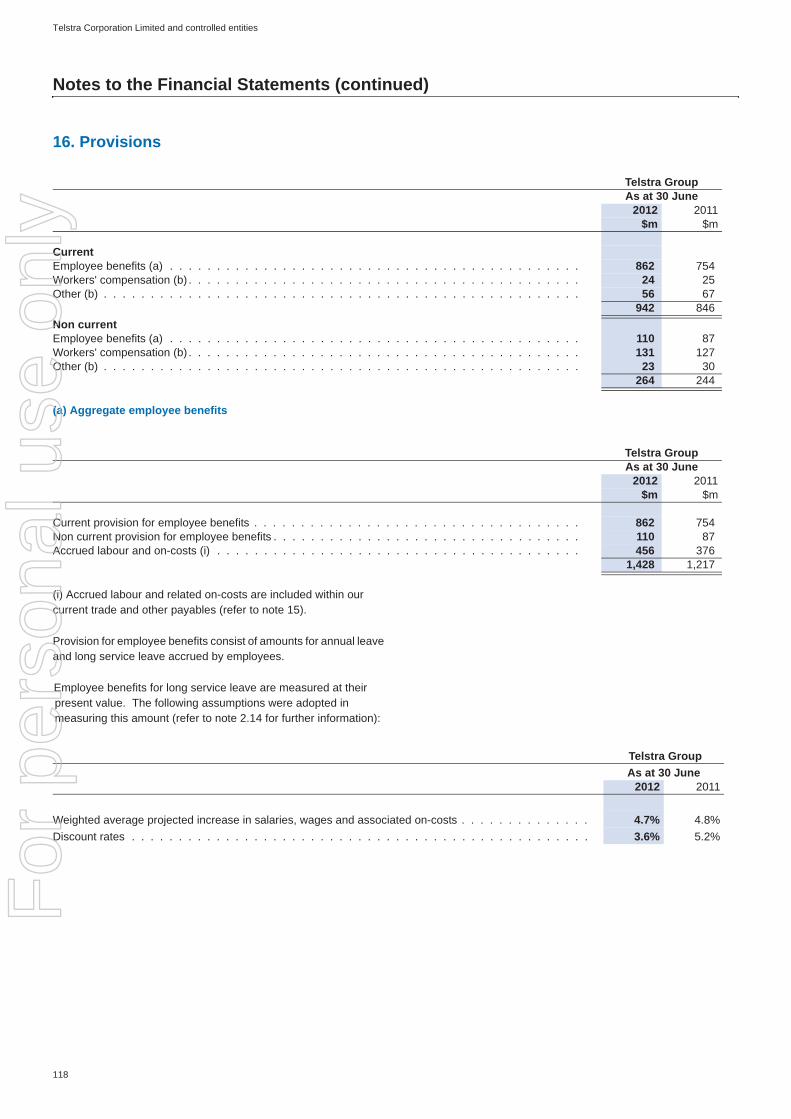
Telstra Corporation Limited and controlled entities
118
Notes to the Financial Statements (continued)
(a) Aggregate employee benefits
(i) Accrued labour and related on-costs are included within our current trade and other payables (refer to note 15).
Provision for employee benefits consist of amounts for annual leave and long service leave accrued by employees.
Employee benefits for long service leave are measured at their present value. The following assumptions were adopted in measuring this amount (refer to note 2.14 for further information):
16. Provisions
Telstra GroupAs at 30 June
2012 2011$m $m
CurrentEmployee benefits (a) . . . . . . . . . . . . . . . . . . . . . . . . . . . . . . . . . . . . . . . . . . . . 862 754Workers' compensation (b) . . . . . . . . . . . . . . . . . . . . . . . . . . . . . . . . . . . . . . . . . . 24 25Other (b) . . . . . . . . . . . . . . . . . . . . . . . . . . . . . . . . . . . . . . . . . . . . . . . . . . . 56 67
942 846Non currentEmployee benefits (a) . . . . . . . . . . . . . . . . . . . . . . . . . . . . . . . . . . . . . . . . . . . . 110 87Workers' compensation (b) . . . . . . . . . . . . . . . . . . . . . . . . . . . . . . . . . . . . . . . . . . 131 127Other (b) . . . . . . . . . . . . . . . . . . . . . . . . . . . . . . . . . . . . . . . . . . . . . . . . . . . 23 30
264 244
Telstra GroupAs at 30 June
2012 2011$m $m
Current provision for employee benefits . . . . . . . . . . . . . . . . . . . . . . . . . . . . . . . . . . . 862 754Non current provision for employee benefits . . . . . . . . . . . . . . . . . . . . . . . . . . . . . . . . . 110 87Accrued labour and on-costs (i) . . . . . . . . . . . . . . . . . . . . . . . . . . . . . . . . . . . . . . . 456 376
1,428 1,217
Telstra GroupAs at 30 June
2012 2011
Weighted average projected increase in salaries, wages and associated on-costs . . . . . . . . . . . . . . 4.7% 4.8%Discount rates . . . . . . . . . . . . . . . . . . . . . . . . . . . . . . . . . . . . . . . . . . . . . . . . . 3.6% 5.2%
For
per
sona
l use
onl
y

Telstra Corporation Limited and controlled entities
119
Notes to the Financial Statements (continued)
(b) Movement in provisions, other than employee benefits
(i) Workers’ compensation
We self insure for our workers’ compensation liabilities. We provide for our obligations through an assessment of accidents and estimated claims incurred. The provision is based on a semi-annual actuarial review of our workers’ compensation liability. Actual compensation paid may vary where accidents and claims incurred vary from those estimated. The timing of these payments may vary, however the average time payments are expected for is 9 years (2011: 9 years).
Certain controlled entities do not self insure, but pay annual premiums to third party insurance companies for their workers’ compensation.
(ii) Other
Other provisions include provisions for ACCC customer determinations and disputes, provision for non current lease incentives, provision for committed capital expenditure, provision for reinstatement costs, and other provisions.
16. Provisions (continued)
Telstra GroupYear ended 30 June
2012 2011$m $m
Workers' compensation (i)
Opening balance . . . . . . . . . . . . . . . . . . . . . . . . . . . . . . . . . . . . . . . . . . . . . . 152 165- additional provisions . . . . . . . . . . . . . . . . . . . . . . . . . . . . . . . . . . . . . . . . . . . . 4 7- amount used . . . . . . . . . . . . . . . . . . . . . . . . . . . . . . . . . . . . . . . . . . . . . . . . (23) (27)- unwinding of discount on liabilities recognised at present value . . . . . . . . . . . . . . . . . . . . . . 7 8- effect of any change in the discount rate . . . . . . . . . . . . . . . . . . . . . . . . . . . . . . . . . . 16 (1)- reversal of amounts unused . . . . . . . . . . . . . . . . . . . . . . . . . . . . . . . . . . . . . . . . (1) -Closing balance . . . . . . . . . . . . . . . . . . . . . . . . . . . . . . . . . . . . . . . . . . . . . . . 155 152
Redundancy
Opening balance . . . . . . . . . . . . . . . . . . . . . . . . . . . . . . . . . . . . . . . . . . . . . . - -- additional provisions . . . . . . . . . . . . . . . . . . . . . . . . . . . . . . . . . . . . . . . . . . . . 6 -Closing balance . . . . . . . . . . . . . . . . . . . . . . . . . . . . . . . . . . . . . . . . . . . . . . . 6 -
Other (ii)
Opening balance . . . . . . . . . . . . . . . . . . . . . . . . . . . . . . . . . . . . . . . . . . . . . . 97 106- additional provisions . . . . . . . . . . . . . . . . . . . . . . . . . . . . . . . . . . . . . . . . . . . . 39 54- amount used . . . . . . . . . . . . . . . . . . . . . . . . . . . . . . . . . . . . . . . . . . . . . . . . (53) (60)- effect of any change on discount rate. . . . . . . . . . . . . . . . . . . . . . . . . . . . . . . . . . . . 1 1- reversal of amounts unused . . . . . . . . . . . . . . . . . . . . . . . . . . . . . . . . . . . . . . . . - (1)- foreign currency exchange differences . . . . . . . . . . . . . . . . . . . . . . . . . . . . . . . . . . . 1 (4)- transfer to non current assets held for sale . . . . . . . . . . . . . . . . . . . . . . . . . . . . . . . . . (5) -- other . . . . . . . . . . . . . . . . . . . . . . . . . . . . . . . . . . . . . . . . . . . . . . . . . . . . (1) 1Closing balance . . . . . . . . . . . . . . . . . . . . . . . . . . . . . . . . . . . . . . . . . . . . . . . 79 97
For
per
sona
l use
onl
y
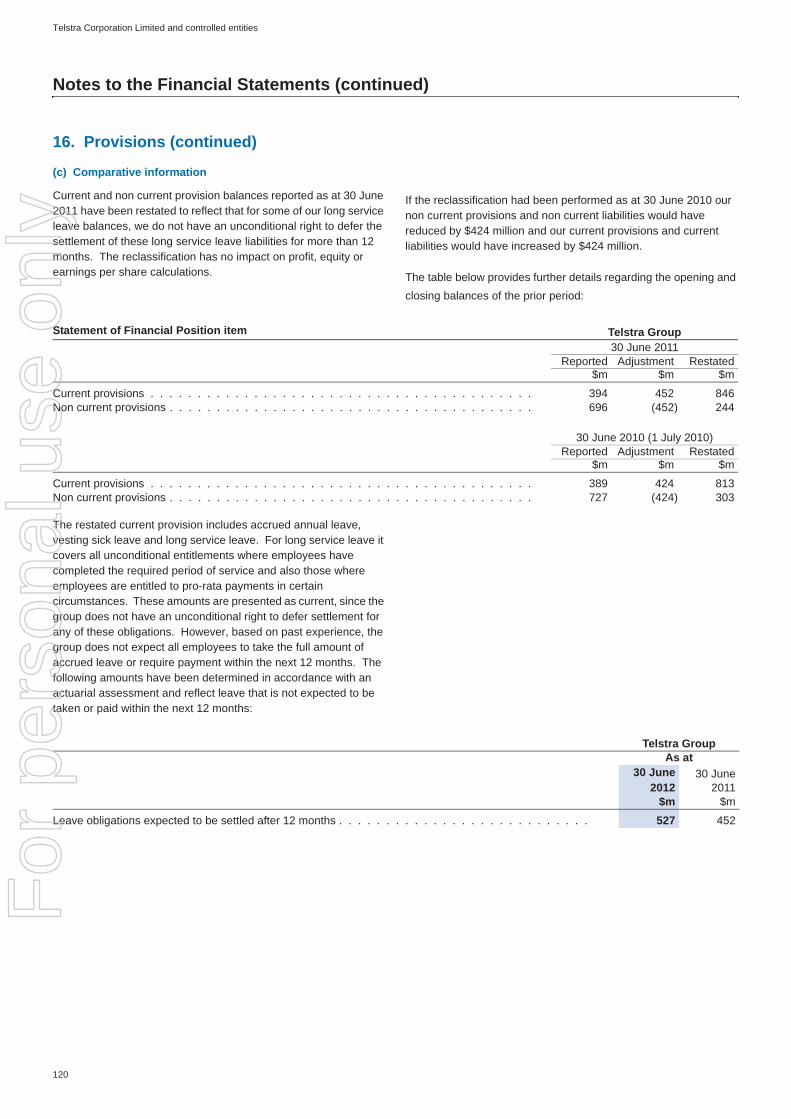
Telstra Corporation Limited and controlled entities
120
Notes to the Financial Statements (continued)
(c) Comparative information
Current and non current provision balances reported as at 30 June 2011 have been restated to reflect that for some of our long service leave balances, we do not have an unconditional right to defer the settlement of these long service leave liabilities for more than 12 months. The reclassification has no impact on profit, equity or earnings per share calculations.
If the reclassification had been performed as at 30 June 2010 our non current provisions and non current liabilities would have reduced by $424 million and our current provisions and current liabilities would have increased by $424 million.
The table below provides further details regarding the opening and closing balances of the prior period:
The restated current provision includes accrued annual leave, vesting sick leave and long service leave. For long service leave it covers all unconditional entitlements where employees have completed the required period of service and also those where employees are entitled to pro-rata payments in certain circumstances. These amounts are presented as current, since the group does not have an unconditional right to defer settlement for any of these obligations. However, based on past experience, the group does not expect all employees to take the full amount of accrued leave or require payment within the next 12 months. The following amounts have been determined in accordance with an actuarial assessment and reflect leave that is not expected to be taken or paid within the next 12 months:
16. Provisions (continued)
Statement of Financial Position item Telstra Group30 June 2011
Reported Adjustment Restated$m $m $m
Current provisions . . . . . . . . . . . . . . . . . . . . . . . . . . . . . . . . . . . . . . . . . 394 452 846Non current provisions . . . . . . . . . . . . . . . . . . . . . . . . . . . . . . . . . . . . . . . 696 (452) 244
30 June 2010 (1 July 2010)Reported Adjustment Restated
$m $m $m
Current provisions . . . . . . . . . . . . . . . . . . . . . . . . . . . . . . . . . . . . . . . . . 389 424 813Non current provisions . . . . . . . . . . . . . . . . . . . . . . . . . . . . . . . . . . . . . . . 727 (424) 303
Telstra GroupAs at
30 June2012
30 June2011
$m $m
Leave obligations expected to be settled after 12 months . . . . . . . . . . . . . . . . . . . . . . . . . . . 527 452
For
per
sona
l use
onl
y
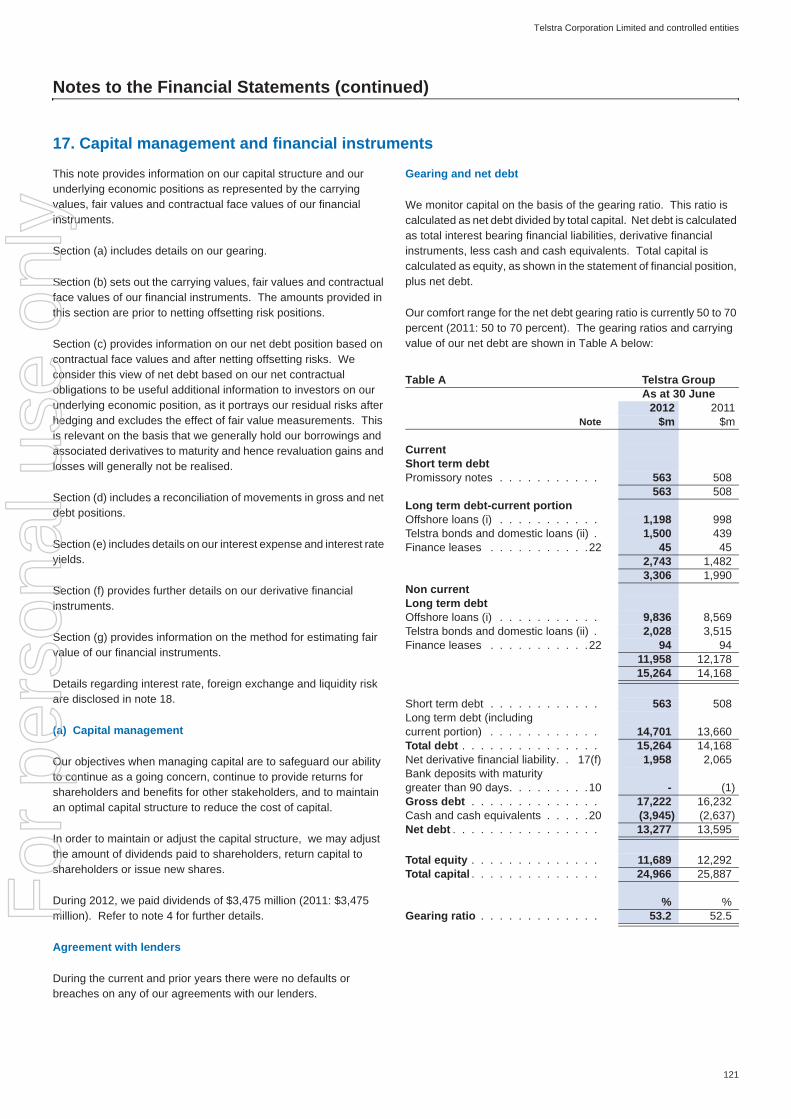
Telstra Corporation Limited and controlled entities
121
Notes to the Financial Statements (continued)
This note provides information on our capital structure and our underlying economic positions as represented by the carrying values, fair values and contractual face values of our financial instruments.
Section (a) includes details on our gearing.
Section (b) sets out the carrying values, fair values and contractual face values of our financial instruments. The amounts provided in this section are prior to netting offsetting risk positions.
Section (c) provides information on our net debt position based on contractual face values and after netting offsetting risks. We consider this view of net debt based on our net contractual obligations to be useful additional information to investors on our underlying economic position, as it portrays our residual risks after hedging and excludes the effect of fair value measurements. This is relevant on the basis that we generally hold our borrowings and associated derivatives to maturity and hence revaluation gains and losses will generally not be realised.
Section (d) includes a reconciliation of movements in gross and net debt positions.
Section (e) includes details on our interest expense and interest rate yields.
Section (f) provides further details on our derivative financial instruments.
Section (g) provides information on the method for estimating fair value of our financial instruments.
Details regarding interest rate, foreign exchange and liquidity risk are disclosed in note 18.
(a) Capital management
Our objectives when managing capital are to safeguard our ability to continue as a going concern, continue to provide returns for shareholders and benefits for other stakeholders, and to maintain an optimal capital structure to reduce the cost of capital.
In order to maintain or adjust the capital structure, we may adjust the amount of dividends paid to shareholders, return capital to shareholders or issue new shares.
During 2012, we paid dividends of $3,475 million (2011: $3,475 million). Refer to note 4 for further details.
Agreement with lenders
During the current and prior years there were no defaults or breaches on any of our agreements with our lenders.
Gearing and net debt
We monitor capital on the basis of the gearing ratio. This ratio is calculated as net debt divided by total capital. Net debt is calculated as total interest bearing financial liabilities, derivative financial instruments, less cash and cash equivalents. Total capital is calculated as equity, as shown in the statement of financial position, plus net debt.
Our comfort range for the net debt gearing ratio is currently 50 to 70 percent (2011: 50 to 70 percent). The gearing ratios and carrying value of our net debt are shown in Table A below:
17. Capital management and financial instruments
Table A Telstra GroupAs at 30 June
2012 2011Note $m $m
CurrentShort term debtPromissory notes . . . . . . . . . . . 563 508
563 508Long term debt-current portionOffshore loans (i) . . . . . . . . . . . 1,198 998Telstra bonds and domestic loans (ii) . 1,500 439Finance leases . . . . . . . . . . .22 45 45
2,743 1,4823,306 1,990
Non currentLong term debtOffshore loans (i) . . . . . . . . . . . 9,836 8,569Telstra bonds and domestic loans (ii) . 2,028 3,515Finance leases . . . . . . . . . . .22 94 94
11,958 12,17815,264 14,168
Short term debt . . . . . . . . . . . . 563 508Long term debt (includingcurrent portion) . . . . . . . . . . . . 14,701 13,660Total debt . . . . . . . . . . . . . . . 15,264 14,168Net derivative financial liability. . 17(f) 1,958 2,065Bank deposits with maturitygreater than 90 days. . . . . . . . .10 - (1)Gross debt . . . . . . . . . . . . . . 17,222 16,232Cash and cash equivalents . . . . .20 (3,945) (2,637)Net debt . . . . . . . . . . . . . . . . 13,277 13,595
Total equity . . . . . . . . . . . . . . 11,689 12,292Total capital . . . . . . . . . . . . . . 24,966 25,887
% %Gearing ratio . . . . . . . . . . . . . 53.2 52.5F
or p
erso
nal u
se o
nly

Telstra Corporation Limited and controlled entities
122
Notes to the Financial Statements (continued)
(a) Capital management (continued)
Gearing and net debt (continued)
Net debt included in Table A is based on the carrying values of our financial instruments which are provided in Table C in the following section (b). For interest bearing financial instruments we adopt a ‘clean price’ whereby the reported balance of our derivative instruments and borrowings excludes accrued interest. Accrued interest is recorded in current ‘trade and other receivables’ and current ‘trade and other payables’ in the statement of financial position.
Our borrowings are unsecured, except for finance leases which are secured, as the rights to the leased asset transfer to the lessor in the event of a default by us. We have no assets pledged as security for our borrowings. All our borrowings are interest bearing, except for some loans from wholly owned controlled entities. Details of interest rates and maturity profiles are included in note 18.
We are not subject to any externally imposed capital requirements.
(i) Offshore loans
Offshore loans comprise debt raised overseas. Our policy is to swap foreign currency borrowings into Australian dollars, except for a small proportion of foreign currency borrowings/cross currency swaps used to hedge translation foreign exchange risk associated with our offshore investments, and some cash balances/finance leases held in foreign currencies by our foreign controlled entities. The carrying amounts of offshore loans are denominated in the following currencies.
Refer to Table E for details on debt issuance and maturities.
(ii) Telstra bonds and domestic loans
Telstra bonds currently on issue total $236 million and relate to wholesale investors and mature up until the year 2020. Domestic borrowings as at 30 June 2012 total $3,292 million with various maturity dates up until the year 2020. Refer to Table E for details on debt issuance and maturities.
17. Capital management and financial instruments (continued)
Table B Telstra GroupAs at 30 June
2012 2011$m $m
Australian dollar . . . . . . . . . . . . . 190 249Euro . . . . . . . . . . . . . . . . . . . 7,193 5,242United States dollar. . . . . . . . . . . . 1,701 2,280British pounds sterling . . . . . . . . . . 306 299Japanese yen . . . . . . . . . . . . . . 595 558New Zealand dollar. . . . . . . . . . . . 198 272Swiss francs . . . . . . . . . . . . . . . 804 627Hong Kong dollar . . . . . . . . . . . . . 45 40Indian rupee . . . . . . . . . . . . . . . 2 -
11,034 9,567
For
per
sona
l use
onl
y
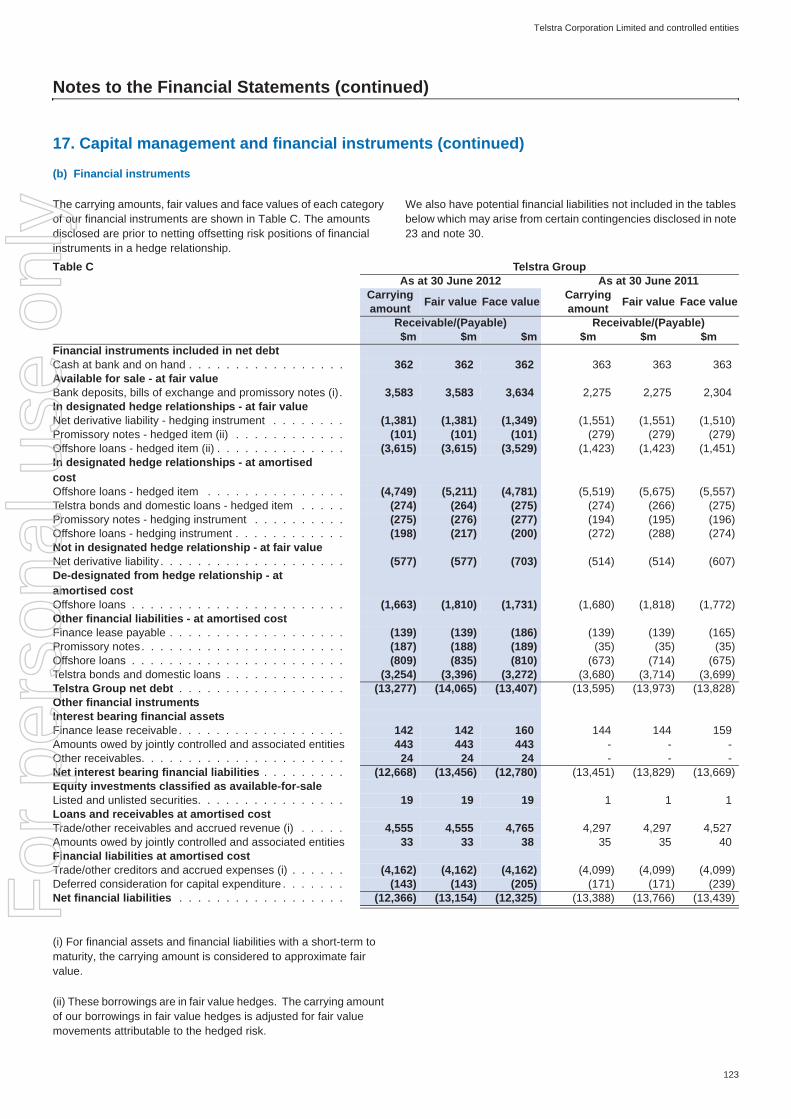
Telstra Corporation Limited and controlled entities
123
Notes to the Financial Statements (continued)
(b) Financial instruments
The carrying amounts, fair values and face values of each category of our financial instruments are shown in Table C. The amounts disclosed are prior to netting offsetting risk positions of financial instruments in a hedge relationship.
We also have potential financial liabilities not included in the tables below which may arise from certain contingencies disclosed in note 23 and note 30.
(i) For financial assets and financial liabilities with a short-term to maturity, the carrying amount is considered to approximate fair value.
(ii) These borrowings are in fair value hedges. The carrying amount of our borrowings in fair value hedges is adjusted for fair value movements attributable to the hedged risk.
17. Capital management and financial instruments (continued)
Table C Telstra GroupAs at 30 June 2012 As at 30 June 2011
Carrying amount Fair value Face value Carrying
amount Fair value Face value
Receivable/(Payable) Receivable/(Payable)$m $m $m $m $m $m
Financial instruments included in net debtCash at bank and on hand . . . . . . . . . . . . . . . . . 362 362 362 363 363 363Available for sale - at fair valueBank deposits, bills of exchange and promissory notes (i). 3,583 3,583 3,634 2,275 2,275 2,304In designated hedge relationships - at fair valueNet derivative liability - hedging instrument . . . . . . . . (1,381) (1,381) (1,349) (1,551) (1,551) (1,510)Promissory notes - hedged item (ii) . . . . . . . . . . . . (101) (101) (101) (279) (279) (279)Offshore loans - hedged item (ii) . . . . . . . . . . . . . . (3,615) (3,615) (3,529) (1,423) (1,423) (1,451)In designated hedge relationships - at amortised costOffshore loans - hedged item . . . . . . . . . . . . . . . (4,749) (5,211) (4,781) (5,519) (5,675) (5,557)Telstra bonds and domestic loans - hedged item . . . . . (274) (264) (275) (274) (266) (275)Promissory notes - hedging instrument . . . . . . . . . . (275) (276) (277) (194) (195) (196)Offshore loans - hedging instrument . . . . . . . . . . . . (198) (217) (200) (272) (288) (274)Not in designated hedge relationship - at fair valueNet derivative liability . . . . . . . . . . . . . . . . . . . . (577) (577) (703) (514) (514) (607)De-designated from hedge relationship - at amortised costOffshore loans . . . . . . . . . . . . . . . . . . . . . . . (1,663) (1,810) (1,731) (1,680) (1,818) (1,772)Other financial liabilities - at amortised costFinance lease payable . . . . . . . . . . . . . . . . . . . (139) (139) (186) (139) (139) (165)Promissory notes . . . . . . . . . . . . . . . . . . . . . . (187) (188) (189) (35) (35) (35)Offshore loans . . . . . . . . . . . . . . . . . . . . . . . (809) (835) (810) (673) (714) (675)Telstra bonds and domestic loans . . . . . . . . . . . . . (3,254) (3,396) (3,272) (3,680) (3,714) (3,699)Telstra Group net debt . . . . . . . . . . . . . . . . . . (13,277) (14,065) (13,407) (13,595) (13,973) (13,828)Other financial instrumentsInterest bearing financial assetsFinance lease receivable . . . . . . . . . . . . . . . . . . 142 142 160 144 144 159Amounts owed by jointly controlled and associated entities 443 443 443 - - -Other receivables. . . . . . . . . . . . . . . . . . . . . . 24 24 24 - - -Net interest bearing financial liabilities . . . . . . . . . (12,668) (13,456) (12,780) (13,451) (13,829) (13,669)Equity investments classified as available-for-saleListed and unlisted securities. . . . . . . . . . . . . . . . 19 19 19 1 1 1Loans and receivables at amortised costTrade/other receivables and accrued revenue (i) . . . . . 4,555 4,555 4,765 4,297 4,297 4,527Amounts owed by jointly controlled and associated entities 33 33 38 35 35 40Financial liabilities at amortised costTrade/other creditors and accrued expenses (i) . . . . . . (4,162) (4,162) (4,162) (4,099) (4,099) (4,099)Deferred consideration for capital expenditure . . . . . . . (143) (143) (205) (171) (171) (239)Net financial liabilities . . . . . . . . . . . . . . . . . . (12,366) (13,154) (12,325) (13,388) (13,766) (13,439)F
or p
erso
nal u
se o
nly

Telstra Corporation Limited and controlled entities
124
Notes to the Financial Statements (continued)
(b) Financial instruments (continued)
As shown in Table C, the carrying amount of net debt is lower than that based on contractual face values. This is primarily due to the impact of revaluation gains on our debt portfolio as a result of having locked in lower debt margins on our borrowings as compared to market rates applicable as at 30 June.
(c) Net position on a contractual face value basis
The amounts disclosed in Table D represent the net contractual face values of our financial instruments on a post hedge basis.
(i) These amounts represent the end hedge position as described in our hedge relationships in note 18 Table H.
(ii) Includes offshore loans of $200 million (2011: $274 million) used to hedge our investment in TelstraClear Limited as described in note 18 Table K. The balance also includes $49 million (2011: $32 million) relating to finance leases and $2 million (2011: nil) other loans.
(iii) Includes final pay legs $638 million (2011: $1,029 million) as described in note 18 Table J. The balance also includes receive legs relating to hedges of forecast purchases, trade and other non interest bearing liabilities of $525 million (2011: $711 million).
(iv) Comprises promissory notes used to hedge our investment in TelstraClear Limited as described in note 18 Table K.
The above table represents our economic residual position after netting offsetting risks of our derivative and non-derivative financial instruments in a hedge relationship.
Accordingly, consistent with our policy to swap foreign currency borrowings into Australian dollars, only our Australian dollar end positions are included in the table above, except for a small proportion of foreign currency borrowings/cross currency swaps used to hedge translation foreign exchange risk associated with our offshore investments, loans from wholly owned controlled entities, and some cash balances/finance leases held in foreign currencies by our foreign controlled entities. These foreign currency amounts are reported in Australian dollars based on the applicable exchange rate as at 30 June.
Total net debt in Table D agrees to the face value of our financial instruments included in net debt in Table C. The face values differ from the statement of financial position carrying amounts. The carrying amounts reflect a part of our borrowing portfolio at fair value with the remaining part at amortised cost, whereas the face values represent the undiscounted contractual liability at maturity date.
17. Capital management and financial instruments (continued)
Table D Telstra GroupAs at 30 June
Face value2012 2011
Currency $m $mInterest bearing financial assets included in net debtCash and cash equivalents . . . . . . . . . . . . . . . . . . . . . . . . . Floating Australian dollar 3,591 2,278Cash and cash equivalents held in foreign currencies . . . . . . . . . . . Floating Various 338 239Bank deposits with maturity greater than 90 days . . . . . . . . . . . . . . Floating Foreign - 1
3,929 2,518Interest bearing financial liabilities included in net debtCross currency and interest rate swap liability (i) . . . . . . . . . . . . . . Fixed Australian dollar (5,841) (6,169)Borrowings. . . . . . . . . . . . . . . . . . . . . . . . . . . . . . . . . . Fixed Australian dollar (2,549) (2,392)Borrowings (ii) . . . . . . . . . . . . . . . . . . . . . . . . . . . . . . . . Fixed Foreign (251) (229)Borrowings (ii) . . . . . . . . . . . . . . . . . . . . . . . . . . . . . . . . Floating Foreign - (77)Cross currency and interest rate swap liability (i) . . . . . . . . . . . . . . Floating Australian dollar (6,950) (5,256)Borrowings. . . . . . . . . . . . . . . . . . . . . . . . . . . . . . . . . . Floating Australian dollar (1,189) (1,475)Forward contract liability - net (iii) . . . . . . . . . . . . . . . . . . . . . . Floating Australian dollar (113) (318)Cross currency swap liability - net . . . . . . . . . . . . . . . . . . . . . . Floating Foreign (233) (383)Borrowings (iv). . . . . . . . . . . . . . . . . . . . . . . . . . . . . . . . Floating Foreign (277) (196)
(17,403) (16,495)Net interest bearing debt . . . . . . . . . . . . . . . . . . . . . . . . . . (13,474) (13,977)Non-interest bearing cash included in net debt . . . . . . . . . . . . . . . Various 67 149Net debt - based on contractual face values . . . . . . . . . . . . . . . (13,407) (13,828)Other interest bearing financial assets . . . . . . . . . . . . . . . . . . . Fixed Australian dollar 627 159Net interest bearing financial liabilities - based on contractual face values (12,780) (13,669)
For
per
sona
l use
onl
y
Telstra Corporation Limited and controlled entities
125
Notes to the Financial Statements (continued)
d) Movements in net debt
The decrease in the carrying amount (including net cash movements) of our net debt during the year of $318 million for the Telstra Group (30 June 2011: decrease of $331 million) is represented by the movements shown in Table E below:
(i) The net revaluation gain of $18 million includes:
• gain of $6 million (2011: loss of $156 million) affecting other finance costs comprising a loss of $9 million (2011: $27 million) from fair value hedges; a gain of $14 million (2011: loss of $125 million) from transactions either not designated or de-designated from fair value hedge relationships; and a gain of $1 million (2011: loss of $4 million) relating to other hedge accounting adjustments; and
• gain of $12 million (2011: $3 million) affecting interest on borrowings comprising a gain of $27 million (2011: $21 million) relating to cross currency swap discounts on new borrowings which will be amortised to interest in the income statement over the life of the borrowing; and a loss of $15 million (2011: $18 million) comprising the amortisation of discounts.
We have issued the following long term debt during the year for refinancing purposes:
• $1,002 million offshore Euro public bond in November 2011, matures 16 May 2022;
• $98 million offshore Euro private placement bond in December 2011, matures 20 December 2023;
• $252 million offshore Swiss franc public bond in December 2011, matures 14 December 2018;
• $50 million offshore Australian dollar private placement bond in December 2011, matures 19 December 2023;
• $9 million domestic private placement loan in December 11 and February 12, matures 30 July 2018;
• $1,248 million offshore Euro public bond in March 2012, matures 21 September 2022;
• $2 million offshore Indian rupee bank loan in December 2011, matures 22 December 2016; and
• $140 million offshore Australian dollar private placement bond in May 2012; matures 25 May 2022.
Our unsecured promissory notes are used principally to support working capital and short term liquidity, as well as hedging certain offshore investments. Our short term unsecured promissory notes will continue to be supported by liquid financial assets and ongoing credit standby lines.
The following long term debt was repaid during the year:
• $5 million Telstra bonds, matured 15 July 2011;• $435 million domestic syndicated bank loan, matured 22
September 2011;• $90 million offshore New Zealand dollar public bond, matured 24
November 2011; • $27 million offshore United States dollar private placement bond,
matured 16 December 2011;• $106 million offshore United States dollar public bond, matured
30 January 2012;• $250 million offshore Australian dollar syndicated bank loan,
matured 1 February 2012;• $947 million offshore United States dollar public bond, matured
1 April 2012; and• $176 million offshore United States dollar syndicated bank loan,
matured 18 May 2012.
Long term debt of $2,970 million will mature during fiscal 2013. This represents the contractual face value amount after hedging. Included in this amount are offshore borrowings which were swapped into Australian dollars at inception of the borrowing through to maturity using cross currency and interest rate swaps, creating synthetic Australian dollar obligations. These post hedge obligations are reflected in our total contractual Australian dollar liability at maturity of $2,970 million.
17. Capital management and financial instruments (continued)
Table E Telstra GroupYear ended
30 June2012 2011
$m $mDebt issuance - offshore and domestic loans 2,801 2,086Net short term borrowings and bank deposits greater than 90 days . . . . . . . . . . . . . 60 254Repayment of offshore and domestic loans . (2,036) (2,536)Finance lease repayments . . . . . . . . . . (52) (61)Net cash inflow/(outflow) 773 (257)
Non-cash movements in gross debt before taxRevaluation losses affecting cash flow hedging reserve . . . . . . . . . . . . . . . . . . . . 103 244Revaluation losses/(gains) affecting foreign currency translation reserve . . . . . . . . . 89 (32)Revaluation (gains)/losses affecting other expenses in the income statement . . . . . . (9) 21Revaluation (gains)/losses affecting finance costs in the income statement (i) . . . . . . . (18) 153Finance lease additions . . . . . . . . . . . 52 72
217 458
Total increase in gross debt . . . . . . . . 990 201Net increase in cash and cash equivalents (including foreign currency exchange differences) . . . . . . . . . . . . . . . . . . (1,308) (532)Total decrease in net debt . . . . . . . . . (318) (331)
For
per
sona
l use
onl
y

Telstra Corporation Limited and controlled entities
126
Notes to the Financial Statements (continued)
d) Movements in net debt (continued)
The amount of $2,970 million is different to the carrying amount of $2,698 million which is included in current borrowings (along with promissory notes of $563 million and finance leases of $45 million) in the statement of financial position. The carrying amount reflects the amount of our borrowings due to mature within 12 months prior to netting offsetting risk positions of associated derivative financial instruments hedging these borrowings. The carrying amount reflects a mixed measurement basis with part of the borrowing portfolio recorded at fair value and the remaining part at amortised cost which is compliant with the requirements under Australian Accounting Standards.
(e) Interest and yields
The net interest on borrowings is shown in Table F below. Where applicable, finance costs are assigned to categories on the basis of the hedged item.
(i) The interest expense as shown in Table F above is categorised based on the classification of financial instruments applicable as at 30 June.
(ii) Interest expense is a net amount after offsetting interest income and interest expense on associated derivative instruments.
The year-on-year decrease in net interest on borrowings is due to a reduction in the volume of average net debt and a reduction in the average interest yield. The average yield on average net interest bearing financial liabilities during the year was 7.0% (2011: 7.2%) for the Telstra Group. The reduction in yield arises principally from a reduction in short-term market base market rates in the current year compared to the prior year, resulting in lower costs on the floating rate debt component of our debt portfolio. The reduction in short-term base rates was partially offset by an increase in refinancing margins on term debt issued during the year.
Some early refinancing of our fiscal 2013 borrowing requirements was undertaken in the second half of the current year resulting in higher levels of liquidity. Higher liquidity contributes to higher interest costs due to borrowing yields (to maintain higher liquidity) exceeding investment yields.
17. Capital management and financial instruments (continued)
Table F Telstra GroupAs at 30 June
2012 2011Note $m $m
Interest on borrowings (i)Financial instruments in hedge relationshipsDomestic loans in cash flow hedges (ii) . . . . . . . . . . . . . . . . . . . . . . . . . . . . . . . . . . . . 19 19Offshore loans in cash flow hedges (ii). . . . . . . . . . . . . . . . . . . . . . . . . . . . . . . . . . . . . 481 545Offshore loans in fair value hedges (ii) . . . . . . . . . . . . . . . . . . . . . . . . . . . . . . . . . . . . . 180 175Promissory notes in fair value hedges (ii) . . . . . . . . . . . . . . . . . . . . . . . . . . . . . . . . . . . 8 4Derivatives and borrowings hedging net foreign investments . . . . . . . . . . . . . . . . . . . . . . . . . 3 1Available for salePromissory notes . . . . . . . . . . . . . . . . . . . . . . . . . . . . . . . . . . . . . . . . . . . . . . . . 7 3Other financial instrumentsOffshore loans not in a hedge relationship or de-designated from fair value hedge relationships (ii) . . . . . 191 194Telstra bonds and domestic loans . . . . . . . . . . . . . . . . . . . . . . . . . . . . . . . . . . . . . . . 218 225Other . . . . . . . . . . . . . . . . . . . . . . . . . . . . . . . . . . . . . . . . . . . . . . . . . . . . . . 13 8Finance leases . . . . . . . . . . . . . . . . . . . . . . . . . . . . . . . . . . . . . . . . . . . . . . . . . 12 12
7 1,132 1,186Finance income on net debtCash and cash equivalents. . . . . . . . . . . . . . . . . . . . . . . . . . . . . . . . . . . . . . . . . . 6 111 117Net interest on net debt . . . . . . . . . . . . . . . . . . . . . . . . . . . . . . . . . . . . . . . . . . . 1,021 1,069
For
per
sona
l use
onl
y

Telstra Corporation Limited and controlled entities
127
Notes to the Financial Statements (continued)
(f) Derivative financial instruments
All our derivatives are in designated hedge relationships which satisfy the requirements for hedge accounting, except for a number of derivatives classified as held for trading which are in economic relationships but not in a designated hedge relationship for hedge accounting purposes. Refer to note 18 for details on hedging relationships.
Derivative financial instruments for the Telstra Group as at 30 June are shown in Table G and Table H below. For these derivative instruments the fair value equates to the carrying amounts in the statement of financial position which differs from the face values which are also provided in other tables within this note.
(i) Gains or losses recognised in the cash flow hedging reserve on cross currency swap and interest rate swap contracts will be continuously released to the income statement until the underlying borrowings are repaid. Gains or losses recognised in the cash flow hedging reserve on forward exchange contracts will be released to the income statement when the underlying forecast transaction occurs and affects profit or loss. However, where the underlying forecast transaction is a purchase of a non financial asset (for
example property, plant and equipment) the gain or loss in the cash flow hedging reserve will be transferred and included in the measurement of the initial cost of the asset at the date the asset is recognised.
17. Capital management and financial instruments (continued)
Table G Telstra GroupAs at 30 June 2012
Cross currency swaps Interest rate swaps Forward contracts Total Total Total
Asset Liability Asset Liability Asset Liability Asset Liability Net$m $m $m $m $m $m $m $m $m
CurrentFair value hedge . . . . . . . . 1 (14) 2 - - (2) 3 (16) (13)Cash flow hedge (i). . . . . . . - (20) 5 (7) - (4) 5 (31) (26)Hedge of net investment in foreign operation . . . . . . . . 2 (5) - - - - 2 (5) (3)Held for trading (ii) . . . . . . . 7 (245) 14 - 1 (2) 22 (247) (225)
10 (284) 21 (7) 1 (8) 32 (299) (267)Non currentFair value hedge . . . . . . . . 10 (192) 75 - - - 85 (192) (107)Cash flow hedge (i). . . . . . . 12 (1,050) 487 (676) - - 499 (1,726) (1,227)Hedge of net investment in foreign operation . . . . . . . . - (5) - - - - - (5) (5)Held for trading (ii) . . . . . . . - (426) 74 - - - 74 (426) (352)
22 (1,673) 636 (676) - - 658 (2,349) (1,691)32 (1,957) 657 (683) 1 (8) 690 (2,648) (1,958)
Table H Telstra GroupAs at 30 June 2011
Cross currency swaps Interest rate swaps Forward contracts Total Total TotalAsset Liability Asset Liability Asset Liability Asset Liability Net
$m $m $m $m $m $m $m $m $mCurrentFair value hedge . . . . . . . . - (261) 8 - - (4) 8 (265) (257)Cash flow hedge (i). . . . . . . - (336) 11 (8) 1 (17) 12 (361) (349)Hedge of net investment in foreign operation . . . . . . . . 59 - - - - - 59 - 59Held for trading (ii) . . . . . . . - - - - 4 (8) 4 (8) (4)
59 (597) 19 (8) 5 (29) 83 (634) (551)Non currentFair value hedge . . . . . . . . 13 (51) 8 (40) - - 21 (91) (70)Cash flow hedge (i). . . . . . . 10 (946) 176 (173) - - 186 (1,119) (933)Hedge of net investment in foreign operation . . . . . . . . 10 - - - - - 10 - 10Held for trading (ii) . . . . . . . - (587) 68 - - (2) 68 (589) (521)
33 (1,584) 252 (213) - (2) 285 (1,799) (1,514)92 (2,181) 271 (221) 5 (31) 368 (2,433) (2,065)F
or p
erso
nal u
se o
nly
Telstra Corporation Limited and controlled entities
128
Notes to the Financial Statements (continued)
(f) Derivative financial instruments (continued)
(ii) Derivatives which are classified as held for trading are in economic relationships but are not in designated hedge relationships for hedge accounting purposes. These derivatives include cross currency and interest rate swaps associated with a long term Euro bond issue not in a designated hedge relationship and with a number of offshore borrowings denominated in United States dollars, Euros and British pounds sterling which were in fair value hedges and were de-designated from the hedge relationship for hedge accounting purposes as they did not meet requirements for hedge effectiveness. Although these held for trading derivatives did not satisfy the requirements for hedge accounting, these relationships are in effective economic relationships based on contractual amounts and cash flows over the life of the transaction. Also included in held for trading derivatives are forward contracts economically hedging trade creditors and other liabilities denominated in a foreign currency.
(g) Fair value hierarchy
We use various methods in estimating the fair value of our financial instruments. The methods comprise:
• Level 1: the fair value is calculated using quoted prices (unadjusted) in active markets for identical assets or liabilities;
• Level 2: the fair value is estimated using inputs other than quoted prices included in Level 1 that are observable for the asset or liability, either directly (as prices) or indirectly (derived from prices); and
• Level 3: the fair value is estimated using inputs for the asset or liability that are not based on observable market data (unobservable inputs).
The level in the fair value hierarchy within which the fair value measurement is categorised in its entirety has been determined on the basis of the lowest level input that is significant to the fair value measurement in its entirety. An unobservable valuation input is considered significant if stressing the unobservable input to the valuation model would result in a greater than 10% change in the overall fair value of the instrument.
The fair value of the financial instruments and the classification within the fair value hierarchy are summarised in Tables I, J and K below, followed by a description of the methods used to estimate the fair value.
17. Capital management and financial instruments (continued)
Table ITelstra Group
As at 30 June 2012 Level 1 Level 2 Level 3 Total
$m $m $m $mAvailable for sale Investments - otherQuoted securities . . . 1 - - 1Unlisted securities . . . - - 18 18Derivative assetsCross currency swaps . - 32 - 32Interest rate swaps . . - 657 - 657Forward contracts . . . - 1 - 1
1 690 18 709Derivative liabilitiesCross currency swaps . - (1,957) - (1,957)Interest rate swaps . . - (683) - (683)Forward contracts . . . - (8) - (8)
- (2,648) - (2,648)1 (1,958) 18 (1,939)
Table JTelstra Group
As at 30 June 2011Level 1 Level 2 Level 3 Total
$m $m $m $mAvailable for sale Investments - otherQuoted securities . . . 1 - - 1Derivative assetsCross currency swaps . - 92 - 92Interest rate swaps . . - 271 - 271Forward contracts . . . - 5 - 5
1 368 - 369Derivative liabilitiesCross currency swaps . - (2,181) - (2,181)Interest rate swaps . . - (221) - (221)Forward contracts . . . - (31) - (31)
- (2,433) - (2,433)1 (2,065) - (2,064)
For
per
sona
l use
onl
y

Telstra Corporation Limited and controlled entities
129
Notes to the Financial Statements (continued)
(g) Fair value hierarchy (continued)
Available for sale investments - unlisted securities
These shares are not listed on any stock exchange, therefore a quoted market price is not available and accordingly have been classified as Level 3. These shares were acquired for a purchase price of $18 million which represents an amount exchanged between knowledgeable and willing parties in an arms’ length purchase transaction. During the fiscal year no gains or losses have been recognised in other comprehensive income and therefore the consideration paid approximates the investments fair value.
Cross currency and interest rate swaps
The net fair values of our cross currency and interest rate swaps are determined using valuation techniques which utilise data from observable and unobservable market data. Assumptions are based on market conditions existing at each reporting date. The fair value is calculated as the present value of the estimated future cash flows using an appropriate market based yield curve, which is independently derived and representative of Telstra’s cost of borrowing. In particular, the following inputs are used to derive yield curves used in the calculation of fair value of our derivatives:
• base curves which are readily available market data and quoted for all major currencies; and
• pricing data reflecting Telstra’s borrowing margins obtained from selected market participants with whom Telstra has or would transact in capital markets. We generally use the mid point of the pricing data range in calculating the yield curve. This pricing data used to estimate Telstra’s borrowing margins is not observable, however sensitivity analysis on changes to this input, by using the maximum point in the pricing range, does not result in a significant change to the fair value of our cross currency and interest rate swaps.
We have therefore classified these derivatives based on the observable market inputs (Level 2).
Forward contracts
The fair value of our forward exchange contracts is calculated by reference to forward exchange market rates at reporting date for contracts with similar maturity profiles. These market rates are observable and therefore these derivatives have been classified as Level 2.
17. Capital management and financial instruments (continued)
Table KUnlisted
securitiesLevel 3
$mOpening balance 1 July 2011. . . . . . . . . . -Purchases . . . . . . . . . . . . . . . . . . . . 18Closing balance 30 June 2012 . . . . . . . . . 18
For
per
sona
l use
onl
y
Telstra Corporation Limited and controlled entities
130
Notes to the Financial Statements (continued)
We undertake transactions using a range of financial instruments including:
• cash assets; • receivables; • payables; • deposits; • bills of exchange and promissory notes; • listed investments and investments in other corporations; • various forms of borrowings, including medium term notes,
promissory notes, bank loans and private placements; and• derivatives.
Our activities result in exposure to operational risk and a number of financial risks, including market risk (interest rate risk and foreign currency risk), credit risk and liquidity risk.
Our overall risk management program seeks to mitigate these risks and reduce volatility on our financial performance and support the delivery of our financial targets. We manage our risks with a view to the outcomes of both our financial results and the underlying economic position. Financial risk management is carried out centrally by our Treasury department, which is part of our Corporate area, under policies approved by the Board of Directors (the Board). The Board provides written principles for overall risk management, as well as written policies covering specific areas, such as, foreign exchange risk, interest rate risk, credit risk, use of derivative financial instruments and non derivative financial instruments, and the investment of excess liquidity.
We enter into derivative transactions in accordance with Board approved policies to manage our exposure to market risks and volatility of financial outcomes that arise as part of our normal business operations. These derivative instruments create an obligation or right that effectively transfers one or more of the risks associated with an underlying financial instrument, asset or obligation. Derivative financial instruments that we use to hedge risks such as interest rate and foreign currency movements include:
• cross currency swaps; • interest rate swaps; and• forward exchange contracts.
We do not speculatively trade in derivative financial instruments. Our derivative transactions are entered into to hedge the risks relating to underlying physical positions arising from our business activities.
Section (a) of this note sets out the key financial risk factors that arise from our activities, including our policies for managing these risks.
Sections (b) and (c) provide details of our hedging strategies and hedge relationships that are used for financial risk management. In particular, these sections provide additional context around our hedge transactions and the resulting economic and risk positions.
(a) Risk and mitigation
The risks associated with our main financial instruments and our policies for minimising these risks are detailed below. These risks comprise market risk, credit risk and liquidity risk.
Market risk
Market risk is the risk that the fair value or future cash flows of our financial instruments will fluctuate because of changes in market prices. Components of market risk to which we are exposed are discussed below.
(i) Interest rate risk
Interest rate risk refers to the risk that the value of a financial instrument or cash flows associated with the instrument will fluctuate due to changes in market interest rates.
Interest rate risk arises from interest bearing financial assets and liabilities. Non derivative interest bearing assets are predominantly short term liquid assets. Our interest rate liability risk arises primarily from long term foreign debt issued at fixed rates which exposes us to fair value interest rate risk. Our borrowings, which have a variable interest rate attached, give rise to cash flow interest rate risk.
Our debt is sourced from a number of financial markets covering domestic and offshore, short term and long term funding. The majority of our debt consists of foreign currency denominated borrowings. We manage our debt in accordance with targeted currency, interest rate, liquidity, and debt portfolio maturity profiles. Specifically, we manage interest rate risk on our net debt portfolio by:
• adjusting the ratio of fixed interest debt to variable interest debt to our target ratio, as required by our debt management policy;
• ensuring access to diverse sources of funding;• reducing risks of refinancing by establishing and managing in
accordance with target maturity profiles; and• undertaking hedging activities through the use of derivative
financial instruments.
Under our interest rate swaps we agree with other parties to exchange, at specified intervals (mainly quarterly), the difference between fixed contract rates and floating rate interest amounts calculated by reference to the agreed notional principal amounts. Refer to note 17 Table D for our residual post hedge fixed and floating interest positions on a contractual face value basis.
18. Financial risk management
For
per
sona
l use
onl
y

Telstra Corporation Limited and controlled entities
131
Notes to the Financial Statements (continued)
(a) Risk and mitigation (continued)
Market risk (continued)
(i) Interest rate risk (continued)
We hedge interest rate and currency risk on most of our foreign currency borrowings by entering into cross currency principal swaps and interest rate swaps when required, which have the economic effect of converting foreign currency borrowings to Australian dollar borrowings. ‘Hedging strategies’ and ‘Hedge relationships’ contained in sections (b) and (c) of this note provides further information.
The weighted average interest rates on our fixed and floating rate financial instruments as at 30 June, which do not have offsetting risk positions, and the principal/notional amounts on which interest is calculated, are shown in Table A below. Interest rate positions on our foreign cross currency and foreign interest rate swaps and on the majority of our foreign borrowings are fully offset. Accordingly, the majority of our instruments in the following table represent Australian dollar interest positions. Principal/notional amounts shown are net of discounts and as such differ from the face value disclosed in note 17 (Tables C and D).
18. Financial risk management (continued)
For
per
sona
l use
onl
y

Telstra Corporation Limited and controlled entities
132
Notes to the Financial Statements (continued)
(*) The average rate is calculated as the weighted average (based on principal/notional value) effective interest rate, as at reporting date.
(#) Predominantly relate to financial instruments used to hedge our net foreign investments.
(^) Rates on cash and cash equivalents represent average rates earned on net positive cash balances after taking into account bank set-off arrangements.
(**) Financial instruments used to hedge loan from wholly owned controlled entity.
18. Financial risk management (continued)
Table A Telstra Group
As at 30 June 2012 As at 30 June 2011
Principal/ notional
receivable/ (payable)
$m
Weighted average
% (*)
Principal/ notional
receivable/ (payable)
$m
Weighted average% (*)
Fixed rate instruments - Australian interest rateCross currency and interest rate swap payable . . . . . . . . . . . . . . . . . . . (5,841) 6.17 (6,169) 6.17Finance lease payable . . . . . . . . . . . . . . . . . . . . . . . . . . . . . . . . (123) 7.73 (122) 7.60Telstra bonds and domestic loans . . . . . . . . . . . . . . . . . . . . . . . . . . (1,754) 7.20 (2,240) 7.26Offshore loans . . . . . . . . . . . . . . . . . . . . . . . . . . . . . . . . . . . . (140) 6.10 - -Fixed rate instruments - Foreign interest ratesFinance lease payable . . . . . . . . . . . . . . . . . . . . . . . . . . . . . . . . (16) 22.50 (17) 21.00Offshore loans (#) . . . . . . . . . . . . . . . . . . . . . . . . . . . . . . . . . . (201) 7.65 (195) 7.60
(8,075) (8,743)Variable rate instruments - Australian interest ratesContractual repricing or maturity 3 months or lessCash and cash equivalents (^) . . . . . . . . . . . . . . . . . . . . . . . . . . . . 3,539 4.31 2,249 5.07Bank deposits with maturity greater than 90 days . . . . . . . . . . . . . . . . . . - - 1 4.88Cross currency swap receivable (#) . . . . . . . . . . . . . . . . . . . . . . . . . 460 3.54 452 5.02Cross currency and interest rate swap payable . . . . . . . . . . . . . . . . . . . (7,082) 5.50 (4,802) 6.23Telstra bonds and domestic loans . . . . . . . . . . . . . . . . . . . . . . . . . . (1,000) 4.55 (1,440) 5.53Promissory notes . . . . . . . . . . . . . . . . . . . . . . . . . . . . . . . . . . . (187) 4.36 (35) 5.18Contractual repricing or maturity 3 to 12 monthsTelstra bonds and domestic loans . . . . . . . . . . . . . . . . . . . . . . . . . . (500) 7.44 - -Forward contract liability - net . . . . . . . . . . . . . . . . . . . . . . . . . . . . (113) 2.78 (318) 3.96Cross currency and interest rate swap payable . . . . . . . . . . . . . . . . . . . (328) 6.17 (906) 6.53Variable rate instruments - Foreign interest ratesContractual repricing or maturity 6 months or lessCash and cash equivalents (^) . . . . . . . . . . . . . . . . . . . . . . . . . . . . 338 0.80 239 1.56Cross currency swap payable (#) . . . . . . . . . . . . . . . . . . . . . . . . . . (468) 0.13 (383) 0.03Cross currency swap receivable (**) . . . . . . . . . . . . . . . . . . . . . . . . . 235 3.65 - -Offshore loans (#) . . . . . . . . . . . . . . . . . . . . . . . . . . . . . . . . . . - - (77) 7.03Promissory notes (#) . . . . . . . . . . . . . . . . . . . . . . . . . . . . . . . . . (275) 2.96 (194) 2.90
(5,381) (5,214)Net interest bearing debt . . . . . . . . . . . . . . . . . . . . . . . . . . . . . . (13,456) (13,957)Other interest bearing financial assetsFixed rate instruments - Australian interest ratesFinance lease receivable . . . . . . . . . . . . . . . . . . . . . . . . . . . . . . . 142 7.79 144 7.49Amounts owed by jointly controlled entities . . . . . . . . . . . . . . . . . . . . . 443 12.00 - -Floating rate instruments - Australian interest rateContractual maturity 12 monthsOther receivables. . . . . . . . . . . . . . . . . . . . . . . . . . . . . . . . . . . 24 6.90 - -Net interest bearing financial liabilities . . . . . . . . . . . . . . . . . . . . . . (12,847) (13,813)F
or p
erso
nal u
se o
nly
Telstra Corporation Limited and controlled entities
133
Notes to the Financial Statements (continued)
(a) Risk and mitigation (continued)
Market risk (continued)
(ii) Sensitivity analysis - interest rate risk
The sensitivity analysis included in this section is based on the interest rate risk exposures on our net debt portfolio as at reporting date.
A sensitivity of plus or minus 10 percent has been selected as this is considered reasonable given the current level of both short term and long term Australian dollar interest rates. For example, a 10 percent increase would move short term interest rates (cash) at 30 June 2012 from 3.50% (2011: 4.75%) to 3.85% (2011: 5.23%) representing a 35 (2011: 48) basis point shift. This basis point shift is considered reasonable taking into account the absolute rates as at 30 June and current market conditions.
The results in this sensitivity analysis reflect the net impact on a hedged basis which will be primarily reflecting the Australian dollar floating or Australian dollar fixed position from our cross currency and interest rate swap hedges and therefore the movement in the Australian dollar interest rates is a significant assumption in this sensitivity analysis.
Based on the sensitivity analysis, equity would be affected by the revaluation of our derivatives associated with borrowings designated in a cash flow hedge relationship and finance costs would be impacted by the following:
• the impact on interest expense being incurred on our net floating rate Australian dollar positions during the year;
• the revaluation of our derivatives associated with borrowings de-designated from a fair value hedge relationship or not in a hedge relationship; and
• the ineffectiveness resulting from the change in fair value of both our derivatives and borrowings which are designated in a fair value hedge.
The carrying value of borrowings de-designated from fair value hedge relationships or not in a hedge relationship is not adjusted for fair value movements attributable to interest rate risk. Accordingly, the revaluation gain or loss on our foreign currency derivatives associated with these borrowings will not have an offsetting gain or loss attributable to interest rate movements on the underlying borrowing.
It is important to note that this sensitivity analysis does not include the effect of movements in Telstra’s borrowing margins. Whilst margins will be affected by market factors, this risk variable predominantly reflects Telstra specific credit risk and accordingly is not considered a market risk. Furthermore, determining a reasonably possible change in this risk variable with sufficient reliability is impractical. Therefore, the following sensitivity analysis assumes a constant margin and parallel shifts in interest rates across all currencies.
18. Financial risk management (continued)
For
per
sona
l use
onl
y

Telstra Corporation Limited and controlled entities
134
Notes to the Financial Statements (continued)
(a) Risk and mitigation (continued)
Market risk (continued)
(ii) Sensitivity analysis - interest rate risk (continued)
The following sensitivity analysis is based on our interest rate exposures comprising:
• the revaluation impact on our derivatives and borrowings from a 10 percent movement in interest rates based on the net debt balances as at reporting date; and
• the effect on interest expense on our floating rate borrowings from a 10 percent movement in interest rates at each reset date during the year.
At 30 June, if interest rates had moved as illustrated in Table B below, with all other variables held constant and taking into account all underlying exposures and related hedges, profit and equity after tax would have been affected as follows:
(*) The before tax impact is included within finance costs.
The higher sensitivity in 2012 compared to 2011 relating to revaluation of derivatives and borrowings in fair value hedges reflects an increase in our portfolio as at 30 June 2012 from debt issued during the year.
(iii) Foreign currency risk
Foreign currency risk refers to the risk that the value of a financial commitment, forecast transaction, recognised asset or liability will fluctuate due to changes in foreign currency rates. Our foreign currency exchange risk arises primarily from:
• borrowings denominated in foreign currencies;• trade and other creditor balances denominated in foreign
currencies;• firm commitments or highly probable forecast transactions for
receipts and payments settled in foreign currencies or with prices dependent on foreign currencies; and
• net investments in foreign operations.
We are exposed to foreign exchange risk from various currency exposures, including:
• Euros;• United States dollars;• British pounds sterling;• New Zealand dollars;• Swiss francs;• Hong Kong dollars;• Chinese renminbi; and• Japanese yen.
Our economic foreign currency risk is assessed for each individual currency and for each hedge type, calculated by aggregating the net exposure for that currency for that hedge type.
We minimise our exposure to foreign currency risk by initially seeking contracts effectively denominated in Australian dollars where possible and economically favourable to do so. Where this is not possible we manage our exposure as follows.
18. Financial risk management (continued)
Table B Telstra Group+10% -10%
Net profit or loss (*)
Equity (cash flow hedging reserve)
Net profit or loss (*)
Equity (cash flow hedging reserve)
Year ended 30 June As at 30 June
Year ended 30 June As at 30 June
Gain/(loss) Gain/(loss) Gain/(loss) Gain/(loss)2012 2011 2012 2011 2012 2011 2012 2011
$m $m $m $m $m $m $m $mRevaluation of derivatives and borrowings - fair value hedges of offshore loans . . . . . . . . . . . . . . 39 3 - - (41) (3) - -Revaluation of derivatives - borrowings de-designated from fair value hedges or not in a hedge relationship (1) (5) - - 1 5 - -Revaluation of derivatives - cash flow hedges of offshore loans . . . . . . . . . . . . . . . . . . . . . . . . . - - 65 74 - - (69) (79)Floating rate Australian dollar instruments . . . . . (39) (39) - - 39 39 - -
(1) (41) 65 74 (1) 41 (69) (79)
For
per
sona
l use
onl
y

Telstra Corporation Limited and controlled entities
135
Notes to the Financial Statements (continued)
(a) Risk and mitigation (continued)
Market risk (continued)
(iii) Foreign currency risk (continued)
Cash flow foreign currency risk arises primarily from foreign currency overseas borrowings. We hedge this risk on the major part of our foreign currency denominated borrowings by entering into a combination of interest rate and cross currency swaps at inception to maturity, effectively converting them to Australian dollar borrowings. A relatively small proportion of our foreign currency borrowings are not swapped into Australian dollars where they are used as hedges for foreign exchange exposure such as translation foreign exchange risk from our offshore business investments. Refer to note 17 Table D for our residual post hedge currency exposures on a contractual face value basis.
Foreign exchange risk that arises from transactional exposures such as firm commitments or highly probable transactions settled in a foreign currency (primarily United States dollars) are managed principally through the use of forward foreign currency derivatives. We hedge a proportion of these transactions (such as asset and inventory purchases settled in foreign currencies) in accordance with our risk management policy.
Foreign currency risk also arises on translation of the net assets of our foreign controlled entities which have a functional currency other than Australian dollars. The foreign currency gains or losses arising from this risk are recorded through the foreign currency translation reserve. We manage this translation foreign exchange risk with forward foreign currency contracts, cross currency swaps and/or borrowings denominated in the currency of the entity concerned. We currently hedge our net investments in TelstraClear Limited and Hong Kong CSL Limited in New Zealand dollars and Hong Kong dollars respectively. The amount hedged during fiscal 2012 was in the range of 40% to 50% (2011: 40% to 50%). In relation to the proposed sale of TelstraClear Limited (refer note 31).
In addition, our subsidiaries may hedge foreign exchange transactions such as exposures from asset/liability balances or forecast sales/purchases in currencies other than their functional currency. Where this occurs, external foreign exchange contracts are designated at the group level as hedges of foreign exchange risk on the specific asset/liability balance or forecast transaction.
We also economically hedge a proportion of foreign currency risk associated with trade and other creditor balances using forward foreign currency contracts.
Refer to section (b) ‘Hedging strategies’ and section (c) ‘Hedge relationships’ contained in this note for further information.
(iv) Sensitivity analysis - foreign currency risk
The sensitivity analysis included in this section is based on foreign currency risk exposures on our financial instruments and net foreign investment balances as at reporting date.
The translation of our investments in foreign operations from their functional currency to Australian dollars represents a translation risk rather than a financial risk. Nevertheless, in this sensitivity analysis we have included the translation impact on our foreign currency translation reserve from movements in the exchange rate. In doing so, this sensitivity analysis reflects the impact on equity from a movement in the exchange rate associated with both the underlying hedged investment and the financial instruments hedging the translation currency risk.
Adverse versus favourable movements are determined relative to the underlying exposure. An adverse movement in exchange rates implies an increase in our foreign currency risk exposure and a worsening of our financial position. A favourable movement in exchange rates implies a reduction in our foreign currency risk exposure and an improvement of our financial position.
A sensitivity of 10 percent has been selected as this is considered reasonable taking into account the current level of exchange rates and the volatility observed both on an historical basis and market expectations for future movements. Comparing the Australian dollar exchange rate against the Euro, the year end rate of 0.8089 (2011: 0.7405) would generate a 10 percent favourable position of 0.8898 (2011: 0.8145) and an adverse position of 0.7354 (2011: 0.6732). This range is considered reasonable given the volatility that has been observed. For example, over the last five years, the Australian dollar exchange rate against the Euro has traded in the range 0.4798 to 0.8190 (2011: 0.4755 to 0.7735).
Foreign currency risk exposure from recognised assets and liabilities arises primarily from our long term borrowings denominated in foreign currencies. There is no significant impact on profit or loss from foreign currency movements associated with these borrowings as they are effectively hedged.
There is some volatility in profit or loss from exchange rate movements associated with our borrowings de-designated or not in hedge relationships and with our cash flow hedges of forecast transactions.
18. Financial risk management (continued)
For
per
sona
l use
onl
y
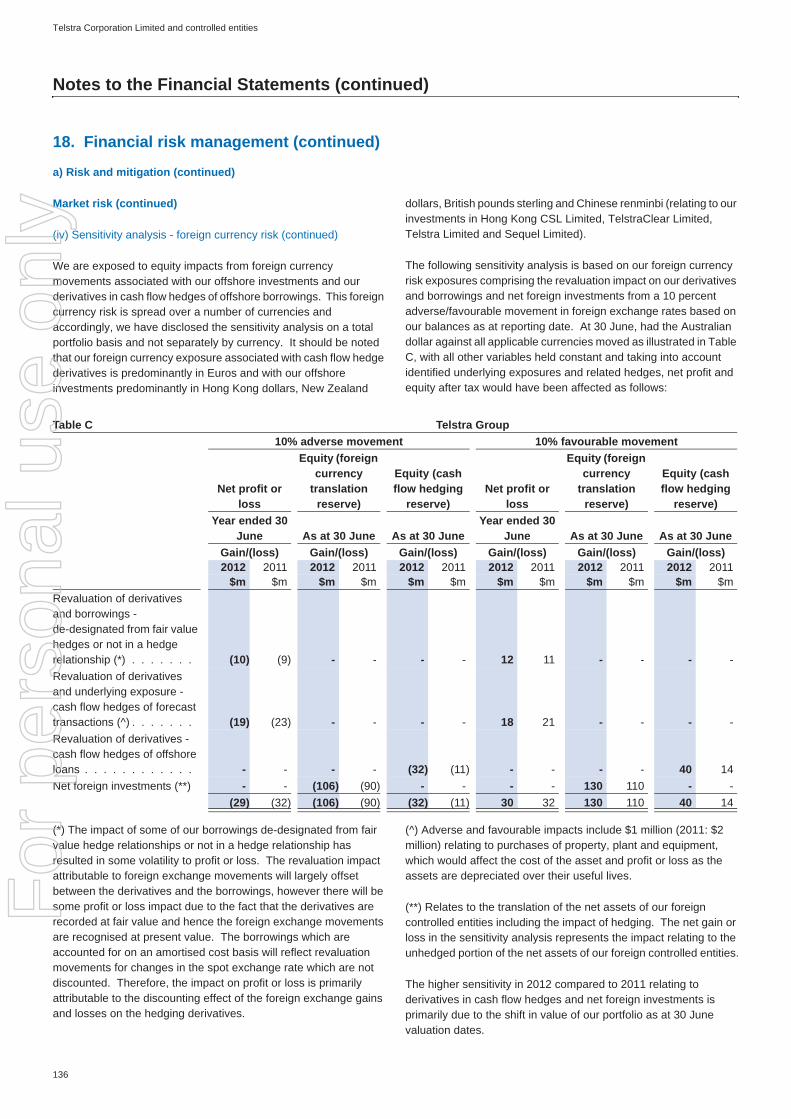
Telstra Corporation Limited and controlled entities
136
Notes to the Financial Statements (continued)
a) Risk and mitigation (continued)
Market risk (continued)
(iv) Sensitivity analysis - foreign currency risk (continued)
We are exposed to equity impacts from foreign currency movements associated with our offshore investments and our derivatives in cash flow hedges of offshore borrowings. This foreign currency risk is spread over a number of currencies and accordingly, we have disclosed the sensitivity analysis on a total portfolio basis and not separately by currency. It should be noted that our foreign currency exposure associated with cash flow hedge derivatives is predominantly in Euros and with our offshore investments predominantly in Hong Kong dollars, New Zealand
dollars, British pounds sterling and Chinese renminbi (relating to our investments in Hong Kong CSL Limited, TelstraClear Limited, Telstra Limited and Sequel Limited).
The following sensitivity analysis is based on our foreign currency risk exposures comprising the revaluation impact on our derivatives and borrowings and net foreign investments from a 10 percent adverse/favourable movement in foreign exchange rates based on our balances as at reporting date. At 30 June, had the Australian dollar against all applicable currencies moved as illustrated in Table C, with all other variables held constant and taking into account identified underlying exposures and related hedges, net profit and equity after tax would have been affected as follows:
(*) The impact of some of our borrowings de-designated from fair value hedge relationships or not in a hedge relationship has resulted in some volatility to profit or loss. The revaluation impact attributable to foreign exchange movements will largely offset between the derivatives and the borrowings, however there will be some profit or loss impact due to the fact that the derivatives are recorded at fair value and hence the foreign exchange movements are recognised at present value. The borrowings which are accounted for on an amortised cost basis will reflect revaluation movements for changes in the spot exchange rate which are not discounted. Therefore, the impact on profit or loss is primarily attributable to the discounting effect of the foreign exchange gains and losses on the hedging derivatives.
(^) Adverse and favourable impacts include $1 million (2011: $2 million) relating to purchases of property, plant and equipment, which would affect the cost of the asset and profit or loss as the assets are depreciated over their useful lives.
(**) Relates to the translation of the net assets of our foreign controlled entities including the impact of hedging. The net gain or loss in the sensitivity analysis represents the impact relating to the unhedged portion of the net assets of our foreign controlled entities.
The higher sensitivity in 2012 compared to 2011 relating to derivatives in cash flow hedges and net foreign investments is primarily due to the shift in value of our portfolio as at 30 June valuation dates.
18. Financial risk management (continued)
Table C Telstra Group10% adverse movement 10% favourable movement
Net profit or loss
Equity (foreign currency
translation reserve)
Equity (cash flow hedging
reserve)Net profit or
loss
Equity (foreign currency
translation reserve)
Equity (cash flow hedging
reserve)Year ended 30
June As at 30 June As at 30 JuneYear ended 30
June As at 30 June As at 30 JuneGain/(loss) Gain/(loss) Gain/(loss) Gain/(loss) Gain/(loss) Gain/(loss)2012 2011 2012 2011 2012 2011 2012 2011 2012 2011 2012 2011
$m $m $m $m $m $m $m $m $m $m $m $mRevaluation of derivatives and borrowings - de-designated from fair value hedges or not in a hedge relationship (*) . . . . . . . (10) (9) - - - - 12 11 - - - -Revaluation of derivatives and underlying exposure - cash flow hedges of forecast transactions (^) . . . . . . . (19) (23) - - - - 18 21 - - - -Revaluation of derivatives - cash flow hedges of offshore loans . . . . . . . . . . . . - - - - (32) (11) - - - - 40 14Net foreign investments (**) - - (106) (90) - - - - 130 110 - -
(29) (32) (106) (90) (32) (11) 30 32 130 110 40 14
For
per
sona
l use
onl
y

Telstra Corporation Limited and controlled entities
137
Notes to the Financial Statements (continued)
a) Risk and mitigation (continued)
Credit risk
Credit risk is the risk that a contracting entity will not complete its obligations under a financial instrument and cause us to incur a financial loss. We have exposure to credit risk on all financial assets included in our statement of financial position, comprising cash and cash equivalents, trade and other receivables, loan receivables, available-for-sale financial assets, finance lease receivables and derivative financial instruments. To help manage this risk:
• we have a policy for performing credit risk assessments on new and existing customers and where required, establishing credit limits and payment terms for entities we deal with;
• we monitor exposure to high risk debtors on a predictive and pro-active basis;
• we may require collateral where appropriate; and• we manage exposure to individual entities we either transact with
or enter into derivative contracts with, through a system of credit limits.
Where entities have a right of set-off and intend to settle on a net basis, this set-off has been recognised in the financial statements on a net basis. We may also be subject to credit risk for transactions which are not included in the statement of financial position, such as when we provide a guarantee for another party. Details of our contingent liabilities are disclosed in note 23 and note 30.
Trade and other receivables consist of a large number of customers, spread across the consumer, business, enterprise, government and international sectors. We do not have any significant credit risk exposure to a single customer or groups of customers. Ageing analysis and ongoing credit evaluation is performed on the financial condition of our customers and, where appropriate, an allowance for doubtful debt is raised. In addition, receivable balances are monitored on an ongoing basis with the result that our exposure to bad debts is not significant. For further details regarding our trade and other receivables refer to note 10.
In relation to our transactions in money market instruments, forward foreign currency contracts, and cross currency and interest rate swaps, there is only a credit risk where the contracting entity is liable to pay us in the event of a closeout (i.e. in-the-money). We have policies that limit the amount of credit exposure to any financial institution. These risk limits are regularly monitored. Derivative counterparties and cash transactions are limited to financial institutions that meet minimum credit rating criteria in accordance with our policy requirements. Our credit risk and financial instruments are spread amongst a number of financial institutions.
One of the methods that we use to manage the credit risk exposure relating to these instruments is to monitor our exposure by country of financial institution based on a value at risk (VaR) methodology. VaR calculations are a technique that estimates the potential losses that could occur on risk positions in the future as a result of movements in market rates over a specified time horizon given a specified level of confidence which is statistically determined.
The amounts included in Table D below include the in-the-money market values combined with a potential credit calculation and will therefore not equate to the accounting carrying value, fair value or face value of the transactions as disclosed in note 17.
In determining the potential credit limit factors to be used in these calculations, the following should be noted:
• reference is made to the historical volatility factors relevant to the particular currencies/interest rates applicable to the instruments;
• in determining the volatility factors, reference has been made to the holding period or in this case the maturity of the instrument. In some cases, the transaction can have a maturity of up to 10 years and the potential volatility needs to reflect the possible movements over this time period given historical observations; and
• we have used 90% (2011: 90%) confidence levels to determine the applicable potential credit limit factors.
The VaR based methodology employed has the following limitations:
• the use of historical data as a proxy for estimating future events may not cover all potential events, in particular this is relevant when trying to estimate potential volatility over a long holding period such as 10 years; and
• the use of a 90% confidence level, by definition, may not take into account movements that may occur outside of this confidence threshold.
18. Financial risk management (continued)
For
per
sona
l use
onl
y

Telstra Corporation Limited and controlled entities
138
Notes to the Financial Statements (continued)
(a) Risk and mitigation (continued)
Credit risk (continued)
Liquidity risk
Liquidity risk includes the risk that, as a result of our operational liquidity requirements:
• we will not have sufficient funds to settle a transaction on the due date;
• we will be forced to sell financial assets at a value which is less than what they are worth; or
• we may be unable to settle a financial liability or recover a financial asset at all.
To help reduce these risks we:
• have a liquidity policy which targets a minimum and average level of cash and cash equivalents to be maintained;
• have readily accessible standby facilities and other funding arrangements in place;
• generally use instruments that are tradeable in highly liquid markets; and
• have a liquidity portfolio structure that requires surplus funds to be invested within various bands of liquid instruments ranging from ultra liquid, highly liquid to liquid instruments.
During the prior year new policy settings were implemented to raise the minimum level of liquidity and to pre-fund major payments. This has resulted in the holding of higher levels of liquidity.
We monitor rolling forecasts of liquidity reserves on the basis of expected cash flow. Our objective is to maintain a balance between continuity of funding and flexibility through the use of liquid instruments, borrowings and committed available credit lines.
At 30 June 2012, based on contractual face values, 18% of our debt (after hedging) comprising offshore borrowings, Telstra bonds and domestic loans and excluding promissory notes, will mature in less than one year (2011: 13%).
The contractual maturity of our fixed and floating rate financial liabilities and derivatives and the corresponding carrying values are shown in the following Table E. The contractual maturity amounts (nominal cash flows) represent the future undiscounted principal and interest cash flows and therefore do not equate to the carrying values. These amounts are reported in Australian dollars based on the applicable exchange rate as at 30 June. We have also included derivative financial assets in the following table on the basis that these assets have a direct relationship with an underlying financial liability and both the asset and the liability are managed together.
For floating rate instruments, the amount disclosed is determined by reference to the current market pricing for interest rates over the period to maturity.
Also affecting liquidity are cash and cash equivalents, available for sale financial assets and other interest and non-interest bearing financial assets. Liquidity risk associated with these financial instruments is represented by the face values as shown in note 17 Table C.
18. Financial risk management (continued)
Table D Telstra GroupCredit risk concentrations (VaR based)
As at 30 June2012 2011% $m % $m
Australia . . . . . 25.8 3,190 16.7 1,644United States . . . 21.1 2,616 24.8 2,440Japan . . . . . . . 0.5 63 0.6 56Europe . . . . . . 20.5 2,530 19.4 1,911United Kingdom . 15.3 1,889 17.3 1,703Canada . . . . . . 0.1 11 6.4 629Switzerland . . . . 0.6 70 1.0 99China/Hong Kong 15.3 1,892 10.2 1,001Singapore . . . . 0.6 71 3.3 324New Zealand . . . 0.2 27 0.3 36
100.0 12,359 100.0 9,843
For
per
sona
l use
onl
y
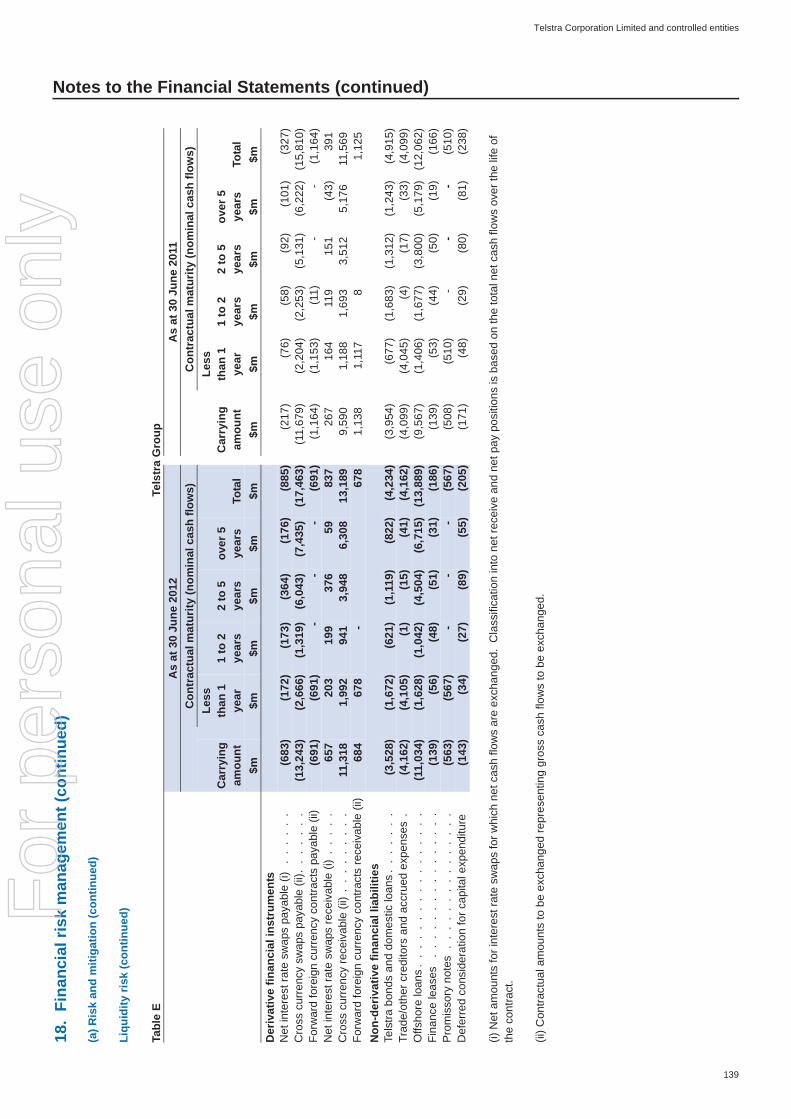
Telstra Corporation Limited and controlled entities
139
Notes to the Financial Statements (continued)(a
) Ris
k an
d m
itiga
tion
(con
tinue
d)
Liqu
idity
risk
(con
tinue
d)
(i) N
et a
mou
nts
for i
nter
est r
ate
swap
s fo
r whi
ch n
et c
ash
flow
s ar
e ex
chan
ged.
Cla
ssifi
catio
n in
to n
et re
ceiv
e an
d ne
t pay
pos
ition
s is
bas
ed o
n th
e to
tal n
et c
ash
flow
s ov
er th
e lif
e of
th
e co
ntra
ct.
(ii) C
ontra
ctua
l am
ount
s to
be
exch
ange
d re
pres
entin
g gr
oss
cash
flow
s to
be
exch
ange
d.
18.
Fina
ncia
l ris
k m
anag
emen
t (co
ntin
ued)
Tabl
e E
Tels
tra
Gro
upA
s at
30
June
201
2A
s at
30
June
201
1C
ontr
actu
al m
atur
ity (n
omin
al c
ash
flow
s)C
ontr
actu
al m
atur
ity (n
omin
al c
ash
flow
s)
Car
ryin
g am
ount
Less
th
an 1
ye
ar1
to 2
ye
ars
2 to
5
year
sov
er 5
ye
ars
Tota
l C
arry
ing
amou
nt
Less
th
an 1
ye
ar1
to 2
ye
ars
2 to
5
year
sov
er 5
ye
ars
Tota
l$m
$m$m
$m$m
$m$m
$m$m
$m$m
$mD
eriv
ativ
e fin
anci
al in
stru
men
tsN
et in
tere
st ra
te s
wap
s pa
yabl
e (i)
. .
. .
. .
(683
)(1
72)
(173
)(3
64)
(176
)(8
85)
(217
)(7
6)(5
8)(9
2)(1
01)
(327
)C
ross
cur
renc
y sw
aps
paya
ble
(ii).
. .
. .
. .
(13,
243)
(2,6
66)
(1,3
19)
(6,0
43)
(7,4
35)
(17,
463)
(11,
679)
(2,2
04)
(2,2
53)
(5,1
31)
(6,2
22)
(15,
810)
Forw
ard
fore
ign
curr
ency
con
tract
s pa
yabl
e (ii
)(6
91)
(691
)-
--
(691
)(1
,164
)(1
,153
)(1
1)-
-(1
,164
)N
et in
tere
st ra
te s
wap
s re
ceiv
able
(i)
. .
. .
.65
720
319
937
659
837
267
164
119
151
(43)
391
Cro
ss c
urre
ncy
rece
ivab
le (i
i) .
. .
. .
. .
. .
11,3
181,
992
941
3,94
86,
308
13,1
899,
590
1,18
81,
693
3,51
25,
176
11,5
69Fo
rwar
d fo
reig
n cu
rren
cy c
ontra
cts
rece
ivab
le (i
i) 68
467
8-
678
1,13
81,
117
81,
125
Non
-der
ivat
ive
finan
cial
liab
ilitie
sTe
lstra
bon
ds a
nd d
omes
tic lo
ans
. .
. .
. .
.(3
,528
)(1
,672
)(6
21)
(1,1
19)
(822
)(4
,234
)(3
,954
)(6
77)
(1,6
83)
(1,3
12)
(1,2
43)
(4,9
15)
Trad
e/ot
her c
redi
tors
and
acc
rued
exp
ense
s .
(4,1
62)
(4,1
05)
(1)
(15)
(41)
(4,1
62)
(4,0
99)
(4,0
45)
(4)
(17)
(33)
(4,0
99)
Offs
hore
loan
s.
. .
. .
. .
. .
. .
. .
. .
. .
(11,
034)
(1,6
28)
(1,0
42)
(4,5
04)
(6,7
15)
(13,
889)
(9,5
67)
(1,4
06)
(1,6
77)
(3,8
00)
(5,1
79)
(12,
062)
Fina
nce
leas
es .
. .
. .
. .
. .
. .
. .
. .
.(1
39)
(56)
(48)
(51)
(31)
(186
)(1
39)
(53)
(44)
(50)
(19)
(166
)P
rom
isso
ry n
otes
. .
. .
. .
. .
. .
. .
. .
.(5
63)
(567
)-
--
(567
)(5
08)
(510
)-
--
(510
)D
efer
red
cons
ider
atio
n fo
r cap
ital e
xpen
ditu
re(1
43)
(34)
(27)
(89)
(55)
(205
)(1
71)
(48)
(29)
(80)
(81)
(238
)
For
per
sona
l use
onl
y

Telstra Corporation Limited and controlled entities
140
Notes to the Financial Statements (continued)
(a) Risk and mitigation (continued)
Liquidity risk (continued)
Financing arrangements
We have promissory note facilities in place in the United States, Europe, Australia and New Zealand under which we may nominally issue up to $9,183 million (2011: $9,198 million). As at 30 June 2012, we had on issue $563 million (2011: $508 million) under these facilities. As at 30 June 2012, our subsidiary CSL Limited had a bank bill acceptance facility of $111 million (2011: $93 million) of which $84 million was issued (2011: $92 million). These facilities are not committed or underwritten and we have no guaranteed access to the funds. Generally, given we retain suitable ratings, our facilities are available, subject to market conditions, unless we default on any terms applicable under the relevant agreements or become insolvent. During the current and prior years there were no defaults or breaches on any of our facility agreements.
(b) Hedging strategies
We hold a number of different financial instruments to hedge risks relating to underlying transactions. Our major exposure to interest rate risk and foreign currency risk arises from our long term borrowings. We also have translation currency risk associated with our offshore investments and transactional currency exposures such as purchases in foreign currencies.
We designate certain derivatives as either:
• hedges of the fair value of recognised liabilities (fair value hedges);
• hedges of foreign currency risk associated with recognised liabilities or highly probable forecast transactions (cash flow hedges); or
• hedges of a net investment in a foreign operation.
The terms and conditions in relation to our derivative financial instruments are similar to the terms and conditions of the underlying hedged items to maximise hedge effectiveness.
Financial instruments de-designated from fair value hedge relationships or not in a designated hedge relationship
Our financial instruments de-designated from fair value hedge relationships or not in designated hedge relationships comprise:
• a number of offshore borrowings denominated in United States dollars, Euros and British pounds sterling which were in fair value hedges and were de-designated from the hedge relationship for hedge accounting purposes;
• a long term Euro bond issue which is not in a designated hedge relationship for hedge accounting purposes; and
• some forward foreign currency contracts and cross currency swaps that are not in a designated hedge relationship for hedge accounting purposes, used to economically hedge fair value movements for changes in foreign exchange rates associated with trade creditors, loans from wholly owned controlled entities and other liabilities denominated in a foreign currency.
All our financial liabilities de-designated or not in designated hedge relationships are in effective economic relationships based on contractual face value amounts and cash flows over the life of the transaction.
All other hedge relationships met hedge effectiveness requirements for hedge accounting purposes at the reporting date.
Refer to section (c) for details on our hedge relationships based on contractual face value amounts and cash flows. Refer to note 7 for the impact on finance costs relating to borrowings de-designated or not in hedge relationships.
18. Financial risk management (continued)
Table F Telstra GroupAs at 30 June
2012 2011$m $m
We have access to the following lines of credit:
Credit standby arrangementsUnsecured committed cash standby facilities which are subject to annual review. . . . . . . . . . . . . . . . . 759 593Amount of credit unused . . . . . . . . . . . . . . . . . . . . . . . . . . . . . . . . . . . . . . . . . . . . . . 759 593
For
per
sona
l use
onl
y

Telstra Corporation Limited and controlled entities
141
Notes to the Financial Statements (continued)
(b) Hedging strategies (continued)
Fair value hedges
We hold cross currency principal and interest rate swaps to mitigate our exposure to changes in the fair value of foreign denominated debt from fluctuations in foreign currency and interest rates. The hedged items designated are a portion of our foreign currency denominated borrowings. The changes in the fair values of the hedged items resulting from movements in exchange rates and interest rates are offset against the changes in the fair value of the cross currency and interest rate swaps. The objective of this hedging is to convert foreign currency borrowings to floating Australian dollar borrowings.
The net impact on finance costs from remeasuring the fair value of the hedge instruments together with the gains and losses in relation to the hedged item where those gains or losses relate to the hedged risks, largely represents ineffectiveness attributable to movements in Telstra’s borrowing margins.
The remeasurement of the hedged items resulted in a loss before tax of $208 million (2011: gain of $180 million) and the changes in the fair value of the hedging instruments resulted in a gain before tax of $199 million (2011: loss of $207 million). This results in a net loss before tax of $9 million and a net loss after tax of $6 million (2011: net loss before tax of $27 million and net loss after tax of $19 million).
Refer to note 7 for the impact on finance costs relating to borrowings in fair value hedges.
The effectiveness of the hedging relationship is tested prospectively, both on inception and in subsequent periods, and retrospectively by means of statistical methods using a regression analysis. Regression analysis is used to analyse the relationship between the derivative financial instruments (the dependent variable) and the underlying borrowings (the independent variable). The primary objective is to determine if changes to the hedged item and derivative are highly correlated and, thus, supportive of the assertion that there will be a high degree of offset in fair values achieved by the hedge.
Refer to note 17, Table G and Table H, for the value of our derivatives designated as fair value hedges.
Cash flow hedges
Cash flow hedges are predominantly used to hedge exposures relating to our borrowings and our ongoing business activities where we have highly probable purchase or settlement commitments in foreign currencies.
We enter into cross currency and interest rate swaps as cash flow hedges of future payments denominated in foreign currency resulting from our long term offshore borrowings. The hedged items designated are a portion of the outflows associated with these foreign denominated borrowings. The objective of this hedging is to hedge foreign currency risks arising from spot rate changes and thereby mitigate the risk of payment fluctuations as a result of exchange rate movements.
We also enter into forward exchange contracts as cash flow hedges to hedge forecast transactions denominated in foreign currency which hedge foreign currency risk arising from spot rate changes. The hedged items comprise a portion of highly probable forecast payments for operating and capital items primarily denominated in United States dollars.
The effectiveness of the hedging relationship relating to our borrowings is tested prospectively, both on inception and in subsequent periods, and retrospectively by means of statistical methods using a regression analysis. The actual derivative financial instruments in a cash flow hedge are regressed against the hypothetical derivative. The primary objective is to determine if changes to the hedged item and derivative are highly correlated and, thus, supportive of the assertion that there will be a high degree of offset in cash flows achieved by the hedge.
The effectiveness of our hedges relating to highly probable forecast transactions is assessed prospectively based on matching of critical terms. As both the nominal volumes and currencies of the hedged item and the hedging instrument are identical, a highly effective hedging relationship is expected. An effectiveness test is carried out retrospectively using the cumulative dollar-offset method. For this, the changes in the fair values of the hedging instrument and the hedged item attributable to exchange rate changes are calculated and a ratio is created. If this ratio is between 80 and 125, the hedge is effective.
In relation to our offshore borrowings, ineffectiveness on our cash flow hedges is recognised in the income statement to the extent that the change in the fair value of the hedging derivatives in the cash flow hedge exceed the change in value of the underlying borrowings in the cash flow hedge during the hedging period. During the year, there was no material ineffectiveness attributable to our cash flow hedges (refer to note 7). Also during the year, there was no material impact on profit or loss as a result of discontinuing hedge accounting for forecast transactions no longer expected to occur.
For hedge gains or losses transferred to and from the cash flow hedge reserve refer to the statement of comprehensive income.
Refer to note 17, Table G and Table H, for the value of our derivatives designated as cash flow hedges.
18. Financial risk management (continued)
For
per
sona
l use
onl
y

Telstra Corporation Limited and controlled entities
142
Notes to the Financial Statements (continued)
(b) Hedging strategies (continued)
Cash flow hedges (continued)
The following table shows the maturities of the payments in our cash flow hedges (i.e when the cash flows are expected to occur). These amounts represent the undiscounted cash flows reported in Australian dollars based on the applicable exchange rate as at 30 June and represent the identified foreign currency exposures at reporting date in relation to our cash flow hedges.
(i) These amounts will affect our income statement in the same period as the cash flows are expected to occur.
(ii) For purchases of property, plant and equipment, the gains and losses on the associated hedging instruments are included in the measurement of the initial cost of the asset. The hedged asset purchases affect profit or loss as the assets are depreciated over their useful lives. Refer to note 2 for our depreciation policies for property, plant and equipment.
(iii) The impact on our income statement from foreign currency movements associated with these hedged borrowings will affect profit or loss over the life of the borrowing, however the impact on profit or loss is expected to be nil as the borrowings are effectively hedged.
Hedges of net investments in foreign operations
We have exposure to foreign currency risk as a result of our investments in offshore activities. This risk is created by the translation of the net assets of these entities from their functional currency to Australian dollars. We hedge a portion of our investments in foreign operations to mitigate exposure to this risk using forward foreign currency contracts, cross currency swaps and/or borrowings in the relevant currency of the investment.
The effectiveness of the hedging relationship is tested using prospective and retrospective effectiveness tests. In a retrospective effectiveness test, the changes in the fair value of the hedging instruments and the change in the value of the hedged net investment from spot rate changes are calculated and a ratio is created. If this ratio is between 80 and 125 percent, the hedge is effective. The prospective effectiveness test is performed based on matching of critical terms. As both the nominal volumes and currencies of the hedged item and the hedging instrument are identical, a highly effective hedging relationship is expected.
During the year there was no material ineffectiveness attributable to our hedges of net foreign investments.
In the statement of comprehensive income, net losses before tax of $31 million and after tax of $22 million (2011: gains before tax of $140 million and after tax of $98 million) on our hedging instruments were taken directly to equity during the year in the foreign currency translation reserve.
Refer to note 17, Table G and Table H, for the value of our derivatives designated as hedges of net foreign investments.
(c) Hedge relationships
The following tables provide additional context around our hedge transactions and in particular describes how we arrive at our economic residual risk position as a result of the hedges executed. It should be noted that the economic residual position in each of the following tables will not be equal to the carrying values.
Table H and Table I describe each of our hedge relationships, using cross currency and interest rate swaps as the hedging instruments and comprise effective economic relationships based on contractual face value amounts and cash flows, including hedge relationships that have been de-designated for hedge accounting purposes and foreign denominated borrowings that are not in a designated hedge relationship for hedge accounting purposes. These hedging instruments are used to hedge our offshore foreign denominated borrowings, some domestic borrowings, our offshore investment in Hong Kong CSL Limited and a loan from a wholly owned controlled entity. Outlined in the following tables is the pre hedge underlying exposure, each leg of our cross currency and interest rate swaps and the end post hedge position. This post hedge position represents our net final currency and interest positions and is represented in our residual economic position as described in note 17 Table D.
18. Financial risk management (continued)
Table G Telstra GroupNominal cash
outflowsAs at 30 June
2012 2011$m $m
Highly probable forecast transactionsNon-Capital items (i)- less than one year . . . . . . . . . . . (541) (548)Capital items (ii)- less than one year . . . . . . . . . . . (11) (63)
(552) (611)Borrowings (iii)- less than one year . . . . . . . . . . . (527) (831)- one to five years . . . . . . . . . . . . (3,235) (2,174)- greater than five years . . . . . . . . . (2,653) (4,516)
(6,415) (7,521)
For
per
sona
l use
onl
y

Telstra Corporation Limited and controlled entities
143
Notes to the Financial Statements (continued)(c
) Hed
ge re
latio
nshi
ps (c
ontin
ued)
18.
Fina
ncia
l ris
k m
anag
emen
t (co
ntin
ued)
Tabl
e H
Tels
tra
Gro
up -
30 J
une
2012
Der
ivat
ive
hedg
ing
inst
rum
ents
- cr
oss
curr
ency
and
inte
rest
rate
sw
aps
Fina
l cur
renc
y an
d in
tere
st p
ositi
ons
Face
val
ueN
otio
nal/F
ace
valu
eN
otio
nal/F
ace
Valu
e
Pre
hedg
e un
derly
ing
expo
sure
Inte
rest
rate
sw
ap re
ceiv
e fix
ed/(p
ay)
float
Cro
ss
curr
ency
sw
ap
rece
ive/
(pay
) flo
at
Cro
ss
curr
ency
sw
ap re
ceiv
e fix
ed
Cro
ss
curr
ency
sw
ap
rece
ive/
(pay
) flo
at
Cro
ss
curr
ency
sw
ap (p
ay)
fixed
Inte
rest
rate
sw
ap re
ceiv
e flo
at/(p
ay)
fixed
Inte
rest
rate
sw
ap (p
ay)
float
/rece
ive
fixed
(Pay
)/rec
eive
flo
at(P
ay) f
ixed
Loca
l cu
rren
cyLo
cal c
urre
ncy
Fina
l leg
- A
ustr
alia
n do
llar
Aus
tral
ian
dolla
r$m
$m$m
$m$m
$m$m
$m$m
In h
edge
rela
tions
hips
Offs
hore
bor
row
ings
- fix
edS
wis
s fra
ncs
. .
. .
. .
. .
.(2
25)
(225
)22
5-
(252
)-
--
(252
)-
Eur
os .
. .
. .
. .
. .
. .
.(5
,325
)(5
,250
)5,
250
75(7
,877
)-
(3,6
79)
-(4
,198
)(3
,679
)B
ritis
h po
unds
ste
rling
. .
. .
(200
)(2
00)
200
-(5
84)
-(3
60)
-(2
24)
(360
)H
ong
Kon
g do
llar
. .
. .
. .
(330
)-
-33
0(5
0)-
--
(50)
-Ja
pane
se y
en .
. .
. .
. .
.(4
7,00
0)-
-47
,000
(514
)(1
63)
(409
)-
(105
)(5
72)
Uni
ted
Stat
es d
olla
r .
. .
. .
(1,1
50)
(1,0
00)
1,00
015
0(1
,158
)-
(955
)-
(203
)(9
55)
Aus
tralia
n do
llar
. .
. .
. .
.(5
0)-
--
--
-(5
0)(5
0)-
Offs
hore
bor
row
ings
- flo
atin
gS
wis
s fra
ncs
. .
. .
. .
. .
.(5
50)
(550
)55
0-
(599
)-
--
(599
)-
Eur
os .
. .
. .
. .
. .
. .
.(5
00)
(500
)50
0-
(859
)-
--
(859
)-
Japa
nese
yen
. .
. .
. .
. .
(1,0
00)
-1,
000
-(1
2)-
--
(12)
-U
nite
d St
ates
dol
lar
. .
. .
.(6
00)
-60
0-
(630
)-
--
(630
)-
Dom
estic
loan
s - f
loat
ing
Aus
tralia
n do
llar
. .
. .
. .
.(2
75)
--
--
-(2
75)
--
(275
)N
et fo
reig
n in
vest
men
tsH
ong
Kon
g do
llar
. .
. .
. .
8,33
2-
(3,7
00)
-46
0-
--
460
-Lo
ans
from
who
lly o
wne
d co
ntro
lled
entit
ies
New
Zea
land
dol
lar
. .
. .
.(3
00)
-30
0-
(228
)-
--
(228
)-
(12,
303)
(163
)(5
,678
)(5
0)(6
,950
)(5
,841
)
For
per
sona
l use
onl
y

Telstra Corporation Limited and controlled entities
144
Notes to the Financial Statements (continued)(c
) Hed
ge re
latio
nshi
ps (c
ontin
ued)
18.
Fina
ncia
l ris
k m
anag
emen
t (co
ntin
ued)
Tabl
e I
Tels
tra G
roup
- 30
Jun
e 20
11
Der
ivat
ive
hedg
ing
inst
rum
ents
- cr
oss
curr
ency
and
inte
rest
rate
sw
aps
Fina
l cur
renc
y an
d in
tere
st
posi
tions
Face
val
ueN
otio
nal/F
ace
valu
eN
otio
nal/F
ace
Valu
e
Pre
hed
ge
unde
rlyin
g ex
posu
re
Inte
rest
rate
sw
ap re
ceiv
e fix
ed/(p
ay)
float
Cro
ss
curr
ency
sw
ap re
ceiv
e/(p
ay) f
loat
Cro
ss
curr
ency
sw
ap re
ceiv
e fix
ed
Cro
ss
curr
ency
sw
ap re
ceiv
e/
(pay
) flo
at
Cro
ss
curr
ency
sw
ap (p
ay)
fixed
Inte
rest
rate
sw
ap re
ceiv
e flo
at/(p
ay)
fixed
(Pay
)/rec
eive
flo
at(P
ay) f
ixed
Loca
l cu
rren
cyLo
cal c
urre
ncy
Fina
l leg
- A
ustra
lian
dolla
rA
ustra
lian
dolla
r$m
$m$m
$m$m
$m$m
$m$m
In h
edge
rela
tions
hips
Offs
hore
bor
row
ings
- fix
edS
wis
s fra
ncs
. .
. .
. .
. .
.(5
50)
(550
)55
0-
(599
)-
(328
)(2
71)
(328
)E
uros
. .
. .
. .
. .
. .
. .
(4,0
00)
(4,0
00)
4,00
0-
(6,3
87)
-(3
,679
)(2
,708
)(3
,679
)B
ritis
h po
unds
ste
rling
. .
. .
(200
)(2
00)
200
-(5
84)
-(3
60)
(224
)(3
60)
Hon
g K
ong
dolla
r .
. .
. .
.(3
30)
--
330
(50)
--
(50)
-Ja
pane
se y
en .
. .
. .
. .
.(4
8,00
0)-
-48
,000
(526
)(1
63)
(409
)(1
17)
(572
)U
nite
d St
ates
dol
lar
. .
. .
.(1
,150
)(1
,000
)1,
000
150
(1,1
58)
-(9
55)
(203
)(9
55)
Offs
hore
bor
row
ings
- flo
atin
gA
ustra
lian
dolla
r .
. .
. .
. .
(250
)-
--
--
-(2
50)
-U
nite
d St
ates
dol
lar
. .
. .
.(1
,310
)(5
00)
1,31
0-
(1,8
85)
--
(1,8
85)
-
Dom
estic
loan
s - f
loat
ing
Aus
tralia
n do
llar
. .
. .
. .
.(2
75)
--
--
-(2
75)
-(2
75)
Net
fore
ign
inve
stm
ents
Hon
g K
ong
dolla
r .
. .
. .
.8,
088
-(3
,200
)-
452
--
452
-(1
0,73
7)(1
63)
(6,0
06)
(5,2
56)
(6,1
69)
For
per
sona
l use
onl
y
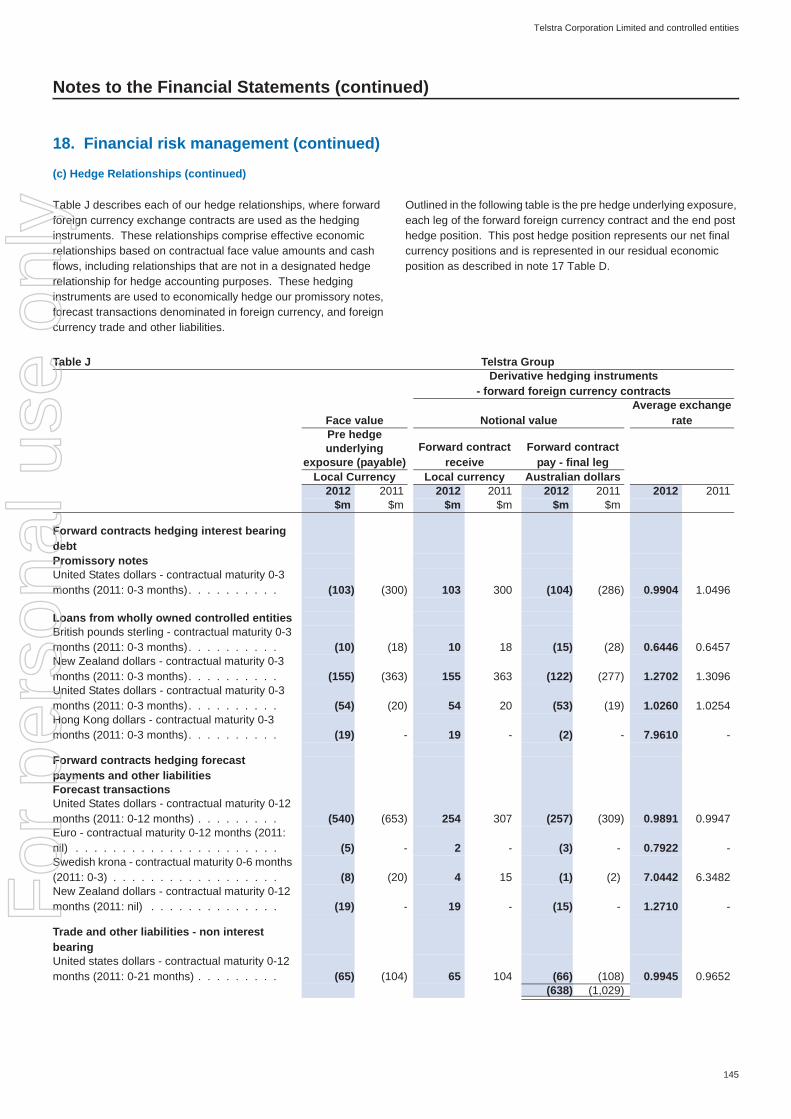
Telstra Corporation Limited and controlled entities
145
Notes to the Financial Statements (continued)
(c) Hedge Relationships (continued)
Table J describes each of our hedge relationships, where forward foreign currency exchange contracts are used as the hedging instruments. These relationships comprise effective economic relationships based on contractual face value amounts and cash flows, including relationships that are not in a designated hedge relationship for hedge accounting purposes. These hedging instruments are used to economically hedge our promissory notes, forecast transactions denominated in foreign currency, and foreign currency trade and other liabilities.
Outlined in the following table is the pre hedge underlying exposure, each leg of the forward foreign currency contract and the end post hedge position. This post hedge position represents our net final currency positions and is represented in our residual economic position as described in note 17 Table D.
18. Financial risk management (continued)
Table J Telstra GroupDerivative hedging instruments
- forward foreign currency contracts
Face value Notional valueAverage exchange
ratePre hedge underlying
exposure (payable)Forward contract
receiveForward contract
pay - final legLocal Currency Local currency Australian dollars
2012 2011 2012 2011 2012 2011 2012 2011$m $m $m $m $m $m
Forward contracts hedging interest bearing debtPromissory notesUnited States dollars - contractual maturity 0-3 months (2011: 0-3 months). . . . . . . . . . (103) (300) 103 300 (104) (286) 0.9904 1.0496
Loans from wholly owned controlled entitiesBritish pounds sterling - contractual maturity 0-3 months (2011: 0-3 months). . . . . . . . . . (10) (18) 10 18 (15) (28) 0.6446 0.6457New Zealand dollars - contractual maturity 0-3 months (2011: 0-3 months). . . . . . . . . . (155) (363) 155 363 (122) (277) 1.2702 1.3096United States dollars - contractual maturity 0-3 months (2011: 0-3 months). . . . . . . . . . (54) (20) 54 20 (53) (19) 1.0260 1.0254Hong Kong dollars - contractual maturity 0-3 months (2011: 0-3 months). . . . . . . . . . (19) - 19 - (2) - 7.9610 -
Forward contracts hedging forecast payments and other liabilitiesForecast transactionsUnited States dollars - contractual maturity 0-12 months (2011: 0-12 months) . . . . . . . . . (540) (653) 254 307 (257) (309) 0.9891 0.9947Euro - contractual maturity 0-12 months (2011: nil) . . . . . . . . . . . . . . . . . . . . . . (5) - 2 - (3) - 0.7922 -Swedish krona - contractual maturity 0-6 months (2011: 0-3) . . . . . . . . . . . . . . . . . . (8) (20) 4 15 (1) (2) 7.0442 6.3482New Zealand dollars - contractual maturity 0-12 months (2011: nil) . . . . . . . . . . . . . . (19) - 19 - (15) - 1.2710 -
Trade and other liabilities - non interest bearingUnited states dollars - contractual maturity 0-12 months (2011: 0-21 months) . . . . . . . . . (65) (104) 65 104 (66) (108) 0.9945 0.9652
(638) (1,029)
For
per
sona
l use
onl
y
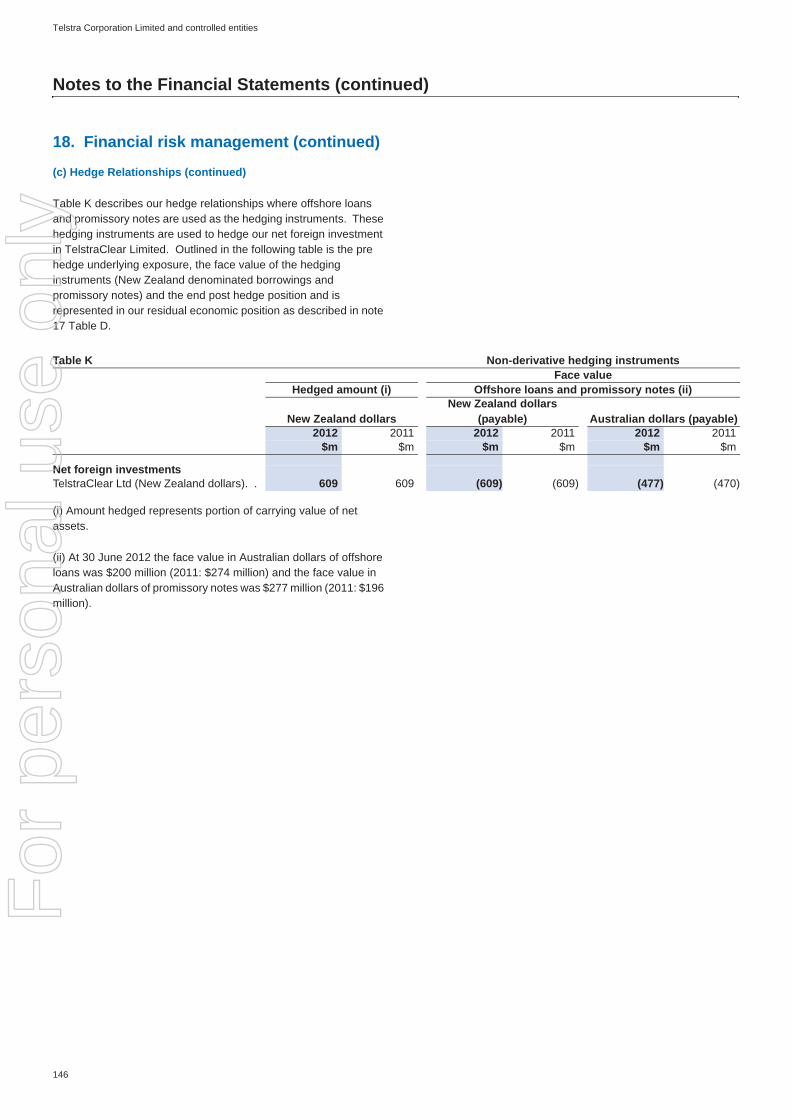
Telstra Corporation Limited and controlled entities
146
Notes to the Financial Statements (continued)
(c) Hedge Relationships (continued)
Table K describes our hedge relationships where offshore loans and promissory notes are used as the hedging instruments. These hedging instruments are used to hedge our net foreign investment in TelstraClear Limited. Outlined in the following table is the pre hedge underlying exposure, the face value of the hedging instruments (New Zealand denominated borrowings and promissory notes) and the end post hedge position and is represented in our residual economic position as described in note 17 Table D.
(i) Amount hedged represents portion of carrying value of net assets.
(ii) At 30 June 2012 the face value in Australian dollars of offshore loans was $200 million (2011: $274 million) and the face value in Australian dollars of promissory notes was $277 million (2011: $196 million).
18. Financial risk management (continued)
Table K Non-derivative hedging instrumentsFace value
Hedged amount (i) Offshore loans and promissory notes (ii)
New Zealand dollarsNew Zealand dollars
(payable) Australian dollars (payable)2012 2011 2012 2011 2012 2011
$m $m $m $m $m $m
Net foreign investmentsTelstraClear Ltd (New Zealand dollars). . 609 609 (609) (609) (477) (470)
For
per
sona
l use
onl
y

Telstra Corporation Limited and controlled entities
147
Notes to the Financial Statements (continued)
Contributed equity
Our contributed equity represents our authorised and issued fully paid ordinary shares. Each of our fully paid ordinary shares carries the right to one vote at a meeting of the company. Holders of our shares also have the right to receive dividends and to participate in the proceeds from sale of all surplus assets in proportion to the total shares issued in the event of the company winding up.
We have 12,443,074,357 (30 June 2011: 12,443,074,357) authorised fully paid ordinary shares on issue.
Share loan to employees
The share loan to employees account represents the outstanding balance of the non recourse loans provided to our employees under the Telstra Employee Share Ownership Plan Trusts (TESOP 97 and TESOP 99). Refer to note 27 for further details regarding these plans.
Shares held by employee share plans
The shares held by employee share plans represent the cost of shares held by the Telstra Growthshare Trust (Growthshare) in Telstra Corporation Limited. The purchase of these shares has been fully funded with contributions and intercompany loans from Telstra Corporation Limited. As at 30 June 2012 the number of shares totalled 29,324,833 (2011: 32,419,972). These shares are excluded from the calculation of basic and diluted earnings per share. Refer to note 3 for further details.
Net services received under employee share plans
The net services received under the employee share plans account is used to record the cumulative value of our options, performance rights, restricted shares, incentive shares, direct shares and ownshares issued under Growthshare. Contributions by Telstra Corporation Limited to Growthshare are also included in this account.
19. Share capital
Telstra GroupAs at 30 June
2012 2011$m $m
Contributed equity . . . . . . . . . . . . . . . . . . . . . . . . . . . . . . . . . . . . . . . . . . . . . . 5,793 5,793Share loan to employees. . . . . . . . . . . . . . . . . . . . . . . . . . . . . . . . . . . . . . . . . . . (67) (70)Shares held by employee share plans . . . . . . . . . . . . . . . . . . . . . . . . . . . . . . . . . . . . (145) (159)Net services received under employee share plans . . . . . . . . . . . . . . . . . . . . . . . . . . . . . 54 46
5,635 5,610
For
per
sona
l use
onl
y

Telstra Corporation Limited and controlled entities
148
Notes to the Financial Statements (continued)
20. Notes to the statement of cash flows
Telstra GroupYear ended 30 June
2012 2011Note $m $m
(a) Reconciliation of profit to net cash provided by operating activities
Profit for the year . . . . . . . . . . . . . . . . . . . . . . . . . . . . . . . . . . . . . . . . . . . . . . . 3,424 3,250Add/(subtract) the following transactionsDepreciation and amortisation . . . . . . . . . . . . . . . . . . . . . . . . . . . . . . . . . . . . . . . . 4,412 4,459Finance income . . . . . . . . . . . . . . . . . . . . . . . . . . . . . . . . . . . . . . . . . . . . . . . (134) (127)Finance costs. . . . . . . . . . . . . . . . . . . . . . . . . . . . . . . . . . . . . . . . . . . . . . . . . 1,022 1,262Distribution from FOXTEL Partnership . . . . . . . . . . . . . . . . . . . . . . . . . . . . . . . . . . . . (108) (70)Share based payments. . . . . . . . . . . . . . . . . . . . . . . . . . . . . . . . . . . . . . . . . . . . 31 12Defined benefit plan expense . . . . . . . . . . . . . . . . . . . . . . . . . . . . . . . . . . . . . . . . 223 268Net gain on disposal of property, plant and equipment. . . . . . . . . . . . . . . . . . . . . . . . . . . . (14) (14)Net gain on disposal of intangibles . . . . . . . . . . . . . . . . . . . . . . . . . . . . . . . . . . . . . . (9) -Net gain on disposal of associates . . . . . . . . . . . . . . . . . . . . . . . . . . . . . . . . . . . . . . - (8)Net loss/(gain) on disposal of controlled entities . . . . . . . . . . . . . . . . . . . . . . . . . . . . . . . 17 (69)Net loss/(gain) on sale of businesses . . . . . . . . . . . . . . . . . . . . . . . . . . . . . . . . . . . . 1 16Share of net (profits) from jointly controlled and associated entities . . . . . . . . . . . . . . . . . . . . . - (1)Impairment losses (excluding inventories, trade and other receivables) . . . . . . . . . . . . . . . . . . . 211 210Foreign exchange differences . . . . . . . . . . . . . . . . . . . . . . . . . . . . . . . . . . . . . . . . 3 (1)
Cash movements in operating assets and liabilities(net of acquisitions and disposals of controlled entity balances)Increase in trade and other receivables . . . . . . . . . . . . . . . . . . . . . . . . . . . . . . . . . . . (254) (327)Decrease in inventories . . . . . . . . . . . . . . . . . . . . . . . . . . . . . . . . . . . . . . . . . . . 15 10Increase in prepayments and other assets . . . . . . . . . . . . . . . . . . . . . . . . . . . . . . . . . . (102) (190)Increase in net defined benefit . . . . . . . . . . . . . . . . . . . . . . . . . . . . . . . . . . . . . . . . (340) (348)Increase in trade and other payables . . . . . . . . . . . . . . . . . . . . . . . . . . . . . . . . . . . . 509 67Increase/(decrease) in revenue received in advance . . . . . . . . . . . . . . . . . . . . . . . . . . . . 334 (143)Decrease in net taxes payable . . . . . . . . . . . . . . . . . . . . . . . . . . . . . . . . . . . . . . . . (87) (204)Increase/(decrease) in provisions . . . . . . . . . . . . . . . . . . . . . . . . . . . . . . . . . . . . . . 122 (34)Net cash provided by operating activities. . . . . . . . . . . . . . . . . . . . . . . . . . . . . . . . . 9,276 8,018
(b) Cash and cash equivalents
Cash at bank and on hand . . . . . . . . . . . . . . . . . . . . . . . . . . . . . . . . . . . . . . . . . . 362 356Bank deposits, bills of exchange and promissory notes . . . . . . . . . . . . . . . . . . . . . . . . . . . 3,583 2,274Total cash and cash equivalents . . . . . . . . . . . . . . . . . . . . . . . . . . . . . . . . . . . . . . . 3,945 2,630Reconciliation to the statement of cash flowsCash and cash equivalents included in assets held for sale . . . . . . . . . . . . . . . . . . . . . . . . 12 - 7Cash and cash equivalents in the statement of cash flows . . . . . . . . . . . . . . . . . . . . . . . 3,945 2,637
For
per
sona
l use
onl
y
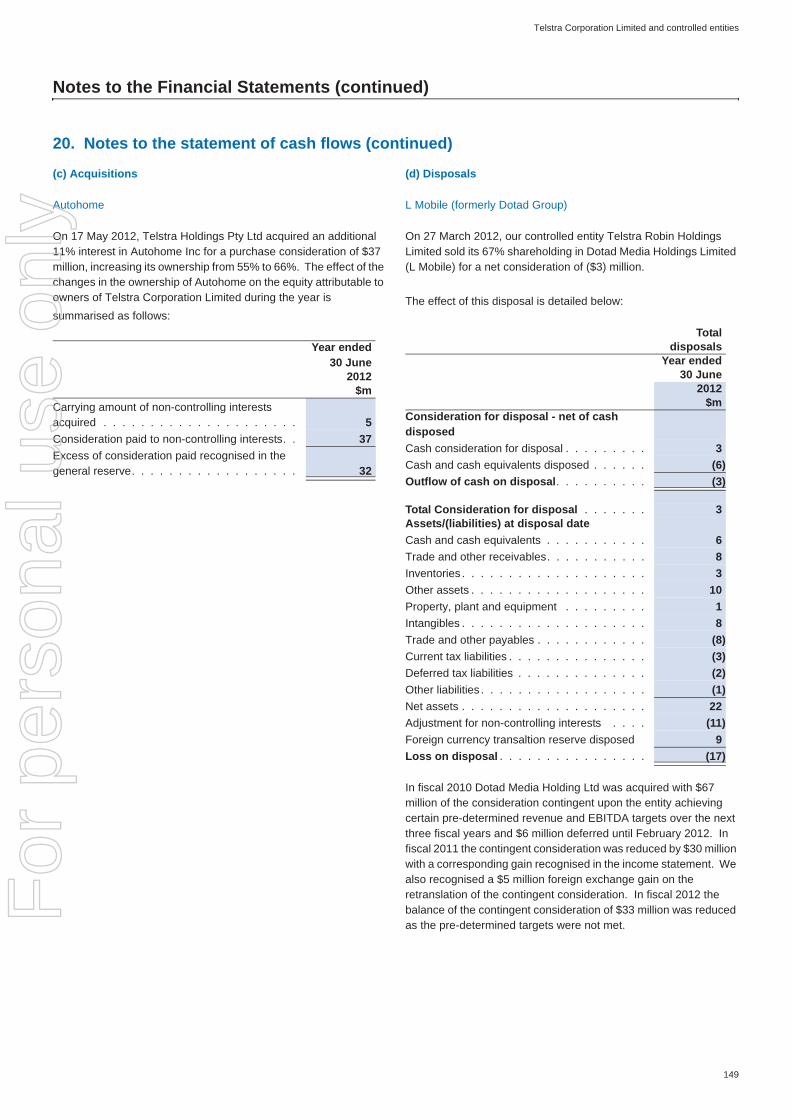
Telstra Corporation Limited and controlled entities
149
Notes to the Financial Statements (continued)
(c) Acquisitions
Autohome
On 17 May 2012, Telstra Holdings Pty Ltd acquired an additional 11% interest in Autohome Inc for a purchase consideration of $37 million, increasing its ownership from 55% to 66%. The effect of the changes in the ownership of Autohome on the equity attributable to owners of Telstra Corporation Limited during the year is summarised as follows:
(d) Disposals
L Mobile (formerly Dotad Group)
On 27 March 2012, our controlled entity Telstra Robin Holdings Limited sold its 67% shareholding in Dotad Media Holdings Limited (L Mobile) for a net consideration of ($3) million.
The effect of this disposal is detailed below:
In fiscal 2010 Dotad Media Holding Ltd was acquired with $67 million of the consideration contingent upon the entity achieving certain pre-determined revenue and EBITDA targets over the next three fiscal years and $6 million deferred until February 2012. In fiscal 2011 the contingent consideration was reduced by $30 million with a corresponding gain recognised in the income statement. We also recognised a $5 million foreign exchange gain on the retranslation of the contingent consideration. In fiscal 2012 the balance of the contingent consideration of $33 million was reduced as the pre-determined targets were not met.
20. Notes to the statement of cash flows (continued)
Year ended30 June
2012$m
Carrying amount of non-controlling interests acquired . . . . . . . . . . . . . . . . . . . . . 5Consideration paid to non-controlling interests. . 37Excess of consideration paid recognised in the general reserve. . . . . . . . . . . . . . . . . . 32
Totaldisposals
Year ended 30 June
2012$m
Consideration for disposal - net of cash disposedCash consideration for disposal . . . . . . . . . 3Cash and cash equivalents disposed . . . . . . (6)Outflow of cash on disposal. . . . . . . . . . (3)
Total Consideration for disposal . . . . . . . 3Assets/(liabilities) at disposal dateCash and cash equivalents . . . . . . . . . . . 6Trade and other receivables. . . . . . . . . . . 8Inventories . . . . . . . . . . . . . . . . . . . . 3Other assets . . . . . . . . . . . . . . . . . . . 10Property, plant and equipment . . . . . . . . . 1Intangibles . . . . . . . . . . . . . . . . . . . . 8Trade and other payables . . . . . . . . . . . . (8)Current tax liabilities . . . . . . . . . . . . . . . (3)Deferred tax liabilities . . . . . . . . . . . . . . (2)Other liabilities . . . . . . . . . . . . . . . . . . (1)Net assets . . . . . . . . . . . . . . . . . . . . 22Adjustment for non-controlling interests . . . . (11)Foreign currency transaltion reserve disposed 9Loss on disposal . . . . . . . . . . . . . . . . (17)
For
per
sona
l use
onl
y

Telstra Corporation Limited and controlled entities
150
Notes to the Financial Statements (continued)
Adstream
On 21 July 2011, we sold our 64.4% shareholding in Adstream (Aust) Pty Ltd for a total consideration of $24 million. Payment of the consideration has been deferred for a period of up to two years. As at 30 June 2011, Adstream’s net assets were transferred to non current assets held for sale.
ChinaM
On 21 October 2011, our controlled entity Octave Investments Holdings Limited sold its ChinaM business for a total consideration of $5 million.
The effect of these two disposals is detailed below:
(e) Significant investing and financing activities that involve components of non cash
Acquisition of assets by means of non cash transactions
The table above represents those assets acquired during the period which do not impact cash as the acquisition was made via finance leases or debt forgiveness.
*Relates to the acquisition of assets from Reach.
20. Notes to the statement of cash flows (continued)
Total disposalsYear ended
30 June2012
$mConsideration for disposalTotal consideration on disposal. . . . . . . . . . . 29Cash and cash equivalents disposed . . . . . . . (13)
16Deferred consideration for the disposal . . . . . . 24Outflow of cash on disposal . . . . . . . . . . . (8)
Total consideration for disposal . . . . . . . . . 29Assets/(liabilities) at disposal dateCash and cash equivalents. . . . . . . . . . . . . 13Trade and other receivables . . . . . . . . . . . . 8Property, plant and equipment . . . . . . . . . . . 2Intangibles . . . . . . . . . . . . . . . . . . . . . 30Other assets . . . . . . . . . . . . . . . . . . . . 1Trade and other payables . . . . . . . . . . . . . (4)Current tax liabilities . . . . . . . . . . . . . . . . (1)Provisions . . . . . . . . . . . . . . . . . . . . . (1)Deferred tax liabilities . . . . . . . . . . . . . . . (1)Other liabilities . . . . . . . . . . . . . . . . . . . (4)Net assets . . . . . . . . . . . . . . . . . . . . . 43Adjustment for non-controlling interests . . . . . . (13)Loss on disposal . . . . . . . . . . . . . . . . . (1)
Telstra GroupYear ended
30 June2012 2011
$m $m
Acquisition of property, plant and equipment by means of finance leases. . . . . . . . . . . 48 76Acquisition of property, plant and equipment by means of debt forgiveness* . . . . . . . . . - 108
For
per
sona
l use
onl
y
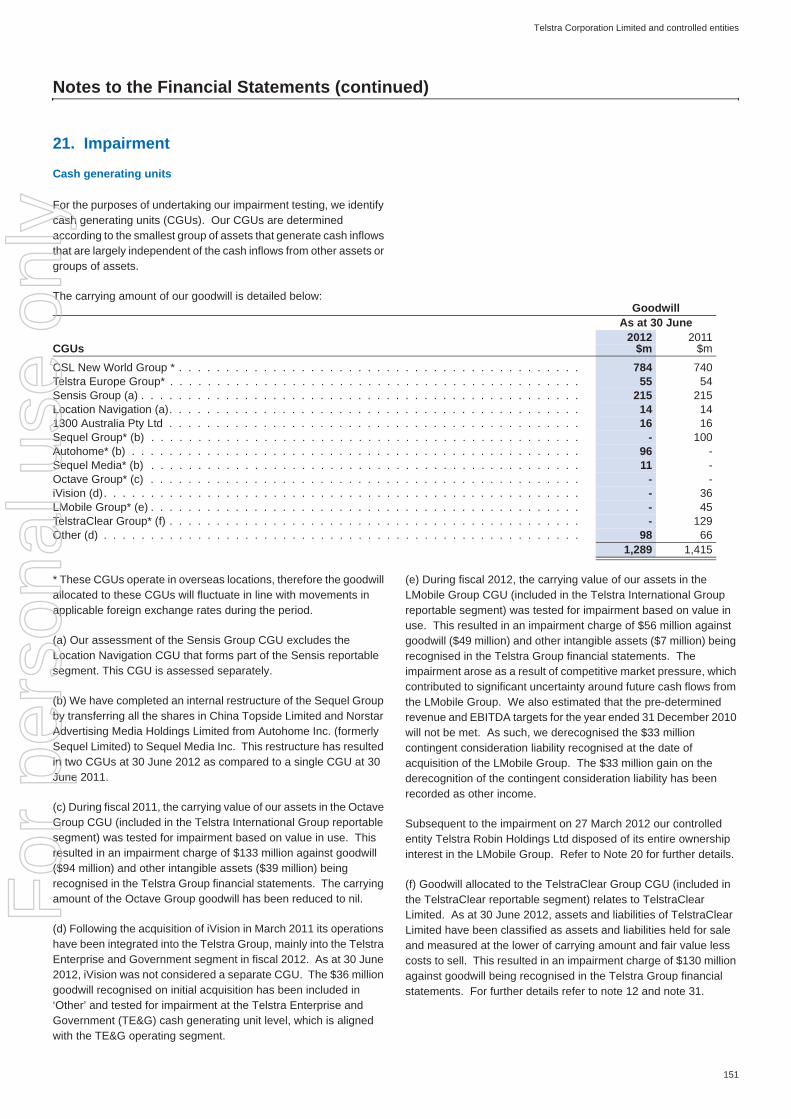
Telstra Corporation Limited and controlled entities
151
Notes to the Financial Statements (continued)
Cash generating units
For the purposes of undertaking our impairment testing, we identify cash generating units (CGUs). Our CGUs are determined according to the smallest group of assets that generate cash inflows that are largely independent of the cash inflows from other assets or groups of assets.
The carrying amount of our goodwill is detailed below:
* These CGUs operate in overseas locations, therefore the goodwill allocated to these CGUs will fluctuate in line with movements in applicable foreign exchange rates during the period.
(a) Our assessment of the Sensis Group CGU excludes the Location Navigation CGU that forms part of the Sensis reportable segment. This CGU is assessed separately.
(b) We have completed an internal restructure of the Sequel Group by transferring all the shares in China Topside Limited and Norstar Advertising Media Holdings Limited from Autohome Inc. (formerly Sequel Limited) to Sequel Media Inc. This restructure has resulted in two CGUs at 30 June 2012 as compared to a single CGU at 30 June 2011.
(c) During fiscal 2011, the carrying value of our assets in the Octave Group CGU (included in the Telstra International Group reportable segment) was tested for impairment based on value in use. This resulted in an impairment charge of $133 million against goodwill ($94 million) and other intangible assets ($39 million) being recognised in the Telstra Group financial statements. The carrying amount of the Octave Group goodwill has been reduced to nil.
(d) Following the acquisition of iVision in March 2011 its operations have been integrated into the Telstra Group, mainly into the Telstra Enterprise and Government segment in fiscal 2012. As at 30 June 2012, iVision was not considered a separate CGU. The $36 million goodwill recognised on initial acquisition has been included in ‘Other’ and tested for impairment at the Telstra Enterprise and Government (TE&G) cash generating unit level, which is aligned with the TE&G operating segment.
(e) During fiscal 2012, the carrying value of our assets in the LMobile Group CGU (included in the Telstra International Group reportable segment) was tested for impairment based on value in use. This resulted in an impairment charge of $56 million against goodwill ($49 million) and other intangible assets ($7 million) being recognised in the Telstra Group financial statements. The impairment arose as a result of competitive market pressure, which contributed to significant uncertainty around future cash flows from the LMobile Group. We also estimated that the pre-determined revenue and EBITDA targets for the year ended 31 December 2010 will not be met. As such, we derecognised the $33 million contingent consideration liability recognised at the date of acquisition of the LMobile Group. The $33 million gain on the derecognition of the contingent consideration liability has been recorded as other income.
Subsequent to the impairment on 27 March 2012 our controlled entity Telstra Robin Holdings Ltd disposed of its entire ownership interest in the LMobile Group. Refer to Note 20 for further details.
(f) Goodwill allocated to the TelstraClear Group CGU (included in the TelstraClear reportable segment) relates to TelstraClear Limited. As at 30 June 2012, assets and liabilities of TelstraClear Limited have been classified as assets and liabilities held for sale and measured at the lower of carrying amount and fair value less costs to sell. This resulted in an impairment charge of $130 million against goodwill being recognised in the Telstra Group financial statements. For further details refer to note 12 and note 31.
21. Impairment
GoodwillAs at 30 June
2012 2011CGUs $m $m
CSL New World Group * . . . . . . . . . . . . . . . . . . . . . . . . . . . . . . . . . . . . . . . . . . . 784 740Telstra Europe Group* . . . . . . . . . . . . . . . . . . . . . . . . . . . . . . . . . . . . . . . . . . . . 55 54Sensis Group (a) . . . . . . . . . . . . . . . . . . . . . . . . . . . . . . . . . . . . . . . . . . . . . . . 215 215Location Navigation (a). . . . . . . . . . . . . . . . . . . . . . . . . . . . . . . . . . . . . . . . . . . . 14 141300 Australia Pty Ltd . . . . . . . . . . . . . . . . . . . . . . . . . . . . . . . . . . . . . . . . . . . . 16 16Sequel Group* (b) . . . . . . . . . . . . . . . . . . . . . . . . . . . . . . . . . . . . . . . . . . . . . . - 100Autohome* (b) . . . . . . . . . . . . . . . . . . . . . . . . . . . . . . . . . . . . . . . . . . . . . . . . 96 -Sequel Media* (b) . . . . . . . . . . . . . . . . . . . . . . . . . . . . . . . . . . . . . . . . . . . . . . 11 -Octave Group* (c) . . . . . . . . . . . . . . . . . . . . . . . . . . . . . . . . . . . . . . . . . . . . . . - -iVision (d). . . . . . . . . . . . . . . . . . . . . . . . . . . . . . . . . . . . . . . . . . . . . . . . . . . - 36LMobile Group* (e) . . . . . . . . . . . . . . . . . . . . . . . . . . . . . . . . . . . . . . . . . . . . . . - 45TelstraClear Group* (f) . . . . . . . . . . . . . . . . . . . . . . . . . . . . . . . . . . . . . . . . . . . . - 129Other (d) . . . . . . . . . . . . . . . . . . . . . . . . . . . . . . . . . . . . . . . . . . . . . . . . . . . 98 66
1,289 1,415
For
per
sona
l use
onl
y
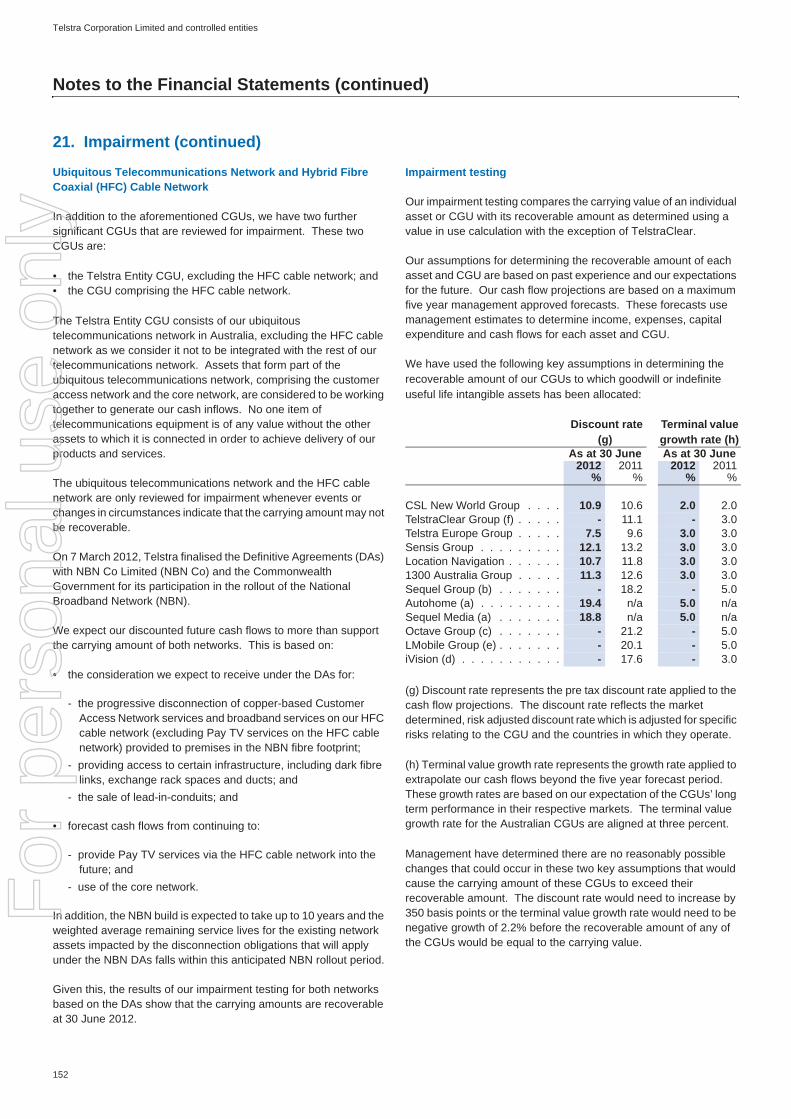
Telstra Corporation Limited and controlled entities
152
Notes to the Financial Statements (continued)
Ubiquitous Telecommunications Network and Hybrid Fibre Coaxial (HFC) Cable Network
In addition to the aforementioned CGUs, we have two further significant CGUs that are reviewed for impairment. These two CGUs are:
• the Telstra Entity CGU, excluding the HFC cable network; and• the CGU comprising the HFC cable network.
The Telstra Entity CGU consists of our ubiquitous telecommunications network in Australia, excluding the HFC cable network as we consider it not to be integrated with the rest of our telecommunications network. Assets that form part of the ubiquitous telecommunications network, comprising the customer access network and the core network, are considered to be working together to generate our cash inflows. No one item of telecommunications equipment is of any value without the other assets to which it is connected in order to achieve delivery of our products and services.
The ubiquitous telecommunications network and the HFC cable network are only reviewed for impairment whenever events or changes in circumstances indicate that the carrying amount may not be recoverable.
On 7 March 2012, Telstra finalised the Definitive Agreements (DAs) with NBN Co Limited (NBN Co) and the Commonwealth Government for its participation in the rollout of the National Broadband Network (NBN).
We expect our discounted future cash flows to more than support the carrying amount of both networks. This is based on:
• the consideration we expect to receive under the DAs for:
- the progressive disconnection of copper-based Customer Access Network services and broadband services on our HFC cable network (excluding Pay TV services on the HFC cable network) provided to premises in the NBN fibre footprint;
- providing access to certain infrastructure, including dark fibre links, exchange rack spaces and ducts; and
- the sale of lead-in-conduits; and
• forecast cash flows from continuing to:
- provide Pay TV services via the HFC cable network into the future; and
- use of the core network.
In addition, the NBN build is expected to take up to 10 years and the weighted average remaining service lives for the existing network assets impacted by the disconnection obligations that will apply under the NBN DAs falls within this anticipated NBN rollout period.
Given this, the results of our impairment testing for both networks based on the DAs show that the carrying amounts are recoverable at 30 June 2012.
Impairment testing
Our impairment testing compares the carrying value of an individual asset or CGU with its recoverable amount as determined using a value in use calculation with the exception of TelstraClear.
Our assumptions for determining the recoverable amount of each asset and CGU are based on past experience and our expectations for the future. Our cash flow projections are based on a maximum five year management approved forecasts. These forecasts use management estimates to determine income, expenses, capital expenditure and cash flows for each asset and CGU.
We have used the following key assumptions in determining the recoverable amount of our CGUs to which goodwill or indefinite useful life intangible assets has been allocated:
(g) Discount rate represents the pre tax discount rate applied to the cash flow projections. The discount rate reflects the market determined, risk adjusted discount rate which is adjusted for specific risks relating to the CGU and the countries in which they operate.
(h) Terminal value growth rate represents the growth rate applied to extrapolate our cash flows beyond the five year forecast period. These growth rates are based on our expectation of the CGUs’ long term performance in their respective markets. The terminal value growth rate for the Australian CGUs are aligned at three percent.
Management have determined there are no reasonably possible changes that could occur in these two key assumptions that would cause the carrying amount of these CGUs to exceed their recoverable amount. The discount rate would need to increase by 350 basis points or the terminal value growth rate would need to be negative growth of 2.2% before the recoverable amount of any of the CGUs would be equal to the carrying value.
21. Impairment (continued)
Discount rate (g)
Terminal value growth rate (h)
As at 30 June As at 30 June2012 2011 2012 2011
% % % %
CSL New World Group . . . . 10.9 10.6 2.0 2.0TelstraClear Group (f) . . . . . - 11.1 - 3.0Telstra Europe Group . . . . . 7.5 9.6 3.0 3.0Sensis Group . . . . . . . . . 12.1 13.2 3.0 3.0Location Navigation . . . . . . 10.7 11.8 3.0 3.01300 Australia Group . . . . . 11.3 12.6 3.0 3.0Sequel Group (b) . . . . . . . - 18.2 - 5.0Autohome (a) . . . . . . . . . 19.4 n/a 5.0 n/aSequel Media (a) . . . . . . . 18.8 n/a 5.0 n/aOctave Group (c) . . . . . . . - 21.2 - 5.0LMobile Group (e) . . . . . . . - 20.1 - 5.0iVision (d) . . . . . . . . . . . - 17.6 - 3.0
For
per
sona
l use
onl
y
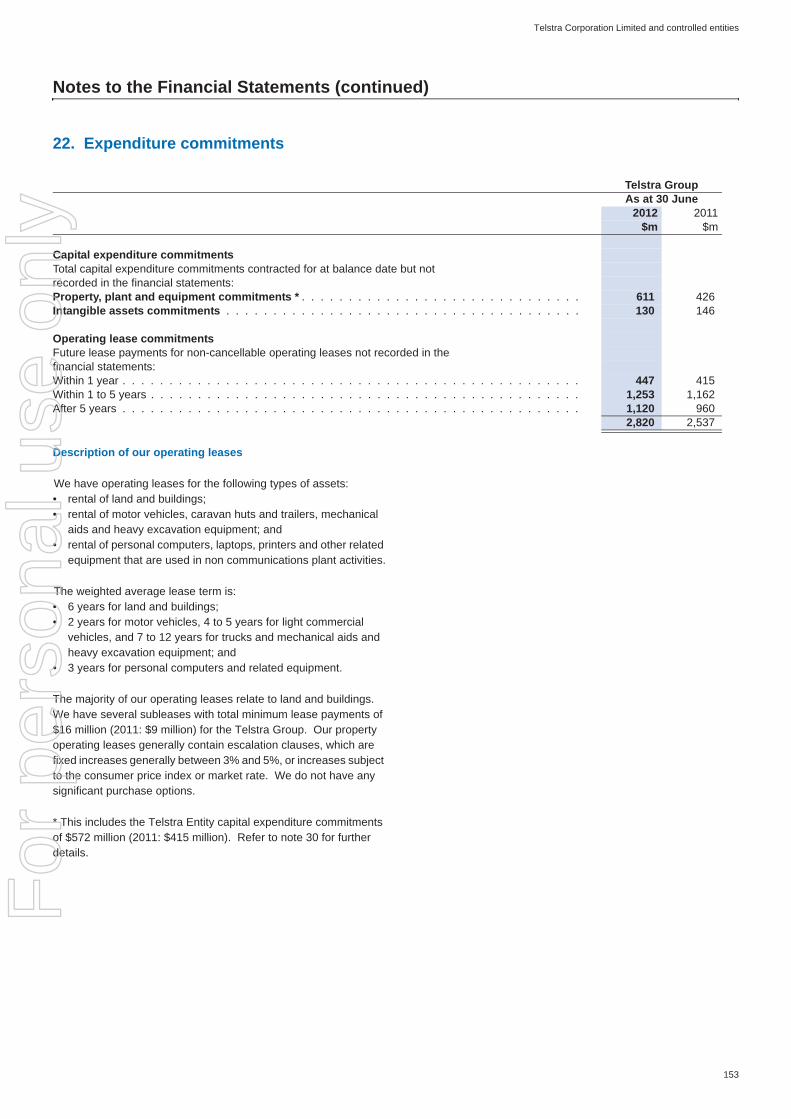
Telstra Corporation Limited and controlled entities
153
Notes to the Financial Statements (continued)
Description of our operating leases
We have operating leases for the following types of assets:• rental of land and buildings;• rental of motor vehicles, caravan huts and trailers, mechanical
aids and heavy excavation equipment; and• rental of personal computers, laptops, printers and other related
equipment that are used in non communications plant activities.
The weighted average lease term is:• 6 years for land and buildings;• 2 years for motor vehicles, 4 to 5 years for light commercial
vehicles, and 7 to 12 years for trucks and mechanical aids and heavy excavation equipment; and
• 3 years for personal computers and related equipment.
The majority of our operating leases relate to land and buildings. We have several subleases with total minimum lease payments of $16 million (2011: $9 million) for the Telstra Group. Our property operating leases generally contain escalation clauses, which are fixed increases generally between 3% and 5%, or increases subject to the consumer price index or market rate. We do not have any significant purchase options.
* This includes the Telstra Entity capital expenditure commitments of $572 million (2011: $415 million). Refer to note 30 for further details.
22. Expenditure commitments
Telstra GroupAs at 30 June
2012 2011$m $m
Capital expenditure commitmentsTotal capital expenditure commitments contracted for at balance date but notrecorded in the financial statements:Property, plant and equipment commitments * . . . . . . . . . . . . . . . . . . . . . . . . . . . . . . 611 426Intangible assets commitments . . . . . . . . . . . . . . . . . . . . . . . . . . . . . . . . . . . . . . 130 146
Operating lease commitmentsFuture lease payments for non-cancellable operating leases not recorded in thefinancial statements:Within 1 year . . . . . . . . . . . . . . . . . . . . . . . . . . . . . . . . . . . . . . . . . . . . . . . . . 447 415Within 1 to 5 years . . . . . . . . . . . . . . . . . . . . . . . . . . . . . . . . . . . . . . . . . . . . . . 1,253 1,162After 5 years . . . . . . . . . . . . . . . . . . . . . . . . . . . . . . . . . . . . . . . . . . . . . . . . . 1,120 960
2,820 2,537
For
per
sona
l use
onl
y

Telstra Corporation Limited and controlled entities
154
Notes to the Financial Statements (continued)
Description of our finance leases
We have finance leases for the following types of assets:• property leases in our controlled entity, Telstra Europe Limited;
and• computer mainframes, computer processing equipment and
other related equipment.
The weighted average lease term is:• 24 years for the property leases with a remaining average life of
11 years; and• 4 years for computer mainframes and associated equipment.
Interest rates for our finance leases are:• property leases interest rate of 22.5%; and• computer mainframes, computer processing equipment and
associated equipment weighted average interest rate of 7.7%.
We sublease computer mainframes, computer processing equipment and other related equipment as part of our solutions management and outsourcing services that we provide to our customers. Refer to note 10 for further details regarding these finance subleases.
Information regarding our share of our jointly controlled and associated entities’ commitments is included in note 26.
22. Expenditure commitments (continued)
Telstra GroupAs at 30 June
2012 2011Note $m $m
Finance lease commitmentsWithin 1 year . . . . . . . . . . . . . . . . . . . . . . . . . . . . . . . . . . . . . . . . . . . . . . . . . 56 53Within 1 to 5 years . . . . . . . . . . . . . . . . . . . . . . . . . . . . . . . . . . . . . . . . . . . . . . 99 94After 5 years . . . . . . . . . . . . . . . . . . . . . . . . . . . . . . . . . . . . . . . . . . . . . . . . . 31 19Total minimum lease payments . . . . . . . . . . . . . . . . . . . . . . . . . . . . . . . . . . . . . . . 186 166Future finance charges on finance leases . . . . . . . . . . . . . . . . . . . . . . . . . . . . . . . . . . (47) (27)Present value of net future minimum lease payments . . . . . . . . . . . . . . . . . . . . . . . . . . . . 139 139
The present value of finance lease liabilities is as follows:Within 1 year . . . . . . . . . . . . . . . . . . . . . . . . . . . . . . . . . . . . . . . . . . . . . . . . 17 45 45Within 1 to 5 years . . . . . . . . . . . . . . . . . . . . . . . . . . . . . . . . . . . . . . . . . . . . . . 79 82After 5 years . . . . . . . . . . . . . . . . . . . . . . . . . . . . . . . . . . . . . . . . . . . . . . . . . 15 12Total finance lease liabilities . . . . . . . . . . . . . . . . . . . . . . . . . . . . . . . . . . . . . . . . 17 139 139
For
per
sona
l use
onl
y

Telstra Corporation Limited and controlled entities
155
Notes to the Financial Statements (continued)
We have no significant contingent assets as at 30 June 2012. The details and maximum amounts (where reasonable estimates can be made) are set out below for our contingent liabilities.
Telstra Entity
Refer to note 30 for Telstra Entity contingent liabilities.
Other
Other contingent liabilities identified for the Telstra Group, are as follows:
3GIS Partnership
As we are subject to joint and several liability in relation to agreements entered into as part of our 3GIS Partnership with Vodafone Hutchinson Australia, we would be liable if our partner in this relationship failed to meet any of their obligations. As a result, our contingent liabilities arising from the above agreements are $96 million (2011: $91 million).
ASIC deed of cross guarantee
A list of the companies that are part of our deed of cross guarantee appear in note 25. Each of these companies (except Telstra Finance Limited) guarantees the payment in full of the debts of the other named companies in the event of their winding up. Refer to note 25 for further information.
23. Contingent liabilities and contingent assets
For
per
sona
l use
onl
y

Telstra Corporation Limited and controlled entities
156
Notes to the Financial Statements (continued)
The employee superannuation schemes that we participate in or sponsor exist to provide benefits for our employees and their dependants after finishing employment with us. It is our policy to contribute to the schemes at rates specified in the governing rules for defined contribution schemes, or at rates determined by the actuaries for defined benefit schemes.
The defined contribution divisions receive fixed contributions and our legal or constructive obligation is limited to these contributions.
The present value of our obligations for the defined benefit plans are calculated by an actuary using the projected unit credit method. This method determines each year of service as giving rise to an additional unit of benefit entitlement and measures each unit separately to calculate the final obligation.
Details of the defined benefit plans we participate in are set out below.
Telstra Superannuation Scheme (Telstra Super)
On 1 July 1990, Telstra Super was established and the majority of Telstra staff transferred into Telstra Super. The Telstra Entity and some of our Australian controlled entities participate in Telstra Super.
Telstra Super has both defined benefit and defined contribution divisions. The defined benefit divisions of Telstra Super are closed to new members.
The defined benefit divisions provide benefits based on years of service and final average salary. Post employment benefits do not include payments for medical costs.
Contribution levels made to the defined benefit divisions are designed to ensure that benefits accruing to members and beneficiaries are fully funded as the benefits fall due. The benefits received by members of each defined benefit division take into account factors such as the employees’ length of service, final average salary, employer and employee contributions.
An actuarial investigation of this scheme is carried out at least every three years.
HK CSL Retirement Scheme
Our controlled entity, Hong Kong CSL Limited (HK CSL), participates in a superannuation scheme known as the HK CSL Retirement Scheme. This scheme was established under the Occupational Retirement Schemes Ordinance (ORSO) and is administered by an independent trustee. The scheme has three defined benefit sections and one defined contribution section. Actuarial investigations are undertaken annually for this scheme.
The benefits received by members of the defined benefit schemes are based on the employees’ remuneration and length of service.
Measurement dates
For Telstra Super actual membership data as at 30 April was used to precisely value the defined obligations as at that date. Details of assets, benefit payments and other cash flows as at 31 May were also provided in relation to Telstra Super. These April and May figures were then rolled up to 30 June to allow for changes in the membership and actual asset return. Contributions as at 30 June were provided in relation to the defined benefit and defined contribution divisions.
Asset values as at 30 June were used to precisely measure the defined benefit liability as at that date for the HK CSL Retirement Scheme. Details of membership data, contributions, benefit payments and other cash flows as at 30 June were also provided in relation to the HK CSL Retirement Scheme.
The fair value of the defined benefit plan assets and the present value of the defined benefit obligations as at the reporting date are determined by our actuary. The details of the defined benefit divisions are set out in the following pages.
Other defined contribution schemes
A number of our subsidiaries also participate in defined contribution schemes which receive employer and employee contributions based on a percentage of the employees’ salaries. We made contributions to these schemes of $19 million for fiscal 2012 (2011: $15 million).
24. Post employment benefits
For
per
sona
l use
onl
y

Telstra Corporation Limited and controlled entities
157
Notes to the Financial Statements (continued)
(a) Net defined benefit plan (liability)/asset - historical summary
Our net defined benefit plan (liability)/asset recognised in the statement of financial position for the current and previous periods is determined as follows:
(b) Reconciliation of changes in fair value of defined benefit plan assets
The actual return on defined benefit plan assets was nil (2011: 9.7%) for Telstra Super and a loss of 5.1% (2011: gain of 16.0%) for the HK CSL Retirement Scheme.
24. Post employment benefits (continued)
Telstra GroupAs at 30 June
2012 2011 2010 2009 2008$m $m $m $m $m
Fair value of defined benefit plan assets (b) . . . . . . . . . . . . . . . . 2,559 2,599 2,546 2,503 3,205Present value of the defined benefit obligation (c) . . . . . . . . . . . . . 3,266 2,762 2,934 2,847 3,048
Net defined benefit (liability)/asset before adjustment for contributions tax (707) (163) (388) (344) 157Adjustment for contributions tax . . . . . . . . . . . . . . . . . . . . . . (124) (31) (69) (62) 25Net defined benefit (liability)/asset at 30 June . . . . . . . . . . . . . . . . . (831) (194) (457) (406) 182Comprised of:Defined benefit asset . . . . . . . . . . . . . . . . . . . . . . . . . . . . - 11 7 8 182Defined benefit liability . . . . . . . . . . . . . . . . . . . . . . . . . . . (831) (205) (464) (414) -
(831) (194) (457) (406) 182Experience adjustments:Experience adjustments arising on defined benefit plan assets - (loss)/gain . . . . . . . . . . . . . . . . . . . . . . . . . . . . . . . . . . . . . (207) 89 (56) (593) (525)Experience adjustments arising on defined benefit obligations - gain . . . 26 48 64 72 41
Telstra GroupAs at 30 June
2012 2011$m $m
Fair value of defined benefit plan assets at beginning of year . . . . . . . . . . . . . . . . . . . . . 2,599 2,546Expected return on plan assets . . . . . . . . . . . . . . . . . . . . . . . . . . . . . . . . . . . . . . . 200 197Employer contributions . . . . . . . . . . . . . . . . . . . . . . . . . . . . . . . . . . . . . . . . . . . . 157 169Contributions tax . . . . . . . . . . . . . . . . . . . . . . . . . . . . . . . . . . . . . . . . . . . . . . . (24) (25)Member contributions . . . . . . . . . . . . . . . . . . . . . . . . . . . . . . . . . . . . . . . . . . . . 47 30Benefits paid (i) . . . . . . . . . . . . . . . . . . . . . . . . . . . . . . . . . . . . . . . . . . . . . . . . (202) (382)Actuarial gain/(loss) . . . . . . . . . . . . . . . . . . . . . . . . . . . . . . . . . . . . . . . . . . . . . (207) 89Plan expenses after tax . . . . . . . . . . . . . . . . . . . . . . . . . . . . . . . . . . . . . . . . . . . (13) (13)Foreign currency exchange differences . . . . . . . . . . . . . . . . . . . . . . . . . . . . . . . . . . . 2 (12)Fair value of defined benefit plan assets at end of year . . . . . . . . . . . . . . . . . . . . . . . . . 2,559 2,599
For
per
sona
l use
onl
y

Telstra Corporation Limited and controlled entities
158
Notes to the Financial Statements (continued)
(c) Reconciliation of changes in the present value of the wholly funded defined benefit obligation
(i) Benefits paid include $180 million (2011: $356 million) of entitlements to exiting defined benefit members which have been retained in Telstra Super but transferred to the defined contribution scheme.
For fiscal 2013, we expect to pay total benefit payments of $239 million (including benefits retained) to defined benefit members of Telstra Super.
(d) Amounts recognised in the income statement and in other comprehensive income
24. Post employment benefits (continued)
Telstra GroupAs at 30 June
2012 2011$m $m
Present value of defined benefit obligation at beginning of year . . . . . . . . . . . . . . . . . . . . 2,762 2,934Current service cost . . . . . . . . . . . . . . . . . . . . . . . . . . . . . . . . . . . . . . . . . . . . . 107 124Interest cost . . . . . . . . . . . . . . . . . . . . . . . . . . . . . . . . . . . . . . . . . . . . . . . . . 146 151Member contributions . . . . . . . . . . . . . . . . . . . . . . . . . . . . . . . . . . . . . . . . . . . . 15 21Benefits paid (i) . . . . . . . . . . . . . . . . . . . . . . . . . . . . . . . . . . . . . . . . . . . . . . . . (202) (382)Actuarial (gain)/loss . . . . . . . . . . . . . . . . . . . . . . . . . . . . . . . . . . . . . . . . . . . . . 429 (75)Curtailment loss . . . . . . . . . . . . . . . . . . . . . . . . . . . . . . . . . . . . . . . . . . . . . . . 7 3Foreign currency exchange differences . . . . . . . . . . . . . . . . . . . . . . . . . . . . . . . . . . . 2 (14)Present value of wholly funded defined benefit obligation at end of year . . . . . . . . . . . . . . . 3,266 2,762
Telstra GroupYear ended 30 June
2012 2011Note $m $m
The components of the defined benefit plan expense recognised in the income statement within labour expenses are as follows:Current service cost . . . . . . . . . . . . . . . . . . . . . . . . . . . . . . . . . . . . . . . . . . . . . 107 124Interest cost . . . . . . . . . . . . . . . . . . . . . . . . . . . . . . . . . . . . . . . . . . . . . . . . . 146 151Expected return on plan assets . . . . . . . . . . . . . . . . . . . . . . . . . . . . . . . . . . . . . . . (200) (197)Member contributions . . . . . . . . . . . . . . . . . . . . . . . . . . . . . . . . . . . . . . . . . . . . (32) (9)Curtailment loss . . . . . . . . . . . . . . . . . . . . . . . . . . . . . . . . . . . . . . . . . . . . . . . 7 3Plan expenses after tax . . . . . . . . . . . . . . . . . . . . . . . . . . . . . . . . . . . . . . . . . . . 13 13Adjustment for contributions tax . . . . . . . . . . . . . . . . . . . . . . . . . . . . . . . . . . . . . . . 8 15
49 100Employer contributions - defined contribution divisions . . . . . . . . . . . . . . . . . . . . . . . . . . . 174 168Total expense recognised in the income statement . . . . . . . . . . . . . . . . . . . . . . . . . . 7 223 268
Actuarial (loss)/gain recognised directly in other comprehensive income . . . . . . . . . . . . . . . . . . (755) 183
Cumulative actuarial losses recognised directly in other comprehensive income . . . . . . . . . . . . . . (822) (67)For
per
sona
l use
onl
y

Telstra Corporation Limited and controlled entities
159
Notes to the Financial Statements (continued)
(d) (e) Categories of plan assets
The weighted average asset allocation as a percentage of the fair value of total plan assets for defined benefit divisions as at 30 June are as follows:
Telstra Super’s investments in debt and equity instruments include bonds issued by, and shares in, Telstra Corporation Limited. Refer to note 29 for further details.
(f) Principal actuarial assumptions
We used the following major assumptions to determine our defined benefit plan expense for the year ended 30 June:
We used the following major assumptions to determine our defined benefit obligations at 30 June:
(i) The expected rate of return on plan assets has been based on historical and future expectations of returns for each of the major categories of asset classes over the subsequent 10 year period, or longer. Estimates are based on a combination of factors including the current market outlook for interest rates, inflation, earnings growth and currency strength. To determine the aggregate return, the expected future return of each plan asset class is weighted
according to the strategic asset allocation of total plan assets.
24. Post employment benefits (continued)
Telstra SuperHK CSL Retirement
SchemeAs at 30 June As at 30 June
2012 2011 2012 2011% % % %
Asset allocationsEquity instruments . . . . . . . . . . . . . . . . . . . . . . . . . . . . . . . . . 48 57 46 53Debt instruments . . . . . . . . . . . . . . . . . . . . . . . . . . . . . . . . . . 2 2 44 40Property . . . . . . . . . . . . . . . . . . . . . . . . . . . . . . . . . . . . . . 19 21 - -Cash . . . . . . . . . . . . . . . . . . . . . . . . . . . . . . . . . . . . . . . . 3 4 8 5Private equity . . . . . . . . . . . . . . . . . . . . . . . . . . . . . . . . . . . . 14 12 - -Infrastructure . . . . . . . . . . . . . . . . . . . . . . . . . . . . . . . . . . . . 2 1 - -International hedge funds . . . . . . . . . . . . . . . . . . . . . . . . . . . . . 8 1 - -Opportunities . . . . . . . . . . . . . . . . . . . . . . . . . . . . . . . . . . . . 4 2 2 2
100 100 100 100
Telstra SuperHK CSL Retirement
SchemeYear ended 30 June Year ended 30 June
2012 2011 2012 2011% % % %
Discount rate . . . . . . . . . . . . . . . . . . . . . . . . . . . . . . . . . . . . 5.6 5.1 2.5 2.4Expected rate of return on plan assets (i) . . . . . . . . . . . . . . . . . . . . . 8.0 8.0 6.6 6.4Expected rate of increase in future salaries . . . . . . . . . . . . . . . . . . . . 4.0 4.0 4.2 - 4.5 2.5 - 4.0
Telstra SuperHK CSL Retirement
SchemeYear ended 30 June Year ended 30 June
2012 2011 2012 2011% % % %
Discount rate (ii) . . . . . . . . . . . . . . . . . . . . . . . . . . . . . . . . . . 3.6 5.2 1.0 2.5Expected rate of increase in future salaries (iii) . . . . . . . . . . . . . . . . . . 4.0 4.0 4.0 - 5.0 4.2 - 4.5F
or p
erso
nal u
se o
nly

Telstra Corporation Limited and controlled entities
160
Notes to the Financial Statements (continued)
(f) Principal actuarial assumptions (continued)
(ii) The present value of our defined benefit obligation is determined by discounting the estimated future cash outflows using a discount rate based on government guaranteed securities with similar due dates to these expected cash flows.
For Telstra Super we have used a blended 10-year Australian government bond rate as it has the closest term from the Australian bond market to match the term of the defined benefit obligations. We have not made any adjustment to reflect the difference between the term of the bonds and the estimated term of liabilities due to the observation that the current government bond yield curve is reasonably flat, implying that the yields from government bonds with a term less than 10 years are expected to be very similar to the extrapolated bond yields with a term of 12 to 13 years. Refer to note 2.20(b) for further information.
For the HK CSL Retirement Scheme we have extrapolated the 5, 7, 10 and 15 year yields of the Hong Kong Exchange Fund Notes to 11 years to match the term of the defined benefit obligations.
(iii) Our assumption for the salary inflation rate for Telstra Super is 4.0%, which is reflective of our long term expectation for salary increases. The salary inflation rate for the HK CSL Retirement Scheme is 5.0% in fiscal 2013 to 2015, and 4.0% thereafter which reflects the long term expectations for salary increases.
(g) Employer contributions
Telstra Super
The funding deed we have with Telstra Super requires contributions to be made when the average vested benefits index (VBI) in respect of the defined benefit membership (the ratio of defined benefit plan assets to defined benefit members’ vested benefits) of a calendar quarter falls to 103% or below. For the quarter ended 30 June 2012, the VBI was 91% (30 June 2011: 92%). We have paid contributions totalling $467 million during the year (2011: $467 million). This includes employer contributions to the accumulation divisions, payroll tax and employee pre and post tax salary sacrifice contributions, which are excluded from the employer contributions in the reconciliations above. The current contribution rate for the defined benefit divisions of Telstra Super, effective June 2012, is 27% of defined benefit member’s salaries (June 2011: 24%).
The vested benefits, which forms the basis for determining our contribution levels under the funding deed, represents the total amount that Telstra Super would be required to pay if all defined benefit members were to voluntarily leave the fund on the valuation date. The VBI assesses the short term financial position of the plan. On the other hand the liability recognised in the statement of financial position is based on the projected benefit obligation (PBO), which represents the present value of employees’ benefits assuming that employees will continue to work and be part of the fund until their exit. The PBO takes into account future increases in an employee’s salary and provides a longer term financial position of the plan.
We will continue to monitor the performance of Telstra Super and reassess our employer contributions in light of actuarial recommendations. We expect to contribute approximately $474 million in fiscal 2013 which includes contributions to the defined benefit divisions at a contribution rate of 27% for fiscal 2013. This contribution rate could change depending on market conditions during fiscal 2013. This includes employer contributions to the accumulation divisions, payroll tax and employee pre and post tax salary sacrifice contributions.
HK CSL Retirement Scheme
The contributions payable to the defined benefit divisions are determined by the actuary using the attained age normal funding actuarial valuation method.
There were no employer contributions made to the HK CSL Retirement Scheme for the financial year ended 30 June 2012 (2011: $1 million). We do not expect to make any contributions to our HK CSL Retirement Scheme in fiscal 2013.
Annual actuarial investigations are currently undertaken for this scheme by Mercer Hong Kong Limited.
24. Post employment benefits (continued)
For
per
sona
l use
onl
y

Telstra Corporation Limited and controlled entities
161
Notes to the Financial Statements (continued)
Below is a list of our investments in controlled entities.
25. Investments in controlled entities
Name of entityCountry of incorporation
Telstra Entity’s recorded amount of
investment (#)% of equity held by immediate parent
As at 30 June As at 30 June2012 2011 2012 2011
$m $m % %Parent entityTelstra Corporation Limited (a) . . . . . . . . . . . . . . AustraliaControlled entitiesTelstra Finance Limited (a) . . . . . . . . . . . . . . . . Australia - - 100.0 100.0Telstra ESOP Trustee Pty Limited . . . . . . . . . . . . . Australia - - 100.0 100.0Telstra Growthshare Pty Ltd . . . . . . . . . . . . . . . . Australia - - 100.0 100.0Telstra Media Pty Limited. . . . . . . . . . . . . . . . . . Australia 393 393 100.0 100.0Telstra Multimedia Pty Limited (a) . . . . . . . . . . . . . Australia 2,678 2,678 100.0 100.0Telstra International (Aus) Limited (a) . . . . . . . . . . . Australia 2 2 100.0 100.0Telstra Pay TV Pty Ltd (a) . . . . . . . . . . . . . . . . . Australia - - 100.0 100.0Chief Entertainment Pty Ltd . . . . . . . . . . . . . . . . Australia - - 100.0 100.0Telstra 3G Spectrum Holdings Pty Ltd . . . . . . . . . . . Australia 302 302 100.0 100.0Telstra OnAir Holdings Pty Ltd . . . . . . . . . . . . . . . Australia 478 478 100.0 100.0Telstra Business Systems Pty Ltd (a) . . . . . . . . . . . Australia 50 69 100.0 100.0Telstra Plus Pty Ltd . . . . . . . . . . . . . . . . . . . . . Australia - - 100.0 100.0Applications and Ventures Group Pty Limited (formerly Clayton 770 Pty Ltd) (a) . . . . . . . . . . . . . . . . . . Australia - - 100.0 100.0Research Resources Pty Ltd . . . . . . . . . . . . . . . . Australia - - 100.0 100.01300 Australia Pty Ltd . . . . . . . . . . . . . . . . . . . Australia 20 20 85.0 85.0
• Alpha Phone Words Pty Ltd . . . . . . . . . . . . . . Australia - - 100.0 100.0Telstra iVision Pty Limited (formerly iVision Pty Limited) (a) Australia 41 41 100.0 100.0
• Integrated Vision Pty Ltd . . . . . . . . . . . . . . . Australia - - 100.0 100.0• iVision (QLD) Pty Ltd . . . . . . . . . . . . . . . . . Australia - - 100.0 100.0• iVision Investments Pty Ltd . . . . . . . . . . . . . . Australia - - 100.0 100.0
• iVision (Unify) Pty Ltd . . . . . . . . . . . . . . . Australia - - 100.0 100.0• Unify Pty Ltd . . . . . . . . . . . . . . . . . . . . . Australia - - 100.0 100.0
Telstra Communications Limited (a) . . . . . . . . . . . . Australia 29 29 100.0 100.0• Telecom Australia (Saudi) Company Limited
(b)(c)(d)(e) . . . . . . . . . . . . . . . . . . . . . . . Saudi Arabia - - 50.0 50.0Adstream (Aust) Pty Ltd (h) . . . . . . . . . . . . . . . . Australia - 23 - 64.4
• Adstream Limited (h) . . . . . . . . . . . . . . . . . New Zealand - - - 100.0• Quickcut (Aust) Pty Ltd (h). . . . . . . . . . . . . . . Australia - - - 100.0
Telstra Holdings Pty Ltd (a) . . . . . . . . . . . . . . . . Australia 7,474 7,474 100.0 100.0• Telstra International Holdings Limited . . . . . . . . . Bermuda - - 100.0 100.0• Telstra Technology Services (Hong Kong) Limited . . Hong Kong - - 75.0 75.0• Autohome Inc. (formerly Sequel Limited) (c)(d)(g) . . Cayman Islands - - 66.0 55.0
• Cheerbright International Holdings Limited (c) . . . British Virgin Islands - - 100.0 100.0• Beijing Cheerbright Technologies Co. Ltd (c) . . China - - 100.0 100.0• Autohome (Hong Kong) Limited (c)(f) . . . . . . Hong Kong - - 100.0 -
• Sequel Media Inc. (c)(d) . . . . . . . . . . . . . . . . Cayman Islands - - 55.0 55.0• China Topside Limited (c) . . . . . . . . . . . . . British Virgin Islands - - 100.0 100.0
• Beijing Topside Technologies Co. Ltd (c) . . . . China - - 100.0 100.0• Norstar Advertising Media Holdings Limited (c) . . Cayman Islands - - 100.0 100.0
(continued over page)
For
per
sona
l use
onl
y

Telstra Corporation Limited and controlled entities
162
Notes to the Financial Statements (continued)
25. Investments in controlled entities (continued)
Name of entityCountry of incorporation
Telstra Entity’s recorded amount of
investment (#)% of equity held by immediate parent
As at 30 June As at 30 June2012 2011 2012 2011
Controlled entities (continued) $m $m % %• Shengtuo Shidai (Beijing) Information
Technology Co. Ltd (c) . . . . . . . . . . . . . China - - 100.0 100.0• Union Tough Advertisement Limited (c) . . . . . Hong Kong - - 100.0 100.0
• Haocheng Shidai (Beijing) Advertisement Co. Ltd (c)(d) . . . . . . . . . . . . . . . . . China - - 30.0 30.0
• Telstra Asia Holdings Limited (c) . . . . . . . . . . . British Virgin Islands - - 100.0 100.0• Telstra Octave Holdings Limited (c) . . . . . . . . British Virgin Islands - - 100.0 100.0
• Octave Investments Holdings Limited (c)(d) . . British Virgin Islands - - 67.0 67.0• Beauty Sunshine Investments Limited (h) . . British Virgin Islands - - - 100.0
• Beijing Wireless Permanence Technology Company Limited (h) . . . . . . . . . . . China - - - 100.0
• Sharp Point Group Limited (c) . . . . . . . . British Virgin Islands - - 100.0 100.0• Beijing Liang Dian Shi Jian Technology
Company Limited (c) . . . . . . . . . . . China - - 100.0 100.0• Telstra Robin Holdings Limited (c) . . . . . . . . . British Virgin Islands - - 100.0 100.0
• Dotad Media Holdings Limited (h). . . . . . . . British Virgin Islands - - - 67.0• LMobile (China) Holdings Limited (h) . . . . Hong Kong - - - 100.0
• Beijing Daote Aidi Internet Technology Company (h) . . . . . . . . . . . . . . . China - - - 100.0
• Telstra Asia Limited (c) . . . . . . . . . . . . . . . . British Virgin Islands - - 100.0 100.0• Telstra South East Asia Holdings Limited (c) . . . . British Virgin Islands - - 100.0 100.0
• PT Reach Network Services Indonesia (e) . . . Indonesia - - 90.0 90.0• Telstra Asia Regional Holdings Limited (c) . . . . . British Virgin Islands - - 100.0 100.0
• Telstra Malaysia Sdn. Bhd. (formerly Reach Bandwidth Services Malaysia Sdn. Bhd) (e) . . Malaysia - - 51.0 51.0
• Telstra (Thailand) Ltd (formerly Reach Communications Services (Thailand) Limited) (c)(d)(e) . . . . . . . . . . . . . . . . . . . . . Thailand - - 49.0 49.0
• Telstra Network (Thailand) Ltd (formerly Reach Network (Thailand) Ltd) (c)(e)(g) . . . Thailand - - 68.0 35.9
• Telstra Network (Thailand) Ltd (formerly Reach Network (Thailand) Limited (c)(e) . . . . . . . Thailand - - 32.0 32.0
• Telstra Philippines Holdings Limited (c) . . . . . British Virgin Islands - - 100.0 100.0• Incomgen Holdings Inc. (c)(d)(e). . . . . . . Philippines - - 40.0 40.0
• Reach Web Holdings Inc. (c)(e) . . . . . Philippines - - 60.0 60.0• Telstra Philippines Inc (formerly Reach
Networks Philippines Inc. (c)(e) . . . . Philippines - - 60.0 60.0• Telstra Philippines Inc (formerly Reach
Networks Philippines Inc. (c)(e) . . . . . . . Philippines - - 40.0 40.0• Reach Web Holdings Inc. (c)(e) . . . . . . . Philippines - - 40.0 40.0
• Thai Cyber Web Co Limited (c)(d)(e) . . . . . . Thailand - - 48.8 48.8• Telstra Global Holdings Limited (c) . . . . . . . . . . British Virgin Islands - - 100.0 100.0
• Telstra International Limited . . . . . . . . . . . . Hong Kong - - 100.0 100.0• Telstra Services Korea Limited (formerly Reach
Network Services Korea Limited) (e) . . . . . . . . . Republic of Korea - - 100.0 100.0• Reach Holdings Limited (c) . . . . . . . . . . . . . . Mauritius - - 100.0 100.0
• Reach Network India Private Limited (c) . . . . . . India - - 99.9 99.9• Reach Data Services India Private Limited (c) . . . India - - 99.9 99.9
• Beijing Australia Telecommunications Technical Consulting Services Company Limited (c). . . . . . . China - - 100.0 100.0
(continued over page)
For
per
sona
l use
onl
y

Telstra Corporation Limited and controlled entities
163
Notes to the Financial Statements (continued)
25. Investments in controlled entities (continued)
Name of entityCountry of incorporation
Telstra Entity’s recorded amount of
investment (#)% of equity held by immediate parent
As at 30 June As at 30 June2012 2011 2012 2011
Controlled entities (continued) $m $m % %• Telstra Holdings (Bermuda) No. 2 Limited. . . . . . . Bermuda - - 100.0 100.0
• CSL New World Mobility Limited . . . . . . . . . . Bermuda - - 76.4 76.4• New World PCS Holdings Limited. . . . . . . . Cayman Islands - - 100.0 100.0
• CSL Limited . . . . . . . . . . . . . . . . . Hong Kong - - 100.0 100.0• Hong Kong CSL Limited . . . . . . . . . Hong Kong - - 100.0 100.0• Big Bang Holdings Limited . . . . . . . . Hong Kong - - 100.0 100.0• One2Free PersonalCom Limited . . . . . Hong Kong - - 100.0 100.0• Integrated Business Systems Limited . . Hong Kong - - 100.0 100.0• New World PCS Limited . . . . . . . . . Hong Kong - - 100.0 100.0• New World Mobility Limited . . . . . . . . Hong Kong - - 60.0 60.0
• New World 3G Limited . . . . . . . . . . . . Hong Kong - - 100.0 100.0• Telstra Holdings (Bermuda) No 1 Limited . . . . . . . Bermuda - - 100.0 100.0• Telstra International HK Limited . . . . . . . . . . . . Hong Kong - - 100.0 100.0• Telstra Japan KK. . . . . . . . . . . . . . . . . . . . Japan - - 100.0 100.0• Telstra International Holdings No. 2 Limited (b) . . . . Bermuda - - 100.0 100.0• Telstra Singapore Pte Ltd . . . . . . . . . . . . . . . Singapore - - 100.0 100.0• Telstra Global Limited . . . . . . . . . . . . . . . . . United Kingdom - - 100.0 100.0
• PT Telstra Nusantara . . . . . . . . . . . . . . . Indonesia - - 100.0 100.0• Telstra Limited . . . . . . . . . . . . . . . . . . . United Kingdom - - 100.0 100.0
• Telstra (Cable Telecom) Limited. . . . . . . . . United Kingdom - - 100.0 100.0• Telstra (PSINet) . . . . . . . . . . . . . . . United Kingdom - - 100.0 100.0
• Telstra (CTE) Limited . . . . . . . . . . . . . . United Kingdom - - 100.0 100.0• Cable Telecommunications Limited . . . . . . . United Kingdom - - 100.0 100.0• PSINet Datacentre UK Limited . . . . . . . . . United Kingdom - - 100.0 100.0• Inteligen Communications Limited . . . . . . . United Kingdom - - 100.0 100.0• PSINet Jersey Limited . . . . . . . . . . . . . Jersey - - 100.0 100.0• PSINet Hosting Centre Limited . . . . . . . . . Jersey - - 100.0 100.0• Cordoba Holdings Limited. . . . . . . . . . . . Jersey - - 100.0 100.0• London Hosting Centre Limited . . . . . . . . . Jersey - - 100.0 100.0
• Telstra Inc . . . . . . . . . . . . . . . . . . . . . . . United States - - 100.0 100.0• Telstra India (Private) Limited (c) . . . . . . . . . . . India - - 100.0 100.0• Telstra International PNG Limited (f) . . . . . . . . . Papua New Guinea - - 100.0 -• Telstra NZ Limited . . . . . . . . . . . . . . . . . . . New Zealand - - 100.0 100.0• Telstra New Zealand Holdings Limited . . . . . . . . New Zealand - - 100.0 100.0
• Telstra Network Services NZ Limited . . . . . . . New Zealand - - 100.0 100.0• TelstraClear Limited (i) . . . . . . . . . . . . . . . New Zealand - - 100.0 100.0
• CLEAR Communications Limited (i) . . . . . . New Zealand - - 100.0 100.0• Telstra Telecommunications Private Ltd (c) . . . . . . India - - 74.0 74.0
Network Design and Construction Limited (a) . . . . . . . Australia 20 20 100.0 100.0• NDC Global Holdings Pty Limited . . . . . . . . . . . Australia - - 100.0 100.0• NDC Global Services Pty Limited . . . . . . . . . . . Australia - - 100.0 100.0
Telstra Services Solutions Holdings Limited (a) . . . . . . Australia 313 313 100.0 100.0Sensis Pty Ltd (a) . . . . . . . . . . . . . . . . . . . . . Australia 851 851 100.0 100.0
• Location Navigation Pty Ltd . . . . . . . . . . . . . . Australia - - 100.0 100.0• Life Events Media Pty Limited . . . . . . . . . . . . . Australia - - 100.0 100.0
(continued over page)
For
per
sona
l use
onl
y
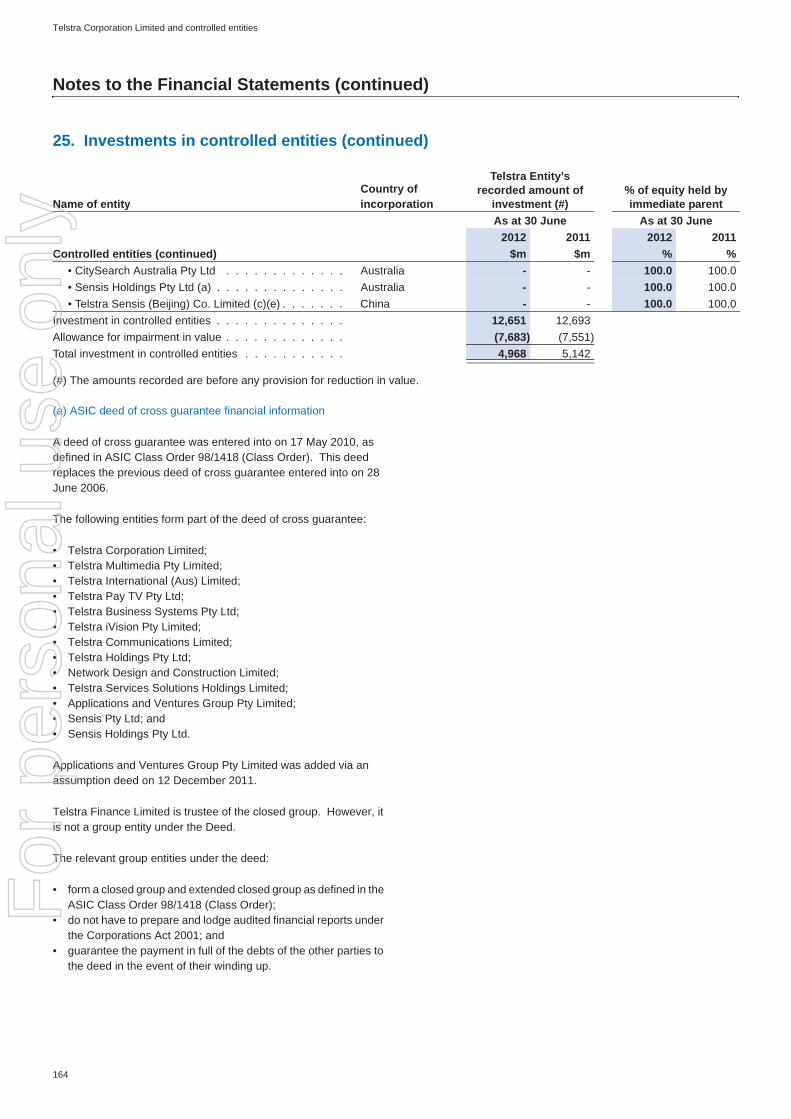
Telstra Corporation Limited and controlled entities
164
Notes to the Financial Statements (continued)
(#) The amounts recorded are before any provision for reduction in value.
(a) ASIC deed of cross guarantee financial information
A deed of cross guarantee was entered into on 17 May 2010, as defined in ASIC Class Order 98/1418 (Class Order). This deed replaces the previous deed of cross guarantee entered into on 28 June 2006.
The following entities form part of the deed of cross guarantee:
• Telstra Corporation Limited;• Telstra Multimedia Pty Limited;• Telstra International (Aus) Limited; • Telstra Pay TV Pty Ltd; • Telstra Business Systems Pty Ltd;• Telstra iVision Pty Limited;• Telstra Communications Limited;• Telstra Holdings Pty Ltd;• Network Design and Construction Limited;• Telstra Services Solutions Holdings Limited;• Applications and Ventures Group Pty Limited;• Sensis Pty Ltd; and• Sensis Holdings Pty Ltd.
Applications and Ventures Group Pty Limited was added via an assumption deed on 12 December 2011.
Telstra Finance Limited is trustee of the closed group. However, it is not a group entity under the Deed.
The relevant group entities under the deed:
• form a closed group and extended closed group as defined in the ASIC Class Order 98/1418 (Class Order);
• do not have to prepare and lodge audited financial reports under the Corporations Act 2001; and
• guarantee the payment in full of the debts of the other parties to the deed in the event of their winding up.
25. Investments in controlled entities (continued)
Name of entityCountry of incorporation
Telstra Entity’s recorded amount of
investment (#)% of equity held by immediate parent
As at 30 June As at 30 June2012 2011 2012 2011
Controlled entities (continued) $m $m % %• CitySearch Australia Pty Ltd . . . . . . . . . . . . . Australia - - 100.0 100.0• Sensis Holdings Pty Ltd (a) . . . . . . . . . . . . . . Australia - - 100.0 100.0• Telstra Sensis (Beijing) Co. Limited (c)(e) . . . . . . . China - - 100.0 100.0
Investment in controlled entities . . . . . . . . . . . . . . 12,651 12,693Allowance for impairment in value . . . . . . . . . . . . . (7,683) (7,551)Total investment in controlled entities . . . . . . . . . . . 4,968 5,142
For
per
sona
l use
onl
y

Telstra Corporation Limited and controlled entities
165
Notes to the Financial Statements (continued)
(a) ASIC deed of cross guarantee financial information (continued)
The consolidated income statement and statement of financial position of the closed group is presented according to the Class Order as follows. This excludes Telstra Finance Limited. All significant transactions between members of the closed group have been eliminated.
25. Investments in controlled entities (continued)
Closed group statement of financial position Closed groupAs at 30 June
2012 2011$m $m
Current assetsCash and cash equivalents. . . . . . . . . . . . . . . . . . . . . . . . . . . . . . . . . . . . . . . . . . 3,582 2,316Trade and other receivables . . . . . . . . . . . . . . . . . . . . . . . . . . . . . . . . . . . . . . . . . 4,136 3,908Inventories . . . . . . . . . . . . . . . . . . . . . . . . . . . . . . . . . . . . . . . . . . . . . . . . . . 246 257Derivative financial assets . . . . . . . . . . . . . . . . . . . . . . . . . . . . . . . . . . . . . . . . . . 32 83Current tax receivables. . . . . . . . . . . . . . . . . . . . . . . . . . . . . . . . . . . . . . . . . . . . 363 -Prepayments . . . . . . . . . . . . . . . . . . . . . . . . . . . . . . . . . . . . . . . . . . . . . . . . . 211 222Total current assets. . . . . . . . . . . . . . . . . . . . . . . . . . . . . . . . . . . . . . . . . . . . . . 8,570 6,786Non current assetsTrade and other receivables . . . . . . . . . . . . . . . . . . . . . . . . . . . . . . . . . . . . . . . . . 1,923 1,345Inventories . . . . . . . . . . . . . . . . . . . . . . . . . . . . . . . . . . . . . . . . . . . . . . . . . . 24 22Investments - accounted for using the equity method . . . . . . . . . . . . . . . . . . . . . . . . . . . . 10 -Investments - other . . . . . . . . . . . . . . . . . . . . . . . . . . . . . . . . . . . . . . . . . . . . . . 2,818 3,209Property, plant and equipment . . . . . . . . . . . . . . . . . . . . . . . . . . . . . . . . . . . . . . . . 19,812 20,504Intangible assets . . . . . . . . . . . . . . . . . . . . . . . . . . . . . . . . . . . . . . . . . . . . . . . 6,122 5,974Derivative financial assets . . . . . . . . . . . . . . . . . . . . . . . . . . . . . . . . . . . . . . . . . . 658 285Non current tax receivables . . . . . . . . . . . . . . . . . . . . . . . . . . . . . . . . . . . . . . . . . 80 382Total non current assets . . . . . . . . . . . . . . . . . . . . . . . . . . . . . . . . . . . . . . . . . . . 31,447 31,721Total assets . . . . . . . . . . . . . . . . . . . . . . . . . . . . . . . . . . . . . . . . . . . . . . . . . 40,017 38,507
Current liabilitiesTrade and other payables . . . . . . . . . . . . . . . . . . . . . . . . . . . . . . . . . . . . . . . . . . 3,607 3,572Provisions . . . . . . . . . . . . . . . . . . . . . . . . . . . . . . . . . . . . . . . . . . . . . . . . . . 934 836Borrowings . . . . . . . . . . . . . . . . . . . . . . . . . . . . . . . . . . . . . . . . . . . . . . . . . . 4,044 2,969Derivative financial liabilities . . . . . . . . . . . . . . . . . . . . . . . . . . . . . . . . . . . . . . . . . 299 634Current tax payables . . . . . . . . . . . . . . . . . . . . . . . . . . . . . . . . . . . . . . . . . . . . . 675 370Revenue received in advance . . . . . . . . . . . . . . . . . . . . . . . . . . . . . . . . . . . . . . . . 1,103 929Total current liabilities . . . . . . . . . . . . . . . . . . . . . . . . . . . . . . . . . . . . . . . . . . . . 10,662 9,310Non current liabilitiesOther payables . . . . . . . . . . . . . . . . . . . . . . . . . . . . . . . . . . . . . . . . . . . . . . . . 55 57Provisions . . . . . . . . . . . . . . . . . . . . . . . . . . . . . . . . . . . . . . . . . . . . . . . . . . 257 234Borrowings . . . . . . . . . . . . . . . . . . . . . . . . . . . . . . . . . . . . . . . . . . . . . . . . . . 11,951 12,167Derivative financial liabilities . . . . . . . . . . . . . . . . . . . . . . . . . . . . . . . . . . . . . . . . . 2,349 1,799Deferred tax liabilities . . . . . . . . . . . . . . . . . . . . . . . . . . . . . . . . . . . . . . . . . . . . 1,045 1,648Defined benefit liability . . . . . . . . . . . . . . . . . . . . . . . . . . . . . . . . . . . . . . . . . . . . 825 205Revenue received in advance . . . . . . . . . . . . . . . . . . . . . . . . . . . . . . . . . . . . . . . . 469 298Total non current liabilities . . . . . . . . . . . . . . . . . . . . . . . . . . . . . . . . . . . . . . . . . . 16,951 16,408Total liabilities . . . . . . . . . . . . . . . . . . . . . . . . . . . . . . . . . . . . . . . . . . . . . . . . 27,613 25,718Net assets . . . . . . . . . . . . . . . . . . . . . . . . . . . . . . . . . . . . . . . . . . . . . . . . . . 12,404 12,789
EquityShare capital . . . . . . . . . . . . . . . . . . . . . . . . . . . . . . . . . . . . . . . . . . . . . . . . . 5,635 5,610Reserves . . . . . . . . . . . . . . . . . . . . . . . . . . . . . . . . . . . . . . . . . . . . . . . . . . . (84) (10)Retained profits. . . . . . . . . . . . . . . . . . . . . . . . . . . . . . . . . . . . . . . . . . . . . . . . 6,853 7,189Equity available to the closed group . . . . . . . . . . . . . . . . . . . . . . . . . . . . . . . . . . . 12,404 12,789
For
per
sona
l use
onl
y
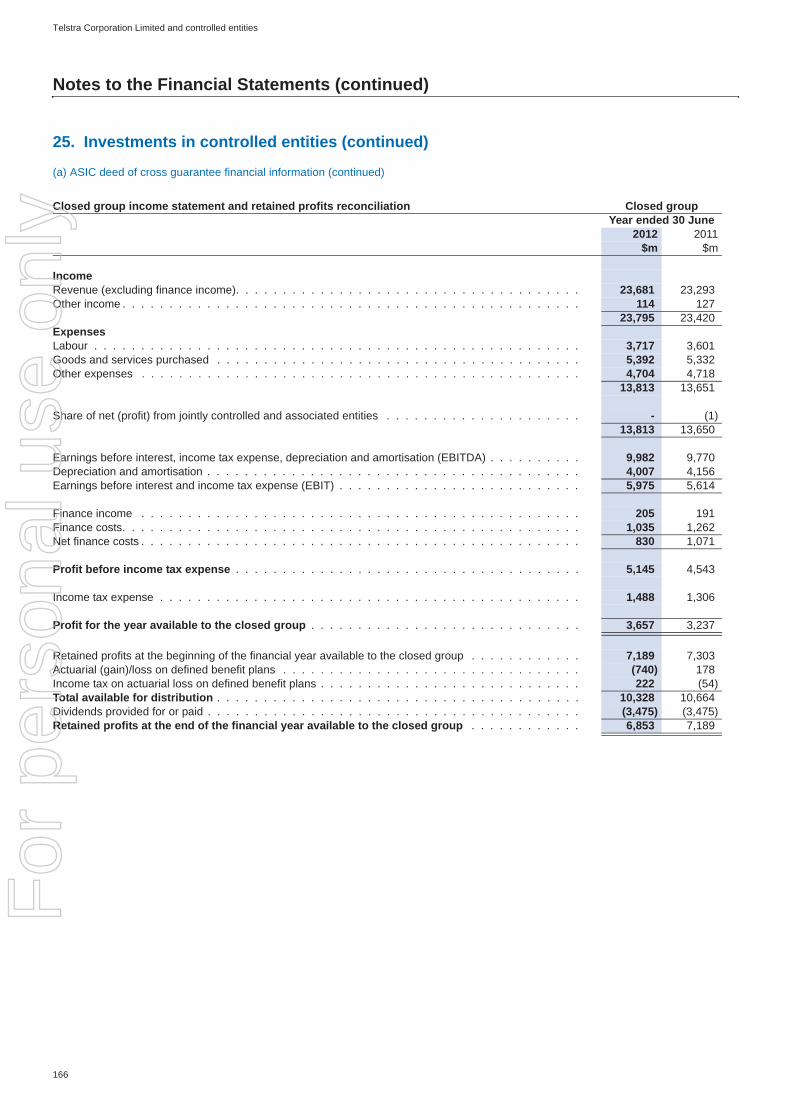
Telstra Corporation Limited and controlled entities
166
Notes to the Financial Statements (continued)
(a) ASIC deed of cross guarantee financial information (continued)
25. Investments in controlled entities (continued)
Closed group income statement and retained profits reconciliation Closed groupYear ended 30 June
2012 2011$m $m
IncomeRevenue (excluding finance income). . . . . . . . . . . . . . . . . . . . . . . . . . . . . . . . . . . . . 23,681 23,293Other income . . . . . . . . . . . . . . . . . . . . . . . . . . . . . . . . . . . . . . . . . . . . . . . . . 114 127
23,795 23,420ExpensesLabour . . . . . . . . . . . . . . . . . . . . . . . . . . . . . . . . . . . . . . . . . . . . . . . . . . . . 3,717 3,601Goods and services purchased . . . . . . . . . . . . . . . . . . . . . . . . . . . . . . . . . . . . . . . 5,392 5,332Other expenses . . . . . . . . . . . . . . . . . . . . . . . . . . . . . . . . . . . . . . . . . . . . . . . 4,704 4,718
13,813 13,651
Share of net (profit) from jointly controlled and associated entities . . . . . . . . . . . . . . . . . . . . . - (1)13,813 13,650
Earnings before interest, income tax expense, depreciation and amortisation (EBITDA) . . . . . . . . . . 9,982 9,770Depreciation and amortisation . . . . . . . . . . . . . . . . . . . . . . . . . . . . . . . . . . . . . . . . 4,007 4,156Earnings before interest and income tax expense (EBIT) . . . . . . . . . . . . . . . . . . . . . . . . . . 5,975 5,614
Finance income . . . . . . . . . . . . . . . . . . . . . . . . . . . . . . . . . . . . . . . . . . . . . . . 205 191Finance costs. . . . . . . . . . . . . . . . . . . . . . . . . . . . . . . . . . . . . . . . . . . . . . . . . 1,035 1,262Net finance costs . . . . . . . . . . . . . . . . . . . . . . . . . . . . . . . . . . . . . . . . . . . . . . . 830 1,071
Profit before income tax expense . . . . . . . . . . . . . . . . . . . . . . . . . . . . . . . . . . . . . 5,145 4,543
Income tax expense . . . . . . . . . . . . . . . . . . . . . . . . . . . . . . . . . . . . . . . . . . . . . 1,488 1,306
Profit for the year available to the closed group . . . . . . . . . . . . . . . . . . . . . . . . . . . . . 3,657 3,237
Retained profits at the beginning of the financial year available to the closed group . . . . . . . . . . . . 7,189 7,303Actuarial (gain)/loss on defined benefit plans . . . . . . . . . . . . . . . . . . . . . . . . . . . . . . . . (740) 178Income tax on actuarial loss on defined benefit plans . . . . . . . . . . . . . . . . . . . . . . . . . . . . 222 (54)Total available for distribution . . . . . . . . . . . . . . . . . . . . . . . . . . . . . . . . . . . . . . . 10,328 10,664Dividends provided for or paid . . . . . . . . . . . . . . . . . . . . . . . . . . . . . . . . . . . . . . . . (3,475) (3,475)Retained profits at the end of the financial year available to the closed group . . . . . . . . . . . . 6,853 7,189
For
per
sona
l use
onl
y
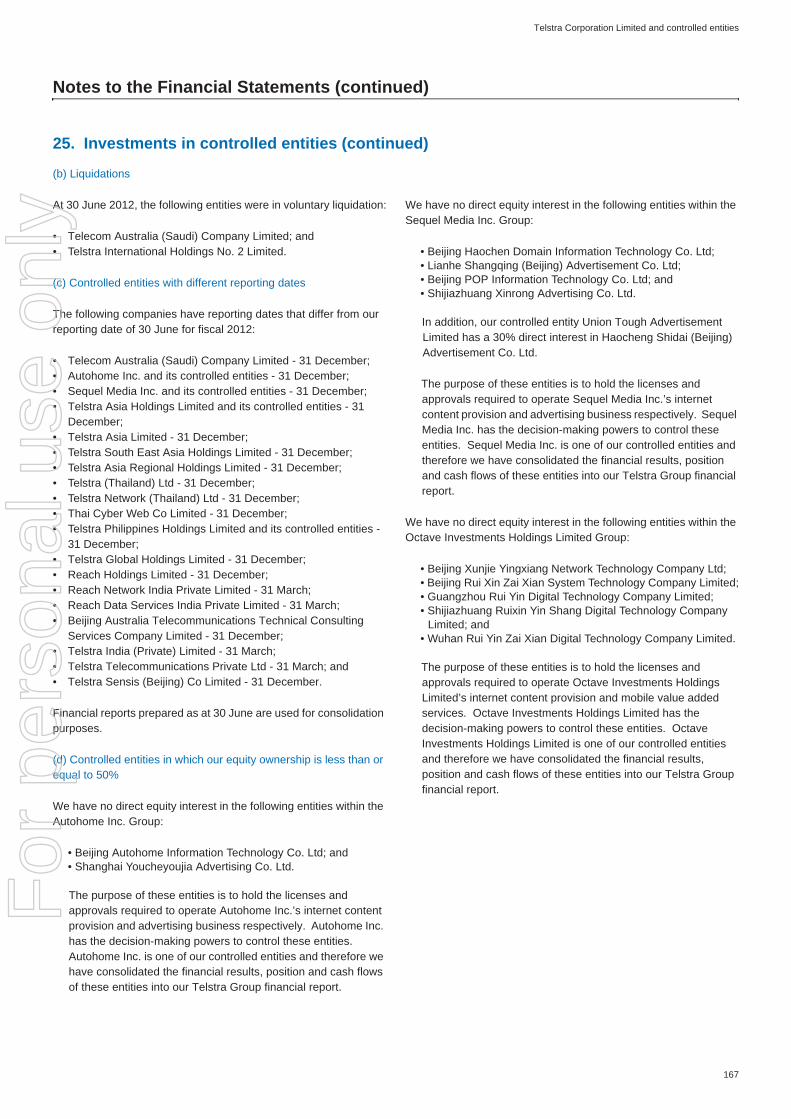
Telstra Corporation Limited and controlled entities
167
Notes to the Financial Statements (continued)
(b) Liquidations
At 30 June 2012, the following entities were in voluntary liquidation:
• Telecom Australia (Saudi) Company Limited; and• Telstra International Holdings No. 2 Limited.
(c) Controlled entities with different reporting dates
The following companies have reporting dates that differ from our reporting date of 30 June for fiscal 2012:
• Telecom Australia (Saudi) Company Limited - 31 December; • Autohome Inc. and its controlled entities - 31 December;• Sequel Media Inc. and its controlled entities - 31 December;• Telstra Asia Holdings Limited and its controlled entities - 31
December;• Telstra Asia Limited - 31 December;• Telstra South East Asia Holdings Limited - 31 December;• Telstra Asia Regional Holdings Limited - 31 December;• Telstra (Thailand) Ltd - 31 December;• Telstra Network (Thailand) Ltd - 31 December;• Thai Cyber Web Co Limited - 31 December;• Telstra Philippines Holdings Limited and its controlled entities -
31 December;• Telstra Global Holdings Limited - 31 December;• Reach Holdings Limited - 31 December;• Reach Network India Private Limited - 31 March;• Reach Data Services India Private Limited - 31 March;• Beijing Australia Telecommunications Technical Consulting
Services Company Limited - 31 December;• Telstra India (Private) Limited - 31 March; • Telstra Telecommunications Private Ltd - 31 March; and• Telstra Sensis (Beijing) Co Limited - 31 December.
Financial reports prepared as at 30 June are used for consolidation purposes.
(d) Controlled entities in which our equity ownership is less than or equal to 50%
We have no direct equity interest in the following entities within the Autohome Inc. Group:
• Beijing Autohome Information Technology Co. Ltd; and• Shanghai Youcheyoujia Advertising Co. Ltd.
The purpose of these entities is to hold the licenses and approvals required to operate Autohome Inc.’s internet content provision and advertising business respectively. Autohome Inc. has the decision-making powers to control these entities. Autohome Inc. is one of our controlled entities and therefore we have consolidated the financial results, position and cash flows of these entities into our Telstra Group financial report.
We have no direct equity interest in the following entities within the Sequel Media Inc. Group:
• Beijing Haochen Domain Information Technology Co. Ltd;• Lianhe Shangqing (Beijing) Advertisement Co. Ltd;• Beijing POP Information Technology Co. Ltd; and• Shijiazhuang Xinrong Advertising Co. Ltd.
In addition, our controlled entity Union Tough Advertisement Limited has a 30% direct interest in Haocheng Shidai (Beijing) Advertisement Co. Ltd.
The purpose of these entities is to hold the licenses and approvals required to operate Sequel Media Inc.’s internet content provision and advertising business respectively. Sequel Media Inc. has the decision-making powers to control these entities. Sequel Media Inc. is one of our controlled entities and therefore we have consolidated the financial results, position and cash flows of these entities into our Telstra Group financial report.
We have no direct equity interest in the following entities within the Octave Investments Holdings Limited Group:
• Beijing Xunjie Yingxiang Network Technology Company Ltd;• Beijing Rui Xin Zai Xian System Technology Company Limited;• Guangzhou Rui Yin Digital Technology Company Limited;• Shijiazhuang Ruixin Yin Shang Digital Technology Company
Limited; and• Wuhan Rui Yin Zai Xian Digital Technology Company Limited.
The purpose of these entities is to hold the licenses and approvals required to operate Octave Investments Holdings Limited’s internet content provision and mobile value added services. Octave Investments Holdings Limited has the decision-making powers to control these entities. Octave Investments Holdings Limited is one of our controlled entities and therefore we have consolidated the financial results, position and cash flows of these entities into our Telstra Group financial report.
25. Investments in controlled entities (continued)
For
per
sona
l use
onl
y

Telstra Corporation Limited and controlled entities
168
Notes to the Financial Statements (continued)
(d) Controlled entities in which our equity ownership is less than or equal to 50% (continued)
We have effective control over the following entities through economic dependency and contractual arrangements with the majority shareholders and have consolidated them into our group:
• Telstra (Thailand) Ltd;• Incomgen Holdings Inc.; and• Thai Cyber Web Co. Ltd.
We own 50% of the issued capital of Telecom Australia (Saudi) Company Limited. We can exercise control over the Board of Directors of this entity in perpetuity, and therefore we have consolidated the financial results, position and cash flows of this entity into our Telstra Group financial report. This entity is currently in voluntary liquidation.
(e) Controlled entities not individually audited by Ernst & Young
Companies not audited by Ernst & Young, our Australian statutory auditor.
(f) New incorporations and business combinations
A new controlled entity Telstra International PNG Limited was registered on 1 November 2011.
Autohome (Hong Kong) Limited was incorporated on 16 March 2012 and is 100% owned by Cheerbright International Holdings Limited.
The office of ITA Limited was registered on 10 May 2012. This entity is not controlled by Telstra as it was setup for Telstra’s Structural Separation Undertaking for the Independent Telecommunications Adjudicator.
(g) Purchase of additional interest
On 12 March 2012, Telstra (Thailand) Ltd increased its ownership in Telstra Network (Thailand) Ltd to 68% for a minimal consideration.
On 17 May 2012, Telstra Holdings Pty Ltd acquired an additional 11% interest in Autohome Inc. for $37 million to take our ownership interest to 66%.
(h) Sales and disposals
On 21 July 2011, we sold our 64.4% shareholding in Adstream (Aust) Pty Ltd for a total consideration of $24 million.
On 21 October 2011, our controlled entity Octave Investments Holdings Limited sold its ChinaM business for a total consideration of $5 million.
On 27 March 2012, our controlled entity Telstra Robin Holdings Ltd sold its 67% shareholding in Dotad Media Holdings Ltd (LMobile) for a total consideration of $3 million.
(i) Non current assets held for sale
The carrying value of the assets and liabilities of TelstraClear Limited and its controlled entity CLEAR Communications Limited have been classified as held for sale at 30 June 2012. Please refer to note 12 and note 31 for further details.
25. Investments in controlled entities (continued)
For
per
sona
l use
onl
y

Telstra Corporation Limited and controlled entities
169
Notes to the Financial Statements (continued)
Our investments in jointly controlled and associated entities are listed below:
Unless otherwise noted, all investments have a reporting date of 30 June, are incorporated in Australia and our voting power is the same as our ownership interest.
(*) The Telstra Group carrying amounts are calculated using the equity method of accounting.
26. Investments in jointly controlled and associated entities
Telstra GroupAs at 30 June
2012 2011$m $m
Investments in jointly controlled entitiesInvestments in jointly controlled entities . . . . . . . . . . . . . . . . . . . . . . . . . . . . . . . . . . . . . 2 2Allowance for impairment in value . . . . . . . . . . . . . . . . . . . . . . . . . . . . . . . . . . . . . . . . - -Carrying amount of investments in jointly controlled entities . . . . . . . . . . . . . . . . . . . . . . . . . . . 2 2
Investments in associated entitiesInvestments in associated entities . . . . . . . . . . . . . . . . . . . . . . . . . . . . . . . . . . . . . . . . 34 24Allowance for impairment in value . . . . . . . . . . . . . . . . . . . . . . . . . . . . . . . . . . . . . . . . (24) (24)Carrying amount of investments in associated entities. . . . . . . . . . . . . . . . . . . . . . . . . . . . . . 10 -
12 2
Name of Entity Principal activities Ownership interestAs at 30 June
2012 2011% %
Jointly controlled entitiesFOXTEL Partnership (f)(g) Pay television 50.0 50.0FOXTEL Television Partnership (f)(g) Pay television 50.0 50.0Customer Services Pty Limited (f)(g) Customer service 50.0 50.0FOXTEL Management Pty Ltd (f)(g) Management services 50.0 50.0FOXTEL Cable Television Pty Ltd (a)(f)(g) Pay television 80.0 80.0Reach Ltd (incorporated in Bermuda) (d)(f)(g) International connectivity services 50.0 50.0TNAS Limited (incorporated in New Zealand) (d)(f)(g) Toll free number portability in New Zealand 33.3 33.33GIS Pty Ltd (d)(f) Management services 50.0 50.03GIS Partnership (d)(f) 3G network services 50.0 50.0Bridge Mobile Pte Ltd (incorporated in Singapore) (d)(f) Regional roaming provider 10.0 10.0
Associated entitiesAustralia-Japan Cable Holdings Limited (incorporated in Bermuda) (d)(f)(g) Network cable provider 46.9 46.9Telstra Super Pty Ltd (a)(g) Superannuation trustee 100.0 100.0Telstra Foundation Ltd (a) Charitable trustee organisation 100.0 100.0Mandoe Pty Ltd (b)(f) Signage software provider 25.0 -IPscape Pty Ltd (b)(f) Cloud based call centre solution 31.3 -Dimmi Pty Ltd (b)(f) Online restaurant reservation 23.4 -
For
per
sona
l use
onl
y

Telstra Corporation Limited and controlled entities
170
Notes to the Financial Statements (continued)
(a) Jointly controlled and associated entities in which we own more than 50% equity
• we own 80% of the equity of FOXTEL Cable Television Pty Ltd. This entity is disclosed as a jointly controlled entity as the other equity shareholders have participating rights that prevent us from dominating the decision-making of the Board of Directors. Effective voting power is restricted to 50% and we have joint control.
• we own 100% of the equity of Telstra Super Pty Ltd, the trustee for the Telstra Superannuation Scheme (Telstra Super). We do not consolidate Telstra Super Pty Ltd as we do not control the Board of Directors. We have equal representation with employee representatives on the Board. Our voting power is limited to 44%, which is equivalent to our representation on the Board. The entity is therefore classified as an associated entity as we have significant influence over it.
• we own 100% of the equity of Telstra Foundation Ltd (TFL). TFL is limited by guarantee (guaranteed to $100) with Telstra Corporation Limited being the sole member. We did not contribute any equity to TFL on incorporation. TFL is the trustee of the Telstra Community Development Fund and manager of the Telstra Kids Fund. We do not consolidate TFL as we do not control the Board. Our voting power on the Board is limited to 38%, which is equivalent to our representation on the Board.
(b) Other changes in jointly controlled and associated entities
In fiscal 2012 we acquired interests in the following associated entities for a total consideration of $10 million:
• Dimmi Pty Ltd;• IPscape Pty Ltd; and• Mandoe Pty Ltd.
(c) Dividends received
No dividends were received during the year (2011: $1 million received from Keycorp Limited which was disposed of in fiscal 2011).
(d) Jointly controlled and associated entities with different reporting dates
The following jointly controlled and associated entities have different reporting dates to our reporting date of 30 June for fiscal 2012:
• Reach Ltd - 31 December; • TNAS Limited - 31 March;• 3GIS Pty Ltd - 31 December;• 3GIS Partnership - 31 December;• Bridge Mobile Pte Ltd - 31 March; and• Australia-Japan Cable Holdings Limited - 31 December.
Financial reports prepared as at 30 June are used for equity accounting purposes. Our ownership interest in jointly controlled and associated entities with different reporting dates is the same at that reporting date as at 30 June unless otherwise noted.
(e) Share of net profits
In fiscal 2012 there were minimal (2011: $1 million) share of profits from jointly controlled and associated entities.
26. Investments in jointly controlled and associated entities (continued)
For
per
sona
l use
onl
y

Telstra Corporation Limited and controlled entities
171
Notes to the Financial Statements (continued)
(f) Other disclosures for jointly controlled and associated entities
The movements in the consolidated equity accounted amount of our jointly controlled and associated entities are summarised as follows:
Other commitments
Our jointly controlled entity, FOXTEL, has other commitments amounting to approximately $4,045 million (2011: $4,152 million). The majority of our 50% share of these commitments relate to minimum subscriber guarantees (MSG) for pay television programming agreements. These agreements are for periods of between 1 and 25 years and are based on current prices and costs under agreements entered into between the FOXTEL Partnership and various other parties. These minimum subscriber payments fluctuate in accordance with price escalation, as well as foreign currency movements. In addition to our MSG, FOXTEL has other commitments including obligations for satellite transponder costs and digital set top box units.
Our jointly controlled entity, 3GIS Partnership, has other commitments amounting to $192 million (2011: $182 million). The majority of our 50% share of these commitments relate to property leases. These leases are for periods of between 1 and 10 years and are based on future property payments under agreements entered into between the 3GIS Partnership and various other parties.
Under the Telstra Network Access Contract dated 6 December 2004, we are charged a 3G Network Access Charge that includes our 50% share of the partnership’s operational expenditure. As we are obligated through this agreement to fund our share of the partnership’s operating expenditure we are also responsible for our share of its expenditure commitments.
On 21 October 2010, we agreed to conclude our 3GIS Partnership with Vodafone Hutchison Australia on 31 August 2012. When the agreement concludes, our property lease commitments will continue as both parties will be assigned their share of leases.
26. Investments in jointly controlled and associated entities (continued)
Jointly controlledentities Associated entities
Telstra Group Telstra GroupYear ended/As at Year ended/As at
30 June 30 June2012 2011 2012 2011
$m $m $m $m
Carrying amount of investments at beginning of year . . . . . . . . . . . . . 2 2 - 15Additional investments made during the year . . . . . . . . . . . . . . . . . . . - - 10 -
2 2 10 15Share of net profits for the year . . . . . . . . . . . . . . . . . . . . . . . . . . - - - 1Dividends received . . . . . . . . . . . . . . . . . . . . . . . . . . . . . . . . . - - - (1)Sale, transfers and reductions of investments during the year. . . . . . . . . . . - - - (15)Carrying amount of investments at end of year . . . . . . . . . . . . . . . . 2 2 10 -
Our share of contingent liabilities of jointly controlled and associated entities . . . 9 9 - -
Our share of capital commitments contracted for by our jointly controlledand associated entities . . . . . . . . . . . . . . . . . . . . . . . . . . . . . . . 9 3 1 -
For
per
sona
l use
onl
y

Telstra Corporation Limited and controlled entities
172
Notes to the Financial Statements (continued)
(f) Other disclosures for jointly controlled and associated entities (continued)
Summarised presentation of all of our jointly controlled and associated entities’ assets, liabilities, revenue and expense items (including jointly controlled and associated entities where equity accounting has been suspended):
(#) Assets and liabilities include the acquisition of AUSTAR by the FOXTEL Partnership accounted for on a provisional basis.
26. Investments in jointly controlled and associated entities (continued)
Jointly controlledentities Associated entities
Telstra Group (#) Telstra GroupYear ended/As at Year ended/As at
30 June 30 June2012 2011 2012 2011
$m $m $m $m
Current assets . . . . . . . . . . . . . . . . . . . . . . . . . . . . . . . . . . . 450 378 27 49Non current assets . . . . . . . . . . . . . . . . . . . . . . . . . . . . . . . . . 3,405 1,027 176 175Total assets . . . . . . . . . . . . . . . . . . . . . . . . . . . . . . . . . . . . 3,855 1,405 203 224
Current liabilities . . . . . . . . . . . . . . . . . . . . . . . . . . . . . . . . . . 765 589 15 47Non current liabilities . . . . . . . . . . . . . . . . . . . . . . . . . . . . . . . . 3,544 1,207 327 334Total liabilities . . . . . . . . . . . . . . . . . . . . . . . . . . . . . . . . . . . 4,309 1,796 342 381Net liabilities. . . . . . . . . . . . . . . . . . . . . . . . . . . . . . . . . . . . (454) (391) (139) (157)
Total income . . . . . . . . . . . . . . . . . . . . . . . . . . . . . . . . . . . . 4,808 4,910 54 51Total expenses . . . . . . . . . . . . . . . . . . . . . . . . . . . . . . . . . . . 4,635 4,633 31 36Profit before income tax expense . . . . . . . . . . . . . . . . . . . . . . . . 173 277 23 15Income tax expense/(benefit) . . . . . . . . . . . . . . . . . . . . . . . . . . . 4 - 1 (2)Profit for the year . . . . . . . . . . . . . . . . . . . . . . . . . . . . . . . . . 169 277 22 17
Summarised presentation of our share of all our jointly controlled and associated entities' revenue and expense items (including jointly controlled and associated entities where equity accounting has been suspended):
Total income . . . . . . . . . . . . . . . . . . . . . . . . . . . . . . . . . . . . 2,953 2,974 25 24Total expenses . . . . . . . . . . . . . . . . . . . . . . . . . . . . . . . . . . . 2,868 2,833 14 17Profit before income tax expense . . . . . . . . . . . . . . . . . . . . . . . . 85 141 11 7Income tax expense/(benefit) . . . . . . . . . . . . . . . . . . . . . . . . . . . 2 - - (1)Profit for the year . . . . . . . . . . . . . . . . . . . . . . . . . . . . . . . . . 83 141 11 8
For
per
sona
l use
onl
y

Telstra Corporation Limited and controlled entities
173
Notes to the Financial Statements (continued)
(g) Suspension of equity accounting
Our unrecognised share of (profits)/losses for the period and cumulatively, for our entities where equity accounting has ceased and the investment is recorded at zero due to losses made by these entities and/or reductions in the equity accounted carrying amount, is shown below:
Equity accounting has also been suspended for the following jointly controlled and associated entities:
• TNAS Limited; and• Telstra Super Pty Ltd.
There are no significant unrecognised profits/losses in these entities.
(*) FOXTEL includes FOXTEL Partnership and their controlled entities, FOXTEL Television Partnership, Customer Services Pty Limited, FOXTEL Management Pty Limited and FOXTEL Cable Television Pty Ltd.
A $108 million distribution was received from FOXTEL during the year (2011: $70 million). This has been recorded as revenue in the income statement and has decreased our cumulative share of unrecognised losses in FOXTEL to $160 million after taking into account Telstra’s share of FOXTEL’s profit for the year of $85 million and other adjustments of $5 million.
26. Investments in jointly controlled and associated entities (continued)
Telstra GroupYear ended 30 June
Period Cumulative Period Cumulative2012 2012 2011 2011
$m $m $m $m
Jointly controlled entitiesFOXTEL (*) . . . . . . . . . . . . . . . . . . . . . . . . . . . . . . . . 28 160 (20) 132Reach Ltd . . . . . . . . . . . . . . . . . . . . . . . . . . . . . . . . 1 560 (37) 559
Associated entitiesAustralia-Japan Cable Holdings Limited . . . . . . . . . . . . . . . . . (11) 137 (8) 148
18 857 (65) 839
For
per
sona
l use
onl
y

Telstra Corporation Limited and controlled entities
174
Notes to the Financial Statements (continued)
The Company has a number of employee share plans that are available for Directors, executives and employees. These include those conducted through the: • Telstra Growthshare Trust; and • Telstra Employee Share Ownership Plan Trusts (TESOP99 and
TESOP97).
The nature of each plan, details of plan holdings, movements in holdings, and other relevant information is disclosed below.
Telstra Growthshare Trust
The Telstra Growthshare Trust commenced in fiscal 2000. Under the trust, Telstra operates a number of different equity plans, including:• short term incentive plans;• long term incentive plans; • Directshare and Ownshare plans; and• other equity plans.
The trustee for the trust is Telstra Growthshare Pty Ltd. This company is 100% owned by Telstra. Funding is provided to the Telstra Growthshare Trust to purchase Telstra shares on market to underpin the equity instruments issued.
In fiscal 2012, we recorded an expense of $19 million for our share based payment plans operated by the Telstra Growthshare Trust (2011: $12 million). As at 30 June 2012, we had an estimated total expense yet to be recognised of $36 million (2011: $27 million), which is expected to be recognised over a weighted average of 1.5 years (2011: 1.8 years).
(a) Short term incentive (STI) plans
The purpose of the STI is to link key executives’ rewards to individual key performance indicators and to Telstra's financial performance. The STI is delivered in cash and incentive shares and the executive is paid an annual STI only when the threshold targets are met or exceeded.
(i) Description of equity instruments
Deferred Incentive shares for the Chief Executive Officer (CEO) and other senior executives (fiscal 2012 and fiscal 2011)
For fiscal 2012 and fiscal 2011, the Board approved 25% of the CEO and other senior executives’ short term incentive to be allocated as deferred incentive shares. The effective allocation date is 17 August 2012 and 19 August 2011 respectively. These shares vest in equal parts over one and two years on the anniversary of their effective allocation date, subject to the CEO or a senior executive’s continued employment with any entity that forms part of the Telstra Group. However, the CEO or a senior executive may retain the shares if they cease employment because of death, total and permanent disablement or redundancy (in each case subject to applicable law relating to the provision of benefits).
Applicable only to allocations from August 2012, deferred incentive shares may also be retained if the CEO or a senior executive ceases employment due to retirement, where that retirement is 6 months after the actual allocation date. The CEO and senior executives are able to vote and receive dividends as and from the allocation date. Performance hurdles applied in determining the number of deferred incentive shares allocated and therefore vesting of the deferred incentive shares are not subject to any additional performance hurdles.
Due to the Structural Separation Undertaking (SSU) arising from the NBN transaction, the GMD of Telstra Wholesale is prohibited from participating in the fiscal 2012 LTI plan. As a result, an alternative remuneration arrangement has been provided, which is a share based deferred incentive plan based on the same performance measures as his fiscal 2012 STI plan.
Deferred Incentive shares for other executives (fiscal 2012)
As part of a review on the market positioning of management positions, Telstra elected to remove management positions (other than senior executives) that were participating in LTI plans from any future LTI allocations. This change was effective 1 July 2011. Replacing the LTI plan is a share based deferral plan which requires management roles to defer 25% of the actual STI payment they receive into Telstra shares for a period of three years.
For fiscal 2012, the Board approved 25% of management’s short term incentive to be allocated as deferred incentive shares. The effective allocation date will be 16 August 2012. These shares vest on the three year anniversary of their allocation date, subject to the executive’s continued employment with any entity that forms part of the Telstra Group. However, the executive may retain the shares if they cease employment because of death, total and permanent disablement or redundancy (in each case subject to applicable law relating to the provision of benefits). Applicable only to allocations from August 2012, deferred incentive shares may also be retained if the executive ceases employment due to retirement or expiry of a fixed term contract where that retirement or fixed term expiry is 6 months after the actual allocation date. The executive is able to vote and receive dividends as and from the allocation date. Performance hurdles are applied in determining the number of deferred incentive shares allocated and therefore vesting of the deferred incentive share is not subject to any other performance hurdles.
Incentive shares (fiscal 2008 and 2007):
In relation to fiscal 2008 and 2007 allocations of incentive shares, the incentive shares vested immediately, and the executive is able to use the incentive shares to vote and receive dividends from the vesting date. However, the executive is restricted from dealing with the vested incentive shares until after they are released from the restriction period.
27. Employee share plans
For
per
sona
l use
onl
y

Telstra Corporation Limited and controlled entities
175
Notes to the Financial Statements (continued)
Telstra Growthshare Trust (continued)
(a) Short term incentive (STI) plans (continued)
Vested incentive shares are released from trust on the earliest of:
• five years from the date of effective allocation;• when the minimum level of executive shareholding has been
achieved and the Board approves removal of the five year restriction period;
• upon the ceasing of employment by the executive; or• a date the Board determines (in response to an actual or likely
change of control).
Once the vested incentive shares are released from trust, they will be transferred to the executive.
(ii) Summary of movements and other information
Allocations of Telstra’s shares have been made in the form of incentive and deferred incentive shares under our STI plans and are detailed in the following table:
(^) Incentive shares includes both incentive shares and deferred incentive shares. The weighted average share price for incentive shares exercised during the financial year was $3.11 (2011: $2.84).
(*) The fair value of incentive shares and deferred incentive shares for the CEO and other senior executives granted is based on the market value of Telstra shares on allocation date. The fair value of deferred incentive shares for executives (other than the CEO and other senior executives), is based on the market value of Telstra shares on grant date.
(#) The number outstanding includes incentives shares and deferred incentive shares that are subject to a restriction period. These amount to 1,250,470 as at 30 June 2012.
27. Employee share plans (continued)
Incentive shares (^)
Number
Weighted average fair
value (*)Outstanding as at 30 June 2010 . . . 1,172,308 $4.36Forfeited . . . . . . . . . . . . . . . . (68) $4.77Exercised. . . . . . . . . . . . . . . . (191,749) $4.42Outstanding as at 30 June 2011 . . . 980,491 $4.35Granted. . . . . . . . . . . . . . . . . 893,678 $3.11Forfeited . . . . . . . . . . . . . . . . (206,734) $3.11Exercised. . . . . . . . . . . . . . . . (416,965) $4.35Outstanding as at 30 June 2012 (#) . 1,250,470 $3.67
Exercisable as at 30 June 2012 . . . - -
For
per
sona
l use
onl
y

Telstra Corporation Limited and controlled entities
176
Notes to the Financial Statements (continued)
Telstra Growthshare Trust (continued)
(b) Long term incentive (LTI) plans
The purpose of LTI plans is to align key executives’ rewards with shareholders’ interests, and reward performance improvement whilst supporting business plans and corporate strategies. The Telstra Growthshare Trust Board administers the plans, and the Remuneration Committee and the Telstra Board determine who is invited to participate in these plans.
Performance of the LTI plans is measured with respect to the relevant performance period and subject to subsequent verification, ratification and sign off by the Remuneration Committee and approval by the Board.
(i) Outstanding equity based instruments
Allocations have been made over a number of years in the form of performance rights, restricted shares and options under our LTI plans. These represent a right to acquire a share in Telstra. Further information regarding each type of LTI plan that was outstanding during the year are detailed in the following table:
Refer to section (b)(ii) for a description of the above equity instruments.
27. Employee share plans (continued)
Allocation datePerformance
periodExercise
price Expiry datefrom to
Growthshare 2002 - Sept 2001 allocationTSR options . . . . . . . . . . . . . . . . . 6 Sept 2001 6 Sept 2004 6 Sept 2006 $4.90 6 Sept 2011Growthshare 2006 - Feb 2006 allocation
RG & NT performance rights . . . . . . . . . 19 Aug 2005 1 Jul 2005 30 Jun 2010$1 per parcel
exercised 19 Aug 2012
ROI performance rights . . . . . . . . . . . . . 19 Aug 2005 1 Jul 2005 30 Jun 2008$1 per parcel
exercised 19 Aug 2012Growthshare 2008ESOP options . . . . . . . . . . . . . . . . 17 Aug 2007 n/a n/a $4.34 17 Aug 2012ROI options. . . . . . . . . . . . . . . . . . 17 Aug 2007 1 Jul 2008 30 Jun 2011 $4.34 30 Jun 2013Growthshare 2009ESOP options . . . . . . . . . . . . . . . . 21 Aug 2008 n/a n/a $4.36 21 Aug 2013US ESOP options . . . . . . . . . . . . . . 21 Aug 2008 n/a n/a $4.25 21 Aug 2013RTSR options . . . . . . . . . . . . . . . . 21 Aug 2008 1 Jul 2008 30 Jun 2012 $4.36 30 Jun 2014ROI restricted shares. . . . . . . . . . . . . 21 Aug 2008 1 Jul 2009 30 Jun 2012 nil 21 Aug 2014Growthshare 2010ESRP performance rights . . . . . . . . . . 21 Aug 2009 n/a n/a nil 21 Aug 2012RTSR restricted shares . . . . . . . . . . . 21 Aug 2009 1 Jul 2009 30 Jun 2012 nil 21 Aug 2013FCF ROI restricted shares . . . . . . . . . . 21 Aug 2009 1 Jul 2009 30 Jun 2012 nil 21 Aug 2013Growthshare 2011ESRP performance rights . . . . . . . . . . 20 Aug 2010 n/a n/a nil 20 Aug 2013RTSR restricted shares . . . . . . . . . . . 20 Aug 2010 1 Jul 2010 30 Jun 2013 nil 20 Aug 2014FCF ROI restricted shares . . . . . . . . . . 20 Aug 2010 1 Jul 2010 30 Jun 2013 nil 20 Aug 2014Growthshare 2012ESP restricted shares . . . . . . . . . . . . 19 Apr 2012 n/a n/a nil 19 Apr 2015RTSR restricted shares . . . . . . . . . . . 19 Aug 2011 1 Jul 2011 30 Jun 2014 nil 19 Aug 2015FCF ROI restricted shares . . . . . . . . . . 19 Aug 2011 1 Jul 2011 30 Jun 2014 nil 19 Aug 2015
For
per
sona
l use
onl
y

Telstra Corporation Limited and controlled entities
177
Notes to the Financial Statements (continued)
Telstra Growthshare Trust (continued)
(b) Long term incentive (LTI) plans (continued)
(i) Outstanding equity based instruments (continued)
In relation to these executive LTI plans, the Board may, in its discretion, reset the hurdles governing the fiscal 2012, fiscal 2011, fiscal 2010 and fiscal 2009 equity instruments to make them consistent with the changed circumstances resulting from the occurrence of factors including:
• a material change in the strategic business plan; • a regulatory change; or • a significant out-of-plan business development (this could
include a major acquisition outside the current business plan, resulting in a significant change to the business of Telstra or the Telstra Group, that means that (in the reasonable opinion of the Board) the targets for that class of equity instruments are no longer appropriate).
In fiscal 2012, the Board did not reset the hurdles governing the equity instruments issued in fiscal 2012, fiscal 2011, fiscal 2010 or fiscal 2009.
(ii) Description of equity instruments
Restricted shares
Executive LTI restricted shares
In respect of restricted shares, an executive has no legal or beneficial interest in the underlying shares, no entitlement to dividends received from the shares and no voting rights in relation to the shares until the restricted shares vest. In relation to restricted shares issued in fiscal 2012, fiscal 2011, fiscal 2010 and fiscal 2009, if the performance hurdle is satisfied during the applicable performance period, a specified number of restricted shares, as determined in accordance with the trust deed and terms of issue, will vest and become restricted trust shares.
Although the trustee holds the restricted trust shares in trust, the executive will retain beneficial interest (dividends, voting rights, bonuses and rights issues) in the shares until they are transferred to them or sold on their behalf at expiration of the restriction period (unless forfeited).
A description of each restricted share that existed in fiscal 2012 is set out below:
• return on investment (ROI) restricted shares - the performance hurdle for these shares is based on an increase in the earnings before interest and tax for Telstra divided by the average investment;
• relative total shareholder return (RTSR) restricted shares - the performance hurdle for these shares is based on growth in
Telstra's total shareholder return relative to the growth in total shareholder return of the companies in the peer group; and
• free cashflow return on investment (FCF ROI) restricted shares - the performance hurdle for these shares is based on Telstra’s annual free cashflow (less finance costs) over the performance period divided by the average investment over the performance period.
Employee Share Plan restricted shares 2012
Restricted shares provided under the employee share plan (ESP) in fiscal 2012 were allocated at no cost to certain eligible employees (excluding executives). The shares are held by the Trustee on behalf of employees until the restriction period ends. During the restriction period employees may direct the Trustee to vote on their behalf and receive dividends on the shares. The shares are released from trust on the earlier of 3 years from the date of allocation or the date the participating employee ceases relevant employment.
Options
An employee or executive is not entitled to Telstra shares unless the options initially vest (subject to the achievement of the relevant performance hurdles) and then are exercised. This means that the employee or executive cannot use options to vote or receive dividends until they have vested and been exercised. If the performance hurdles are satisfied in the applicable performance period, options must be exercised at any time before the expiry date, otherwise they will lapse. Once the options are exercised and the exercise price paid, Telstra shares will be transferred to the eligible employee or executive.
A description of each type of option that existed in fiscal 2012 is set out below:
Employee options:
• ESOP options - the performance hurdle for these options is based on the completion of three years continuous service by the participant (and once granted are not subject to any performance conditions); and
• US ESOP options - the performance hurdle for these options is based on the completion of three years continuous service by the participant (and once granted are not subject to any performance conditions).
Executive LTI options: • relative total shareholder return options (RTSR options) - the
performance hurdle for these options is based on growth in Telstra's total shareholder return relative to the growth in total shareholder return of the companies in the peer group;
27. Employee share plans (continued)
For
per
sona
l use
onl
y

Telstra Corporation Limited and controlled entities
178
Notes to the Financial Statements (continued)
Telstra Growthshare Trust (continued)
(b) Long term incentive (LTI) plans (continued)
(ii) Description of equity instruments (continued)
• total shareholder return options (TSR options) - the performance hurdle for these options is based on growth in Telstra's total shareholder return; and
• return on investment options (ROI options) - the performance hurdle for these options is based on an increase in the earnings before interest and tax for Telstra relative to the average investment.
Performance rights
In respect of performance rights allocated prior to fiscal 2010, an executive or an employee has no legal or beneficial interest in the underlying shares, no entitlement to dividends received from the shares and no voting rights in relation to the shares until the performance rights vest. If the performance hurdle is satisfied during the applicable performance period, a specified number of performance rights, as determined in accordance with the trust deed and terms of issue, will become vested performance rights.
The exercise price for the vested performance rights allocated to executives prior to fiscal 2010 is $1 in total for all of the performance rights exercised on a particular day.
For employee share rights plan (ESRP) performance rights allocated in fiscal 2011 and fiscal 2010, there is no exercise price payable. Once the performance rights have vested, the rights will be automatically exercised and Telstra shares will be transferred to the employee. Until this time, the employee cannot use the performance rights (or vested performance rights) to vote or receive dividends.
A description of each type of performance right that existed in fiscal 2012 is set out below:
Employee performance rights (fiscal 2011 and fiscal 2010):
• employee share rights plan (ESRP) performance rights - the performance hurdle for these rights is based on the completion of three years continuous service by the participant (and once granted are not subject to any performance conditions).
Executive LTI performance rights:
• revenue growth (RG) performance rights - the performance hurdle for these rights is based on increases in Telstra’s revenue; and
• network transformation (NT) performance rights - the performance hurdle for these rights is based on completion of certain elements in Telstra’s network transformation program.
(iii) Performance hurdles
Restricted Shares
Details of the relevant performance hurdles in relation to restricted shares, are set out below:
Relative Total Shareholder Return (RTSR) restricted shares (fiscal 2012, fiscal 2011 and fiscal 2010)
For fiscal 2012, fiscal 2011 and fiscal 2010 RTSR restricted shares, the single performance period is the three year period ending on 30 June 2014, 30 June 2013 and 30 June 2012 respectively.
If Telstra achieves a result placing it in at least the 50th percentile for the performance period, then:
• the number of RTSR restricted shares that vest for that performance period is scaled proportionately from the 50th percentile (at which 25% of the allocation vests) to the 75th percentile (at which 100% of the allocation vests); and
• any restricted shares that do not vest will lapse.
If Telstra does not reach the 50th percentile, all of these RTSR restricted shares will lapse.
Any RTSR restricted shares that vest become restricted trust shares and are held by the Trustee until the restriction period ends (4 years after the effective allocation date of the restricted shares).
Free Cashflow Return on Investment (FCF ROI) restricted shares (fiscal 2012, fiscal 2011 and fiscal 2010)
For fiscal 2012, fiscal 2011 and fiscal 2010 FCF ROI restricted shares, the single performance period is the three year period ending on 30 June 2014, 30 June 2013 and 30 June 2012 respectively.
The number of FCF ROI restricted shares that will vest is calculated as follows:
• if the threshold target is achieved, then 50% of the allocation of FCF ROI restricted shares will vest;
• if the result achieved is between the threshold and stretch targets, then the number of FCF ROI restricted shares that will vest is scaled proportionately between 50% and 100%; and
• if the stretch target is achieved or exceeded, then 100% of the FCF ROI restricted shares will vest.
If the threshold target is not achieved, all of these FCF ROI restricted shares will lapse.
Any FCF ROI restricted shares that vest become restricted trust shares and are held by the Trustee until the end of the restriction period (4 years after the effective allocation date of the restricted shares).
27. Employee share plans (continued)
For
per
sona
l use
onl
y

Telstra Corporation Limited and controlled entities
179
Notes to the Financial Statements (continued)
Telstra Growthshare Trust (continued)
(b) Long term incentive (LTI) plans (continued)
(iii) Performance hurdles (continued)
Return on Investment (ROI) restricted shares (fiscal 2009)
For ROI restricted shares, there are three performance periods as follows:
• First performance period - 1 July 2009 to 30 June 2010;• Second performance period - 1 July 2010 to 30 June 2011; and• Third performance period - 1 July 2011 to 30 June 2012.
For each of the performance periods, the number of restricted shares that will vest is calculated as follows:
• if the threshold target is achieved, then 50% of the allocation of restricted shares for that period will vest;
• if the result achieved is between the threshold and stretch target, then the number of restricted shares for that period that will vest is scaled proportionately between 50% and 100%; and
• if the stretch target is achieved or exceeded, then 100% of the restricted shares for that period will vest.
Any of these restricted shares that vest become restricted trust shares. Any restricted shares which do not vest in their respective performance periods will lapse.
Employee Share Plan (ESP) restricted shares (fiscal 2012)
As part of the fiscal 2012 employee share plan, certain eligible employees were provided restricted shares. There are no performance hurdles for these restricted shares.
Options
Details of the relevant performance hurdles in relation to options are set out below:
ESOP options and US ESOP options (fiscal 2009 (ESOP and US ESOP) and 2008 (ESOP only))
As part of the employee share option plan, certain eligible employees were provided options that vest upon completing certain employment requirements. If an eligible employee continues to be employed by an entity that forms part of the Telstra Group three years after the effective allocation date of the options (and in certain other circumstances), the options will vest. These options are not subject to any additional performance hurdles.
Relative Total Shareholder Return (RTSR) options (fiscal 2009)
For RTSR options, the applicable performance hurdle is based on comparing the TSR growth of Telstra against other companies in the peer group. Telstra is then given a score to determine its rank in comparison to the peer group. The RTSR options vest only if Telstra achieves a rank of at least the 50th percentile.
The Board has the discretion to amend the members in the peer group, as well as make necessary adjustments to the calculation of the TSR amount, TSR growth or rank.
For RTSR options, there are three performance periods as follows:
• First performance period - 1 July 2008 to 30 June 2010;• Second performance period - 1 July 2008 to 30 June 2011; and• Third performance period - 1 July 2008 to 30 June 2012.
The result for each performance period is separately measured. If Telstra achieves a rank greater than or equal to the 50th percentile for the performance period, then:
• the number of TSR options that will vest for that performance period is scaled proportionately from the 50th percentile (at which 25% of the allocation becomes exercisable) to the 75th percentile (at which 100% of the allocation becomes exercisable); and
• 25% of any unvested options for that performance period will lapse.
If Telstra achieves a rank of less than the 50th percentile for the performance period, then none of the options allocated for that performance period will vest and 25% of the options will lapse.
In addition, for the third performance period, if Telstra's rank meets or exceeds:
• both the 50th percentile and the rank achieved in the first performance period, the remaining unvested options from the first performance period will vest; and/or
• both the 50th percentile and the rank achieved in the second performance period, the remaining unvested options from the second performance period will vest.
The number of additional unvested options which may vest is also determined by using a linear scale.
If Telstra achieves a rank of less than the 50th percentile for the third performance period, then no options will vest for the third performance period. Furthermore, any remaining unvested options which do not vest or lapse following the third performance period will lapse following the end of the third performance period.
27. Employee share plans (continued)
For
per
sona
l use
onl
y
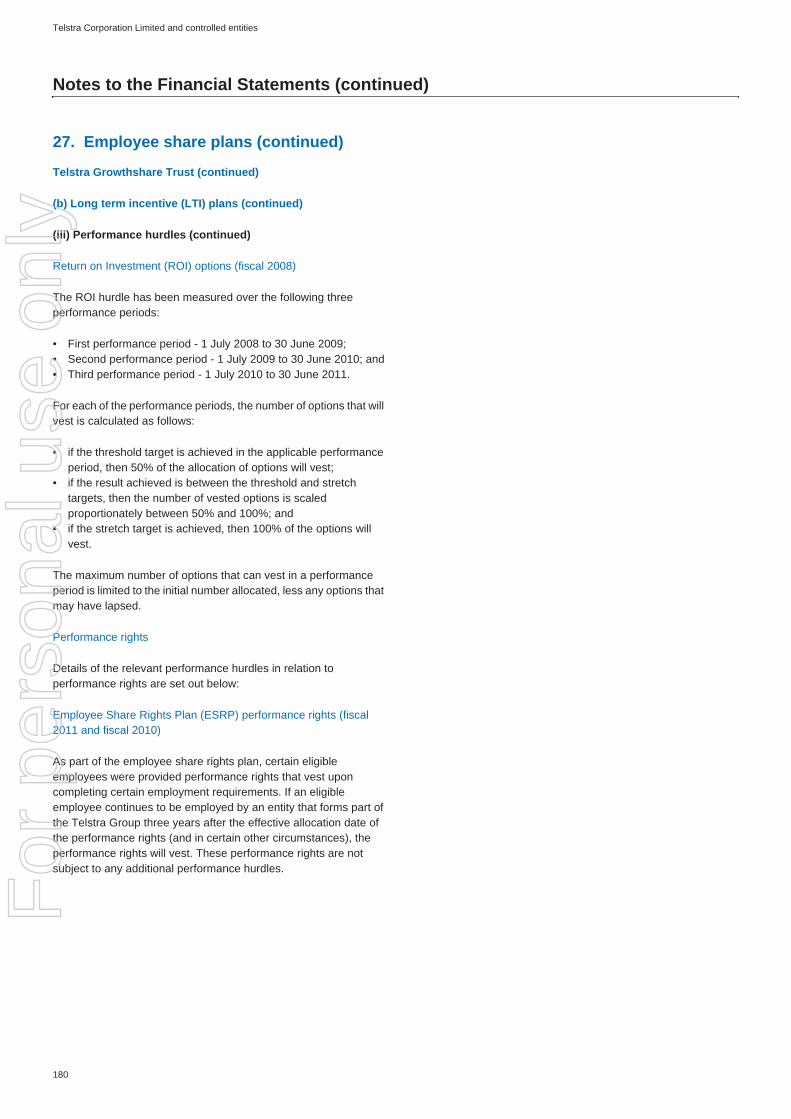
Telstra Corporation Limited and controlled entities
180
Notes to the Financial Statements (continued)
Telstra Growthshare Trust (continued)
(b) Long term incentive (LTI) plans (continued)
(iii) Performance hurdles (continued)
Return on Investment (ROI) options (fiscal 2008)
The ROI hurdle has been measured over the following three performance periods:
• First performance period - 1 July 2008 to 30 June 2009;• Second performance period - 1 July 2009 to 30 June 2010; and• Third performance period - 1 July 2010 to 30 June 2011.
For each of the performance periods, the number of options that will vest is calculated as follows:
• if the threshold target is achieved in the applicable performance period, then 50% of the allocation of options will vest;
• if the result achieved is between the threshold and stretch targets, then the number of vested options is scaled proportionately between 50% and 100%; and
• if the stretch target is achieved, then 100% of the options will vest.
The maximum number of options that can vest in a performance period is limited to the initial number allocated, less any options that may have lapsed.
Performance rights
Details of the relevant performance hurdles in relation to performance rights are set out below:
Employee Share Rights Plan (ESRP) performance rights (fiscal 2011 and fiscal 2010)
As part of the employee share rights plan, certain eligible employees were provided performance rights that vest upon completing certain employment requirements. If an eligible employee continues to be employed by an entity that forms part of the Telstra Group three years after the effective allocation date of the performance rights (and in certain other circumstances), the performance rights will vest. These performance rights are not subject to any additional performance hurdles.
27. Employee share plans (continued)
For
per
sona
l use
onl
y
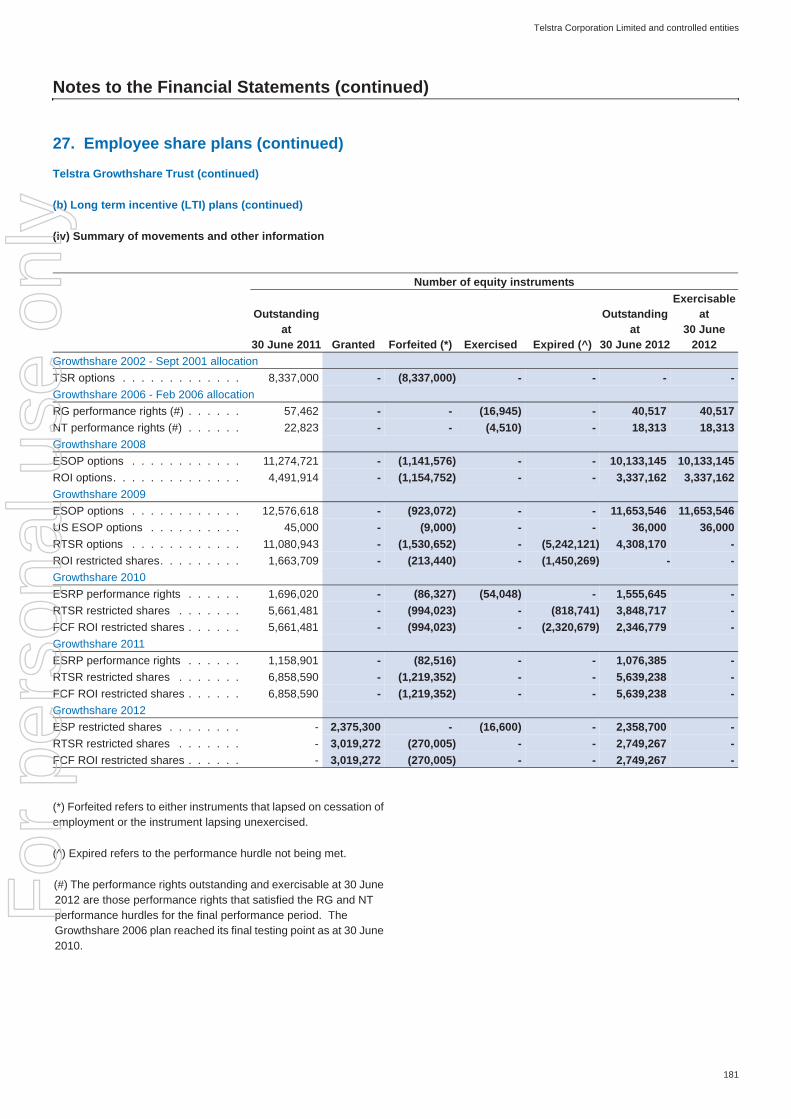
Telstra Corporation Limited and controlled entities
181
Notes to the Financial Statements (continued)
Telstra Growthshare Trust (continued)
(b) Long term incentive (LTI) plans (continued)
(iv) Summary of movements and other information
(*) Forfeited refers to either instruments that lapsed on cessation of employment or the instrument lapsing unexercised.
(^) Expired refers to the performance hurdle not being met.
(#) The performance rights outstanding and exercisable at 30 June 2012 are those performance rights that satisfied the RG and NT performance hurdles for the final performance period. The Growthshare 2006 plan reached its final testing point as at 30 June 2010.
27. Employee share plans (continued)
Number of equity instruments
Outstanding at
30 June 2011 Granted Forfeited (*) Exercised Expired (^)
Outstanding at
30 June 2012
Exercisable at
30 June 2012
Growthshare 2002 - Sept 2001 allocationTSR options . . . . . . . . . . . . . 8,337,000 - (8,337,000) - - - -Growthshare 2006 - Feb 2006 allocationRG performance rights (#) . . . . . . 57,462 - - (16,945) - 40,517 40,517NT performance rights (#) . . . . . . 22,823 - - (4,510) - 18,313 18,313Growthshare 2008ESOP options . . . . . . . . . . . . 11,274,721 - (1,141,576) - - 10,133,145 10,133,145ROI options. . . . . . . . . . . . . . 4,491,914 - (1,154,752) - - 3,337,162 3,337,162Growthshare 2009ESOP options . . . . . . . . . . . . 12,576,618 - (923,072) - - 11,653,546 11,653,546US ESOP options . . . . . . . . . . 45,000 - (9,000) - - 36,000 36,000RTSR options . . . . . . . . . . . . 11,080,943 - (1,530,652) - (5,242,121) 4,308,170 -ROI restricted shares. . . . . . . . . 1,663,709 - (213,440) - (1,450,269) - -Growthshare 2010ESRP performance rights . . . . . . 1,696,020 - (86,327) (54,048) - 1,555,645 -RTSR restricted shares . . . . . . . 5,661,481 - (994,023) - (818,741) 3,848,717 -FCF ROI restricted shares . . . . . . 5,661,481 - (994,023) - (2,320,679) 2,346,779 -Growthshare 2011ESRP performance rights . . . . . . 1,158,901 - (82,516) - - 1,076,385 -RTSR restricted shares . . . . . . . 6,858,590 - (1,219,352) - - 5,639,238 -FCF ROI restricted shares . . . . . . 6,858,590 - (1,219,352) - - 5,639,238 -Growthshare 2012ESP restricted shares . . . . . . . . - 2,375,300 - (16,600) - 2,358,700 -RTSR restricted shares . . . . . . . - 3,019,272 (270,005) - - 2,749,267 -FCF ROI restricted shares . . . . . . - 3,019,272 (270,005) - - 2,749,267 -
For
per
sona
l use
onl
y

Telstra Corporation Limited and controlled entities
182
Notes to the Financial Statements (continued)
Telstra Growthshare Trust (continued)
(b) Long term incentive (LTI) plans (continued)
(iv) Summary of movements and other information (continued)
(*) Forfeited refers to either instruments that lapsed on cessation of employment or the instrument lapsing unexercised.
(^) Expired refers to the performance hurdle not being met.
(#) The performance rights outstanding and exercisable at 30 June 2010 include those performance rights that satisfied the RG and NT performance hurdles for the final performance period.
27. Employee share plans (continued)
Number of equity instrumentsOutstanding
at 30 June 2010 Granted Forfeited (*) Exercised Expired (^)
Outstanding at
30 June 2011
Exercisable at
30 June 2011Growthshare 2002 - Sept 2001 allocationTSR options . . . . . . . . . . . . . 8,939,000 - (602,000) - - 8,337,000 8,337,000Growthshare 2006 - Feb 2006 allocationRG performance rights (#) . . . . . . 370,319 - - (312,857) - 57,462 57,462NT performance rights (#) . . . . . . 58,751 - - (35,928) - 22,823 22,823Growthshare 2008ESOP options . . . . . . . . . . . . 12,326,078 - (1,051,107) (250) - 11,274,721 11,274,721TSR options . . . . . . . . . . . . . 14,113,671 - (2,018,861) - (12,094,810) - -ROI options. . . . . . . . . . . . . . 10,357,760 - (1,027,940) - (4,837,906) 4,491,914 4,491,914Growthshare 2009ESOP options . . . . . . . . . . . . 14,051,102 - (1,474,325) (159) - 12,576,618 -US ESOP options . . . . . . . . . . 69,500 - (24,500) - - 45,000 -RTSR options . . . . . . . . . . . . 14,925,718 - (2,867,044) - (977,731) 11,080,943 -ROI restricted shares. . . . . . . . . 3,580,248 - (662,898) - (1,253,641) 1,663,709 -Growthshare 2010ESRP performance rights . . . . . . 1,944,862 - (218,619) (30,223) - 1,696,020 -RTSR restricted shares . . . . . . . 7,403,997 - (1,742,516) - - 5,661,481 -FCF ROI restricted shares . . . . . . 7,403,997 - (1,742,516) - - 5,661,481 -Growthshare 2011ESRP performance rights . . . . . . - 1,168,590 (9,689) - - 1,158,901 -RTSR restricted shares . . . . . . . - 7,147,682 (289,092) - - 6,858,590 -FCF ROI restricted shares . . . . . . - 7,147,682 (289,092) - - 6,858,590 -
For
per
sona
l use
onl
y

Telstra Corporation Limited and controlled entities
183
Notes to the Financial Statements (continued)
(b) Long term incentive (LTI) plans (continued)
(iv) Summary of movements and other information (continued)
(*) Options include RTSR, TSR, ROI, ESOP and US ESOP options. The options “exercised” includes those participants that have been made redundant and are then consequently entitled to the Telstra shares.
(^) Performance rights include TSR, RG, NT and ESRP performance rights.
(#) Restricted shares relate to RTSR, FCFROI ROI and ESP restricted shares.
(**) The fair value of these instruments is calculated using an option pricing model that takes into account various factors, including the exercise price and expected life of the instrument, the current price of the underlying share and its expected volatility, expected dividends, the risk-free rate for the expected life of the instrument, and the expected average volatility of Telstra’s peer group companies.
(^^)The weighted average share price for instruments exercised during fiscal 2011 was $2.58 for fiscal 2008 and fiscal 2009 ESOP allocation of options, and $2.76 for fiscal 2005 and fiscal 2010 allocation of performance rights respectively. These share prices were based on the closing market price on the exercise dates.
(##) The weighted average share price for instruments exercised during fiscal 2012 was $3.25 for the fiscal 2006 and fiscal 2009 allocation of performance rights, and $3.59 for fiscal 2012 allocation of ESP restricted shares respectively. These share prices were based on the closing market price on the exercise dates.
27. Employee share plans (continued)
Options (*) Performance rights (^) Restricted Shares (#)
Number
Weighted average fair
value (**) Number
Weighted average fair
value (**) Number
Weighted average fair
value (**)Outstanding as at 30 June 2010 . . . . . . 74,782,829 $0.45 2,373,932 $2.91 18,388,242 $2.01Granted. . . . . . . . . . . . . - - 1,168,590 $2.37 14,295,364 $1.75Forfeited . . . . . . . . . . . . (9,065,777) $0.39 (228,308) $2.86 (4,726,114) $1.95Exercised (^^) . . . . . . . . . (409) $0.35 (379,008) $3.16 - -Expired . . . . . . . . . . . . . (17,910,447) $0.50 - - (1,253,641) $2.83Outstanding as at 30 June 2011 . . . . . . 47,806,196 $0.45 2,935,206 $2.69 26,703,851 $1.84Granted. . . . . . . . . . . . . - - - - 8,413,844 $2.67Forfeited . . . . . . . . . . . . (13,096,052) $0.84 (168,843) $2.63 (5,180,200) $1.88Exercised (##) . . . . . . . . . - - (75,503) $2.97 (16,600) $3.36Expired . . . . . . . . . . . . . (5,242,121) $0.16 - - (4,589,689) $2.39Outstanding as at 30 June 2012 . . . . . . 29,468,023 $0.32 2,690,860 $2.66 25,331,206 $2.01
Exercisable as at 30 June 2012 . . . . . . 25,159,853 $0.35 58,830 $3.18 - -
For
per
sona
l use
onl
y

Telstra Corporation Limited and controlled entities
184
Notes to the Financial Statements (continued)
Telstra Growthshare Trust (continued)
(b) Long term incentive (LTI) plans (continued)
(v) Fair value of equity instruments granted
The fair value of LTI instruments granted during the financial year was calculated using a valuation technique that is consistent with the Black-Scholes methodology and utilises Monte Carlo simulations. The following weighted average assumptions were used in determining the valuation:
(*) The date the instruments become exercisable.
For fiscal 2012 LTI FCF ROI and RTSR restricted shares, the fair value has been measured at a grant date of 31 December 2011 and has been allocated over the period for which the service is received which commenced 1 July 2011.
The expected stock volatility is a measure of the amount by which the price is expected to fluctuate during a period. This was based on historical daily and weekly closing share prices.
The fair value of fiscal 2012 ESP restricted share is $3.36 based on the market value of Telstra shares at the allocation date of 19 April 2012 and has been allocated over the period for which the service is received which commenced 1 July 2011.
27. Employee share plans (continued)
Growthshare LTI FCF ROI
restricted shares
Growthshare LTI RTSR restricted
shares
Growthshare LTI FCF ROI
restricted shares
Growthshare LTI RTSR
restricted shares
Growthshare ESRP
performance rights
Dec 2011 Dec 2011 Feb 2011 Feb 2011 Feb 2011Share price . . . . . . . . . . . . . . . . . . . . $3.33 $3.33 $2.98 $2.98 $2.94Risk free rate . . . . . . . . . . . . . . . . . . . 3.13% 3.13% 5.27% 5.27% 5.28%Dividend yield . . . . . . . . . . . . . . . . . . 9.0% 9.0% 9.0% 9.0% 9.0%Expected stock volatility . . . . . . . . . . . . . 22% 22% 25% 25% 25%Expected life . . . . . . . . . . . . . . . . . . . (*) (*) (*) (*) (*)Expected rate of achievement of TSR performance hurdles . . . . . . . . . . . . . . . n/a 71% n/a 33% n/a
For
per
sona
l use
onl
y

Telstra Corporation Limited and controlled entities
185
Notes to the Financial Statements (continued)
Telstra Growthshare Trust (continued)
(c) Telstra Directshare and Ownshare
(i) Nature of Telstra Directshare and Ownshare
Telstra Directshare
As a result of the changes to tax laws governing employee share schemes, the Board determined that, from 1 July 2009, non-executive directors are no longer required to receive a minimum of 20% of their total remuneration as restricted Telstra shares, known as Directshare. Instead, the Board has decided to implement a policy to encourage non-executive directors to hold a total value equivalent to at least 50% of their total remuneration as Telstra shares.
The Directshare Plan, previously operated by the Company, has been cancelled with effect from August 2012 as it is no longer in use. Under the Directshare Plan, non-executive Directors could nominate to receive a percentage of their total remuneration package as Telstra shares (allocated to participating Directors at market price). As a result of its cancellation, no new grants may be made under the Directshare Plan. Existing grants under the plan will remain on foot and under the terms of the Directshare plan and the relevant trust deed will continue to apply to such grants.
The restriction period on Directshares already allocated continues until the earliest of:
• 10 years (2011: 10 years) from the date of allocation of the shares;
• the participating director is no longer a director of, or is no longer employed by, a company in the Telstra Group; and
• the Trustee determines that an ‘event’ under the terms of Directshare has occurred.
Telstra Ownshare
Certain eligible employees may, at their election, be provided part of their remuneration in Telstra shares. Shares are acquired by the trustee from time to time and allocated to these employees at the time their application is accepted. Although the trustee holds the shares in trust, the participant retains the beneficial interest in the shares (dividends, voting rights, bonuses or rights issues) until they are transferred at expiration of the restriction period.
The restriction period continues until the earliest of:
• three years from the date of allocation;• the participant ceases employment with the Telstra Group; and • the Board of Telstra determines that an ‘event’ has occurred.
At the end of the restriction period, the Ownshares will be transferred to the participant. The participant is not able to deal in the shares until this transfer has taken place.
(ii) Instruments granted during the financial year
The fair value of the instruments granted under the Directshare and Ownshare plans is determined by the remuneration foregone by the participant. On the grant of Directshares and Ownshares, the participants in the plans are not required to make any payment to the Telstra Entity. The 5 November 2010 grant of Ownshares relates to shares acquired through salary sacrifice by employees.
There were no shares granted during fiscal 2012 under the Directshare plan. For the Ownshare plan, the weighted average fair value of fully paid shares granted to executives as at 30 June 2012 was $3.15 (2011: $2.68) and the total fair value of shares granted was $553,637 (2011: $464,776).
27. Employee share plans (continued)
For
per
sona
l use
onl
y

Telstra Corporation Limited and controlled entities
186
Notes to the Financial Statements (continued)
Telstra Growthshare Trust (continued)
(c) Telstra Directshare and Ownshare (continued)
(iii) Summary of movements
The table below provides information about our Directshare and Ownshare plans:
(*) The number of Directshares granted is based on the monthly volume weighted average price of a Telstra share in the six months prior to allocation, in conjunction with the remuneration foregone. The number of Ownshares granted is based on the weighted average price of a Telstra share in the week ending on the day before the allocation date, in conjunction with the remuneration foregone.
(^) Directshares and Ownshares are not required to be exercised. The fully paid shares held by the Telstra Growthshare Trust relating to these instruments are transferred to the participants at the completion of the restriction period.
27. Employee share plans (continued)
Number of equity instrumentsOutstanding at 30 June
2010Granted
(*)Distributed
(^)
Outstanding at 30 June
2011Granted
(*)Distributed
(^)
Outstanding at 30 June
2012Directshares5 September 2003 allocation . . . . . . 9,525 - - 9,525 - - 9,52520 February 2004 allocation . . . . . . 10,233 - - 10,233 - - 10,23320 August 2004 allocation . . . . . . . 2,755 - - 2,755 - - 2,75519 February 2005 allocation . . . . . . 7,911 - - 7,911 - - 7,91119 August 2005 allocation . . . . . . . 5,248 - - 5,248 - - 5,24817 February 2006 allocation . . . . . . 8,230 - - 8,230 - - 8,23018 August 2006 allocation . . . . . . . 12,343 - - 12,343 - - 12,34323 February 2007 allocation . . . . . . 14,522 - - 14,522 - - 14,52217 August 2007 allocation . . . . . . . 15,343 - - 15,343 - - 15,34329 February 2008 allocation . . . . . . 24,968 - - 24,968 - - 24,96821 August 2008 allocation . . . . . . . 36,358 - - 36,358 - (2,909) 33,4496 March 2009 allocation . . . . . . . . 63,181 - - 63,181 - (6,122) 57,05921 August 2009 allocation . . . . . . . 6,313 - - 6,313 - - 6,31319 February 2010 allocation . . . . . . 6,809 - - 6,809 - - 6,809
223,739 - - 223,739 - (9,031) 214,708
Ownshares27 September 2007 allocation 320,428 - (320,428) - - - -26 October 2007 allocation 123,353 - (123,353) - - - -15 September 2008 allocation . . . . . 353,317 - (37,576) 315,741 - (315,741) -24 October 2008 allocation. . . . . . . 192,965 - (3,119) 189,846 - (189,846) -24 December 2009 allocation . . . . . 129,650 - (5,432) 124,218 - (14,096) 110,1225 November 2010 allocation . . . . . . - 173,424 (2,760) 170,664 - (24,599) 146,06521 October 2011 allocation . . . . . . . - - - - 175,836 - 175,836
1,119,713 173,424 (492,668) 800,469 175,836 (544,282) 432,023
For
per
sona
l use
onl
y
Telstra Corporation Limited and controlled entities
187
Notes to the Financial Statements (continued)
(d) Other equity plans
In exceptional circumstances, Telstra has put in place structured retention incentive plans. These are designed to protect Telstra from the loss of employees who possess specific skill sets considered critical to the business and where Telstra is vulnerable to losing key personnel. Such retention plans are not restricted to senior executives. The plans are granted on ad hoc basis and the participants receive Telstra shares deferred for a certain amount of period.
As part of his Service Agreement negotiated upon appointment, the CFO and GMD of Finance and Strategy was allocated 96,500 performance rights to Telstra shares where 50 percent vest after two years and the remaining 50 percent vest after three years from the date of commencement. Vesting is subject to an assessment of performance by the Board and forfeited in the event of resignation before vesting. In the event of redundancy or termination of employment for no reason, a pro rata entitlement of the performance rights as at the time of cessation of employment becomes available.
TESOP99 and TESOP97
As part of the Commonwealth’s sale of its shareholding in fiscal 2000 and fiscal 1998, we offered eligible employees the opportunity to buy ordinary shares of Telstra. These share plans were:
• the Telstra Employee Share Ownership Plan II (TESOP99); and • the Telstra Employee Share Ownership Plan (TESOP97).
Although the Telstra ESOP Trustee Pty Ltd (wholly owned subsidiary of Telstra) is the trustee for TESOP99 and TESOP97 and holds the shares in the trust, the participating employee retains the beneficial interest in the shares (dividends and voting rights).
Generally, employees were offered interest free loans by the Telstra Entity to acquire certain shares, and in some cases became entitled to certain extra shares and loyalty shares as a result of participating in the plans. All shares acquired under the plans were transferred from the Commonwealth either to the employees or to the trustee for the benefit of the employees.
While a participant remains an employee of the Telstra Entity, a company in which Telstra owns greater than 50% equity, or the company which was their employer when the shares were acquired, there is no date by which the employee has to repay the loan. The loan may, however, be repaid in full at any time by the employee using his or her own funds.
The loan shares, extra shares and in the case of TESOP99, the loyalty shares, were subject to a restriction on the sale of the shares or transfer to the employee for three years, or until the relevant employment ceased. This restriction period has now been fulfilled under each plan.
If a participant ceases to be employed by the Telstra Entity, a company in which Telstra owns greater than 50% equity, or the company which was their employer when the shares were acquired, the employee must repay their loan within two months of leaving to acquire the relevant shares. This is the case except where the restriction period has ended because of the employee’s death or disablement (in this case the loan must be repaid within 12 months).
If the employee does not repay the loan when required, the trustee can sell the shares. The sale proceeds must then be used to pay the costs of the sale and any amount outstanding on the loan, after which the balance will be paid to the employee. The Telstra Entity’s recourse under the loan is limited to the amount recoverable through the sale of the employee’s shares.
27. Employee share plans (continued)
For
per
sona
l use
onl
y

Telstra Corporation Limited and controlled entities
188
Notes to the Financial Statements (continued)
TESOP99 and TESOP97 (continued)
The Telstra ESOP Trustee continues to hold the loan shares where the employee has ceased employment and elected not to repay the loan, until the share price is sufficient to recover the loan amount and associated costs. The Trustee will then sell the shares. As at 30 June 2012, there were 9,204,900 shares held for this purpose (2011: 8,999,600).
The following table provides information about our TESOP99 and TESOP97 share plans:
(*) The fair value of these shares is based on the market value of Telstra shares at reporting date and exercise date.
(#) The amount exercised relates to the shares released from trust as a result of the interest free loan to employees being fully repaid during the year.
The employee share loan balance as at 30 June 2012 is $67 million (2011: $70 million). The weighted average loan still to be repaid for TESOP97 is $0.14 per instrument (2011: $0.10) and for TESOP99 is $4.85 per instrument (2011: $5.06).
27. Employee share plans (continued)
TESOP97 TESOP99
Number
Weighted average
fair value (*)
Total fair value$m Number
Weighted average
fair value (*)
Total fair value
$m
Equity instruments outstanding and exercisable as at 30 June 2010 . . . . . . . . . . . . . . . . . . . . . . . 23,382,125 $3.25 76 13,842,600 $3.25 45Exercised (#) . . . . . . . . . . . . . . . . . . . . . . . . (23,367,125) $2.68 (63) (53,600) $2.68 -Equity instruments outstanding and exercisable as at 30 June 2011. . . . . . . . . . . . . . . . . . . . . . . . 15,000 $2.89 - 13,789,000 $2.89 40Exercised (#) . . . . . . . . . . . . . . . . . . . . . . . . (12,500) $3.10 - (34,600) $3.15 -Equity instruments outstanding and exercisable as at 30 June 2012 . . . . . . . . . . . . . . . . . . . . . . . 2,500 $3.69 - 13,754,400 $3.69 51
For
per
sona
l use
onl
y
Telstra Corporation Limited and controlled entities
189
Notes to the Financial Statements (continued)
In accordance with AASB 124: “Related Party Disclosures”, key management personnel (KMP) have authority and responsibility for planning, directing and controlling the activities of the Telstra Group. As such, KMP are deemed to include the following:
• the non-executive Directors of the Telstra Entity; and• certain executives in the Chief Executive Officer’s (CEO’s) senior
leadership team, including the CEO, referred to as a ‘senior executive’ in this note.
Directors
During fiscal 2012 and fiscal 2011, the Directors of the Telstra Entity were:
Senior executives
The senior executives that qualified as KMP for fiscal 2012 and fiscal 2011 were:
28. Key management personnel compensation
Name Position
Current DirectorsCatherine B Livingstone Chairman, Non-Executive DirectorDavid I Thodey Executive Director and Chief Executive OfficerTimothy Y Chen Non-Executive Director (KMP effective from 1 April 2012)Geoffrey A Cousins Non-Executive DirectorRussell A Higgins Non-Executive Director John P Mullen Non-Executive Director Nora L Scheinkestel Non-Executive DirectorMargaret L Seale Non-Executive Director (KMP effective from 7 May 2012)John W Stocker Non-Executive DirectorSteven M Vamos Non-Executive DirectorJohn D Zeglis Non-Executive Director
Former DirectorsJohn V Stanhope, retired as Executive Director, Chief Financial Officer and Group Managing Director, Finance on 30 December 2011.John M Stewart, resigned as Non-Executive Director on 18 October 2011.
Name Position
Current Senior ExecutivesDavid I Thodey Executive Director and Chief Executive OfficerGordon Ballantyne Chief Customer Officer and Group Managing Director, Telstra Customer Sales and ServiceRick Ellis Group Managing Director, Telstra Media (KMP effective from 16 January 2012)Stuart Lee Group Managing Director, Telstra Wholesale (KMP effective from 6 July 2011)Kate McKenzie Group Managing Director, Telstra Innovation Products and MarketingAndrew Penn Chief Financial Officer and Group Managing Director, Finance and Strategy (KMP effective from 31
December 2011)Brendon Riley Chief Operations Officer, Telstra Operations
Former Senior ExecutivesJohn V Stanhope, retired as Executive Director, Chief Financial Officer and Group Managing Director, Finance on 30 December 2011. Bruce Akhurst, Chief Executive Officer, Sensis ceased being a KMP on 15 January 2012.Paul Geason, Group Managing Director, Telstra Enterprise and Government ceased being a KMP in fiscal 2012. Deena Shiff, former Group Managing Director, Telstra Business ceased being a KMP in fiscal 2012. Deena Shiff is currently Group Managing Director, Telstra Applications and Ventures.
For
per
sona
l use
onl
y

Telstra Corporation Limited and controlled entities
190
Notes to the Financial Statements (continued)
KMP aggregate compensation
During fiscal 2012 and fiscal 2011, the aggregate compensation provided to our KMP was:
We have made the detailed remuneration disclosures in the Remuneration Report which is part of the Directors’ Report. Please refer to the Remuneration Report for further details.
Other transactions with our KMP and their related entities
Our KMP have telecommunications services transactions with the Telstra Group, which are not significant and are both trivial and domestic in nature. The KMP related entities also have telecommunications services with us on normal commercial terms and conditions.
Our KMP are provided with telecommunications and other services and equipment to assist them in performing their duties. From time to time, we also make products and services available to our KMP without charge to enable them to familiarise themselves with our products, services and recent technological developments. To the extent it is considered a benefit to a KMP, it is included in their compensation.
We have provided loans to eligible employees, including our KMP, to enable purchase of Telstra shares through TESOP97 and TESOP99. Refer to note 27 for further details.
28. Key management personnel compensation (continued)
Telstra GroupAs at 30 June
2012 2011$ $
Short term employee benefits . . . . . . . . . . . . . . . . . . . . . . . . . . . . . . . . . . . . . . . . . 20,104,442 20,361,213Post employment benefits . . . . . . . . . . . . . . . . . . . . . . . . . . . . . . . . . . . . . . . . . . . 418,627 918,178Other long term benefits . . . . . . . . . . . . . . . . . . . . . . . . . . . . . . . . . . . . . . . . . . . . 226,353 257,529Termination benefits . . . . . . . . . . . . . . . . . . . . . . . . . . . . . . . . . . . . . . . . . . . . . . 744,751 1,700,353Share-based payments. . . . . . . . . . . . . . . . . . . . . . . . . . . . . . . . . . . . . . . . . . . . . 6,318,874 4,558,079
27,813,047 27,795,352
For
per
sona
l use
onl
y

Telstra Corporation Limited and controlled entities
191
Notes to the Financial Statements (continued)
KMP interests in shares of the Telstra Entity
During fiscal 2012, our KMP and their related entities held share capital of the Telstra Entity directly, indirectly or beneficially as follows:
Total shareholdings include shares held by our KMP and their related entities. Unless related to our employee share plans, shares acquired or disposed by our KMP during fiscal 2012 were on an arm’s length basis at market price.
(a) For those non-executive Directors and senior executives who qualified as KMP during the year, represents shares held as at the date they became KMP.
(b) For those non-executive Directors and senior executives who left Telstra during the year, represents shares held as at the date they retired or no longer qualified as KMP.
(c) Nominally refers to shares held either indirectly or beneficially. This includes those acquired under Directshare as well as certain incentive shares issued to our KMP that vest immediately. These shares are subject to a restriction period, such that the non-executive Director or senior executive is restricted from dealing with the shares until after they are released from the restriction period. Refer to note 27 for further details.
28. Key management personnel compensation (continued)
Total shares held at
30 June 2011 Directshare allocation
Equity instruments exercised
Net shares acquired or disposed of
by other means
Total shares held at
30 June 2012
Shares that are held
nominally (c)Number Number Number Number Number Number
Non-Executive DirectorsCatherine B Livingstone . . . . . . . . . . . . 150,816 - - 15,000 165,816 165,816Timothy Y Chen (a). . . . . . . . . . . . . . . - - - - - -Geoffrey A Cousins. . . . . . . . . . . . . . . 31,765 - - - 31,765 21,765Russell A Higgins. . . . . . . . . . . . . . . . 40,513 - - 47,891 88,404 83,084John P Mullen . . . . . . . . . . . . . . . . . 26,159 - - - 26,159 26,159Nora L Scheinkestel . . . . . . . . . . . . . . 30,000 - - 29,450 59,450 59,450Margaret L Seale (a) . . . . . . . . . . . . . . 224,141 - - - 224,141 224,141John W Stocker . . . . . . . . . . . . . . . . 212,238 - - - 212,238 194,124Steven M Vamos . . . . . . . . . . . . . . . . 40,000 - - - 40,000 40,000John D Zeglis. . . . . . . . . . . . . . . . . . 103,993 - - - 103,993 37,493John M Stewart (b) . . . . . . . . . . . . . . . 34,031 - - - 34,031 9,031
893,656 - - 92,341 985,997 861,063
Senior ExecutivesDavid I Thodey . . . . . . . . . . . . . . . . . 605,113 - - 181,004 786,117 667,594Gordon Ballantyne . . . . . . . . . . . . . . . - - - 86,568 86,568 86,568Rick Ellis (a) . . . . . . . . . . . . . . . . . . 10,000 - - - 10,000 8,000Stuart Lee (a). . . . . . . . . . . . . . . . . . 214,087 - - 51,416 265,503 149,443Kate McKenzie . . . . . . . . . . . . . . . . . 117,710 - - 49,988 167,698 122,009Andrew Penn (a) . . . . . . . . . . . . . . . . - - - 74,232 74,232 58,800Brendon Riley . . . . . . . . . . . . . . . . . 5,735 - - 177,682 183,417 179,387Bruce Akhurst (b). . . . . . . . . . . . . . . . 177,306 - - 94,330 271,636 263,856John V Stanhope (b) . . . . . . . . . . . . . . 446,545 - - 3,383 449,928 7,410
1,576,496 - - 718,603 2,295,099 1,543,0672,470,152 - - 810,944 3,281,096 2,404,130
For
per
sona
l use
onl
y
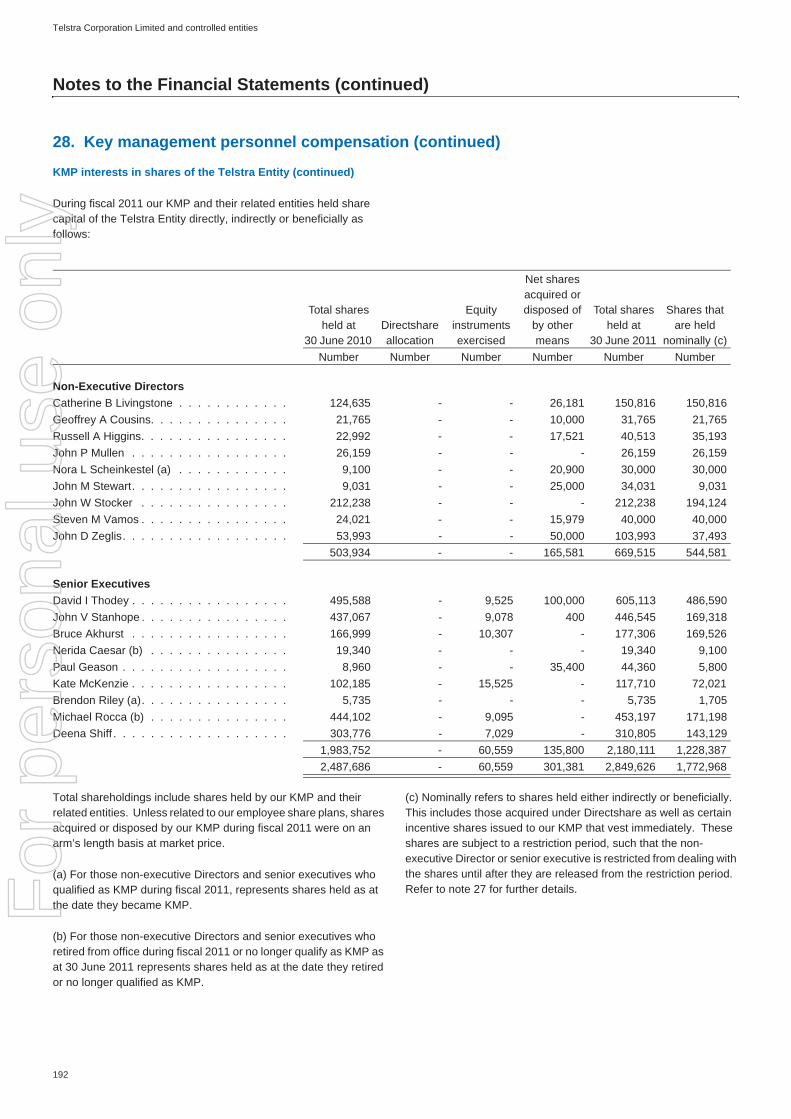
Telstra Corporation Limited and controlled entities
192
Notes to the Financial Statements (continued)
KMP interests in shares of the Telstra Entity (continued)
During fiscal 2011 our KMP and their related entities held share capital of the Telstra Entity directly, indirectly or beneficially as follows:
Total shareholdings include shares held by our KMP and their related entities. Unless related to our employee share plans, shares acquired or disposed by our KMP during fiscal 2011 were on an arm’s length basis at market price.
(a) For those non-executive Directors and senior executives who qualified as KMP during fiscal 2011, represents shares held as at the date they became KMP.
(b) For those non-executive Directors and senior executives who retired from office during fiscal 2011 or no longer qualify as KMP as at 30 June 2011 represents shares held as at the date they retired or no longer qualified as KMP.
(c) Nominally refers to shares held either indirectly or beneficially. This includes those acquired under Directshare as well as certain incentive shares issued to our KMP that vest immediately. These shares are subject to a restriction period, such that the non-executive Director or senior executive is restricted from dealing with the shares until after they are released from the restriction period. Refer to note 27 for further details.
28. Key management personnel compensation (continued)
Total shares held at
30 June 2010 Directshare allocation
Equity instruments exercised
Net shares acquired or disposed of
by other means
Total shares held at
30 June 2011
Shares that are held
nominally (c)Number Number Number Number Number Number
Non-Executive DirectorsCatherine B Livingstone . . . . . . . . . . . . 124,635 - - 26,181 150,816 150,816Geoffrey A Cousins. . . . . . . . . . . . . . . 21,765 - - 10,000 31,765 21,765Russell A Higgins. . . . . . . . . . . . . . . . 22,992 - - 17,521 40,513 35,193John P Mullen . . . . . . . . . . . . . . . . . 26,159 - - - 26,159 26,159Nora L Scheinkestel (a) . . . . . . . . . . . . 9,100 - - 20,900 30,000 30,000John M Stewart. . . . . . . . . . . . . . . . . 9,031 - - 25,000 34,031 9,031John W Stocker . . . . . . . . . . . . . . . . 212,238 - - - 212,238 194,124Steven M Vamos . . . . . . . . . . . . . . . . 24,021 - - 15,979 40,000 40,000John D Zeglis. . . . . . . . . . . . . . . . . . 53,993 - - 50,000 103,993 37,493
503,934 - - 165,581 669,515 544,581
Senior ExecutivesDavid I Thodey . . . . . . . . . . . . . . . . . 495,588 - 9,525 100,000 605,113 486,590John V Stanhope . . . . . . . . . . . . . . . . 437,067 - 9,078 400 446,545 169,318Bruce Akhurst . . . . . . . . . . . . . . . . . 166,999 - 10,307 - 177,306 169,526Nerida Caesar (b) . . . . . . . . . . . . . . . 19,340 - - - 19,340 9,100Paul Geason . . . . . . . . . . . . . . . . . . 8,960 - - 35,400 44,360 5,800Kate McKenzie . . . . . . . . . . . . . . . . . 102,185 - 15,525 - 117,710 72,021Brendon Riley (a). . . . . . . . . . . . . . . . 5,735 - - - 5,735 1,705Michael Rocca (b) . . . . . . . . . . . . . . . 444,102 - 9,095 - 453,197 171,198Deena Shiff . . . . . . . . . . . . . . . . . . . 303,776 - 7,029 - 310,805 143,129
1,983,752 - 60,559 135,800 2,180,111 1,228,3872,487,686 - 60,559 301,381 2,849,626 1,772,968
For
per
sona
l use
onl
y

Telstra Corporation Limited and controlled entities
193
Notes to the Financial Statements (continued)
KMP interests in rights, options and restricted shares of the Telstra Entity
The following details the balances and changes in instruments issued for our KMP during fiscal 2012:
(*) Each vested equity instrument is convertible into one ordinary share.
(a) For those senior executives who qualified as KMP during the year, represents equity instruments held as at the date they retired or no longer qualify as KMP.
(b) During fiscal 2012, other changes for our performance rights, options and restricted shares are a result of instruments expiring due to the specified performance hurdles not being achieved or instruments forfeiting due to KMP retiring during the year.
(c) For those senior executives who left Telstra during the year, represents equity instruments held as at the date they retired or no longer qualify as KMP.
(d) Excludes incentive shares that vest immediately and are beneficially owned by the KMP. “Granted” for incentive shares rights relate to additional incentive shares provided to our senior executives. Any dividends paid by the Company prior to the exercise of their incentive shares will increase the number of Telstra shares allocated to the senior executives when the vested incentive shares are exercised. Refer to note 27 for further details.
28. Key management personnel compensation (continued)
Instrument type (*)
Total held at 30 June
2011 (a)
Granted during the
year
Exercised during the
yearOther
changes (b)
Total held at 30 June 2012 (c)(d)
Vested as at 30 June
2012 (c)
Vested and exercisable at 30 June
2012 (c)Senior Executive Number Number Number Number Number Number Number
OptionsDavid I Thodey . . . . . . . . . . . . . . . 1,535,305 - - (945,141) 590,164 590,164 252,174Stuart Lee . . . . . . . . . . . . . . . . . 393,751 - - (274,076) 119,675 119,675 48,913Kate McKenzie . . . . . . . . . . . . . . . 377,304 - - (156,964) 220,340 220,340 91,304Bruce Akhurst . . . . . . . . . . . . . . . 1,695,687 - - (617,000) 1,078,687 1,078,687 271,739John V Stanhope . . . . . . . . . . . . . . 1,035,137 - - (1,035,137) - - -Restricted sharesDavid I Thodey . . . . . . . . . . . . . . . 2,566,575 1,567,846 - (485,369) 3,649,052 725,274 -Rick Ellis . . . . . . . . . . . . . . . . . . - 225,080 - - 225,080 - -Stuart Lee . . . . . . . . . . . . . . . . . 526,890 - - (88,779) 438,111 126,923 -Kate McKenzie . . . . . . . . . . . . . . . 633,667 488,746 - (140,738) 981,675 190,385 -Brendon Riley . . . . . . . . . . . . . . . - 643,086 - - 643,086 - -Bruce Akhurst . . . . . . . . . . . . . . . 1,565,313 700,552 - - 2,265,865 - -John V Stanhope . . . . . . . . . . . . . . 1,621,538 - - (1,621,538) - - -Performance sharesAndrew Penn . . . . . . . . . . . . . . . . - 96,500 - - 96,500 - -TESOP99Stuart Lee . . . . . . . . . . . . . . . . . 400 - - - 400 400 400Bruce Akhurst . . . . . . . . . . . . . . . 400 - - - 400 400 400John V Stanhope . . . . . . . . . . . . . . 400 - - - 400 400 400
For
per
sona
l use
onl
y

Telstra Corporation Limited and controlled entities
194
Notes to the Financial Statements (continued)
KMP interests in rights, options and restricted shares of the Telstra Entity (continued)
The following details the balances and changes in instruments issued for our KMP during fiscal 2011:
28. Key management personnel compensation (continued)
Instrument type (*)
Total held at 30 June 2010 (a)
Granted during the
year
Exercised during the
yearOther
changes (b)
Total held at 30 June 2011 (c)
Vested as at 30 June 2011 (c)
Vested and exercisable at 30 June 2011 (c)
Senior Executive Number Number Number Number Number Number Number
Performance rightsDavid I Thodey . . . . . . . . . . . . . . . 9,525 - (9,525) - - - -John V Stanhope . . . . . . . . . . . . . . 9,078 - (9,078) - - - -Bruce Akhurst . . . . . . . . . . . . . . . 10,307 - (10,307) - - - -Kate McKenzie . . . . . . . . . . . . . . . 15,007 - (15,007) - - - -Michael Rocca . . . . . . . . . . . . . . . 9,095 - (9,095) - - - -Deena Shiff . . . . . . . . . . . . . . . . . 7,029 - (7,029) - - - -OptionsDavid I Thodey . . . . . . . . . . . . . . . 2,778,217 - - (1,242,912) 1,535,305 786,174 786,174John V Stanhope . . . . . . . . . . . . . . 2,020,885 - - (985,748) 1,035,137 440,998 440,998Bruce Akhurst . . . . . . . . . . . . . . . 3,035,004 - - (1,339,317) 1,695,687 888,739 888,739Nerida Caesar . . . . . . . . . . . . . . . 335,467 - - - 335,467 37,565 37,565Paul Geason . . . . . . . . . . . . . . . . 300,580 - - (135,234) 165,346 81,392 81,392Kate McKenzie . . . . . . . . . . . . . . . 828,627 - - (451,323) 377,304 91,304 91,304Michael Rocca . . . . . . . . . . . . . . . 2,486,864 - - - 2,486,864 511,999 262,000Deena Shiff . . . . . . . . . . . . . . . . . 2,034,343 - - (1,019,394) 1,014,949 384,522 384,522Restricted sharesDavid I Thodey . . . . . . . . . . . . . . . 1,294,450 1,355,932 - (83,807) 2,566,575 - -John V Stanhope . . . . . . . . . . . . . . 913,334 774,672 - (66,468) 1,621,538 - -Bruce Akhurst . . . . . . . . . . . . . . . . . 931,520 724,068 - (90,275) 1,565,313 - -Nerida Caesar . . . . . . . . . . . . . . . 468,967 - - - 468,967 - -Paul Geason . . . . . . . . . . . . . . . . 236,201 242,924 - (9,392) 469,733 - -Kate McKenzie . . . . . . . . . . . . . . . 363,118 302,544 - (31,995) 633,667 - -Michael Rocca . . . . . . . . . . . . . . . 857,327 - - - 857,327 - -Deena Shiff . . . . . . . . . . . . . . . . . 727,751 575,390 - (70,528) 1,232,613 - -
For
per
sona
l use
onl
y

Telstra Corporation Limited and controlled entities
195
Notes to the Financial Statements (continued)
KMP interests in rights, options and restricted shares of the Telstra Entity (continued)
(*) Each vested equity instrument is convertible into one ordinary share.
(a) For those senior executives who qualified as KMP during the year, represents equity instruments held as at the date they became KMP.
(b) During fiscal 2011, other changes for our performance rights, options and restricted shares are a result of instruments expiring due to the specified performance hurdles not being achieved or instruments forfeiting due to KMP retiring during the year. For TESOP97, the shares were released from trust as a result of the interest free loans being fully repaid during fiscal 2011.
(c) For those senior executives who left Telstra during the year, represents equity instruments held as at the date they resigned.
(d) Excludes incentive shares that vest immediately and are beneficially owned by the KMP. “Granted” for incentive shares rights relate to additional incentive shares provided to our senior executives. Any dividends paid by the Company prior to the exercise of their incentive shares will increase the number of Telstra shares allocated to the senior executives when the vested incentive shares are exercised. Refer to note 27 for further details.
28. Key management personnel compensation (continued)
Instrument type (*)
Total held at 30 June 2010 (a)
Granted during the
year
Exercised during the
yearOther
changes (b)
Total held at 30 June 2011 (c)(d)
Vested as at 30 June 2011 (c)
Vested and exercisable at 30 June 2011 (c)
Senior Executive Number Number Number Number Number Number Number
Incentive shares rights (d)Kate McKenzie . . . . . . . . . . . . . . . 518 - (518) - - - -TESOP97John V Stanhope . . . . . . . . . . . . . . 2,500 - - (2,500) - - -Bruce Akhurst . . . . . . . . . . . . . . . 2,500 - - (2,500) - - -Michael Rocca . . . . . . . . . . . . . . . 2,500 - - (2,500) - - -TESOP99John V Stanhope . . . . . . . . . . . . . . 400 - - - 400 400 400Bruce Akhurst . . . . . . . . . . . . . . . 400 - - - 400 400 400Deena Shiff . . . . . . . . . . . . . . . . . 400 - - - 400 400 400
For
per
sona
l use
onl
y

Telstra Corporation Limited and controlled entities
196
Notes to the Financial Statements (continued)
Transactions involving our controlled entities
Interests in controlled entities are set out in note 25. Our transactions with our controlled entities recorded in the income statement and statement of financial position are as follows:
(a) The Telstra Entity sold and purchased goods and services and received and paid interest to its controlled entities. These transactions are in the ordinary course of business and are on normal commercial terms and conditions.
Details of our individual significant transactions involving our controlled entities during fiscal 2012 are detailed as follows:
• the Telstra Entity received procurement fees from its controlled entity Sensis Pty Ltd for the use of Yellow Pages and White Pages trademarks amounting to $355 million (2011: $522 million). As at 30 June 2012, the Telstra Entity recorded revenue received in advance amounting to $90 million (2011: $170 million) for the use of these trademarks;
• the Telstra Entity received income from its controlled entity Telstra Multimedia Pty Ltd amounting to $356 million (2011: $347 million) for access to ducts that store the hybrid fibre coaxial (HFC) cable network;
• the Telstra Entity paid management fees to its controlled entity Sensis Pty Ltd amounting to $334 million (2011: $338 million) for
undertaking agency and contract management services for the national directory service; and
• the Telstra Entity paid for international connectivity and management services to Telstra International Limited amounting to $136 million (2011: nil).
(b) During fiscal 2012 the Telstra Entity recorded dividend revenue mainly from the following entities:
• $550 million (2011: nil) from Sensis Pty Ltd;• $50 million (2011: $70 million) from Telstra Media Pty Limited;• $64 million (2011: $41 million) from Telstra Holdings Pty Ltd; and• nil (2011: $43 million) from Telstra Business Systems Pty Ltd.
(c) The profit before income tax expense of the Telstra Entity includes an impairment loss of $175 million (2011: $108 million) relating to a movement in allowance for amounts owed by a controlled entity.
29. Related party disclosures
Telstra EntityYear ended/As at
30 June2012 2011
$m $m
Income from controlled entities:Sale of goods and services (a) . . . . . . . . . . . . . . . . . . . . . . . . . . . . . . . . . . . . . . . . 892 991Dividend revenue (b) . . . . . . . . . . . . . . . . . . . . . . . . . . . . . . . . . . . . . . . . . . . . . 668 164
Expenses to controlled entities:Purchase of goods and services (a) . . . . . . . . . . . . . . . . . . . . . . . . . . . . . . . . . . . . . 602 433Finance costs. . . . . . . . . . . . . . . . . . . . . . . . . . . . . . . . . . . . . . . . . . . . . . . . . 33 24
Total amounts receivable at 30 June from:CurrentControlled entities - receivables (a)(d) . . . . . . . . . . . . . . . . . . . . . . . . . . . . . . . . . . . . 985 788Controlled entities - loans (e)(f) . . . . . . . . . . . . . . . . . . . . . . . . . . . . . . . . . . . . . . . 3,331 3,147Allowance for amounts owed by controlled entities . . . . . . . . . . . . . . . . . . . . . . . . . . . . . (2,948) (2,773)
1,368 1,162Non currentControlled entities - loans (g). . . . . . . . . . . . . . . . . . . . . . . . . . . . . . . . . . . . . . . . . 1 -
Movement in allowance for amounts owed by controlled entities:Opening balance . . . . . . . . . . . . . . . . . . . . . . . . . . . . . . . . . . . . . . . . . . . . . . . (2,773) (2,665)Impairment loss (c) . . . . . . . . . . . . . . . . . . . . . . . . . . . . . . . . . . . . . . . . . . . . . . (175) (108)Closing balance . . . . . . . . . . . . . . . . . . . . . . . . . . . . . . . . . . . . . . . . . . . . . . . (2,948) (2,773)
Total amounts payable at 30 June to:CurrentControlled entities - payables (a)(d) . . . . . . . . . . . . . . . . . . . . . . . . . . . . . . . . . . . . . 214 217Controlled entities - loans (e)(h) . . . . . . . . . . . . . . . . . . . . . . . . . . . . . . . . . . . . . . . 1,492 1,832
1,706 2,049
For
per
sona
l use
onl
y

Telstra Corporation Limited and controlled entities
197
Notes to the Financial Statements (continued)
(
Transactions involving our controlled entities (continued)
(d) The Telstra Entity and its Australian controlled entities have formed a tax consolidated group, with a tax funding arrangement currently in place. The amounts receivable or amounts payable to the Telstra Entity under this arrangement are due in the next financial year upon final settlement of the current tax payable for the tax consolidated group. Refer to note 9 for further details.
(e) The Telstra Entity operates a current account with some of its Australian controlled entities, being an internal group bank account used to settle transactions with its controlled entities or between two controlled entities. Cash deposit balances in the current account owed to our controlled entities are recorded as loans. All loan balances with our controlled entities are unsecured, with settlement required in cash. As at 30 June 2012, $3,181 million (2011: $2,978 million) related to loans owed by, and $1,258 million (2011: $1,832 million) related to, loans payable to controlled entities. We also have an allowance for amounts owed by controlled entities of $2,948 million (2011: $2,773 million) as at 30 June 2012.
(f) At 30 June 2012, $150 million (2011: $169 million) related to a loan provided to Telstra OnAir Holdings Pty Ltd (a partner in the 3GIS Partnership). Telstra and Vodafone Hutchison Australia will conclude their joint venture agreement for the 3GIS network on 31 August 2012. Refer to note 26 for further details. This loan has been provided to ensure committed deferred consideration payments and funding calls from the 3GIS Partnership can be met. The loan is an interest free loan.
(g) At 30 June 2012, $1 million (2011: nil) related to a loan provided to Life Events Media Pty Limited. The loan is interest bearing and matures in March 2014.
(h) At 30 June 2012, Telstra Entity received a $234 million (2011: nil) loan from TelstraClear Limited. The loan is interest bearing and repayable in June 2013. The loan will be extinguished via a pre completion dividend upon the sale of TelstraClear.
Transactions involving our jointly controlled and associated entities
Interests in our jointly controlled and associated entities are set out in note 26. Our transactions with our jointly controlled and associated entities recorded in the income statement and statement of financial position are as follows:
29. Related party disclosures (continued)
Telstra GroupYear ended/As at
30 June2012 2011
$m $m
Income from jointly controlled and associated entities:Sale of goods and services (a) . . . . . . . . . . . . . . . . . . . . . . . . . . . . . . . . . . . . . . . . 139 197Distribution from FOXTEL Partnership (b) . . . . . . . . . . . . . . . . . . . . . . . . . . . . . . . . . . 108 70Interest on loans to jointly controlled and associated entities (c). . . . . . . . . . . . . . . . . . . . . . . 12 -
Expenses to jointly controlled and associated entities:Purchase of goods and services (a) . . . . . . . . . . . . . . . . . . . . . . . . . . . . . . . . . . . . . 892 884
Total amounts receivable at 30 June from:CurrentJointly controlled and associated entities - trade receivables (a) . . . . . . . . . . . . . . . . . . . . . . 4 4Jointly controlled and associated entities - loans (c) . . . . . . . . . . . . . . . . . . . . . . . . . . . . . 33 35
37 39Non currentJointly controlled and associated entities - loans (c) . . . . . . . . . . . . . . . . . . . . . . . . . . . . . 448 5Allowance for amounts owed by jointly controlled and associated entities (c) . . . . . . . . . . . . . . . . (5) (5)
443 -Movement in allowance for amounts owed by jointly controlled and associated entities:Opening balance . . . . . . . . . . . . . . . . . . . . . . . . . . . . . . . . . . . . . . . . . . . . . . . (5) (182)Amounts reversed . . . . . . . . . . . . . . . . . . . . . . . . . . . . . . . . . . . . . . . . . . . . . . - 147Foreign currency exchange differences . . . . . . . . . . . . . . . . . . . . . . . . . . . . . . . . . . . - 30Closing balance . . . . . . . . . . . . . . . . . . . . . . . . . . . . . . . . . . . . . . . . . . . . . . . (5) (5)
Total amounts payable at 30 June to:CurrentJointly controlled and associated entities - payables (a) . . . . . . . . . . . . . . . . . . . . . . . . . . . 31 13
For
per
sona
l use
onl
y

Telstra Corporation Limited and controlled entities
198
Notes to the Financial Statements (continued)
Transactions involving our jointly controlled and associated entities (continued)
(a) We sold and purchased goods and services, and received interest from our jointly controlled and associated entities. These transactions were in the ordinary course of business and on normal commercial terms and conditions.
Details of our individual significant transactions involving our jointly controlled and associated entities during fiscal 2012 are detailed as follows:
• we purchased pay television services amounting to $649 million (2011: $640 million) from our jointly controlled entity FOXTEL. The purchases were to enable the resale of FOXTEL services, including pay television content, to our existing customers as part of our ongoing product bundling initiatives. In addition, we made sales to FOXTEL for our cost recoveries of $118 million (2011: $102 million); and
• purchases were made by the Telstra Group of $79 million (2011: $233 million) from our jointly controlled entity Reach Ltd (Reach) in line with market prices. These were for the purchase of, and entitlement to, capacity and connectivity services.
(b) A $108 million (2011: $70 million) distribution was received from our jointly controlled entity FOXTEL during the year.
(c) Loans provided to jointly controlled and associated entities relate to loans provided to Reach of $5 million (2011: $5 million), the 3GIS Partnership (3GIS) of $32 million (2011: $35 million) and FOXTEL Partnership of $443 million (2011: nil).
In April 2012, Telstra Corporation Limited provided a loan to FOXTEL Partnership to fund the acquisition of shares in Austar. The loan is interest bearing and it has a minimum term of just over 10 years and a maximum of 15 years.
The loan provided to Reach is an interest free loan and repayable upon the giving of twelve months notice by both PCCW Limited and us. We have fully provided for the non-recoverability of the loan as we do not consider that Reach is in a position to be able to repay the loan amount in the medium term.
The loan provided to 3GIS represents interest free funding for operational expenditure purposes. In accordance with the partnership agreement, the loan is repayable on dissolution of the partnership. Telstra and Vodafone Hutchison Australia will conclude their joint venture agreement for the 3GIS network on 31 August 2012. Refer to note 26 for further details.
Transactions involving other related entities
Post employment benefits
As at 30 June 2012, the Telstra Superannuation Scheme (Telstra Super) owned 38,383,958 shares in Telstra Corporation Limited (2011: 42,589,721) at a cost of $118 million (2011: $130 million) and a market value of $142 million (2011: $123 million). All of these shares were fully paid at 30 June 2012. In fiscal 2012, we paid dividends to Telstra Super of $13 million (2011: $10 million). We own 100% of the equity of Telstra Super Pty Ltd, the trustee of Telstra Super.
Telstra Super also held bonds issued by Telstra Corporation Limited. These bonds had a cost of $11 million (2011: $4 million) and a market value of $11 million (2011: $10 million) at 30 June 2012.
All purchases and sales of Telstra shares and bonds by Telstra Super are determined by the trustee and/or its investment managers on behalf of the members of Telstra Super.
Key management personnel (KMP)
For details regarding our KMP’s remuneration and interests in Telstra, as well as other related party transactions, refer to note 28.
29. Related party disclosures (continued)
For
per
sona
l use
onl
y

Telstra Corporation Limited and controlled entities
199
Notes to the Financial Statements (continued)
(a) Includes $307 million (2011: $283 million) of impairment losses relating to the value of our investments in, and amounts owed by, our controlled entities. The impairment losses have been eliminated on consolidation of the Telstra Group.
Except for those noted below, our accounting policies for the Telstra Entity are consistent with those for the Telstra Group:
• under our tax funding arrangements, amounts receivable (or payable) recognised by the Telstra Entity for the current tax payable (or receivable) assumed from our wholly owned entities are booked as current assets or liabilities;
• investments in controlled entities, included within non current assets above, are recorded at cost less impairment of the investment value. Where we hedge the value of our investment in an overseas controlled entity, the hedge is accounted for in accordance with note 2.22. Refer to note 25 for details on our investments in controlled entities; and
• our interests in associated and jointly controlled entities; including partnerships, are accounted for using the cost method of accounting and are included within non current assets in the table above.
Property, plant and equipment commitments
Contingent liabilities and guarantees
Common law claims
Certain common law claims by employees and third parties are yet to be resolved. As at 30 June 2012, management believes that the resolution of these contingencies will not have a significant effect on the Telstra Entity's financial position, results of operations or cash flows. The maximum amount of these contingent liabilities cannot be reliably estimated.
Included in our common law claims is the following litigation case:
Optus Confidential Information
Optus commenced proceedings in the Federal Court of Australia in December 1997 alleging that Telstra breached the Trade Practices Act and misused Optus’ confidential information. All the claims were subsequently settled or withdrawn other than a confidential information claim (relating to the preparation and use of STD and IDD market share reports). It relates to historical events in the period from 1993-2003. This matter was resolved during fiscal 2012.
30. Parent entity information
Telstra EntityAs at 30 June
2012 2011$m $m
Statement of Financial PositionTotal current assets. . . . . . . . . . . . . . . . . . . . . . . . . . . . . . . . . . . . . . . . . . . . . . 9,399 7,430Total non current assets (a) . . . . . . . . . . . . . . . . . . . . . . . . . . . . . . . . . . . . . . . . . 31,551 31,679Total assets . . . . . . . . . . . . . . . . . . . . . . . . . . . . . . . . . . . . . . . . . . . . . . . . . 40,950 39,109Total current liabilities . . . . . . . . . . . . . . . . . . . . . . . . . . . . . . . . . . . . . . . . . . . . 11,451 10,178Total non current liabilities . . . . . . . . . . . . . . . . . . . . . . . . . . . . . . . . . . . . . . . . . . 16,942 16,419Total liabilities . . . . . . . . . . . . . . . . . . . . . . . . . . . . . . . . . . . . . . . . . . . . . . . . 28,393 26,597Share capital . . . . . . . . . . . . . . . . . . . . . . . . . . . . . . . . . . . . . . . . . . . . . . . . . 5,635 5,610Cashflow hedging reserve . . . . . . . . . . . . . . . . . . . . . . . . . . . . . . . . . . . . . . . . . . (87) (14)General reserve . . . . . . . . . . . . . . . . . . . . . . . . . . . . . . . . . . . . . . . . . . . . . . . 194 194Retained profits. . . . . . . . . . . . . . . . . . . . . . . . . . . . . . . . . . . . . . . . . . . . . . . . 6,815 6,722Total Equity . . . . . . . . . . . . . . . . . . . . . . . . . . . . . . . . . . . . . . . . . . . . . . . . . 12,557 12,512
Telstra EntityYear ended 30 June
2012 2011$m $m
Statement of Comprehensive IncomeProfit for the year (a) . . . . . . . . . . . . . . . . . . . . . . . . . . . . . . . . . . . . . . . . . . . . . 4,086 3,367Total comprehensive income . . . . . . . . . . . . . . . . . . . . . . . . . . . . . . . . . . . . . . . . . 3,495 3,319
Telstra EntityAs at 30 June
2012 2011$m $m
Total property, plant and equipment expenditure commitments contracted for at balance date but not recorded in the financial statements . . . . . . . . . . 572 415
For
per
sona
l use
onl
y

Telstra Corporation Limited and controlled entities
200
Notes to the Financial Statements (continued)
Contingent liabilities and guarantees (continued)
Indemnities, performance guarantees and financial support
We have provided the following indemnities, performance guarantees and financial support through the Telstra Entity:
• indemnities to financial institutions to support bank guarantees to the value of $279 million (2011: $294 million) in respect of the performance of contracts;
• indemnities to financial institutions in respect of the obligations of our controlled entities. The maximum amount of our contingent liabilities for this purpose is $189 million (2011: $189 million);
• financial support for certain controlled entities to the amount necessary to enable those entities to meet their obligations as and when they fall due. The financial support is subject to conditions including individual monetary limits totalling $108 million (2011: $60 million) and a requirement that the entity remains our controlled entity;
• guarantees of the performance of jointly controlled entities under contractual agreements to a maximum amount of $10 million (2011: $10 million);
• guarantees over the performance of third parties under defeasance arrangements, whereby lease payments are made on our behalf by the third parties over the remaining terms of the finance leases. The lease payments over the remaining expected term of the leases amount to $96 million (US$98 million) (2011: $106 million (US$114 million)). In fiscal 2012, we exercised our early buyout option to terminate a portion of the leases that commenced in 1999. We still hold an early buyout option for the remaining leases; and
• during fiscal 1998, we resolved to provide IBM Global Services Australia Limited (IBMGSA) with guarantees issued on a several basis up to $210 million as a shareholder of IBMGSA. We issued a guarantee of $68 million on behalf of IBMGSA during fiscal 2000. During fiscal 2004, we sold our shareholding in this entity. The $68 million guarantee is provided to support service contracts entered into by IBMGSA and third parties, and was made with IBMGSA bankers, or directly to IBMGSA customers. As at 30 June 2012, this guarantee remains unchanged and $142 million (2011: $142 million) of the $210 million guarantee facility remains unused.
Upon sale of our shareholding in IBMGSA and under the deed of indemnity between shareholders, our liability under these performance guarantees has been indemnified for all guarantees that were in place at the time of sale. Therefore, the overall net exposure to any loss associated with a claim has effectively been offset.
30. Parent entity information (continued)
For
per
sona
l use
onl
y

Telstra Corporation Limited and controlled entities
201
Notes to the Financial Statements (continued)
We are not aware of any matter or circumstance that has occurred since 30 June 2012 that, in our opinion, has significantly affected or may significantly affect in future years:
• our operations;• the results of those operations; or• the state of our affairs;
other than:
Final Dividend
On 9 August 2012, the directors of Telstra Corporation Limited resolved to pay a fully franked final dividend of 14 cents per ordinary share. The record date for the final dividend will be 24 August 2012 with payment being made on 21 September 2012. Shares will trade excluding the entitlement to the dividend on 20 August 2012.
A provision for dividend payable has been raised as at the date of resolution, amounting to $1,738 million. The final dividend will be fully franked at a tax rate of 30%. The financial effect of the dividend resolution was not brought to account as at 30 June 2012.
There are no income tax consequences for the Telstra Group resulting from the resolution and payment of the final ordinary dividend, except for $745 million of franking debits arising from the payment of this dividend that will be adjusted in our franking account balance.
The Dividend Reinvestment Plan (DRP) continues to be suspended.
Disposal of TelstraClear Limited
On 12 July 2012, we signed an agreement to dispose of our 100% shareholding in TelstraClear Limited and its controlled entity (TelstraClear) for a total consideration of $658 million (NZ$840 million). The sale is contingent on New Zealand regulatory approval, including the New Zealand Commerce Commission, Overseas Investment Office and Ministry of Business, Innovation and Employment, which is expected to take a number of months. The loss on disposal, subject to completion adjustments, is expected to be $263 million, mainly due to an impairment of $130 million and the reclassification of $130 million foreign currency reserve to the Income Statement.
In accordance with AASB 5: “Non-current Assets Held for Sale and Discontinued Operations” the carrying value of assets and liabilities of TelstraClear, with the exception of cash balances which are excluded from the sale agreement, have been classified as held for sale as at 30 June 2012. Refer to note 12 for further details.
31. Events after reporting date
For
per
sona
l use
onl
y
Telstra Corporation Limited and controlled entities
202
This directors’ declaration is required by the Corporations Act 2001 of Australia.
The directors of Telstra Corporation Limited have made a resolution that declared:
For and on behalf of the board
Directors’ Declaration
(a) the financial statements and notes of the Telstra Group set out on pages 72 to 201:
(i) comply with the Accounting Standards applicable in Australia, International Financial Reporting Standards and Interpretations (as disclosed in note 1.1 to the financial statements), and Corporations Regulations;
(ii) give a true and fair view of the financial position as at 30 June 2012 and performance, as represented by the results of the operations and cash flows, for the year ended 30 June 2012; and
(iii) have been made out in accordance with the Corporations Act 2001.
(b) they have received declarations as required by section 295A of the Corporations Act 2001;
(c) at the date of this declaration, in the directors’ opinion, there are reasonable grounds to believe that Telstra Corporation Limited will be able to pay its debts as and when they become due and payable in Australia; and
(d) at the date of this declaration there are reasonable grounds to believe that the members of the extended closed group identified in note 25(a) to the full financial statements, as parties to a Deed of Cross Guarantee, will be able to meet any obligations or liabilities to which they are, or may become subject to, under the Deed of Cross Guarantee described in note 25(a).
Catherine B Livingstone AOChairman
Date: 9 August 2012Melbourne, Australia
David I ThodeyChief Executive Officer and Executive DirectorFor
per
sona
l use
onl
y
203
Report on the Financial Report
We have audited the accompanying financial report of Telstra Corporation Limited, which comprises the consolidated statement of financial position as at 30 June 2012, the consolidated income statement and consolidated statement of comprehensive income, the consolidated statement of changes in equity and the consolidated statement of cash flows for the year then ended, notes comprising a summary of significant accounting policies and other explanatory information, and the directors’ declaration of the consolidated entity comprising the company and the entities it controlled at the year’s end or from time to time during the financial year.
Directors’ Responsibility for the Financial Report
The directors of the company are responsible for the preparation of the financial report that gives a true and fair in accordance with Australian Accounting Standards and the Corporations Act 2001 and for such internal controls as the directors determine are necessary to enable the preparation of the financial report that is free from material misstatement, whether due to fraud or error. In Note 1, the directors also state, in accordance with Accounting Standard AASB 101 Presentation of Financial Statements, that the financial statements comply with International Financial Reporting Standards.
Auditor’s Responsibility
Our responsibility is to express an opinion on the financial report based on our audit. We conducted our audit in accordance with Australian Auditing Standards. Those standards require that we comply with relevant ethical requirements relating to audit engagements and plan and perform the audit to obtain reasonable assurance about whether the financial report is free from material misstatement.
An audit involves performing procedures to obtain audit evidence about the amounts and disclosures in the financial report. The procedures selected depend on the auditor’s judgment, including the assessment of the risks of material misstatement of the financial report, whether due to fraud or error. In making those risk assessments, the auditor considers internal controls relevant to the entity’s preparation and fair presentation of the financial report in order to design audit procedures that are appropriate in the circumstances, but not for the purpose of expressing an opinion on the effectiveness of the entity’s internal controls. An audit also includes evaluating the appropriateness of accounting policies used and the reasonableness of accounting estimates made by the directors, as well as evaluating the overall presentation of the financial report.
We believe that the audit evidence we have obtained is sufficient and appropriate to provide a basis for our audit opinion.
Independence
In conducting our audit we have complied with the independence requirements of the Corporations Act 2001. We have given to the directors of the company a written Auditor’s Independence Declaration, a copy of which is included in the directors’ report.
Opinion
In our opinion:
a. the financial report of Telstra Corporation Limited is in accordance with the Corporations Act 2001, including:
i giving a true and fair view of the consolidated entity’s financial position as at 30 June 2012 and of its performance for the year ended on that date; and
ii complying with Australian Accounting Standards and the Corporations Regulations 2001; and
b. the financial report also complies with International Financial Reporting Standards as disclosed in Note 1.
Report on the Remuneration Report
We have audited the Remuneration Report included in pages 51 to 70 of the directors’ report for the year ended 30 June 2012. The directors of the company are responsible for the preparation and presentation of the Remuneration Report in accordance with section 300A of the Corporations Act 2001. Our responsibility is to express an opinion on the Remuneration Report, based on our audit conducted in accordance with Australian Auditing Standards.
Opinion
In our opinion the Remuneration Report of Telstra Corporation Limited for the year ended 30 June 2012, complies with section 300A of the Corporations Act 2001.
Ernst & Young
SJ FergusonPartnerMelbourne, Australia9 August 2012
Independent Auditor’s Report to the Members of Telstra Corporation Limited
For
per
sona
l use
onl
y

204
Telstra Corporation Limited and controlled entities
(This page has been left blank intentionally)
For
per
sona
l use
onl
y

205
Telstra Corporation Limited and controlled entities
(This page has been left blank intentionally)
For
per
sona
l use
onl
y

206
Telstra Corporation Limited and controlled entities
(This page has been left blank intentionally)
For
per
sona
l use
onl
y

207
Telstra Corporation Limited and controlled entities
(This page has been left blank intentionally)
For
per
sona
l use
onl
y

208
Telstra Corporation Limited and controlled entities
(This page has been left blank intentionally)
For
per
sona
l use
onl
y

CONTACT DETAILS
REGISTERED OFFICELEVEL 41, 242 EXHIBITION STREET MELBOURNE VICTORIA 3000 AUSTRALIA
Damien Coleman Company Secretary
email: [email protected]
GENERAL ENQUIRIES - REGISTERED OFFICEAUSTRALIA: 1300 368 387 ALL OTHER: +61 (8) 8308 1721
SHAREHOLDER ENQUIRIES AUSTRALIAN SHARE REGISTERAUSTRALIA: 1300 88 66 77 ALL OTHER: +61 (2) 8280 7756 FAX: +61 (2) 9287 0303
email: [email protected] website: www.linkmarketservices.com.au/telstra
Link Market Services Limited PO Box A942 Sydney South NSW 1234 Australia
NEW ZEALAND SHARE REGISTERNEW ZEALAND: 0800 835 7872 ALL OTHER: +64 (3) 308 8887 FAX: +64 (3) 308 1311
email: [email protected] website: www.linkmarketservices.co.nz
Link Market Services Limited PO Box 384 Ashburton 7740 New Zealand
INVESTOR RELATIONSLEVEL 32, 242 EXHIBITION STREET MELBOURNE VICTORIA 3000 AUSTRALIA
Australia: 1800 880 679 All Other: +61 (3) 8647 4954
email: [email protected]
SUSTAINABILITYLEVEL 39, 242 EXHIBITION STREET MELBOURNE VICTORIA 3000 AUSTRALIA
email: [email protected]
TELSTRA CORPORATION LIMITEDABN 33 051 775 556 Incorporated in the Australian Capital Territory Telstra is listed on Stock Exchanges in Australia and in New Zealand (Wellington)
WEBSITESTelstra’s Investor Relations home page: www.telstra.com.au/investor
Telstra’s Sustainability home page: www.telstra.com.au/sustainability
INDICATIVE FINANCIAL CALENDAR*
Final dividend paid Friday 21 September 2012
Annual General Meeting Tuesday 16 October 2012
Half Year Results announcement Thursday 7 February 2013
Ex-dividend share trading commences Monday 18 February 2013
Record date for interim dividend Friday 22 February 2013
Interim dividend paid Friday 22 March 2013
Annual Results announcement Thursday 8 August 2013
Ex-dividend share trading commences Monday 19 August 2013
Final dividend paid Friday 20 September 2013
Annual General Meeting Tuesday 15 October 2013
* Timing of events may be subject to changAustralian Securities Exchange (ASX).
For
per
sona
l use
onl
y

telstra.com.au/investor
For
per
sona
l use
onl
y