level controller emission study fisher l2 and …
TRANSCRIPT

LEVEL CONTROLLER EMISSION STUDY FISHER L2 AND IMPROVED RELAYS, NORRISEAL 1001A AND EVS
Prepared for: Petroleum Technology Alliance of Canada
Prepared by: Michael D’Antoni Vice President GreenPath Energy Ltd. [email protected]
Published on: October 19, 2018

2
ACKNOWLEDGEMENTS
GreenPath Energy would like to thank the Petroleum Technology Alliance of Canada (PTAC) and the Alberta Upstream Petroleum Research Fund (AUPRF). Special thanks to the producers who allowed GreenPath to conduct measurements on their sites and allowed the installation of the improved relays and retrofit kits respectively. GreenPath Energy worked closely with Spartan Controls and Brian Van Vliet in particular; without Brian’s help, this project would not have been possible. Sean Hiebert and Greg Unrau were the technical champions of this project and provided invaluable insights throughout.
PROJECT TEAM
The project team included Michael D’Antoni (author), Michael Glackin, Abin Eldhose, Craig McKenzie, and Joshua Anhalt. Additional support was provided by Brian Van Vliet of Spartan Controls.
Any opinions, findings, conclusions or recommendations in this report are those of the author and do not necessarily reflect the views of the reviewers or their agencies.
Peer review was provided by Brian Van Vliet, Spartan Controls.
ABOUT GREENPATH ENERGY
GreenPath Energy is North America’s premier emission management service provider for the oil and gas industry. We specialize in methane emission detection, measurement, and reduction solutions; this includes equipment inventory collection, leak detection and repair (LDAR) for fugitive emissions, and methane emission reduction project development. Our technical expertise and diverse experience in emissions management ensures we provide clients with solutions that allow for efficient use of capital while achieving significant emission reductions and regulatory compliance.
Our expertise in building best practice fugitive and vented emission management solutions has been developed since 2007 through our extensive oil and gas backgrounds, utilizing the best technology. We engage regularly with government, regulatory bodies, industry associations and technology providers to ensure we are at the leading edge of emission management program requirements and solutions.

3
ABSTRACT
Level controllers are the most common pneumatic instrument in oil and gas operations in western Canada. Previous studies showed that manufacturers’ specifications were not a good predictor of emissions from level controllers due to the variable nature of level controller vent rates. Previous studies did not develop emission factors for the most common lower-emissions level controllers (the Fisher L2sj and Norriseal EVS respectively). The opportunity for emissions reductions from these lower emission level controllers had not been quantified. This study aims to address that gap by increasing the body of knowledge on emissions from level controllers and lower emission alternatives.
EXECUTIVE SUMMARY
GreenPath Energy has undertaken a detailed analysis of level controller emissions for the two most common modern level controllers (Fisher L2 and Norriseal 1001a) in western Canada and their low emission equivalents (Fisher L2sj, L2-LL, L2-LG, Norriseal EVS). Over 200 measurements were made across a diverse group of operators (accounting for approximately 30% of operating gas wells in Alberta) to establish a reasonable baseline for emissions reporting and vent reduction potential of low-emissions level controllers.
Good data exists for the conversion of pressure controllers and transducers to lower emission equivalents, but a similar dataset does not exist for level controllers. Emissions from active level controllers are largely attributed to dynamic and transient emissions which are not accounted for in manufacturer-provided steady state emissions. This study shows that conservative emissions reduction of 50tCO2e/year is available from the conversion of high emission level controllers to low emission equivalents. Assuming 40,000 eligible level controllers exist in Alberta, this equates to a 2 million tonne annual reduction that was not previously considered by stakeholders.
Installing improved L2 relays (referred to as L2-LL and L2-LG for the Liquid-Liquid and Liquid-Gas interface they are designed for) showed reductions consistently above 80% on level controllers with baseline emissions greater than 0.5 m3/hr of fuel gas equivalent (FGE).1
The initial sample of Norriseal retrofits did not draw upon the same high-emitting population, and results from the initial sample set were mixed. A subsequent project which focused on high-emitting Norriseal controllers showed an emission reduction greater than 90%. The quality of data for the Norriseal controllers is not as robust as the reductions achieved from the improved Fisher L2 relays.
The retrofits executed in support of this project could generate offsets under the Quantification Protocol for Greenhouse Gas Emission Reductions from Pneumatic Devices (version 2.0) in Alberta. Based on $30/tonne and assumptions detailed in the study, the deployment of 30 L2 controller relays and 30 EVS retrofits could result revenue of greater than $380,000 to participant companies if offsets are pursued and as well as fuel gas savings of approximately $36,000 to January 1, 2023.
The baseline samples were randomly selected to minimize bias. In each cohort of sites by company, all sites were assigned a random number in Microsoft Excel, then ranked. The top 15 ranked sites (which should account for 30 level controllers) were selected for sampling. If the operator had reason to exclude the site (site inaccessible; site shut in), the next-ranked sites were added to the survey list. These baselines presented diverse
1 Note all values expressed in this report are in Fuel Gas Equivalent (FGE) values.

4
operators but were largely focused from Grande Prairie to Red Deer areas, where previous studies showed that level controllers were common (GreenPath Energy on Behalf of Alberta Energy Regulator, 2017).
The surveys were carried out using the Spartan Enhanced Measurement Emission Accuracy Solution (e-MEAS™) and a positive displacement meter outfitted with the Calscan Hawk 9000 data logger (Calscan Meter) to compensate for ambient temperature and pressure, where required. Use of e-MEAS™ or Calscan was driven by operator preference as the use of e-MEAS™ was more invasive, requiring the fuel gas supply system to be spliced into. For a perspective on the differences between the e-MEAS™ measurement tool and the Calscan system, please refer to the PTAC study on Pneumatic Vent Gas Measurement2. The Pneumatic Vent Gas Measurement study demonstrated a slight differential between measurements via e-MEAS™ measurements and Calscan measurements, but a correction factor between the two methods has not been achieved. Generally, at high vent rates the Calscan meter underrepresents rates. Either measurement tool is sufficient for the quantification of high-emitting level controllers and the retrofit.
There is significant overlap between the 17-ARPC-06 (Pneumatic Vent Gas Measurement) set and the dataset presented in this study shown in Figure 1 below. This level controller study includes 139 baseline samples taken in the first round of study, as well as 30 pre and post samples for the Fisher L2 relays, and 25 pre and post measurements of Norriseal 1001a. In total over 300 level controllers were measured for the study. An anonymous version of the data has been included in Appendix A: Anonymous Measurement Data.
Figure 1: Visual representation of Field Samples in Pneumatic Vent Gas Measurement and GreenPath Level Controller Study
In addition, a client of GreenPath allowed for data collected after the study period to be added to the report. This data significantly enhances perspectives on emissions reductions from both Norriseal 1001a to EVS conversions as well as conversions to the Fisher L2sj. This data is not random, however, and of lesser value than the randomized samples.
2 https://www.ptac.org/pneumatic-vent-gas-measurement/

5
The distribution of results shows emissions from level controller are dominated by a “fat tail” and that a small number of high emitting level controllers are responsible for a disproportionate share of emissions. The low-emission alternatives deployed on operating wells showed significant emission reductions in the case of the Fisher L2-LL and L2-LG relays. Improving the pneumatic efficiency of these high-emitting devices represents the most cost-effective means available to industry to achieve methane reduction.
Figure 2: Histogram of L2 Vent Rate Illustrating “Fat Tail” of data
A challenge in developing this project was the lack of pneumatic inventories in Alberta. Locating the low emission Fisher L2sj as well as the Norriseal EVS proved particularly fruitless despite working with vendors and producers for over six months to locate the low emission devices. In addition, locating Norriseal 1001a controllers proved to be difficult, as a field which an operator had designed to be “mostly Norriseal 1001a” based on inventory was determined (after random site selection) to yield 24 Fisher L2 and 6 Norriseal 1001a level controllers. In total, via random sample, GreenPath was only able to secure 14 Norriseal units despite three different measurement campaigns to secure the required number of samples.
Initial field surveys hoped to capture a Fisher L2sj inventoried as an L2, or a Norriseal 1001 EVS inventoried as a 1001a, but these efforts proved unsuccessful, a different pathway was selected. After over 100 Fisher L2 and Norriseal 1001a were inventoried and measured, no low-emission level controllers were found. The only remaining pathway was through bench tests with set process conditions and changes from an L2 to L2sj and Norriseal 1001a to EVS, respectively. Bench tests would be of lesser value than field studies in real world process conditions.
Instead, to pilot the Fisher L2 improved relay (pilot models were released only a few weeks prior to field trials) as well the Norriseal EVS retrofit kit, GreenPath worked with producers from the first round of measurements, and other producers who had not been engaged in the first round of surveys. All improved Fisher L2 relays were gifted to the project by Spartan. Three EVS retrofit kits were gifted to the project by Alberta Oil Tool, with the remaining 27 purchased by GreenPath for the project.

6
L2 RETROFITS
Sites with higher than average emission rates were selected from the initial sample pools to be targeted for retrofit and replacement, as low-emitting level controllers do not represent an opportunity for industry to reduce emissions. Additionally, bench tests showed the improved Fisher L2 relay carried significant potential to reduce emissions from level controllers in active control loops.
For retrofit sites, measurements were taken pre and post to ensure that changes in process condition (well decline, plunger position) did not affect the overall result. This step increased time on site (incurring costs) but ensured that the results were more representative of reductions achieved.
The retrofits occurred the same day in the same process condition to isolate the effect of the different relays and retrofit on the results. An average reduction in emissions of 84% was observed in the improved L2 relays within the sample. Relay change outs were executed in under 10 minutes, with no disruption to process.
Table 1: L2 Relay Pre and Post Measurement Results (m3/hr FGE)
Pre-Retrofit Post Retrofit % Reduction Water average 0.61 0.12 80 Condensate average 0.78 0.094 88 Fuel gas scrubbers 0.05 0.02 60 All average 0.63 0.10 84
The emission rates presented from the improved relay are conservative as the average emission rates of the pre-retrofit population are higher than the original sample, thus in the general population an emission rate less than 0.10m3/hr would be expected.
Assuming offsets are valued at $30/tonne from 2018 to 2022 and that the fuel gas is 90% methane operating at 7880 hours per year, these conversions could generate $280,000 in revenue for the participant company if offsets are pursued. In addition, assuming $1.6/MMBtu for 2018, $0.6/MMbtu for processing and assuming a flat price forecast, the saved gas is worth a further $23,000 to December 31, 2022.
NORRISEAL RETROFITS
One of the basic problems from this study was the lack of Norriseal controllers inventoried. One operator volunteered a field with Norriseal controllers, but ownership of the assets changed hands and the operator was then unable to participate in the study. Similarly, an early participant also had a change of ownership and was unable to participate in the retrofit pilot. Of the original participants involved in the project, one did not wish to retrofit the Norriseal based on operator preference. The other faced logistical challenges and only had a small number of Norriseals with baseline measurements.
To address this gap, GreenPath reached out to operators to determine if they had a population of Norriseals and were willing to participate in the study. GreenPath was able to find a further three operators with a reliable inventory of Norriseals; however, there were no “pre” measurements and data was unavailable to screen for high emitting sites. As such, random sites were selected and retrofit on site. Consequently, there was inconsistent quantities of high emitters to draw from to develop a reduction estimate similar to that presented

7
for L2 Relay changes. Of the 20 additional Norriseal level controllers randomly selected, only one site had a pre-measurement greater than 0.17 m3/hr3 and the total population had average emissions of 0.05m3/hr.
In the post measurement, two of the samples had to be excluded as there was a dump event in the project but not in the baseline. When these two instances are excluded, the level controllers with EVS retrofits installed had an average emission rate of 0.025m3/hr.
GreenPath has recently been working with a producer on measurement of level controllers; the producer has agreed to provide their data to the study on condition of anonymity. In this case, all level controllers were measured in a few pilot fields and only the highest emitting level controllers were selected for retrofit. This sample did not follow the procedure of the previous random samples. Instead:
- The sample was not random – only high emitters were selected for retrofit, making it comparable to the L2-LL and L2-LG relay changes.
- The same onsite procedure for the L2-LL and L2-LG weres not followed; in the random population pre and post measurements occurred within a few minutes of the change retrofit to the EVS controller. The measurements from this sample were roughly two months apart. The wells were not unconventional wells with a steep decline curve; therefore, the change in emissions is unlikely to be due to production declines.
The results of these additional seven measurements on high-emitting Norriseal controllers were promising. The seven high-emitting Norriseals had average emissions of 0.90m3/hr in baseline measurements. After retrofit, the average emissions were 0.046m3/hr. Further testing of high-emission Norriseal controllers should be undertaken to determine if this pattern holds true for all high emitting devices.
From this sample of seven retrofitted level controllers, offset revenue of $104,000 could be realized as well as $8,500 in gas savings to December 31, 2022, using the same assumptions regarding methane content and operating hours.
TANGIBLE OUTCOMES FOR INDUSTRY
This study helped spur the development of a low-emission relay for the most common level controller in Canadian industry – the Fisher L2. The improved relay, implemented at high-emitting sites coupled with generating offsets under the Alberta Offset System, would result in payouts in under a year (typically less than five months).
This study includes testing procedures for the Spartan e-MEASTM as well as the Calscan Hawk 9000 positive displacement meter, either of which may be used by operators to provide quantified vent rates for high emission level controllers and validate the reductions achieved by the change to low emission level controllers. Under the protocol, the same type of measurement device must be used in the pre and post measurement.
1. Level controller emissions are heavily influenced by “Exceptional Minority”
Emissions from all level controllers are characterized by a small number of large emitters that greatly increase the average emissions from the sample size. In the Fisher L2 and Norriseal 1001a Random samples, the median is significantly less than the average value demonstrating that high emitters inflate the average value.
3 The typical definition of “high-bleed”
8
Table 2: Mean and Median Values Fisher L2 and Norriseal 1001a
Average(Mean) Median Fisher L2 0.389 0.247 Norriseal 1001a 0.193 0.044
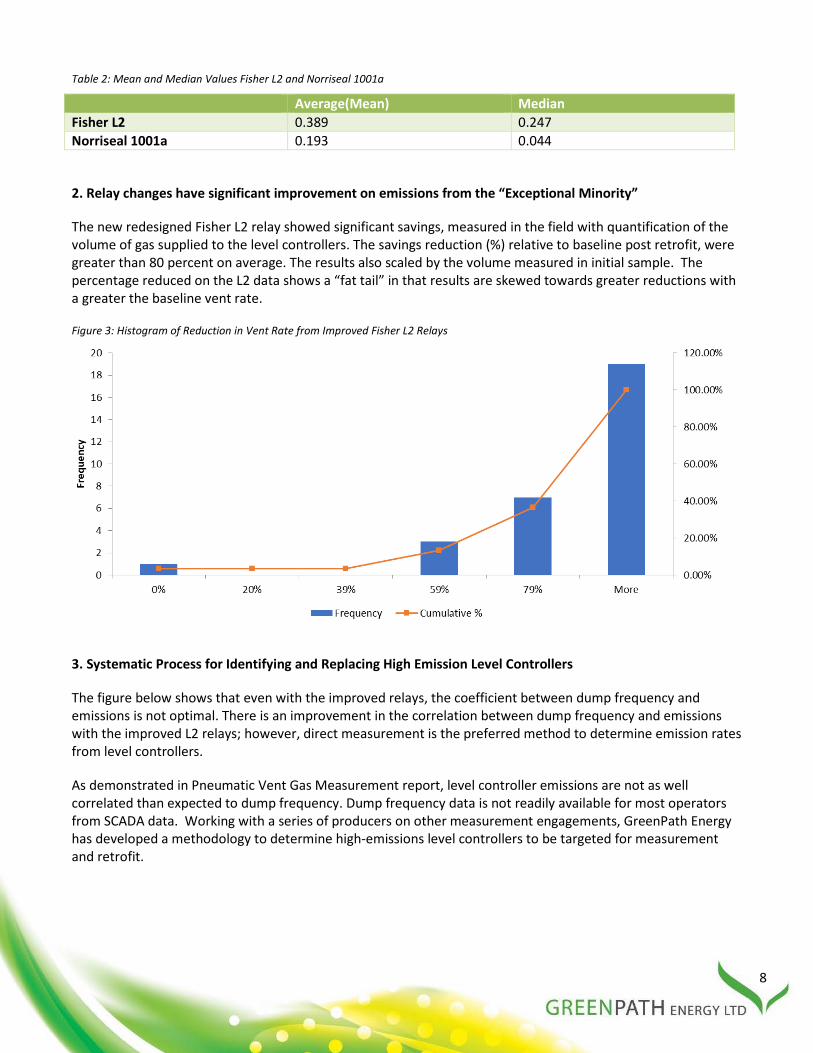
2. Relay changes have significant improvement on emissions from the “Exceptional Minority”
The new redesigned Fisher L2 relay showed significant savings, measured in the field with quantification of the volume of gas supplied to the level controllers. The savings reduction (%) relative to baseline post retrofit, were greater than 80 percent on average. The results also scaled by the volume measured in initial sample. The percentage reduced on the L2 data shows a “fat tail” in that results are skewed towards greater reductions with a greater the baseline vent rate.
Figure 3: Histogram of Reduction in Vent Rate from Improved Fisher L2 Relays
3. Systematic Process for Identifying and Replacing High Emission Level Controllers
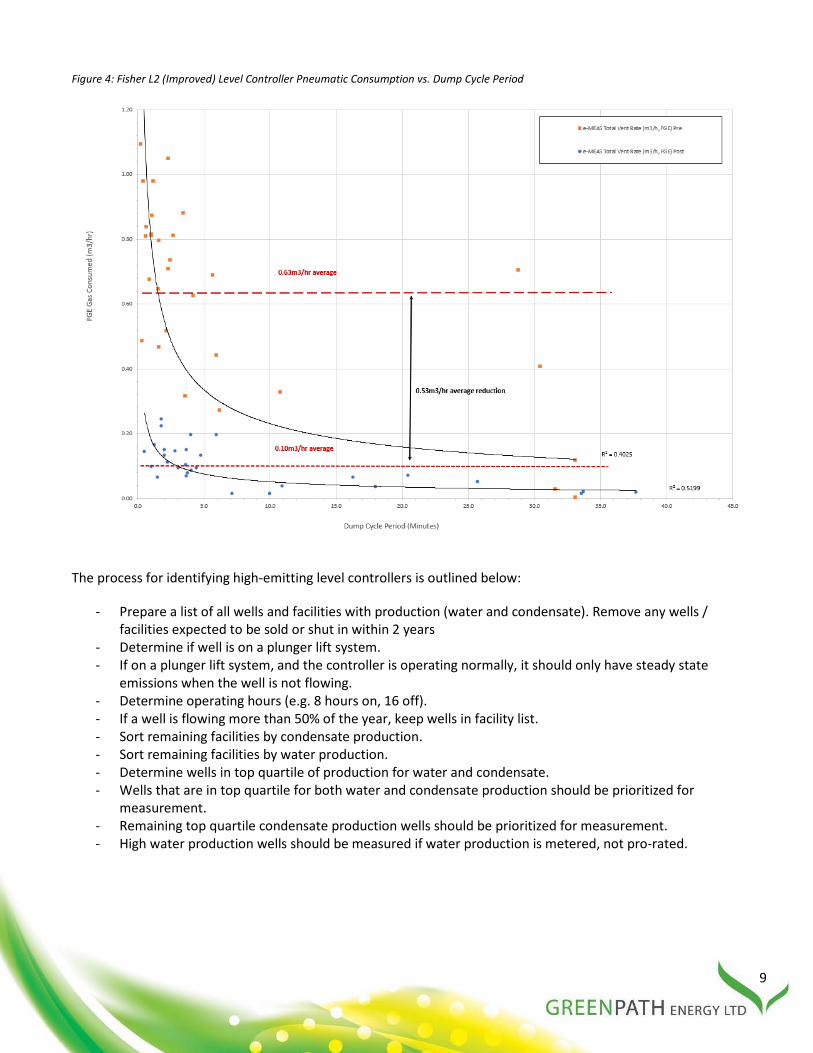
The figure below shows that even with the improved relays, the coefficient between dump frequency and emissions is not optimal. There is an improvement in the correlation between dump frequency and emissions with the improved L2 relays; however, direct measurement is the preferred method to determine emission rates from level controllers.
As demonstrated in Pneumatic Vent Gas Measurement report, level controller emissions are not as well correlated than expected to dump frequency. Dump frequency data is not readily available for most operators from SCADA data. Working with a series of producers on other measurement engagements, GreenPath Energy has developed a methodology to determine high-emissions level controllers to be targeted for measurement and retrofit.
9
Figure 4: Fisher L2 (Improved) Level Controller Pneumatic Consumption vs. Dump Cycle Period
The process for identifying high-emitting level controllers is outlined below:
- Prepare a list of all wells and facilities with production (water and condensate). Remove any wells / facilities expected to be sold or shut in within 2 years
- Determine if well is on a plunger lift system. - If on a plunger lift system, and the controller is operating normally, it should only have steady state
emissions when the well is not flowing. - Determine operating hours (e.g. 8 hours on, 16 off). - If a well is flowing more than 50% of the year, keep wells in facility list. - Sort remaining facilities by condensate production. - Sort remaining facilities by water production. - Determine wells in top quartile of production for water and condensate. - Wells that are in top quartile for both water and condensate production should be prioritized for
measurement. - Remaining top quartile condensate production wells should be prioritized for measurement. - High water production wells should be measured if water production is metered, not pro-rated.

10
4. Previous studies likely overstated malfunction rate of level controller – LDAR is not the preferred solution pathway for level controller emissions
In developing data capture procedures for this study, one aim was to understand if level controller emissions were the product of malfunctioning devices or normal operation. Data capture procedures employed by GreenPath were overbuilt to capture data beyond previous studies and beyond the requirements of the Alberta Pneumatic Offset Protocol.
In the EDF/University of Texas study on emissions from well production equipment (Allen, et al., 2015), pneumatic device emissions were characterized by large numbers of ‘malfunctioning’ level controllers. Of the top 40 emitting devices measured in the Allen study, 34 were level controllers; of those, 68% were characterized as having equipment issues. These issues were identified ‘post measurement’ by subject matter experts. A subject matter expert from Spartan Controls (Brian Van Vliet) as well as this author reviewed the same dataset and found a significantly lower ratio of malfunctioning devices (less than one third).
The assertion of level controller malfunction permeated into the ICF/Pembina methane abatement cost curve for ‘Dump Valve Fugitives’, which the report stated would achieve a reduction of 0.79 Billion Cubic Feet (BCF)/year at a cost of $1.7 per MCF reduced at no capital cost.4 This report shows that the solution to minimize emissions from level controller rests in capital investment, not operational burden of LDAR for level controllers. The replacement relay/retrofit kit is a low capital cost with a certain reduction (greater than 80% for the L2 relay change, >50% for the Norriseal EVS) versus unknown reductions with known operator cost from increased LDAR.
In characterizing emissions from level controllers, a simple binary indication of malfunctioning/not malfunctioning is not adequate. In terms of the decision tree to mitigate emissions, analysis of fuel gas quality must be included as it affects performance of the pneumatic instrument. The key data is the time spent in a transient state, which can be revealed by direct measurement.
5. A valid emission rate for the two most common level controllers and the respective low emission equivalents in Alberta has been developed for measurement and reporting purposes.
In total, 139 random samples were taken of L2 Level controllers, a statistically valid sample for the purposes of the Alberta Offset System Quantification Protocol for Greenhouse Gas Emission Reductions from Pneumatic Devices (version 2.0), referred to hereafter as Alberta Pneumatics Protocol. The randomization process used in this study equates to this sample being more statistically valid than the previous Prasino Study. The average rate for L2 controllers varies from the value reported in the Pneumatic Vent Gas Measurement study due to the lower vent rate of the incremental controllers measured for this study.
Table 3: Level Controller Samples in Study versus Prasino Study
2018 GreenPath (m3/hr)# Quantity 2013 Prasino (m3/hr) Quantity Fisher L2 0.387 139 0.264 48 Fisher L2 with Improved Relays
0.100 30 N/A 0
Norriseal 1001a 0.193 34(40)5 0.187 57 Norriseal EVS 0.097 18 (7)6 N/A 0
# m3/hr fuel gas equivalent values converted from SCFH of nitrogen by dividing by 35.3 and multiplying by 1.27
4 (Economic Analysis of Methane Emission Reduction Opportunities in the Canadian Oil and Natural Gas Industries, 2015) Table 4-1 5 40 Non-random Samples samples included in reported value for a total of 74 6 7 Non-random Samples included for a total of 25– note value presented is based on application or reduction observed samples on broader population applying ISO 14064 principle of conservatism.

11
Note that these emissions rates should only be applied only when the well is flowing – this is critically important for wells on a plunger lift system. The logic for this is explained in the full report and is based on ISO 14064 principles regarding the development of greenhouse gas inventories.
The values for Fisher L2 Controllers are significantly higher than the results from the 2013 Prasino Study, likely reflecting several factors:
- Some Fisher L2 Measurements occurred at new highly productive Duvernay wells, likely skewing the sample higher (the median value for Fisher L2 in this study – which is a better measure of central tendency – is 0.249m3/hr).
- Fewer zero values in the dataset. Of the 48 Fisher L2 samples in the Prasino Study, 12 showed a zero value (25%) suggesting that the well was not flowing and/or a case seal leak. In GreenPath measurements, there were fewer than 10 zero values related to Fisher L2 Controllers. Note: A zero value should not be expected; both the Fisher L2 and Norriseal 1001a should vent some gas in a steady state.
- Most vent rates in this study were captured via the e-MEASTM system which can detect lower rates and has higher accuracy at higher rates.
In terms of an average value, a Fisher L2 Controller would thus be 0.387m3/hr for Alberta and 0.193 m3/hr for a Norriseal 1001a. These values could be used for measurement and reporting purposes.
In terms of the results of the L2 relay retrofit results, the retrofit measurements taken occurred at a subset of the 118 baseline L2 measurement devices. A total of 30 measurements of the improved L2 relays were pre and post retrofit. The 30 relays measured constitute the entire population of improved L2 relays in operation in the world at time of the writing of this report. Given that the sample size represents the total population, this result would be considered statistically valid. The Alberta Pneumatics protocol requires the measurement of 30 samples for a representative sample to extrapolate to other installations. Note also that 0.10m3/hr FGE is conservatively high because relays were retrofit into L2 level controllers that were dumping more often than what would be average for the installed population.
The L2 retrofit sites were selected from a high emission population; thus, emission factors based upon measurement of these sites would likely overstate emissions from the broad application of the improved relays.
NORRISEAL DISCUSSION
Data generated by this study is sufficient to have a statistically valid emission rate for a Norriseal 1001a. The data contained in this study likely understates the reduction potential from converting a high emission Norriseal 1001a to an EVS. As the initial sample of 20 Norriseal targeted for retrofit, only one exceeded 0.17m3/hr. The sample is more reflective of a low dump frequency population of level controllers, versus the reduction potential from the application of the EVS retrofit kit.
As almost all random sampled Norriseal 1001a controllers were in a steady state, the reductions achieved were small on average; with outliers removed – a sample population of 18 – a reduction of 50% was achieved.
An operator who followed a procedure like the first batch of Fisher L2 retrofit controllers (retrofitting only level controllers in active service) achieved reductions of over 90% by converting a Norriseal 1001a to an EVS on high-emitting level controllers.
The measurements and data analyses on this operator-driven project were conducted by GreenPath staff, who are confident in the result; however, only 7 conversions occurred. Based on the small sample size and gap in

12
timing between measurement and retrofit, it is questionable to extrapolate this result to the broader population without more field samples.
THE CASE FOR DIRECT MEASUREMENT
This study also establishes a relative cost per measurement per device that can be used by industry to conduct measurement campaigns to reduce emissions from high-emitting pneumatic devices. Based on measurements conducted under this study, the average cost per measurement was approximately $500 per device. It should be noted that a significant element of costs related to this study were related to the costs of transportation; measurement campaigns in a denser area or combined with leak detection and repair activities would have reduced costs.
If generic emission factors were applied using the data from this study, offsets of $1,000 per year would be available per year, per L2 retrofit. Similarly, if direct measurement (pre and post) is employed, annual revenue greater than $2,000 per device would be achieved. A 67% increase in net present value would be achieved if only high-emitting level controllers were converted via improved relays, and non-high-emitting devices remained in place. For an emission factor-based approach to be economically superior, less than 10% of controllers measured would have to be suitable for a retrofit (>0.3m3/hr.). In three separate random sample sets for this study, 80%, 26% and 26% of controllers were found to have a vent rate greater than 0.3m3/hr.
During this study, several other level controller devices encountered and measured (Fisher 2900, Fisher 2500, Fisher 2680, Invalco CT, Dynaflo 4000). However, sufficient numbers were not inventoried to create a statistically valid sample.

13
TABLE OF CONTENTS Acknowledgements .................................................................................................................................................... 2 Project Team ............................................................................................................................................................... 2 About GreenPath Energy ............................................................................................................................................ 2 Abstract ...................................................................................................................................................................... 3 Executive Summary .................................................................................................................................................... 3
L2 Retrofits ............................................................................................................................................................. 6 Norriseal Retrofits .................................................................................................................................................. 6
Tangible Outcomes for Industry ................................................................................................................................. 7 Norriseal Discussion .............................................................................................................................................11 The case for direct measurement ........................................................................................................................12
Introduction ..............................................................................................................................................................15 Literature Review .....................................................................................................................................................18
City of Fort Worth Natural Gas Air Quality Study (City of Fort Worth 2011) ...................................................18 Measurements of Methane Emissions at Natural Gas Production sites in the United States (Allen 2013) ....18 Final Report for Determining Bleed Rates for Pneumatic Devices in British Columbia (Prasino Group 2013) 19 Pneumatic Controller Emissions from a Sample of 172 Production Facilities (Oklahoma Independent Petroleum Association 2014) ...........................................................................................................................19 Assessment of Uinta Basin Oil and Natural Gas Well Pad Pneumatic Controller Emissions ............................20 Pneumatic Vent Gas Measurement (Van Vliet, 2018) ......................................................................................20
Sampling Plan - Baseline ...........................................................................................................................................20 Onsite Procedure - Baseline .....................................................................................................................................24
e-MEAS Procedure ............................................................................................................................................24 Calscan Procedure ............................................................................................................................................26 Data Custody Procedure ...................................................................................................................................28
Initial Results ............................................................................................................................................................30 Retrofit Sampling Plan ..........................................................................................................................................32
Fisher L2 Improved Relay Retrofit ....................................................................................................................32 Norriseal Retrofit Plan ......................................................................................................................................32 Retrofit Onsite Procedure – L2 Improved Relays .............................................................................................32 Retrofit Onsite Procedure – Norriseal 1001a ...................................................................................................34
Retrofit Results .........................................................................................................................................................34 L2 Retrofit Results ................................................................................................................................................35 Norriseal Results ...................................................................................................................................................37
Conclusions ...............................................................................................................................................................39 Next Steps .................................................................................................................................................................39 References ................................................................................................................................................................40 Appendix A: Anonymous Measurement Data ..........................................................................................................41

14
TABLES AND FIGURES
Table 1: L2 Relay Pre and Post Measurement Results (m3/hr FGE) ........................................................................... 6 Table 2: Mean and Median Values Fisher L2 and Norriseal 1001a ............................................................................ 8 Table 3: Level Controller Samples in Study versus Prasino Study ............................................................................10 Table 4: Level Controller Data Collection Template .................................................................................................23 Table 5: Baseline Data ..............................................................................................................................................41 Table 6: L2 Improved Relays, Pre and Post...............................................................................................................52 Table 7: Norriseal EVS Retrofits - Raw Data .............................................................................................................54 Figure 1: Visual representation of Field Samples in Pneumatic Vent Gas Measurement and GreenPath Level Controller Study .......................................................................................................................................................... 4 Figure 2: Histogram of L2 Vent Rate Illustrating “Fat Tail” of data ............................................................................ 5 Figure 3: Histogram of Reduction in Vent Rate from Improved Fisher L2 Relays ...................................................... 8 Figure 4: Fisher L2 (Improved) Level Controller Pneumatic Consumption vs. Dump Cycle Period............................ 9 Figure 5: Generic Process Control Loop ...................................................................................................................16 Figure 6: Level Controller Illustration .......................................................................................................................16 Figure 7: e-MEAS ......................................................................................................................................................25 Figure 8: e-MEAS deployed at site............................................................................................................................26 Figure 9: Calscan Hawk Meter Deployed at Site ......................................................................................................27 Figure 10: Fisher L2 Controller .................................................................................................................................28 Figure 11: e-MEAS™ Graphical Output Pressure (PSI)/Time (minutes)....................................................................29 Figure 12: Calscan Graphical Output ........................................................................................................................29 Figure 13: Histogram for L2 baseline samples ..........................................................................................................30 Figure 14: L2 Baseline Survey Box and Whisker Plot ................................................................................................31 Figure 15: Prasino Study L2 Box and Whisker Plot ...................................................................................................31 Figure 16: L2 Relay ....................................................................................................................................................33 Figure 17: Norriseal 1001a and EVS Pilot .................................................................................................................34 Figure 18: L2 Relays Pre and Post measurement .....................................................................................................35 Figure 19: Pre-Retrofit L2 Measurements ................................................................................................................35 Figure 20: Post Retrofit L2 Relays Histogram ...........................................................................................................36 Figure 21: Histogram of % reduction of Improved L2 Relays ...................................................................................36 Figure 22: Norriseal 1001a and EVS Retrofits Random Sample ...............................................................................37 Figure 23: Norriseal EVS Retrofit - High Emitters .....................................................................................................38

15
INTRODUCTION
Emissions from pneumatic devices have come under increasing scrutiny as industry strives to achieve a significant methane emission reduction by 2025. In most analyses, pneumatic devices are low-cost methods7 of achieving methane reductions. Most analysis that has garnered attention from regulators has failed to significantly differentiate pneumatic devices based on function and vintage. In the analysis, a generic “high-bleed” to “low-bleed” conversion is shown, generally ignoring reductions achievable by type (pressure, transducer, level, positioner, etc.).
For this study, the following pneumatic emission terms are defined:
Equation 1: Pneumatic Vent Rate
𝑉𝑉𝑉𝑉 = 𝐵𝐵𝑉𝑉 + 𝐷𝐷𝑉𝑉 + 𝑇𝑇𝑉𝑉
Total Vent Rate (Vr)= Vent Rate in normal operation Bleed Rate (Br) = pneumatic emission rate when there is no activity in the pneumatic control loop Dynamic Rate (Dr)= pneumatic emission rate when an action occurs – e.g. a dump valve actuation Transition Rate (Tr) = pneumatic emission rate when pneumatic device is resetting to steady state
In Canada, the 2013 Prasino Study is a landmark resource for determining emissions from pneumatic controllers. The author noted that variance in emissions from level controllers was significant and the variance was not adequately explained in the data captured in the study. In the Prasino Study data there were many zero values (and even in steady the L2 and Norriseal 1001a do vent) as well as some very high vent rates. The results from the Prasino Study on level controllers were also not well correlated with manufactures steady state “bleed rates”. When the detailed outputs from the Prasino Study were examined, oscillations in vent rate were detected and an appropriate explanation (likely dump frequency) needed to be examined.
In the summer of 2016, GreenPath Energy undertook a survey of over 700 oil and gas producing sites in Alberta, inventorying pneumatics, major emitting equipment, and surveys via Optical Gas Imaging (OGI). In this survey, GreenPath found that the most common pneumatic device was a level controller and that level controllers were typically either a Fisher L2 or Norriseal 1001a. The results of this analysis were similar to the landmark 2013 Prasino Study, which showed the Fisher L2 and Norriseal to be the most common. The Fisher L2 and the Norriseal 1001a each have equivalents in the Fisher L2sj (and now the improved L2-LL and L2-LG relays) and Norriseal EVS, respectively. The Fisher L2sj and the Norriseal EVS controller were not encountered during the 2013 Prasino Study nor the 2016 GreenPath Study.
This study seeks to provide a statistically valid emission rate for the two most common level controllers in Alberta as well as provide a greater understanding of the variance in emissions from the two most common level controllers as well as the emission reductions from the low-emission alternatives.
Pneumatic devices are common in western Canadian oil and gas operations for their durability and reliability. At most remote locations, fuel gas is used to supply the pneumatic pressure for the device to operate, whether controlling a process variable such as pressure, temperature, or level; or, injecting chemical into the production stream. Figure 5 illustrates the general parameters of a pneumatic device. In general, a pneumatic device (a controller, for example) responds to a change in process condition and changes the output to a final control element in response to the process change. Figure 6 below illustrates the operation of a level controller. The level controller determines when the dump valve operates in response to a liquid level change.
7 ICF cost curve study.

16
Based on previous field studies such as GreenPath Energy on Behalf of Alberta Energy Regulator (2017), the level controller appears to be the most common pneumatic device. Additional data from the Cap-Op Energy Methane Abatement Project Platform (Cap-Op Energy, 2018) indicates that level controllers are the most common pneumatic device, and that Fisher L2 outnumber Norriseal 1001a almost 4 to 1.
Figure 5: Generic Process Control Loop
Figure 6: Level Controller Illustration
SETPOINT
PROCESS
FINAL CONTROL ELEMENT
(Mechanically impacts process)
MEASUREMENT (Pressure, Temperature, Flow, pH, Conductivity, etc.)
Typical
“Feedback” Control
Baseline Variability
CONTROLLER (Provides increasing or
decreasing output based on offset of measured
variable from set point)

17
The pneumatic operation of level controllers was studied in detail. In a level control loop, liquid produced from the wellhead enters the separator at varying rates. The rates are impacted by the non-homogenous nature of the reservoir, the ratio of gas and liquid in the well bore, and the presence of plunger lifts.
The separator may be two-phase (gas-liquid separation) or three-phase (gas, oil/condensate, and water). One line is used to let the gas exit the vessel, and one or two liquid dump lines are used to let liquid exit the vessel. Normally, to ensure no liquid goes out the top of the vessel with the gas (and that no gas goes out the dump lines), the liquid level is controlled to a height range in between those two boundary conditions. In the case of a three-phase separator, a level controller is also used on the oil/condensate-water interface to ensure the water level never rises high enough to overflow the weir and contaminate the oil/condensate on the other side.
Separators may be oriented vertically or horizontally. For a fixed change in liquid level, vertical separators require less volume than horizontal separators and consequently dump more frequently because the surface area to volume ratio is much lower than that found horizontal separators.
Displacer sensing level controllers operate in three modes: steady state with no output pressure, transient, and full output. Where the level controller does not provide an output pressure to the dump valve actuator, it remains in steady state and the amount of gas vented is only the leakage across the seat in the relay.8
- “Steady state” refers to the bleed rate from manufacturers specifications. This is the loss of gas that occurs when the level controller is not affecting the level of fluid in the process.
- “Transient” refers to the emissions that occur when the device is resetting to the steady state or about to provide full output. Transient bleed rates are dependent on the application.
- “Full output” refers to emissions from the device when a dump event occurs. Emissions from dump events are well explained via Equation 2: Pneumatic Vent Rate Equation from (Oklahoma Independent Petroleum Association, 2014).
There are three pathways to reducing emissions from a level controller:
- Reducing the steady state rate (for example design changes from a Fisher 2900 to a Fisher L2). - Mitigating full output emissions by reducing the dump frequency via either changing vessel geometry or
widening control span. - Reducing transient emissions from re-design of the relay to make the device more pneumatically
efficient. The L2-LL and L2-LG relays are an example of an improvement in pneumatic efficiency. Less pneumatic energy is required to perform the same amount of work.
The Fisher L2sj relay reduces emissions via all three mechanisms.
8 Van Vliet 2018
18
LITERATURE REVIEW
CITY OF FORT WORTH NATURAL GAS AIR QUALITY STUDY (CITY OF FORT WORTH 2011)
The City of Fort Worth study on air emissions included a section on emissions from pneumatic devices. The Fort Worth study’s measurement tools were somewhat limited in that the Bacharach Hi-Flow Sampler was used on sources which modulate emissions such as level controllers. The Fort Worth Study asserted that 489 failed pneumatic valve controllers (likely level controllers) were encountered emitting continuously9. Whether these pneumatic controllers were malfunctioning, venting in the steady state condition, or in a high duty cycle could not be determined.
MEASUREMENTS OF METHANE EMISSIONS AT NATURAL GAS PRODUCTION SITES IN THE UNITED STATES (ALLEN 2013)
The 2013 David Allen/EDF study of methane emissions from natural gas production areas conducted direct measurement of pneumatic devices from well production sites in four producing locations in the United States. The Allen study emphasized the need for measurement upstream of the controller. In this study a portable mass flow meter was used to measure fuel gas consumption upstream of the control device. The study provided most of the raw data related to the study and analysis of this data was instrumental in helping GreenPath examine onsite sampling procedures and data collection procedures.
One element of the report curious to GreenPath was the assertion of equipment malfunction rates in the top 40 emitting devices in the study. Of the 40 highest emitting devices, 34 were level controllers, and the Allen study asserted that 27 of the 34 level controllers had “equipment issues”, emitting higher than expected. It appears that the assessment was not based on vent rate versus manufacturers’ specifications, but as makes and models of pneumatic devices were obscured for confidentiality, it could not be determined.
Using the same dataset. the observed malfunction rate was 21% (per Brian Van Vliet of Spartan Controls). The caveat with this observation is that it was difficult to assess the steady state bleed rate without reference to make and model of pneumatic devices.
The author of this study also examined the data from the 34 high emitting level controllers from Allen et al and found less than one third to be anomalies; again, without make and model information it is difficult to determine if emissions are from a malfunction or a high-emitting device such as a Fisher 2900. Overall, a dump valve actuating frequency is not a sign of a malfunctioning in most cases. In the case of frequent actuation, the device may be functioning properly, but the separator may be undersized, or the device not properly adjusted.
A compounding issue in this analysis was that the pneumatic controllers’ make and model were obscured; as such, we could not determine if certain level controllers were the same as those encountered in this study. Based on analysis of the fuel gas consumption curves in the Allen study as well as the author’s opinion, guesses could be made on make and model, but would provide little value to this study, other than similar level controllers are common on both sides of the border.
9 Fort Worth Natural Gas Air Quality Study – 3-100

19
FINAL REPORT FOR DETERMINING BLEED RATES FOR PNEUMATIC DEVICES IN BRITISH COLUMBIA (PRASINO GROUP 2013)
This report is misnamed as it does not speak to the bleed rate for pneumatic devices, as “bleed” represents the steady state fuel gas consumption rate of a pneumatic device. This study was one of the first studies to examine the total gas consumption of pneumatic device via the use of the Calscan Hawk positive displacement meter.
The most striking element of the Prasino Study from the author’s perspective, was the variability in emissions from level controllers and how significant the variance was in manufacturers’ bleed rates on level controllers in the results of the Prasino Study.
The sampling methodology in the Prasino Study called for 30 measurements and was the jumping off point for this study to acquire random samples for more than 30 devices in Alberta to develop a more robust emission factor for level controllers. Additionally, one of the major weaknesses of the Prasino Study was that samples were a convenience sample and the surveys were conducted in areas thought to have a high incidence of “high-bleed” controllers.
PNEUMATIC CONTROLLER EMISSIONS FROM A SAMPLE OF 172 PRODUCTION FACILITIES (OKLAHOMA INDEPENDENT PETROLEUM ASSOCIATION 2014)
The Oklahoma Study from 2014 has its weaknesses; most notably that no direct measurements were made during the study (actuations during the observation period were recorded). Emissions per device presented in the Oklahoma study were significantly lower than other sources. In addition, the samples obtained were not random, which erodes the value of the results presented. However, the Oklahoma study does provide a useful equation for estimating emissions from pneumatic devices with actuations.
Equation 2: Pneumatic Vent Rate Equation

20
ASSESSMENT OF UINTA BASIN OIL AND NATURAL GAS WELL PAD PNEUMATIC CONTROLLER EMISSIONS
A 2017 study led by Eben Thoma of the United States Environmental Protection Agency examined pneumatic controllers in the Uinta Basin (referred to as PC in the report) but did not use a system with data logging capabilities like the Calscan Hawk system or the e-MEAS system. Instead, Thoma used an enhanced Hi-Flow Sampler. The Thoma study was of limited value for this study as only seven level controllers were measured.
PNEUMATIC VENT GAS MEASUREMENT (VAN VLIET, 2018)
There is significant overlap between the 2018 Spartan Study and the 2018 GreenPath Energy Level Controller Study. The Pneumatic Vent Gas Measurement Study was primarily to draw attention to vent rates of components and differences/similarities between measured values of the e-MEAS and Calscan Hawk PD meters. The Spartan study included devices other than level controllers but did not include the Norriseal 1001a or other common level controllers within the sample.
One key finding from the Spartan study that was carried forward to this study was the correlation coefficient between dump frequency and emissions. The 2018 Van Vliet study showed that the correlation between dump frequency and emission had an R2 value of 0.46. Dump frequency is available from some Supervisory Control and Data Acquisition (SCADA) systems but is not a reliable metric to develop a vent rate.
SAMPLING PLAN - BASELINE
To develop a statistically valid sample of level controllers, a list of Fisher L2, Fisher L2sj, Norriseal 1001a and Norriseal EVS controllers had to be developed. From that list, a random selection of sites would be drawn. The randomization was necessary to ensure a good cross-section of operating conditions and reduce risk of bias.
This study focused on level controller emissions in Alberta, whereas the 2013 Prasino Study focused on pneumatic emissions in British Columbia. In British Columbia, a pneumatic inventory was strongly recommended is a requirement for the verification of reported GHG emissions under the Greenhouse Gas Industrial Reporting and Control Act (GGIRCA). In Alberta there is no such requirement for an inventory of pneumatics; consequentially, an inventory of pneumatics was more challenging to obtain.
GreenPath worked with Petroleum Technology Alliance of Canada (PTAC) members as well as non-PTAC members to develop a list of active sites with level controllers.
GreenPath managed to arrange a consortium of seven organizations, ranging from international oil companies to medium-sized domestic producers. Inventories provided to GreenPath showed that Fisher L2 and Norriseal 1001a controllers were abundant, but Fisher L2sj and Norriseal EVS controllers could not be located. Guidance from the Prasino Study and the Alberta Pneumatic Protocol suggested a minimum sample size of 30.
Equation 3: Sample size calculation when population size unknown
21
Variable Description n Sample size N Population size e Margin of error (as a decimal) z Confidence level (as a z-score) σ Population variance; estimate taken from sample
Equation 4: Margin of error when total population is unknown
The population of L2 level controllers based on the range of estimate of L2s in operation currently ranges between 5,000 and 40,000.10 Assuming the distribution of Fisher L2 to Norriseal 1001 from GreenPath Energy (2017) and Cap-Op Energy (2018), the potential number of Norriseal 1001 controllers may be 1,000 to 10,000.
As the sample size is unknown, the best formula for determining the number of samples for a representative sample relies upon knowing the population size. Equation 3 does not require a population size; it can be determined that a sample size of roughly 30 can be used to reduce the margin of error to 5%. However, caution must to be applied if the sample population approaches 5% of the total population. Given the approximate population of both the Fisher L2 and the Norriseal 1001a in Alberta, this does not represent a risk to the statistical tool. In the case of the L2 controllers, the margin of error is 2.65% (from 139 random samples). In the case of the Norriseal 1001a (34 random samples11) controllers, the margin of error is 5.34%.
In relation to the population of Fisher L2 controllers, three campaigns measured emissions from them. A challenge related to the data is that it is non-parametric or “normally distributed”. These three different random sample campaigns were then evaluated using the Kolmogorov-Smirnov test (KS test).12 The KS test does not rely upon normally distributed data. The KS test is a non-parametric test to determine if distributions are similar.
In terms of different random L2 sampling rounds, the second and third test were found to be similar using the KS test, but the first random sample was not similar to the second or third random samples. The third random sample used the Calscan Hawk measurement system as opposed to the e-MEAS system. A possible explanation would be that the first random sample included wells of newer Duvernay production and would likely have different liquid production rates.
GreenPath also worked with Spartan Controls and Alberta Oil Tool to develop a list of Fisher L2sj (L2sj) and Norriseal EVS (EVS) controller locations. The L2sj and EVS controller locations proved problematic, with the minimum volume of controller required for statistical significance not achieved. The eventual solution was to purchase Norriseal EVS retrofit controllers (in addition to the three donated by Alberta Oil Tool), obtain new Fisher L2-LL and L2-LG (donated by Spartan Controls) and conduct pre and post measurement on Fisher L2 and Norriseal EVS controllers identified in the first round of sampling.
10 Van Vliet 2018 11 In the initial sampling, 14 Norriseal Controllers were found, In the retrofit case 20 additional random samples were obtained, however in the retrofit case, two retrofits were removed because there was a dump event in the retrofit case but not the found in place condition. 12 http://www.real-statistics.com/non-parametric-tests/goodness-of-fit-tests/two-sample-kolmogorov-smirnov-test/

22
Sampling campaigns were stratified by producer; then, sites were randomized using the random number generator function in Microsoft Excel. Each site was assigned a random number and ranked. The site with the lowest highest number ranked first, down to the 15th (as generally there would-be two-level controllers per site).
For each producer, potential sites were randomized using a random number generator in Microsoft Excel. This list of sites was then reviewed with the producer, to ensure the sites listed were operating and accessible. Then, sites were mapped, and a survey plan was developed. If a site was shut in or inaccessible, a list of supplemental sites was provided to field crews.
After three months of planning, GreenPath began to execute field surveys using both the Spartan e-MEAS measurement and the Calscan Hawk 9000 measurement packages. For “Client A” in Appendix A: Anonymous Measurement Data, in some cases, the Spartan e-MEAS and the Calscan system were deployed at the same time to determine the effectiveness of the both devices in real world conditions. For more detail on the differences between the e-MEAS and Calscan system please refer to Van Vliet (2018). In other cases, operators had set preferences for the use of one measurement device over the other. Where both measurement devices were deployed, the e-MEAS based on the findings of Van Vliet.
Data collection procedures evolved over the course of the study. One notable change to procedures was to record whether the plunger was up in and whether the well was flowing during the test. As emissions from a level controller are driven by flow into the separator, every effort was made to test wells while flowing. In some situations, the operator would arrange for the well to be flowing during the testing procedure.
23
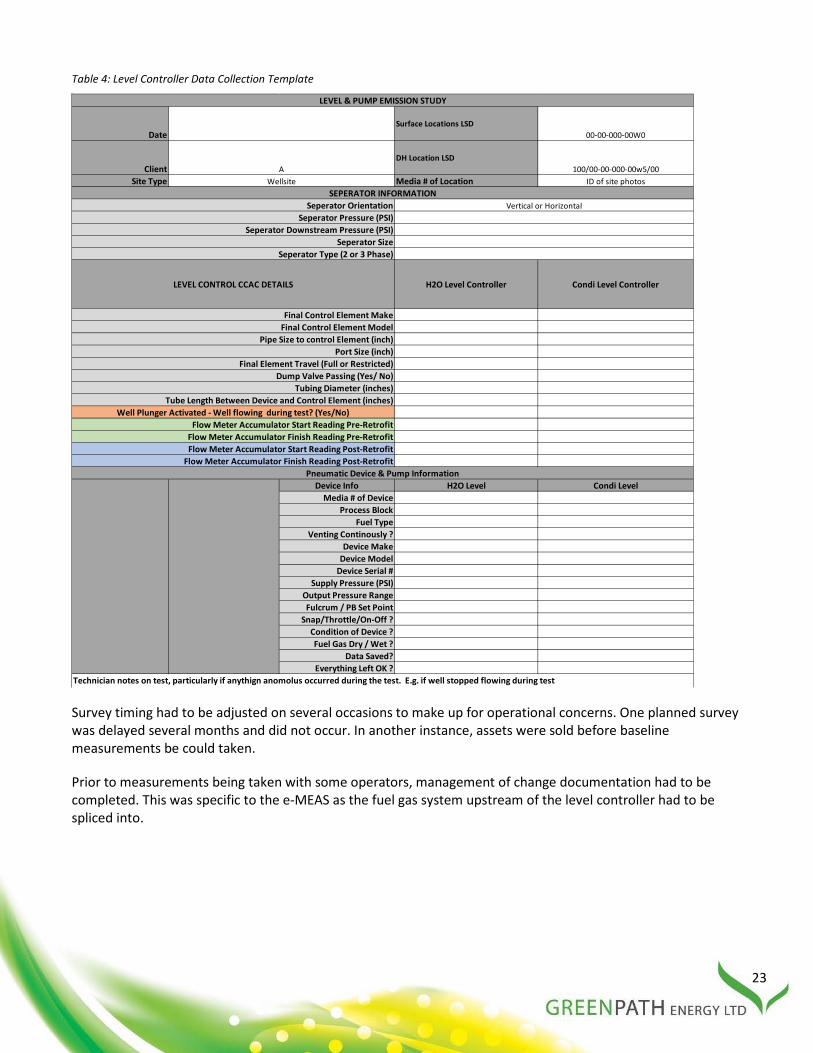
Table 4: Level Controller Data Collection Template
Survey timing had to be adjusted on several occasions to make up for operational concerns. One planned survey was delayed several months and did not occur. In another instance, assets were sold before baseline measurements be could taken.
Prior to measurements being taken with some operators, management of change documentation had to be completed. This was specific to the e-MEAS as the fuel gas system upstream of the level controller had to be spliced into.
DateSurface Locations LSD
00-00-000-00W0
ClientDH Location LSD
100/00-00-000-00w5/00Site Type Media # of Location ID of site photos
H2O Level Controller Condi Level Controller
Device Info H2O Level Condi LevelMedia # of Device
Process BlockFuel Type
Venting Continously ?Device Make
Device ModelDevice Serial #
Supply Pressure (PSI)Output Pressure RangeFulcrum / PB Set Point
Snap/Throttle/On-Off ?Condition of Device ?Fuel Gas Dry / Wet ?
Data Saved?Everything Left OK ?
Flow Meter Accumulator Start Reading Pre-RetrofitFlow Meter Accumulator Finish Reading Pre-RetrofitFlow Meter Accumulator Start Reading Post-Retrofit
Flow Meter Accumulator Finish Reading Post-RetrofitPneumatic Device & Pump Information
Technician notes on test, particularly if anythign anomolus occurred during the test. E.g. if well stopped flowing during test
Port Size (inch)Final Element Travel (Full or Restricted)
Dump Valve Passing (Yes/ No)Tubing Diameter (inches)
Tube Length Between Device and Control Element (inches)Well Plunger Activated - Well flowing during test? (Yes/No)
Seperator Type (2 or 3 Phase)
LEVEL CONTROL CCAC DETAILS
Final Control Element MakeFinal Control Element Model
Pipe Size to control Element (inch)
Seperator Pressure (PSI)Seperator Downstream Pressure (PSI)
Seperator Size
LEVEL & PUMP EMISSION STUDY
AWellsite
SEPERATOR INFORMATIONSeperator Orientation Vertical or Horizontal

24
ONSITE PROCEDURE - BASELINE
In all cases, emission technologists from GreenPath deployed for the measurements received training on the use of both the e-MEAS as well as the Calscan meter. All GreenPath emission technologists have considerable experience in detection and measurement of methane sources at oil and gas facilities as well as all requisite safety tickets and company-specific safety training.
In the GreenPath Level Study, both supply side (e-MEAS) and vent side (Calscan) measurement systems were employed; both the Allen Study and the Alberta Pneumatics protocol recommend that measurement occur prior to the control device for the most accurate results. The Calscan system can be deployed on the supply side because it is rated to 0.5 Kilopascals (Kpa) applied downstream, but one reason the Calscan system was deployed in this study was when an operator was uncomfortable with the fuel gas supply being spliced into.
A small number of the initial tests used the metric of three dump events to determine the time interval for the test. The testing procedure was later amended to be 30 minutes per test. The Allen Study used 15 minutes and the Prasino Study recommended that at least 10 minutes of measurement occur (and two dumps in the case of a level controller). In some cases, zero dump events were observed, so a 30-minute cut off was used to maintain consistency in the data.
E-MEAS PROCEDURE
The following procedure was executed:
- Communicate with operator of work plan, testing locations and obtain safe work permit. - Locate and confirm well location sign for correct site. Wear all required PPE. - Ensure proper fitting hearing and/or respiratory equipment is worn. - Complete on-site safety hazard assessment. - In a safe location, power on and set up meter equipment per testing conditions. - Complete data collection sheet shown in Table 4. - Set up all tools and measurement equipment to be used during measurement. - Verify pressure of compressed cylinders to ensure sufficient supply for test. - Perform visual inspection of pneumatic device to be measured and note current device supply pressure.
Understand what will happen to process when device is temporary taken out of service. Consider some ESD site functions are powered by the same fuel gas that supply other pneumatic devices.
- Trace pneumatic device fuel gas supply line back to pressure regulator. Either close upstream isolation valve, or back off pressure regulator adjustment nut. Double check pneumatic device and supply regulator pressure gauge to ensure supply gas has been depressurized.
- Disconnect supply instrument fitting from pneumatic device and plug supply gas line with threaded plug to ensure no gas is accidentally released. Always assume lines are pressurized.
- Connect e-MEAS high pressure hose via appropriate fittings and secondary pressure regulator to pneumatic device supply input.
- Pressurize pneumatic device by pressing START on e-MEAS panel. - Adjust secondary e-MEAS regulator to match the supply pressure that the pneumatic device was
originally found operating at. - Leave meter attached to device for appropriate amount of time to ensure a good measurement. - Before removing e-MEAS supply from pneumatic device, isolate secondary pressure regulator, and press
STOP on e-MEAS as to depressurize supply line. - Remove e-MEAS supply instrument fitting and supply hose from pneumatic device.
25
- Reconnect site supply fuel line back to pneumatic device. Ensure all fittings are tight and fitting threads are not cross-threaded. Re-supply pneumatic device by putting pneumatic device fuel gas regulator back in service.
- Download measurement data from e-MEAS and backup data to project test folder on laptop. - Clean up work area and secure equipment in truck. - When finished, contact operator and arrange to sign off safe work permit. - Upload data file to secure GreenPath server. - Analyze output.
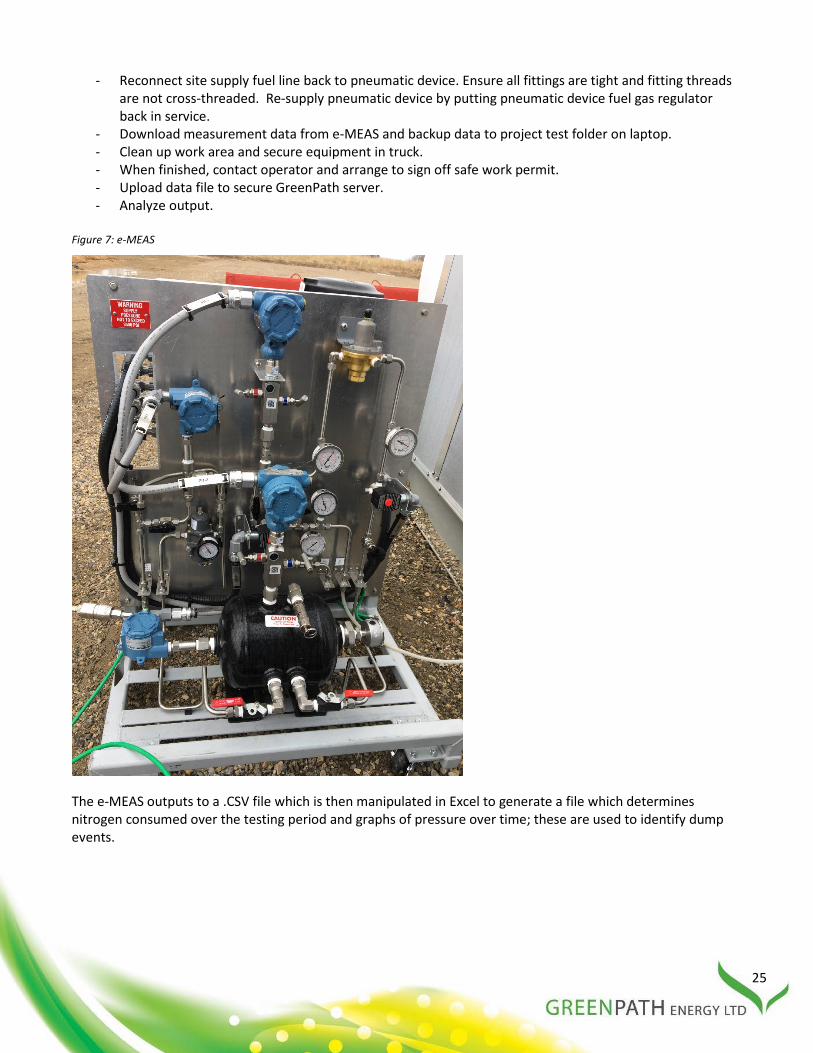
Figure 7: e-MEAS
The e-MEAS outputs to a .CSV file which is then manipulated in Excel to generate a file which determines nitrogen consumed over the testing period and graphs of pressure over time; these are used to identify dump events.

26
Figure 8: e-MEAS deployed at site
CALSCAN PROCEDURE
The procedure outlined below was followed:
a. Communicate with operator of work plan, testing locations and obtain safe work permit. b. Locate and confirm well location sign for correct site. Wear all required PPE. c. Ensure proper fitting hearing and/or respiratory equipment is worn. d. Complete on-site safety hazard assessment. e. Complete data collection sheet shown in Table 4. f. In a safe location, power on and set up meter equipment as per testing conditions. g. Set up all tools and measurement equipment to be used during measurement. h. Inspect pneumatic device case seal, vent and supply line via OGI. If leaks detected, do not conduct test. i. Trace vent line to ensure that correct vent line is measured. j. Attach Calscan vent measurement line to Calscan meter. k. Run meter for designated time. l. Turn off meter and remove vent line. m. Clean up work area and secure equipment in truck. n. Download data from Calscan to laptop. o. Upload data file to GreenPath secure server. p. Analyze output.

27
Figure 9: Calscan Hawk Meter Deployed at Site
One of the main advantages the e-MEAS has over the Calscan system relates to the concept of a case seal leak. If the seal around the door of the pneumatic controller is not tight, some gas will migrate through the case seal and a false low reading of the pneumatic device.
GreenPath procedure is to inspect the case seal as well as the supply line to the device via Optical Gas Imaging to ensure there is no leak in the case seal in the supply line. If a case seal leak is detected, reasonable efforts are made to correct the case seal leak. If the case seal leak cannot be resolved (with methane still bypassing the case seal), measurement of the device is abandoned, and a new device is selected from the randomized list.
28
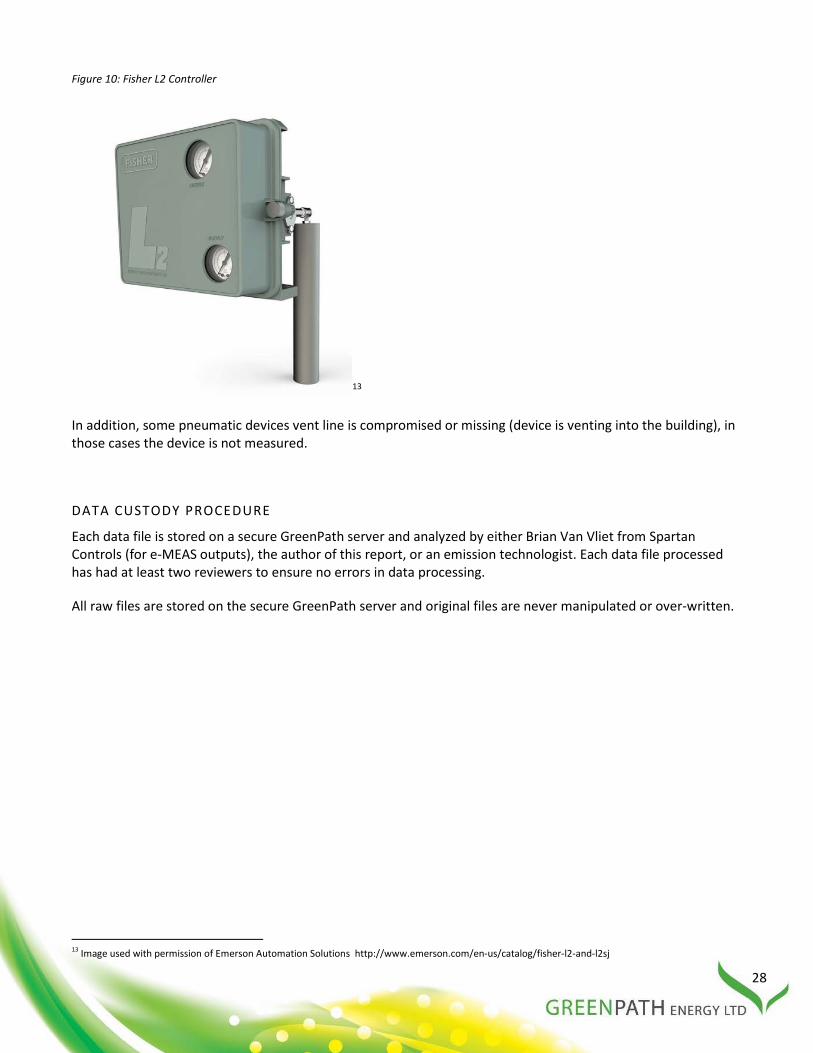
Figure 10: Fisher L2 Controller
13
In addition, some pneumatic devices vent line is compromised or missing (device is venting into the building), in those cases the device is not measured.
DATA CUSTODY PROCEDURE
Each data file is stored on a secure GreenPath server and analyzed by either Brian Van Vliet from Spartan Controls (for e-MEAS outputs), the author of this report, or an emission technologist. Each data file processed has had at least two reviewers to ensure no errors in data processing.
All raw files are stored on the secure GreenPath server and original files are never manipulated or over-written.
13 Image used with permission of Emerson Automation Solutions http://www.emerson.com/en-us/catalog/fisher-l2-and-l2sj

29
Figure 11: e-MEAS™ Graphical Output Pressure (PSI)/Time (minutes)
Figure 12: Calscan Graphical Output

30
INITIAL RESULTS
One of the most significant challenges in this study was the inaccuracy of level controller makes and models. GreenPath executed three different campaigns in areas thought to be high in Norriseal 1001a controllers but secured either additional Fisher L2 controllers or older Fisher level controllers. In the total baseline campaign, a total of 139 L2 samples were acquired; however, this only included 14 Norriseal 1001a samples. The 14 Norriseal samples from the initial results would be considered too small a sample size to draw meaningful inferences about the total population.
Figure 13: Histogram for L2 baseline samples
Figure 13 above shows the histogram for the baseline samples from the L2 relays sampled in the field. The visualization shows that the average value is significantly influenced by the higher values. In terms of measures of central tendency, the median value is 0.25m3/hr, whereas the arithmetic mean is 0.389 m3/hr. The data does not follow a “normal” distribution; as such, the range of statistical tests that can be applied to the data is limited to “non-parametric” tests.
In addition, the box and whisker plot show the data reasonably well clustered between 0.05m3/hr and 0.6 m3 per hour. This box and whisker plot is remarkably like the box and whisker plot from the 2013 Prasino Study, despite the differences in measurement tools.

31
Figure 14: L2 Baseline Survey Box and Whisker Plot
Figure 15: Prasino Study L2 Box and Whisker Plot
Note: Interpreting box and whisker plots: 1. The top “whisker” represents the top 25% of the data 2. The bottom “whisker” represents the bottom 25% of the data 3. The box represents 50% of the data 4. The horizontal line within the box represents the median 5. The X represents the mean (average) value within the data.
32
RETROFIT SAMPLING PLAN
One of the primary challenges in this project was confirmation of location of Fisher L2sj and Norriseal EVS controllers. Pneumatic inventories did not contain the two devices, and a small sample of eight EVS and one L2sj was located in southeast Alberta, but this sample size did not constitute a statistically valid sample and agreement and timing with the operator of the wells could not be obtained.
To account for the lack of field samples, GreenPath first examined using bench tests to simulate field conditions, set up the separator testing apparatus at Spartan Controls to recreate the process conditions encountered during the random field measurement campaigns, and swapped out the standard controller/relay for the improved relay. Bench tests at Spartan Controls showed good performance from the L2 and L2sj as well as the improved L2-LL and L2-LG relays, but bench tests are no substitute for field deployment. GreenPath sought additional funds to purchase improved relays and conduct additional tests. Spartan Controls donated all 30 improved relays and Alberta Oil Tool donated three relays and retrofit kits, respectively, to make this project possible within budget constraints.
The first round of sampling showed that high-rate level controllers represented a crucial element of the emission profile of level controllers that needed a resolution. If the improved relays and retrofit kits did not have significant impact on emissions of these high-emission cases, the relays would be of lesser value. Based on bench tests, it was apparent that high-rate level controllers had strong reductions from improved relays.
FISHER L2 IMPROVED RELAY RETROFIT
GreenPath reviewed the list of highest-emitting L2 level controllers and contacted representatives from participant companies about trialing the improved relays on their highest emitting units. Two companies were able to offer up sites (one with pre-measurements via e-MEAS; one with pre-measurements via Calscan). Unfortunately, scheduling issues resulted in the Calscan operator being unable to participate in the program.
NORRISEAL RETROFIT PLAN
Of the Norriseal controllers surveyed during the baseline, a sufficient number of Norriseal samples were not found (14) and the operators with measured Norriseals were unable to participate in the retrofit component of the study. GreenPath had to work with several producers to identify possible sites for Norriseal retrofits. The Norriseal sites were again a random sample based on site data provided to GreenPath by operators.
RETROFIT ONSITE PROCEDURE – L2 IMPROVED RELAYS
The same measurement procedures as per the section on e-MEAS Procedure were followed, with the exception that the system data logger and gas supply were turned off during the change in relays. In cases where the separator vessel was flowing quickly, the valve was manually stroked to ensure that the high-level shutdown switch was not tripped in the separator. The relay was generally installed in under ten minutes without disrupting the process.
The improved relays are specific to the type of service. The Liquid-Gas relay should only be used on the liquid-gas interface and similarly the Liquid-Liquid relay should only be used on a liquid-liquid interface. The Liquid-Gas (L2-LG) relay has zero transition bleed, minimizes gas consumption at all linkage settings, and provides the operator with the ability to widen the span of the vessel for additional gas savings in the form of fewer dump cycles. The Liquid-Liquid (L2-LL) relay allows the controller linkage to be adjusted to the most

33
advantageous span setting for reduced gas consumption while maintaining the desired vessel span. It has elevated pneumatic gain relative to the original L2 and reduced transition bleed.
When the relay was in place, the data logger on the e-MEAS was re-engaged and results recorded. In both cases, a 30-minute test was completed. GreenPath has followed up with the operator to ensure the installed improved relays are still performing after the installation and the relays are still performing well. The operator is now deploying a broad implementation of the new relays.
The same data sheet was filled in per Table 4: Level Controller Data Collection Template, as it includes the required fields for the retrofits.
The improved relay reduces emissions via three mechanisms:
- Tighter tolerances reduce static bleed. - Wider level span reduces dump frequency but requires change in the buoyant force on the displacer for
the LC to provide output to the dump valve. - Relay re-engineered to reduce the transient state emissions.
Figure 16: L2 Relay
14
In the case of the relays, the relay number (stamped on the relay) was recorded as the pneumatic device was not completely changed. Subsequent retrofits’ special tags should be affixed to easily identify the low-emission level controllers. Coloured dots on the relay shown in Figure 16: L2 Relay identify the L2-LL and L2-LG relay.
14 Image used with permission from Emerson Automation Solutions http://www.emerson.com/documents/automation/instruction-manual-fisher-l2-liquid-level-controllers-en-135074.pdf (page 8)

34
RETROFIT ONSITE PROCEDURE – NORRISEAL 1001A
In the case of the Norriseal Retrofits, operators were inconsistent as to whether they wished to use the e-MEAS or the Calscan. Onsite procedures were the same as the procedures illustrated in the e-MEAS Procedure and Calscan Procedure. In the case of the Calscan measurement, the Calscan System remained connected and operating during the retrofit kit installation. EVS Retrofit kits can be installed in-situ; in the case of separators with high liquid production rates, the valve can be manually stroked while the installation takes place.
GreenPath was able to obtain an additional data set from a producer who measured a large number of pneumatic devices via the e-MEAS package. In this case, the producer changed the high-emitting level controllers and not a random array of level controllers.
The pre and post measurements did not occur on the same day, as per the random Norriseal EVS retrofits. The post retrofit measurement occurred roughly six weeks after initial measurements (two weeks after the retrofits).
Figure 17: Norriseal 1001a and EVS Pilot
15
RETROFIT RESULTS
Overall, both the improved Fisher L2 relay as well as the Norriseal EVS retrofits performed well, reducing emissions by a significant margin. The L2 relay results show a more consistent pattern of reductions. The L2 retrofit dataset was drawn from a sample of high-emitting level controllers. The Norriseal retrofit sample was drawn at random, plus an additional 7 sites provided by a producer. The seven non-random Norriseal retrofits were provided to GreenPath for this study on the condition that the company was not named and the data remained anonymous.
15 http://norrisealwellmark.com/wp-content/uploads/2016/09/NOR_Series_EVS_Brochure_092616-1.pdf
35
L2 RETROFIT RESULTS
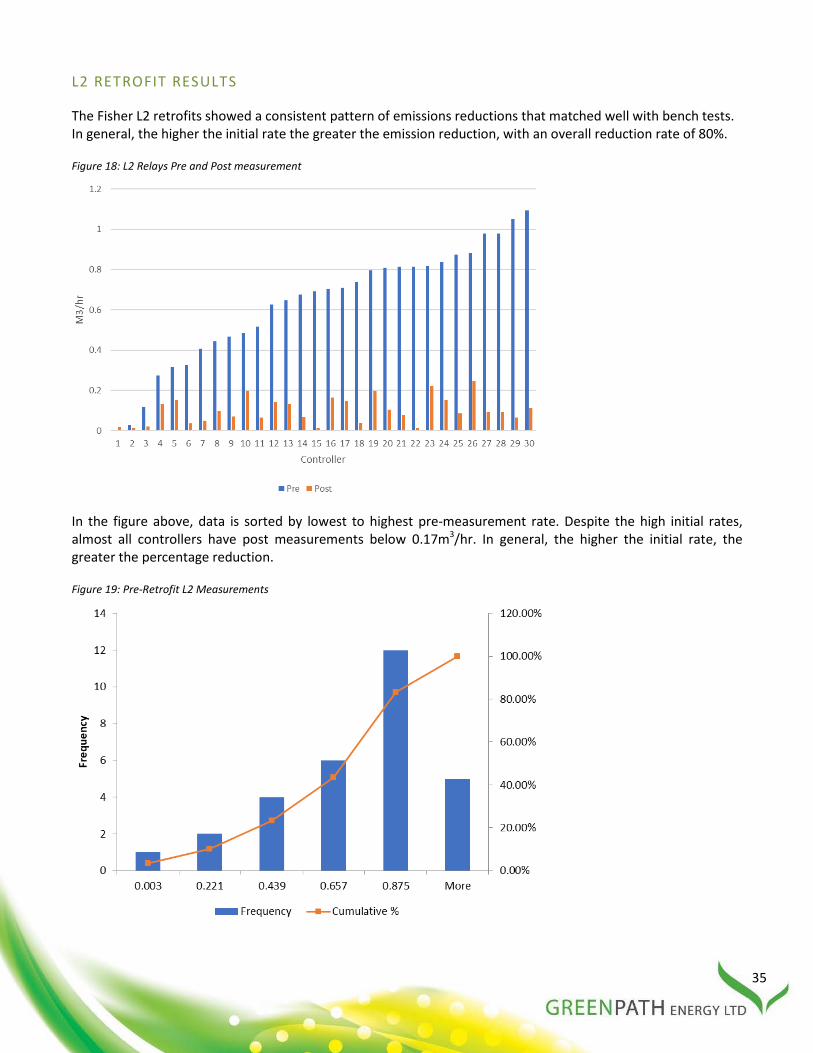
The Fisher L2 retrofits showed a consistent pattern of emissions reductions that matched well with bench tests. In general, the higher the initial rate the greater the emission reduction, with an overall reduction rate of 80%.
Figure 18: L2 Relays Pre and Post measurement
In the figure above, data is sorted by lowest to highest pre-measurement rate. Despite the high initial rates, almost all controllers have post measurements below 0.17m3/hr. In general, the higher the initial rate, the greater the percentage reduction.
Figure 19: Pre-Retrofit L2 Measurements

36
The retrofit sample was pulled from several high-emitting level controllers with operator A. A total of 20 samples had been measured in the original measurement campaign. The original re-measurement list was adjusted based on conditions (some sites were down or inaccessible). Additional opportunistic samples were used to fill out the sample pool based on operators’ estimates of high-emitting sites. These opportunistic samples were the “low” pre-retrofit measurements.
Figure 20: Post Retrofit L2 Relays Histogram
The results of the post-measurement relay show the closest dataset to a normal distribution. A consistent pattern of emissions reductions was shown across the retrofit sample group.
Figure 21: Histogram of % reduction of Improved L2 Relays

37
NORRISEAL RESULTS
The Norriseal retrofit populations must be parsed into two separate samples.
The first sample was from the PTAC level controller study and was obtained by working with a wide array of producers to develop a potential list of Norriseal 1001a retrofit controllers. As these sites were not part of the original sample group there was no way to pre-select for the high emitters. GreenPath worked with producers to obtain liquid production rates for the subject locations but were unable to obtain production information consistently; as such, a random sample of locations was developed to increase the sample size for Norriseal 1001a controllers and test the effectiveness of the Norriseal EVS retrofit kit. The results from this sample set are mixed, with the majority of baseline samples indicating rates well below the targeted values of the L2 retrofit campaign. Additionally, process conditions at the site meant that two of the retrofit results had to be removed. In those cases, a slug of liquid came through the controller after the retrofit and thus pre-measurement and post -measurement could not be considered equivalent. These samples are highlighted in red in Figure 22 below.
The second Norriseal retrofit dataset is smaller in size but was a more suitable pre-measurement sample, as only high-emitting devices were converted with the EVS retrofit kits.
Figure 22: Norriseal 1001a and EVS Retrofits Random Sample
In the random retrofit dataset, only one of the pre-measurement samples could be considered of interest. As only baseline site sample, number 11 was greater than 0.17m3/hr.
After the conclusion of the random Norriseal 1001a sampling, GreenPath worked with a producer to measure all pneumatic level controllers in two subject fields in Alberta. During these measurements, several high-emitting Norriseal controllers were identified. As shown in Figure 23 below, in these cases, a reduction of over 90% was achieved via the installation of the EVS retrofit kits.
This dataset is, however, not of the same quality as the L2 relay changes due to the time elapsed between pre and post measurement and to limited sample size. The results are nonetheless promising and suggest that reductions from the application of the EVS retrofit kit will have a positive impact on the emissions from the Norriseal controller.
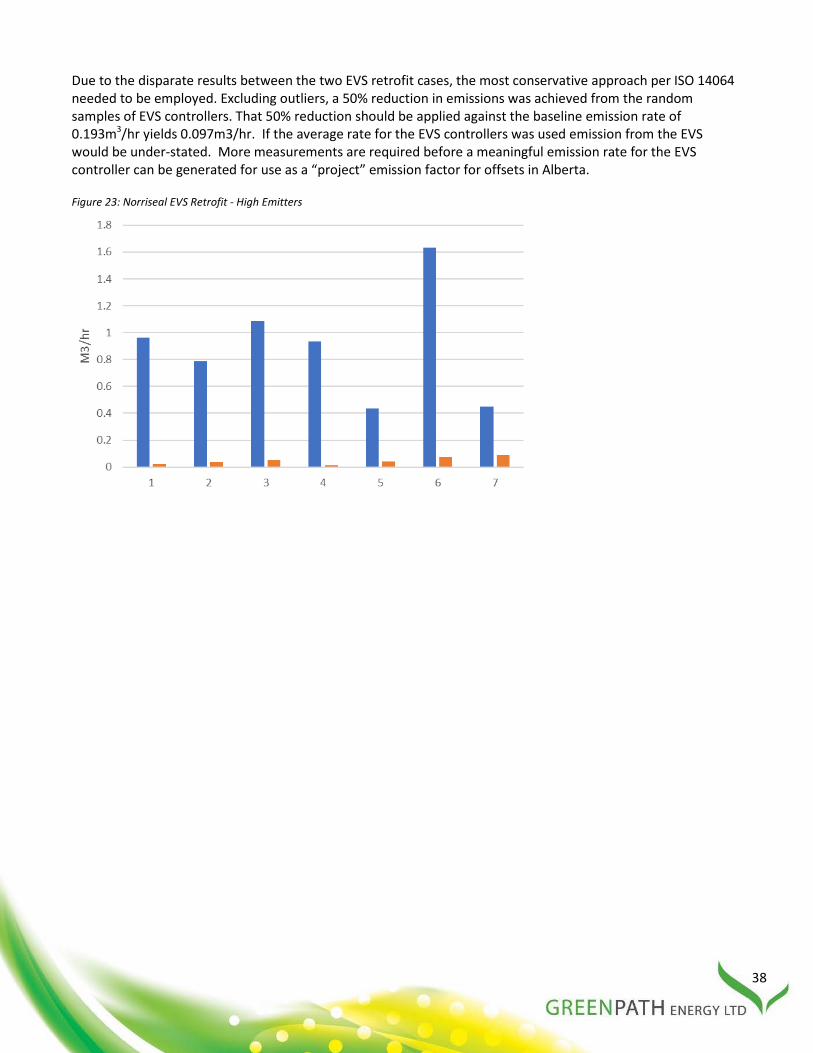
38
Due to the disparate results between the two EVS retrofit cases, the most conservative approach per ISO 14064 needed to be employed. Excluding outliers, a 50% reduction in emissions was achieved from the random samples of EVS controllers. That 50% reduction should be applied against the baseline emission rate of 0.193m3/hr yields 0.097m3/hr. If the average rate for the EVS controllers was used emission from the EVS would be under-stated. More measurements are required before a meaningful emission rate for the EVS controller can be generated for use as a “project” emission factor for offsets in Alberta.
Figure 23: Norriseal EVS Retrofit - High Emitters

39
CONCLUSIONS
The primary objective of this study was to generate an emission factor for the most common low-emission level controllers: Fisher L2sj and the Norriseal EVS. Due to challenges in locating these devices, the improved Fisher L2 relays (L2-LL and L2-LG) were piloted in place of the L2sj. The data captured regarding the improved Fisher L2 relays is of high quality as it represents the entire known population of operating relays when this report was finalized. The emission factor for the improved relays is of good quality and likely would over-estimate emissions from a broad deployment (as they were trialed in a high-emitting population).
This study demonstrates that the improved Fisher relays have generated significant emission reduction relative to existing L2 relays. Baseline and project samples are adequate to support a “baseline” and “project” emission factor under the Alberta Pneumatics Protocol. The study also provides a reasonable baseline estimate of emissions from the Norriseal 1001a. The data related to the Norriseal EVS retrofits is of a lesser quality than the Fisher L2 relay changes, but still suggests that the EVS retrofit is an effective mechanism for reducing emissions from a Norriseal 1001a in an active control loop.
The emission factors for the improved L2 relay are sufficient to be used as an updated emission factor in BC WCI methodology and could be used to support GHG reductions from the improved relays under the Clean Infrastructure Royalty Credit Program.
Device Devices Sampled
% of Population Sampled
Average (m3/hr FG)
Median (m3/hr FG)
Standard Deviation
%Error16
Fisher L2 139 0.3-1.4 0.387 0.248 0.399 2.65 Spartan L2 relays 30 100 0.100 0.097 0.06 n/a Norriseal 1001a 74 0.33 -3.4- 0.193 0.045 0.397 5.34 Norriseal EVS 17 26 >3.4% 0.09718 0.032 0.020 n/a 19 GreenPath’s experience in this project as well as subsequent work with producers has shown that if a retrofit program is pursued regarding level controllers, a measurement campaign of high-emitting controllers represents the strongest economic course of action. Not all level controllers are high emitters, but there are high-emitting level controllers with compelling economic arguments for retrofit or replacement.
NEXT STEPS
More data should be gathered from Norriseal 1001a units retrofitted to EVS following the procedures outlined in this document. When a sufficiently significant sample has been derived, the factors can be employed for use in the Alberta pneumatics protocol and relevant reporting programs that allow for the use of emission rates that have been determine for the Alberta pneumatics protocol.
An anonymous dataset related to this study has been made available in Appendix A. As more data is compiled through measurement campaigns, this data should be updated with the goal to have all level controllers with published emission factors based on total vent rate. This dataset could be maintained by PTAC and referenced by the pneumatics protocol and upcoming AER reporting requirements. 16 As defined in Equation 4: Margin of error when total population is unknown 17 Two samples were excluded as the baseline and retrofit condition were not functionally equivalent. 18 Due to the principle of conservativeness a rate of 0.097m3/hr should be employed for EVS controller due to the issues with the data set.. Average value observed was 0.032m3/hr but this likely understates the broad application of the EVS to the total 1001a population. 19 % error cannot be calculated as the population of EVS controllers is highly speculative.

40
REFERENCES
Alberta Environment and Parks. (2017, January 25). Offset Credit System Protocols. Retrieved from Climate Change: http://aep.alberta.ca/climate-change/guidelines-legislation/specified-gas-emitters-regulation/documents/PneumaticDevices-Jan25-2017.pdf
Allen, D. T., Pacsi, A. P., Sullivan, D. W., Zavala-Araiza, D., Harrison, M., Keen, K., . . . Seinfeld, J. H. (2015, December 9). Methane Emissions from Process Equipment at Natural Gas Production Sites in the United States: Pneumatic Controllers. Environmental Science and Technology, pp. 633-640. Retrieved from http://pubs.acs.org/doi/abs/10.1021/es5040156
Cap-Op Energy. (2018). Pneumatic Inventory Study. Calgary. Retrieved from http://aer.ca/documents/about-us/Cap-opStudy-Methane.pdf
Eben D. Thoma, P. D. (2017). Assessment of Uinta Basin Oil and Natural Gas Well Pad Pneumatic Controller Emissions. Journal of Environmental Protection, 394-415.
GreenPath Energy on Behalf of Alberta Energy Regulator. (2017). Survey of Wellsites and Batteries in Alberta. Retrieved from http://www.greenpathenergy.com/wp-content/uploads/2017/03/GreenPath-AER-Field-Survey-Results_March8_Final_JG.pdf
James A. Littlefield, J. M. (2017). Synthesis of recent ground-level methane emission measurementsfrom the U.S. natural gas supply chain. Journal of Cleaner Production, 118-126.
Oklahoma Independent Petroleum Association. (2014). Pneumatic Controller Emissions from a Sample of 172 Production Facilities. Retrieved from http://www.oipa.com/page_images/1418911081.pdf
Prasino Group. (2013). Final Report for Determining Bleed Rates for Pneumatic Devices in British Columbia.
Van Vliet, B. (2018). Pneumatic Vent Gas Measurement. Calgary: PTAC. Retrieved from http://auprf.ptac.org/wp-content/uploads/2018/04/Pneumatic-Vent-Gas-Measurement-1.pdf

41
APPENDIX A: ANONYMOUS MEASUREMENT DATA Table 5: Baseline Data
Campaign Op Code
Unit Unique ID
Instrument Make
Instrument Model
Service Measure-ment Date
Blind Location
Measure-ment Device
Methane Gas Equivalent (m3/hr)
A Random S 1 S1 Fisher L2 Condensate Level 2017-04-17 1 e-MEAS 0.0299 A Random S 2 S2 Fisher L2 H20 Level 2017-04-17 1 e-MEAS 0.2545 A Random S 3 S3 Fisher L2 Condensate Level 2017-04-24 2 e-MEAS 0.7935 A Random S 4 S4 Fisher L2 Condensate Level 2017-04-24 2 e-MEAS 0.1834 A Random S 5 S5 Fisher L2 H20 Level 2017-04-24 2 e-MEAS 1.1753 A Random S 6 S6 Fisher L2 Water Level 2017-04-24 2 e-MEAS 0.6288 A Random S 7 S7 Fisher L2 Condensate Level 2017-04-19 3 e-MEAS 1.4971 A Random S 8 S8 Fisher L2 Condensate Level 2017-04-19 3 e-MEAS 1.3549 A Random S 9 S9 Fisher L2 Condensate Level 2017-04-19 3 e-MEAS 0.8871 A Random S 10 S10 Fisher L2 H20 Level 2017-04-19 3 e-MEAS 1.4897 A Random S 11 S11 Fisher L2 H20Level 2017-04-19 3 e-MEAS 1.5046 A Random S 12 S12 Fisher L2 H20Level 2017-04-19 3 e-MEAS 1.4971 A Random S 13 S13 Fisher L2 Condensate Level 2017-04-13 5 e-MEAS 0.5390 A Random S 14 S14 Fisher L2 Condensate Level 2017-04-17 5 e-MEAS 0.7561 A Random S 15 S15 Fisher L2 H20 Level 2017-04-13 5 e-MEAS 1.0779 A Random S 16 S16 Fisher L2 Condensate Level 2017-04-21 6 e-MEAS 1.2277 A Random S 17 S17 Fisher L2 H20 Level 2017-04-21 6 e-MEAS 0.6176 A Random S 18 S18 Fisher L2 Condensate Level 2017-04-13 7 e-MEAS 0.3518 A Random S 19 S19 Fisher L2 Condensate Level 2017-04-23 8 e-MEAS 1.3175 A Random S 20 S20 Fisher L2 H20 Level 2017-04-23 8 e-MEAS 0.3219 A Random S 21 S21 Fisher L2 Condensate Level 2017-04-18 9 e-MEAS 0.8421 A Random S 22 S22 Fisher L2 H20 Level 2017-04-18 9 e-MEAS 0.5090 A Random S 23 S23 Fisher L2 Condensate Level 2017-04-17 10 e-MEAS 0.0112 A Random S 24 S24 Fisher L2 H20 Level 2017-04-17 10 e-MEAS 0.9170
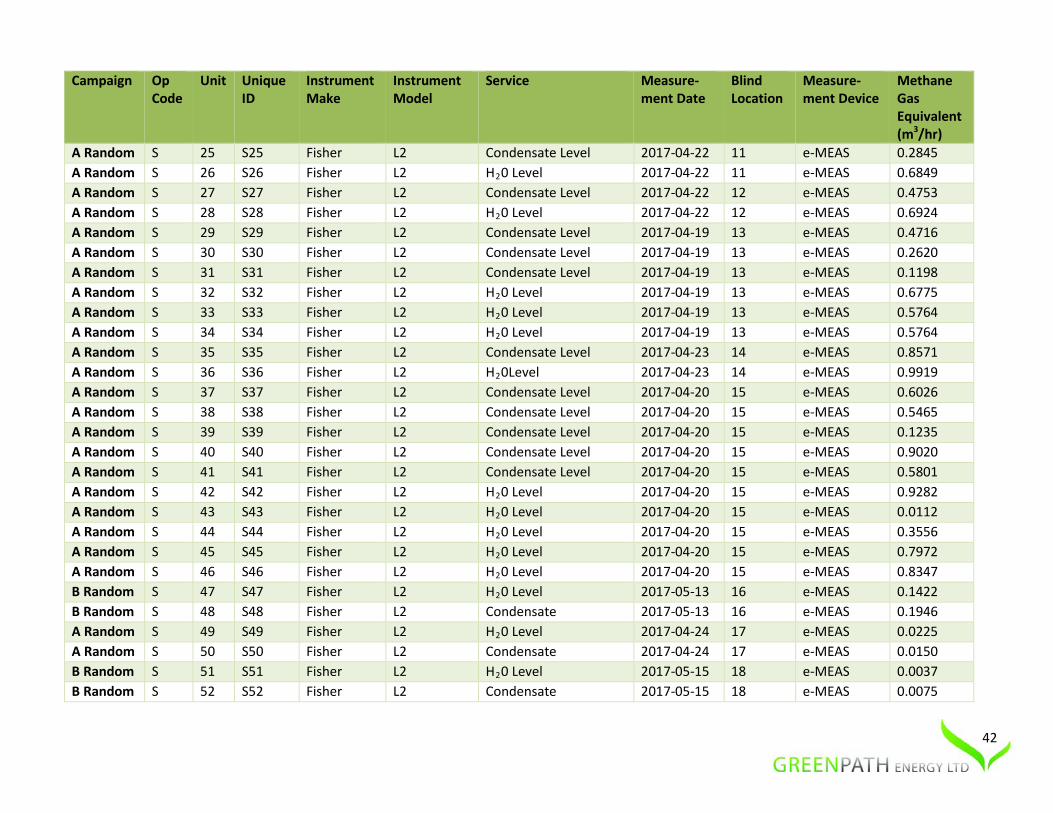
42
Campaign Op Code
Unit Unique ID
Instrument Make
Instrument Model
Service Measure-ment Date
Blind Location
Measure-ment Device
Methane Gas Equivalent (m3/hr)
A Random S 25 S25 Fisher L2 Condensate Level 2017-04-22 11 e-MEAS 0.2845 A Random S 26 S26 Fisher L2 H20 Level 2017-04-22 11 e-MEAS 0.6849 A Random S 27 S27 Fisher L2 Condensate Level 2017-04-22 12 e-MEAS 0.4753 A Random S 28 S28 Fisher L2 H20 Level 2017-04-22 12 e-MEAS 0.6924 A Random S 29 S29 Fisher L2 Condensate Level 2017-04-19 13 e-MEAS 0.4716 A Random S 30 S30 Fisher L2 Condensate Level 2017-04-19 13 e-MEAS 0.2620 A Random S 31 S31 Fisher L2 Condensate Level 2017-04-19 13 e-MEAS 0.1198 A Random S 32 S32 Fisher L2 H20 Level 2017-04-19 13 e-MEAS 0.6775 A Random S 33 S33 Fisher L2 H20 Level 2017-04-19 13 e-MEAS 0.5764 A Random S 34 S34 Fisher L2 H20 Level 2017-04-19 13 e-MEAS 0.5764 A Random S 35 S35 Fisher L2 Condensate Level 2017-04-23 14 e-MEAS 0.8571 A Random S 36 S36 Fisher L2 H20Level 2017-04-23 14 e-MEAS 0.9919 A Random S 37 S37 Fisher L2 Condensate Level 2017-04-20 15 e-MEAS 0.6026 A Random S 38 S38 Fisher L2 Condensate Level 2017-04-20 15 e-MEAS 0.5465 A Random S 39 S39 Fisher L2 Condensate Level 2017-04-20 15 e-MEAS 0.1235 A Random S 40 S40 Fisher L2 Condensate Level 2017-04-20 15 e-MEAS 0.9020 A Random S 41 S41 Fisher L2 Condensate Level 2017-04-20 15 e-MEAS 0.5801 A Random S 42 S42 Fisher L2 H20 Level 2017-04-20 15 e-MEAS 0.9282 A Random S 43 S43 Fisher L2 H20 Level 2017-04-20 15 e-MEAS 0.0112 A Random S 44 S44 Fisher L2 H20 Level 2017-04-20 15 e-MEAS 0.3556 A Random S 45 S45 Fisher L2 H20 Level 2017-04-20 15 e-MEAS 0.7972 A Random S 46 S46 Fisher L2 H20 Level 2017-04-20 15 e-MEAS 0.8347 B Random S 47 S47 Fisher L2 H20 Level 2017-05-13 16 e-MEAS 0.1422 B Random S 48 S48 Fisher L2 Condensate 2017-05-13 16 e-MEAS 0.1946 A Random S 49 S49 Fisher L2 H20 Level 2017-04-24 17 e-MEAS 0.0225 A Random S 50 S50 Fisher L2 Condensate 2017-04-24 17 e-MEAS 0.0150 B Random S 51 S51 Fisher L2 H20 Level 2017-05-15 18 e-MEAS 0.0037 B Random S 52 S52 Fisher L2 Condensate 2017-05-15 18 e-MEAS 0.0075

43
Campaign Op Code
Unit Unique ID
Instrument Make
Instrument Model
Service Measure-ment Date
Blind Location
Measure-ment Device
Methane Gas Equivalent (m3/hr)
B Random S 53 S53 Fisher L2 Condensate 2017-05-12 19 e-MEAS 0.0037 B Random S 54 S54 Norriseal 1001A H20 Level 2017-05-12 19 e-MEAS 0.0599 B Random S 55 S55 Fisher L2 Condensate Level 2017-05-14 20 e-MEAS 0.2470 B Random S 56 S56 Fisher L2 H20 Level 2017-05-14 20 e-MEAS 0.4267 B Random S 57 S57 Fisher L2 Condensate 2017-05-12 21 e-MEAS 0.2508 B Random S 58 S58 Fisher L2 H20 Level 2017-05-12 21 e-MEAS 0.4080 B Random S 59 S59 Fisher L2 Condensate 2017-05-14 22 e-MEAS 0.0337 B Random S 60 S60 Fisher L2 H20 Level 2017-05-14 22 e-MEAS 0.0112 B Random S 61 S61 Fisher L2 Condensate 2017-05-13 23 e-MEAS 0.1871 B Random S 62 S62 Fisher L2 H20 Level 2017-05-13 23 e-MEAS 0.5577 B Random S 63 S63 Norriseal 1001A Condensate 2017-05-12 24 e-MEAS 0.1385 B Random S 64 S64 Norriseal 1001A H20 Level 2017-05-12 24 e-MEAS 0.0037 B Random S 65 S65 Norriseal 1001A Condensate 2017-05-13 25 e-MEAS 0.2133 B Random S 66 S66 Norriseal 1001A H20 Level 2017-05-13 25 e-MEAS 0.0487 A Random S 67 S67 Fisher L2 Condensate 2017-04-22 26 e-MEAS 0.0075 A Random S 68 S68 Fisher L2 H20 Level 2017-04-22 26 e-MEAS 0.0000 B Random S 69 S69 Fisher L2 Condensate 2017-05-16 27 e-MEAS 0.0000 B Random S 70 S70 Fisher L2 H20 Level 2017-05-16 27 e-MEAS 0.0000 B Random S 71 S71 Fisher L2 Condensate 2017-05-16 28 e-MEAS 0.0749 B Random S 72 S72 Fisher L2 H20 Level 2017-05-16 28 e-MEAS 0.0749 B Random S 73 S73 Fisher L2 Condensate 2017-05-14 29 e-MEAS 0.1759 B Random S 74 S74 Fisher L2 H20Level 2017-05-14 29 e-MEAS 0.0011 B Random S 75 S75 Fisher L2 H20 Level 2017-05-16 30 e-MEAS 0.0487 B Random S 76 S76 Fisher L2 Condensate 2017-05-16 30 e-MEAS 0.0000 B Random S 77 S77 Fisher L2 H20 Level 2017-05-15 31 e-MEAS 0.0150 B Random S 78 S78 Fisher L2 H20 Level 2017-05-16 27 Calscan 0.5275 B Random S 79 S79 Fisher L2 Condensate 2017-05-16 27 Calscan 0.0511 B Random S 80 S80 Fisher L2 H20 Level 2017-05-16 32 Calscan 0.0127

44
Campaign Op Code
Unit Unique ID
Instrument Make
Instrument Model
Service Measure-ment Date
Blind Location
Measure-ment Device
Methane Gas Equivalent (m3/hr)
B Random S 81 S81 Fisher L2 Condensate 2017-05-16 32 Calscan 0.0000 B Random S 82 S82 Fisher L2 H20 Level 2017-05-18 33 Calscan 0.4408 B Random S 83 S83 Fisher L2 Condensate 2017-05-18 33 Calscan 0.2925 B Random S 84 S84 Fisher L2 H20 Level 2017-05-17 34 Calscan 0.2810 B Random S 85 S85 Fisher L2 Condensate 2017-05-17 34 Calscan 0.5622 B Random S 86 S86 Fisher L2 Condensate 2017-05-18 35 Calscan 0.4669 B Random S 87 S87 Fisher L2 H20 Level 2017-05-18 35 Calscan 0.5966 B Random S 88 S88 Fisher L2 H20 Level 2017-05-17 36 Calscan 0.5475 B Random S 89 S89 Fisher L2 Condensate 2017-05-17 36 Calscan 0.5055 C Random A 90 A90 Fisher L2 H20 Level 2017-06-05 37 Calscan 0.0000 C Random A 91 A91 Fisher L2 Condensate 2017-06-05 37 Calscan 0.0246 C Random A 92 A92 Fisher L2 H20 Level 2017-06-03 38 Calscan 0.5105 C Random A 93 A93 Fisher L2 Condensate 2017-06-03 38 Calscan 0.0000 C Random A 94 A94 Fisher L2 H20 Level 2017-06-03 39 Calscan 0.1394 C Random A 95 A95 Fisher L2 Condensate 2017-06-03 39 Calscan 0.3475 C Random A 96 A96 Fisher L2 H20 Level 2017-06-05 40 Calscan 0.5656 C Random A 97 A97 Fisher L2 Condensate 2017-06-05 40 Calscan 0.6521 C Random A 98 A98 Fisher L2 H20 Level 2017-06-02 41 Calscan 0.0063 C Random A 99 A99 Fisher L2 Condensate 2017-06-02 41 Calscan 0.2294 C Random A 100 A100 Fisher L2 H20 Level 2017-06-04 42 Calscan 0.0000 C Random A 101 A101 Fisher L2 Condensate 2017-06-04 42 Calscan 0.2161 C Random A 102 A102 Fisher L2 H20 Level 2017-06-01 43 Calscan 0.0846 C Random A 103 A103 Fisher L2 Condensate 2017-06-01 43 Calscan 0.0000 C Random A 104 A104 Fisher L2 H20 Level 2017-06-05 44 Calscan 0.1551 C Random A 105 A105 Fisher L2 Condensate 2017-06-05 44 Calscan 0.0018 C Random A 106 A106 Fisher L2 H20 Level 2017-06-01 45 Calscan 0.0389 C Random A 107 A107 Fisher L2 Condensate 2017-06-01 45 Calscan 0.0018 C Random A 108 A108 Fisher L2 Condensate 2017-06-02 46 Calscan 0.1063

45
Campaign Op Code
Unit Unique ID
Instrument Make
Instrument Model
Service Measure-ment Date
Blind Location
Measure-ment Device
Methane Gas Equivalent (m3/hr)
C Random A 109 A109 Fisher L2 H20 Level 2017-06-02 46 Calscan 0.2877 C Random A 110 A110 Fisher L2 H20 Level 2017-06-02 47 Calscan 0.0039 C Random A 111 A111 Fisher L2 Condensate 2017-06-02 47 Calscan 0.1087 C Random A 112 A112 Fisher L2 H20 Level 2017-06-03 39 Calscan 0.4616 C Random A 113 A113 Fisher L2 Condensate 2017-06-03 39 Calscan 0.0027 C Random A 114 A114 Fisher L2 H20 Level 2017-06-04 48 Calscan 0.1075 C Random A 115 A115 Fisher L2 Condensate 2017-06-04 48 Calscan 0.0320 C Random A 116 A116 Fisher L2 H20 Level 2017-06-02 49 Calscan 0.2170 C Random A 117 A117 Fisher L2 Condensate 2017-06-02 49 Calscan 0.0045 C Random A 118 A118 Fisher L2 H20 Level 2017-06-03 50 Calscan 0.1323 C Random A 119 A119 Fisher L2 Condensate 2017-06-03 50 Calscan 0.1691 C Random A 120 A120 Fisher L2 H20 Level 2017-06-06 51 Calscan 0.5433 C Random A 121 A121 Fisher L2 Condensate 2017-06-06 51 Calscan 0.0000 C Random A 122 A122 Fisher L2 H20 Level 2017-06-02 52 Calscan 0.5125 C Random A 123 A123 Fisher L2 Condensate 2017-06-02 52 Calscan 0.1817 C Random A 124 A124 Norriseal 1001A H20 Level 2017-06-04 53 Calscan 0.4566 C Random A 125 A125 Norriseal 1001A Condensate 2017-06-04 53 Calscan 0.0000 C Random A 126 A126 Fisher L2 H20 Level 2017-06-04 54 Calscan 0.2235 C Random A 127 A127 Fisher L2 Condensate 2017-06-04 54 Calscan 0.4351 C Random A 128 A128 Fisher L2 H20 Level 2017-06-06 55 Calscan 0.1628 C Random A 129 A129 Fisher L2 Condensate 2017-06-06 55 Calscan 0.0914 C Random A 130 A130 Fisher L2 H20 Level 2017-06-01 56 Calscan 0.0503 C Random A 131 A131 Fisher L2 Condensate 2017-06-01 56 Calscan 0.6916 C Random A 132 A132 Fisher L2 H20 Level 2017-06-04 57 Calscan 0.6980 C Random A 133 A133 Fisher L2 Condensate 2017-06-04 57 Calscan 0.7468 Final Random
D 134 D134 Fisher L2 H20 Level 2017-07-11 58 Calscan 0.1709
Final Random
D 135 D135 Fisher L2 Condensate 2017-07-11 58 Calscan 0.0018

46
Campaign Op Code
Unit Unique ID
Instrument Make
Instrument Model
Service Measure-ment Date
Blind Location
Measure-ment Device
Methane Gas Equivalent (m3/hr)
Final Random
D 136 D136 Fisher L2 Condensate 2017-07-11 59 Calscan 0.8954
Final Random
D 137 D137 Fisher L2 H20 Level 2017-07-11 59 Calscan 0.1082
Final Random
D 138 D138 Fisher L2 H20 Level 2017-07-08 60 Calscan 0.0000
Final Random
D 139 D139 Norriseal 1001A Inlet Sep 2017-07-09 61 Calscan 1.2026
Final Random
D 140 D140 Norriseal 1001A Interstate 2017-07-09 61 Calscan 0.0038
Final Random
D 141 D141 Fisher L2 H20 Level 2017-07-10 62 Calscan 0.1479
Final Random
D 142 D142 Fisher L2 Condensate 2017-07-10 62 Calscan 0.0564
Final Random
D 143 D143 Norriseal 1001A Condensate 2017-07-10 62 Calscan 0.0065
Final Random
D 144 D144 Norriseal 1001A H20 Level 2017-07-10 62 Calscan 0.0041
Final Random
D 145 D145 Norriseal 1001A H20 Level 2017-07-10 62 Calscan 0.0035
Final Random
D 146 D146 Fisher L2 Condensate 2017-07-08 63 Calscan 1.2160
Final Random
D 147 D147 Fisher L2 H20 Level 2017-07-08 63 Calscan 0.9818
Final Random
D 148 D148 Fisher L2 H20 Level 2017-07-10 64 Calscan 1.3287
Final Random
D 149 D149 Norriseal 1001A Condensate 2017-07-10 64 Calscan 1.2261
Final Random
D 150 D150 Fisher L2 Condensate 2017-07-10 64 Calscan 0.2201
Final D 151 D151 Norriseal 1001A H20 Level 2017-07-10 64 Calscan 0.0871

47
Campaign Op Code
Unit Unique ID
Instrument Make
Instrument Model
Service Measure-ment Date
Blind Location
Measure-ment Device
Methane Gas Equivalent (m3/hr)
Random Final Random
D 152 D152 Fisher 2680 Compressor 2017-07-09 65 Calscan 0.90
Final Random
D 153 D153 Fisher 2500 Dehy 2017-07-09 65 Calscan 0.76
Final Random
D 154 D154 Fisher 2900 Compressor 2017-07-09 65 Calscan 0.69
Final Random
D 155 D155 Fisher 2500 Dehy 2017-07-09 65 Calscan 0.63
Final Random
D 156 D156 Fisher 2680a H20 Level 2017-07-08 66 Calscan 0.33
Final Random
D 157 D157 Fisher 2680a Condensate 2017-07-08 66 Calscan 0.0000
Final Random
K 158 K158 Fisher 2900 Condensate 2017-12-20 67 Calscan 0.0906
Final Random
K 159 K159 Fisher L2sj Condensate 2017-12-20 67 Calscan 0.0283
Norriseal Retrofit
N 160 N160 Fisher L2 Condensate 2017-12-06 68 e-MEAS 0.0180
Norriseal Retrofit
N 161 N161 Fisher L2 H20 Level 2017-12-06 68 e-MEAS 0.1834
Norriseal Retrofit
D 162 D162 Norriseal 1001a Condensate 2017-12-14 69 e-MEAS 0.0283
Norriseal Retrofit
D 163 D163 Norriseal 1001a H20 Level 2017-12-14 69 e-MEAS 0.0311
Norriseal Retrofit
T 164 T164 Norriseal 1001a H20 Level 2017-12-05 70 Calscan 0.0085
Norriseal Retrofit
T 165 T165 Norriseal 1001a H20 Level 2017-12-05 70 Calscan 0.0864
Norriseal Retrofit
T 166 T166 Norriseal 1001a H20 Level 2017-12-04 71 Calscan 0.0614

48
Campaign Op Code
Unit Unique ID
Instrument Make
Instrument Model
Service Measure-ment Date
Blind Location
Measure-ment Device
Methane Gas Equivalent (m3/hr)
Norriseal Retrofit
T 167 T167 Norriseal 1001a H20 Level 2017-12-08 72 Calscan 0.0283
Norriseal Retrofit
T 168 T168 Norriseal 1001a H20 Level 2017-12-05 73 Calscan 0.0425
Norriseal Retrofit
T 169 T169 Norriseal 1001a Condensate 2017-12-05 73 Calscan 0.0037
Norriseal Retrofit
N 170 N170 Norriseal 1001a H20 Level 2017-12-06 68 Calscan 0.0054
Norriseal Retrofit
N 171 N171 Norriseal 1001a Condensate 2017-12-06 68 Calscan 0.0394
Norriseal Retrofit
D 172 D172 Norriseal 1001a H20 Level 2017-12-14 74 e-MEAS 0.2209
Norriseal Retrofit
D 173 D173 Norriseal 1001a Condensate 2017-12-14 74 e-MEAS 0.0507
Norriseal Retrofit
D 174 D174 Norriseal 1001a H20 Level 2017-12-14 75 e-MEAS 0.0784
Norriseal Retrofit
D 175 D175 Norriseal 1001a Condensate 2017-12-14 75 e-MEAS 0.0436
Norriseal Retrofit
N 176 N176 Norriseal 1001a H20 Level 2017-12-06 76 e-MEAS 0.0229
Norriseal Retrofit
N 177 N177 Norriseal 1001a Condensate 2017-12-06 76 e-MEAS 0.0025
Norriseal Retrofit
N 178 N178 Norriseal 1001a H20 Level 2017-12-06 77 e-MEAS 0.0074
Norriseal Retrofit
N 179 N179 Norriseal 1001a Condensate 2017-12-06 77 e-MEAS 0.0215
Norriseal Retrofit
N 180 N180 Norriseal 1001a H20 Level 2017-12-06 78 e-MEAS 0.0447
Norriseal Retrofit
N 181 N181 Norriseal 1001a Condensate 2017-12-06 78 e-MEAS 0.0037
N N 182 N182 Norriseal 1001A H20 Level 2018-01-24 79 e-MEAS 0.0309

49
Campaign Op Code
Unit Unique ID
Instrument Make
Instrument Model
Service Measure-ment Date
Blind Location
Measure-ment Device
Methane Gas Equivalent (m3/hr)
Campaign N Campaign
N 183 N183 Norriseal 1001A Condensate 2018-01-24 79 e-MEAS 0.0216
N Campaign
N 184 N184 Norriseal 1001A H20 Level 2018-01-23 80 e-MEAS 0.1271
N Campaign
N 185 N185 Norriseal 1001A Condensate 2018-01-23 80 e-MEAS 1.2250
N Campaign
N 186 N186 Norriseal 1001A H20 Level 2018-01-24 82 e-MEAS 1.0018
N Campaign
N 187 N187 Norriseal 1001A Condensate 2018-01-24 82 e-MEAS 0.0265
N Campaign
N 188 N188 Norriseal 1001A H20 Level 2018-02-06 84 e-MEAS 0.1735
N Campaign
N 189 N189 Norriseal 1001A Condensate 2018-02-06 84 e-MEAS 0.0000
N Campaign
N 190 N190 Norriseal 1001S H20 Level r 2018-02-06 85 e-MEAS 0.0449
N Campaign
N 191 N191 Norriseal 1001S Condensate 2018-02-06 85 e-MEAS 1.3818
N Campaign
N 192 N192 Norriseal 1001A H20 Level 2018-02-06 86 e-MEAS 0.0192
N Campaign
N 193 N193 Norriseal 1001A Condensate 2018-02-05 86 e-MEAS 1.1892
N Campaign
N 194 N194 Norriseal 1001A H20 Level r 2018-02-07 87 e-MEAS 0.0236
N Campaign
N 195 N195 Norriseal 1001A Condensate 2018-02-07 87 e-MEAS 0.0149
N Campaign
N 196 N196 Norriseal 1001a H20 Level 2017-02-15 88 e-MEAS 0.0611
N Campaign
N 197 N197 Norriseal 1001A Condensate 2017-02-15 88 e-MEAS 0.0503
50
Campaign Op Code
Unit Unique ID
Instrument Make
Instrument Model
Service Measure-ment Date
Blind Location
Measure-ment Device
Methane Gas Equivalent (m3/hr)
N Campaign
N 198 N198 Norriseal 1001a H20 Level r 2018-02-16 89 e-MEAS 0.0398
N Campaign
N 199 N199 Norriseal 1001A Condensate 2018-02-16 89 e-MEAS 0.0216
N Campaign
N 200 N200 Norriseal 1001a H20 Level 2018-02-17 90 e-MEAS 0.0451
N Campaign
N 201 N201 Norriseal 1001a Condensate 2018-02-17 90 e-MEAS 0.0470
N Campaign
N 202 N202 Norriseal 1001a H20 Level 2018-02-15 91 e-MEAS 0.5538
N Campaign
N 203 N203 Norriseal 1001A Condensate 2018-02-15 91 e-MEAS 0.0108
N Campaign
N 204 N204 Norriseal 1001a H20 Level r 2018-02-17 92 e-MEAS 0.0611
N Campaign
N 205 N205 Norriseal 1001a Condensate 2018-02-17 92 e-MEAS 0.0899
N Campaign
N 206 N206 Norriseal 1001a H20 Level 2018-02-15 93 e-MEAS 0.0719
N Campaign
N 207 N207 Norriseal 1001A Condensate 2018-02-15 93 e-MEAS 0.1295
N Campaign
N 208 N208 Norriseal 1001a H20 Level r 2018-02-14 94 e-MEAS 0.1978
N Campaign
N 209 N209 Norriseal 1001A Condensate 2018-02-14 94 e-MEAS 2.0714
N Campaign
N 210 N210 Norriseal 1001a H20 Level 2018-02-15 95 e-MEAS 0.0324
N Campaign
N 211 N211 Norriseal 1001A Condensate 2018-02-15 95 e-MEAS 0.0503
N Campaign
N 212 N212 Norriseal 1001a H20 Level r 2018-02-14 96 e-MEAS 0.1632
N N 213 N213 Norriseal 1001A Condensate 2018-02-14 96 e-MEAS 0.0503
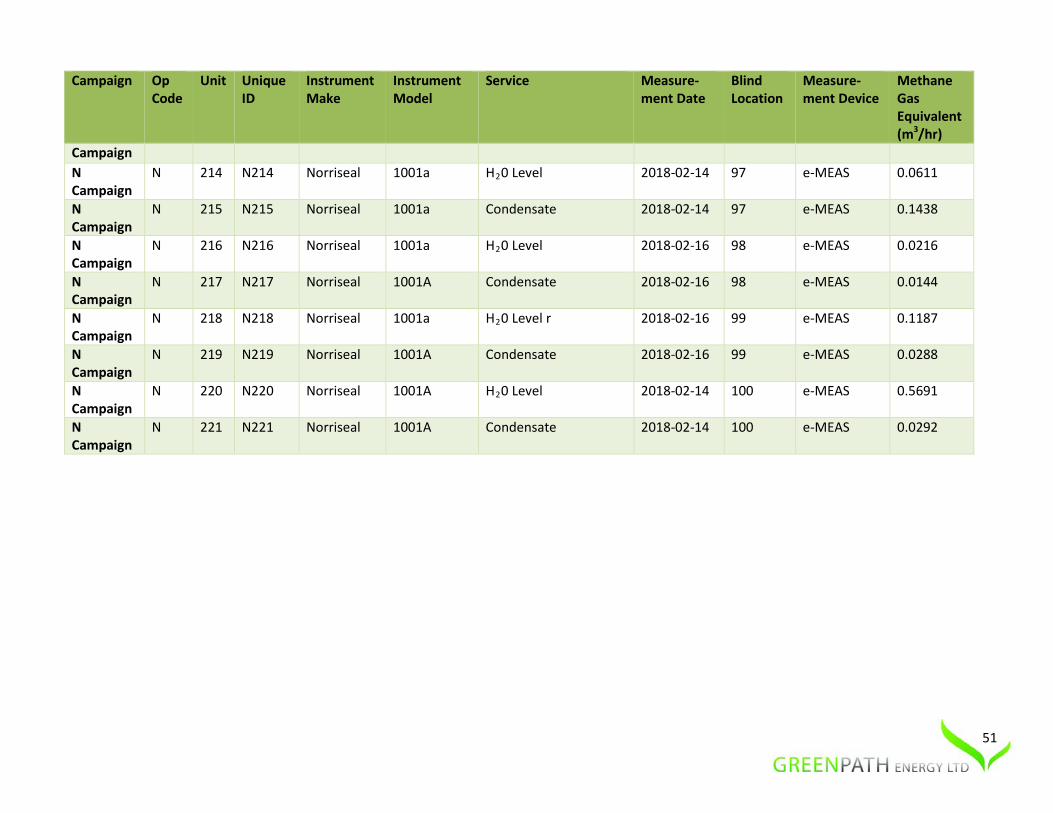
51
Campaign Op Code
Unit Unique ID
Instrument Make
Instrument Model
Service Measure-ment Date
Blind Location
Measure-ment Device
Methane Gas Equivalent (m3/hr)
Campaign N Campaign
N 214 N214 Norriseal 1001a H20 Level 2018-02-14 97 e-MEAS 0.0611
N Campaign
N 215 N215 Norriseal 1001a Condensate 2018-02-14 97 e-MEAS 0.1438
N Campaign
N 216 N216 Norriseal 1001a H20 Level 2018-02-16 98 e-MEAS 0.0216
N Campaign
N 217 N217 Norriseal 1001A Condensate 2018-02-16 98 e-MEAS 0.0144
N Campaign
N 218 N218 Norriseal 1001a H20 Level r 2018-02-16 99 e-MEAS 0.1187
N Campaign
N 219 N219 Norriseal 1001A Condensate 2018-02-16 99 e-MEAS 0.0288
N Campaign
N 220 N220 Norriseal 1001A H20 Level 2018-02-14 100 e-MEAS 0.5691
N Campaign
N 221 N221 Norriseal 1001A Condensate 2018-02-14 100 e-MEAS 0.0292
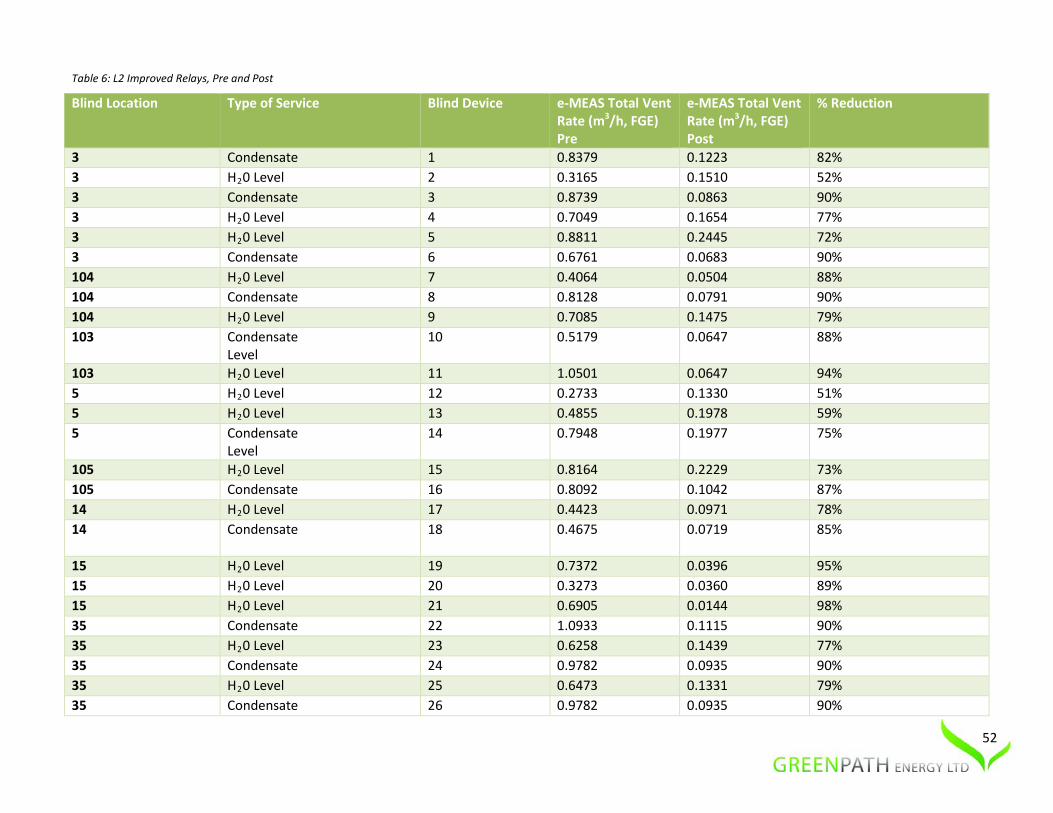
52
Table 6: L2 Improved Relays, Pre and Post
Blind Location Type of Service Blind Device e-MEAS Total Vent Rate (m3/h, FGE) Pre
e-MEAS Total Vent Rate (m3/h, FGE) Post
% Reduction
3 Condensate 1 0.8379 0.1223 82% 3 H20 Level 2 0.3165 0.1510 52% 3 Condensate 3 0.8739 0.0863 90% 3 H20 Level 4 0.7049 0.1654 77% 3 H20 Level 5 0.8811 0.2445 72% 3 Condensate 6 0.6761 0.0683 90% 104 H20 Level 7 0.4064 0.0504 88% 104 Condensate 8 0.8128 0.0791 90% 104 H20 Level 9 0.7085 0.1475 79% 103 Condensate
Level 10 0.5179 0.0647 88%
103 H20 Level 11 1.0501 0.0647 94% 5 H20 Level 12 0.2733 0.1330 51% 5 H20 Level 13 0.4855 0.1978 59% 5 Condensate
Level 14 0.7948 0.1977 75%
105 H20 Level 15 0.8164 0.2229 73% 105 Condensate 16 0.8092 0.1042 87% 14 H20 Level 17 0.4423 0.0971 78% 14 Condensate
18 0.4675 0.0719 85%
15 H20 Level 19 0.7372 0.0396 95% 15 H20 Level 20 0.3273 0.0360 89% 15 H20 Level 21 0.6905 0.0144 98% 35 Condensate 22 1.0933 0.1115 90% 35 H20 Level 23 0.6258 0.1439 77% 35 Condensate 24 0.9782 0.0935 90% 35 H20 Level 25 0.6473 0.1331 79% 35 Condensate 26 0.9782 0.0935 90%

53
Blind Location Type of Service Blind Device e-MEAS Total Vent Rate (m3/h, FGE) Pre
e-MEAS Total Vent Rate (m3/h, FGE) Post
% Reduction
9 Condensate 27 0.8128 0.0144 98% 101 1st Stage Scrubber 28 0.1187 0.0201 83% 101 2nd Stage Scrubber 29 0.0029 0.0180 n/a 102 1st Stage Scrubber 30 0.0287 0.0144 50%

54
Table 7: Norriseal EVS Retrofits - Raw Data
Blind Operator Blind Location Measurement Device Survey Date Pre Make Pre Model Pre m3/hr FGE Post m3/hr FGE Change D 69 e-MEAS 2017-12-14 Norriseal 1001A 0.036 0.032 10% D 69 e-MEAS 2017-12-14 Norriseal 1001A 0.040 0.079 -100% T 70 Calscan 2017-12-05 Norriseal 1001A 0.011 0.003 73% T 70 Calscan 2017-12-05 Norriseal 1001A 0.110 0.053 52% T 71 Calscan 2017-12-04 Norriseal 1001A 0.078 0.004 95% T 72 Calscan 2017-12-08 Norriseal 1001A 0.036 0.006 84% T 73 Calscan 2017-12-05 Norriseal 1001A 0.054 0.015 73% T 73 Calscan 2017-12-05 Norriseal 1001A 0.005 0.002 54% N 68 e-MEAS 2017-12-06 Norriseal 1001A 0.007 0.025 -268% N 68 e-MEAS 2017-12-06 Norriseal 1001A 0.050 0.359 0% D 74 e-MEAS 2017-12-14 Norriseal 1001A 0.281 0.068 76% D 74 e-MEAS 2017-12-14 Norriseal 1001A 0.064 0.046 29% D 75 e-MEAS 2017-12-14 Norriseal 1001A 0.100 0.062 38% D 75 e-MEAS 2017-12-14 Norriseal 1001A 0.055 0.037 33% N 76 e-MEAS 2017-12-06 Norriseal 1001A 0.029 0.325 N 76 e-MEAS 2017-12-06 Norriseal 1001A 0.003 0.007 -111% N 77 e-MEAS 2017-12-06 Norriseal 1001A 0.009 0.005 46% N 77 e-MEAS 2017-12-06 Norriseal 1001A 0.027 0.003 89% N 78 e-MEAS 2017-12-06 Norriseal 1001A 0.057 0.001 98% N 78 e-MEAS 2017-12-06 Norriseal 1001A 0.005 0.043 -815% Non-Random Set N 80 e-MEAS 2018-03-20 Norriseal 1001A 0.965 0.020 98% N 82 e-MEAS 2018-03-20 Norriseal 1001A 0.789 0.037 95% N 85 e-MEAS 2018-03-20 Norriseal 1001S 1.088 0.051 95% N 86 e-MEAS 2018-03-22 Norriseal 1001A 0.936 0.014 98% N 91 e-MEAS 2018-03-20 Norriseal 1001A 0.436 0.040 91% N 94 e-MEAS 2018-03-22 Norriseal 1001A 1.631 0.076 95% N 100 e-MEAS 2018-03-21 Norriseal 1001A 0.448 0.088 80%

GreenPath Energy Ltd. Calgary, AB
(403) 200 1553 www.greenpathenergy.com