level guide and position descriptions
TRANSCRIPT
Promoting Organic Food:
Information Policy versus Production Subsidy
Christoph Tribl and Klaus Salhofer
Technical University of Munich
Environmental Economics and Agricultural Policy Group
Alte Akademie 14
D – 85350 Freising – Weihenstephan
Tel: +49 8161 713576
Fax: +49 8161 71 3408
Email: [email protected]
Paper prepared for presentation at the EAAE XIth Congress
(European Association of Agricultural Economists),
“The Future of Rural Europe in the Global Agri-Food System”
Copenhagen, Denmark, August 24-27, 2005
Copyright 2005 by authors. All rights reserved. Readers may make verbatim
copies of this document for non-commercial purposes by any means, provided
that this copyright notice appears on all such copies.

1
PROMOTING ORGANIC FOOD: INFORMATION POLICY VERSUS
PRODUCTION SUBSIDY
Abstract In developed countries governments aim to increase the market share of organic products. Assuming that organic farming creates a positive externality, we address the question of how this environmental benefit can be internalized best. Using the concept of heterogeneous producers and consumers we compare two policy options to enhance organic supply and demand with respect to their efficiency and distributional effect: First, we analyze the effect of a supply-side oriented policy like a subsidy on organic production. Second, we compare this policy measure to a demand-side oriented information policy, which aims to enhance the acceptance and identification of an organic food label. Third, we assume a mix of both policy measures. The main findings of this paper are that conventional consumers and organic producers and consumers experience a gain in welfare. The efficiency of any policy measure considered strongly depends on the utility enhancement experienced by organic consumers due to an information policy and the costs of transferring the information to the consumer. Keywords: organic food, labeling, production subsidy, information policy, welfare JEL: D61, D62, L15, Q18
1 Introduction
Though still small in absolute terms, organic markets are rapidly growing in developed countries. Organic food retail sales in the U.S. were estimated at $7.8 billion in 2000 with an average growth rate over the past 10 years of 23% per annum. Industry analysts forecast the sector to be worth $20 billion by 2005 (USDA, 2004). The situation is similar to the European Union (EU). These increases occur for several reasons: First, due to increasing incomes and repeated food scares consumer preferences for food with specific characteristics increase. Second, spurred by budgetary problems and pressure through international trade agreements some countries are trying to get rid of subsidized surplus production by giving incentives to use less intensive agricultural production techniques including organic farming. Furthermore, organic farming is promoted as a method to decrease the negative external costs of agricultural production and to increase animal welfare. Finally, though not scientifically verified, consumption of organic products is sometimes promoted and/or perceived as being healthier.
Especially in Europe governments at the national and the EU level are trying to promote organic farming. For examples, currently the EU is discussing and developing a European Action Plan for Organic Food and Farming. Similarly, in an answer to the BSE crisis in 2001-2002, the German Minister of Consumer Protection, Nutrition and Agriculture has declared the goal to increase the share of organic products in Germany from 5% today to 20% in 2010.
Assuming that such an increase in the market share of organic farming is beneficial to society and desired, the question remains how such a goal can be reached most efficiently. To partly answer this question is the aim of this paper. In particular, we discuss the efficiency of two alternative policies commonly used: the supply-side oriented policy of subsidizing organic production versus a demand-side oriented policy of public expenditures to promote the consumption of organic products through information and advertising. Examples of subsidizing organic production are agri-environmental programs in the EU, which are jointly sponsored by the European Commission and the member states. An example of an information policy on the demand side is the German program “Organic Farming” of the German Ministry of Consumer Protection, Nutrition and Agriculture with a budget of €20 million each year between 2001 and 2007. In this program a common label of organic products is announced to consumers with the aim to reinforce its recognition and acceptance.
In this paper we build a theoretical model accounting for heterogeneous consumers and producers to compare these two policy measures concerning their efficiency and welfare distribution. We assume that the overall goal of these two policy measures is to internalize the positive external effect of organic production and thereby to increase the organic market share by a certain amount. In a second step, we apply a combination of a subsidy and an information policy to obtain the desired organic share under the assumption of welfare maximization.
2
2 Basic Model
In an attempt to model the welfare effects of these two policy measures on a group of heterogeneous consumers and heterogeneous producers at the same time we combine two models, one described in Giannakas (2002) considering consumer heterogeneity and one described in Fulton and Keyowski (1999) considering producer heterogeneity. Since organic products can be characterized as credence goods, whose quality can not be evaluated by consumers even after consumption (Darby and Karni, 1973), the usual instruments to transfer the credence good into a search good and to circumvent supply-side market failures when conventional and organic products are not segregated, is labeling and certification of organic food. While Giannakas (2002) analyses the benefits of introducing an organic label, we discuss the situation where labeling of organic products has already been introduced. Therefore, consumers can easily detect the credence attributes of the products. Additionally, we assume that there is a perfect testing system in place, such that there is no scope for moral hazard or adverse selection. Furthermore, we assume autarky and perfect competition with marketing margins equal to zero, i.e. equilibrium prices producers receive equal equilibrium prices consumers pay. The analysis can easily be extended by introducing positive marketing margins of constant proportions to the wholesale or retail level without changing the qualitative nature of the model (see Fulton and Giannakas, 2004). In addition, we consider that organic production implies a positive externality (or less of a negative externality) compared to conventional production.
2.1 Consumers’ decisions
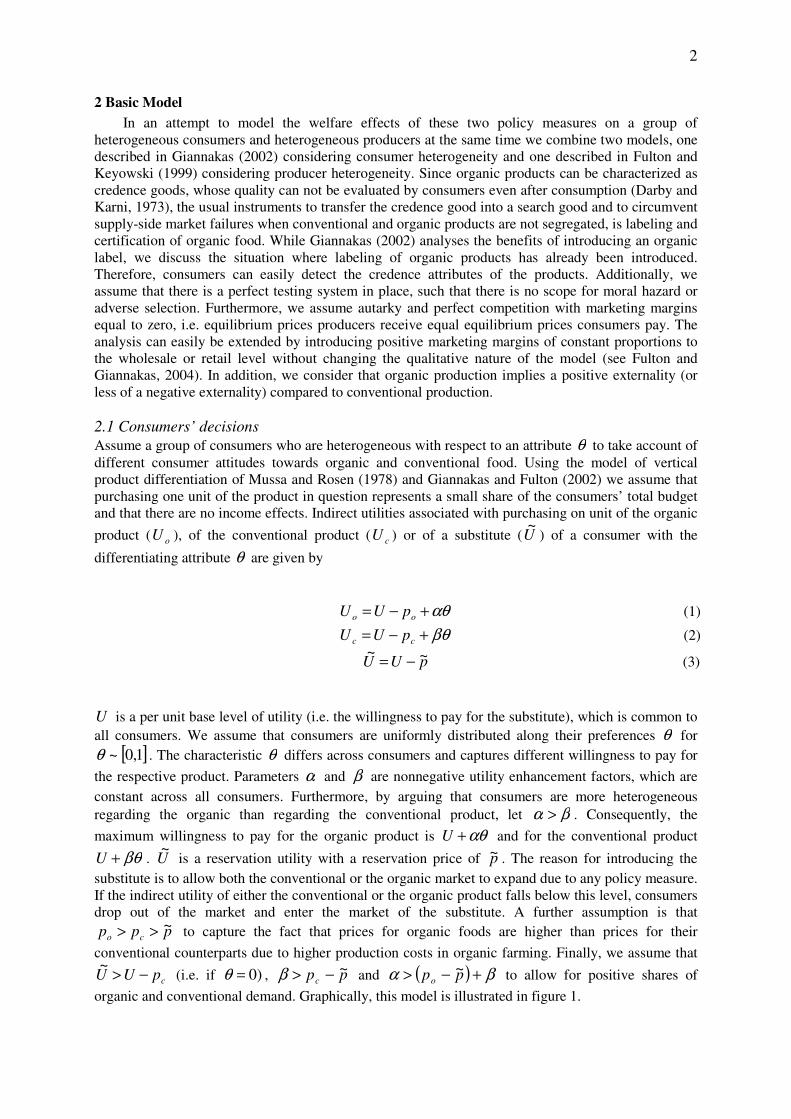
Assume a group of consumers who are heterogeneous with respect to an attribute θ to take account of different consumer attitudes towards organic and conventional food. Using the model of vertical product differentiation of Mussa and Rosen (1978) and Giannakas and Fulton (2002) we assume that purchasing one unit of the product in question represents a small share of the consumers’ total budget and that there are no income effects. Indirect utilities associated with purchasing on unit of the organic
product ( oU ), of the conventional product ( cU ) or of a substitute (U~
) of a consumer with the
differentiating attribute θ are given by
αθ+−= oo pUU (1)
βθ+−= cc pUU (2)
pUU ~~−= (3)
U is a per unit base level of utility (i.e. the willingness to pay for the substitute), which is common to
all consumers. We assume that consumers are uniformly distributed along their preferences θ for
[ ]1,0~θ . The characteristic θ differs across consumers and captures different willingness to pay for
the respective product. Parameters α and β are nonnegative utility enhancement factors, which are
constant across all consumers. Furthermore, by arguing that consumers are more heterogeneous
regarding the organic than regarding the conventional product, let βα > . Consequently, the
maximum willingness to pay for the organic product is αθ+U and for the conventional product
βθ+U . U~
is a reservation utility with a reservation price of p~ . The reason for introducing the
substitute is to allow both the conventional or the organic market to expand due to any policy measure. If the indirect utility of either the conventional or the organic product falls below this level, consumers drop out of the market and enter the market of the substitute. A further assumption is that
ppp co~>> to capture the fact that prices for organic foods are higher than prices for their
conventional counterparts due to higher production costs in organic farming. Finally, we assume that
cpUU −>~
(i.e. if )0=θ , ppc~−>β and ( ) βα +−> ppo
~ to allow for positive shares of
organic and conventional demand. Graphically, this model is illustrated in figure 1.

3
For consumers maximizing utility along the differentiating attribute θ , the share of consumers leaving the market and consuming the substitute is given by
β
θpp
x c~
~1
−== (4)
by equating indirect utilities (3) and (2). The marginal consumer located at 1θ is indifferent between
consuming the conventional product or leaving the market for the substitute. For mathematical
simplicity, let βαλ −= . The total share of the substitute plus the conventional demand is found by
equating (2) and (1), which yields
λ
θ co pp −=2 (5)
Figure 1. Consumers’ decisions
Likewise, the consumer located at 2θ is indifferent between demanding the conventional product or its
organic counterpart. Demand for the conventional product is derived by subtracting (5) from (4), which yields
βλ
λαβθθ
pppx coD
c
~
12
+−=−= (6)
Finally, demand for the organic product is given by
λ
λθ coD
o
ppx
+−=−= 21 (7)
e
f
d
c
b a
2θ 1θ 1 0
β
α
cpU −
opU −
pU ~−

4
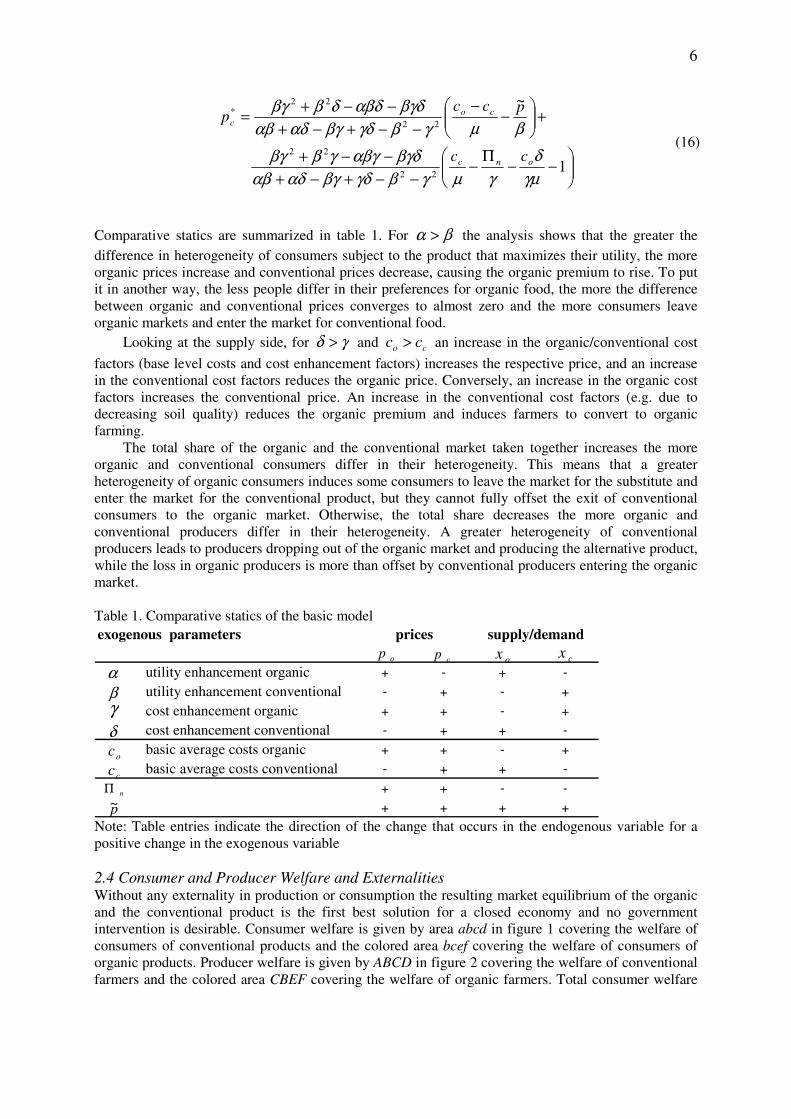
2.2 Producers’ decisions On the supply side we assume heterogeneity of producers by introducing a differentiating
attribute ϕ , which comprises factors affecting average production costs. Therefore, similar to Fulton
and Keyowski (1999) producers differ in the net returns they receive. Again, let producers be
uniformly distributed along the differentiating attribute ϕ for [ ]1,0~ϕ , where 0=ϕ denotes low
average production costs and 1=ϕ high average production costs. The profit functions for unit
production of the organic product oΠ ,of the conventional product cΠ and of an alternative product
nΠ are given by
( )γϕ+−=Π ooo cp (8)
( )δϕ+−=Π ccc cp (9)
0≥−=Π nnn cp (10)
oc and cc are base level costs of producing the organic or the conventional product, respectively,
which are common to all producers irrespective of their location ϕ . To capture higher production
costs in organic farming, which include the costs of labeling, certification and monitoring as well, let
co cc > . We further assume that γ and δ are nonnegative cost enhancement factors and that γδ > .
By this we argue that producers of conventional food are more sensitive to factors like soil quality, climate, etc. and require factors like synthetic fertilizers, pesticides, etc., which are not permitted in organic production. Thus, the total costs of unit production for a producer located at ϕ is given by
γϕ+oc and δϕ+cc , respectively. We further assume that nco ppp >> to account for organic
prices receiving a premium over the conventional product. nΠ is the profit level of an alternative
product, which we assume not to be a substitute in consumption. If the profits of organic production
along the differentiating attribute ϕ fall below the constant level of nΠ , producers drop out of this
market and produce something different, yielding a profit of nΠ . Without loss of generality, nΠ can
be set to zero. For positive shares, let ( ) ( ) ( )ooccoo cpcpcp −<−<−γ
δ . Graphically, producers’
decisions are illustrated in figure 2.
For the subsequent equations let γδµ −= . Assuming profit maximization along the
differentiating attribute ϕ , supply of the conventional product is found by equating (8) and (9), which
yields
( ) ( )
µϕ ooccS
c
cpcpx
−−−== 1 (11)
with the marginal producer located at 1ϕ being indifferent between producing conventional or organic
food. The total market share of conventional and organic production is given by equating (8) and (10):
( )
γϕ noo cp Π−−
=2 (12)

5
Figure 2. Producers’ decisions
2ϕ is the location of the producer who is indifferent between producing organic or an alternative
product. Subtracting (11) from (12) gives organic supply
( ) ( )
γµ
γµδϕϕ ccnooS
o
cpcpx
−−Π−−=−= 12 (13)
with the difference of both market shares to 1 being the share of the alternative product:
γ
γϕ nooS
n
cpx
Π++−=−= 21 (14)
2.3 Market Equilibrium Assuming autarky and, hence, equal shares of supply and demand, we calculate equilibrium prices by equating (11) and (6) for the conventional market and (13) and (7) for the organic market. The equilibrium price, which is the price producers receive and consumers pay, is given by equation (15) for the organic product and by equation (16) for the conventional product:
−−
Π−
−−+−+
−−+
+
−
−
−−+−+
−−+=
1
~
22
22
22
22*
γµ
δ
γµγβγδβγαδαβ
αγδαβγγβαγ
βµγβγδβγαδαβ
βγδαβγγββγ
onc
co
o
cc
pccp
(15)
F
E
I G
H
J
D
C
B A δ
γ
E
nn cp −
2ϕ 1ϕ 1 0
oo cp −
cc cp −
EB
1ϕ EB
2ϕ
6
−−
Π−
−−+−+
−−+
+
−
−
−−+−+
−−+=
1
~
22
22
22
22*
γµ
δ
γµγβγδβγαδαβ
βγδαβγγββγ
βµγβγδβγαδαβ
βγδαβδδββγ
onc
co
c
cc
pccp
(16)
Comparative statics are summarized in table 1. For βα > the analysis shows that the greater the
difference in heterogeneity of consumers subject to the product that maximizes their utility, the more organic prices increase and conventional prices decrease, causing the organic premium to rise. To put it in another way, the less people differ in their preferences for organic food, the more the difference between organic and conventional prices converges to almost zero and the more consumers leave organic markets and enter the market for conventional food.
Looking at the supply side, for γδ > and co cc > an increase in the organic/conventional cost
factors (base level costs and cost enhancement factors) increases the respective price, and an increase in the conventional cost factors reduces the organic price. Conversely, an increase in the organic cost factors increases the conventional price. An increase in the conventional cost factors (e.g. due to decreasing soil quality) reduces the organic premium and induces farmers to convert to organic farming.
The total share of the organic and the conventional market taken together increases the more organic and conventional consumers differ in their heterogeneity. This means that a greater heterogeneity of organic consumers induces some consumers to leave the market for the substitute and enter the market for the conventional product, but they cannot fully offset the exit of conventional consumers to the organic market. Otherwise, the total share decreases the more organic and conventional producers differ in their heterogeneity. A greater heterogeneity of conventional producers leads to producers dropping out of the organic market and producing the alternative product, while the loss in organic producers is more than offset by conventional producers entering the organic market. Table 1. Comparative statics of the basic model
exogenous parameters
utility enhancement organic + - + -
utility enhancement conventional - + - +
cost enhancement organic + + - +
cost enhancement conventional - + + -
basic average costs organic + + - +
basic average costs conventional - + + -
+ + - -
+ + + +
prices supply/demand
γ
nΠ
opcp ox cx
αβ
δ
oc
cc
p~ Note: Table entries indicate the direction of the change that occurs in the endogenous variable for a positive change in the exogenous variable
2.4 Consumer and Producer Welfare and Externalities Without any externality in production or consumption the resulting market equilibrium of the organic and the conventional product is the first best solution for a closed economy and no government intervention is desirable. Consumer welfare is given by area abcd in figure 1 covering the welfare of consumers of conventional products and the colored area bcef covering the welfare of consumers of organic products. Producer welfare is given by ABCD in figure 2 covering the welfare of conventional farmers and the colored area CBEF covering the welfare of organic farmers. Total consumer welfare
7
in the market is given by the sum of of organic consumer welfare oCW , conventional consumer
welfare cCW , and welfare of consumers of the substitute aCW for
( ) ( )( ) ( )2
22
1
12
1
2
θα
θθαθθ
−+−−=+−= ∫ ooo pUdpUCW (17)
( ) ( )( ) ( )2
1
2
2122
2
1
θθβ
θθθβθθ
θ
−+−−=+−= ∫ ccc pUdpUCW (18)
( ) ( )∫ −=−=1
0
1~~
θ
θθ pUdpUCWa (19)
Total producer welfare in the market is given by the sum of organic producer welfare oPW ,
conventional producer welfare cPW , and producer welfare of the alternative product nPW :
( ) ( )( ) ( )2
1
2
2122
2
1
ϕϕγ
ϕϕϕγϕϕ
ϕ
−−−−=−−= ∫ ooooo cpdcpPW (20)
( ) ( ) 2
11
02
1
ϕδ
ϕϕδϕϕ
−−=−−= ∫ ccccc cpdcpPW (21)
( )∫ Π−=Π=1
2
2
1ϕ
ϕϕ nnn dPW (22)
However, there is some empirical evidence that organic production is environmental friendlier compared to conventional production (Dabbert et al., 2000). This difference in externalities between organic and conventional farming can be modeled either as conventional farming creating a negative externality that does not occur with organic production or as organic farming creating a positive externality that does not occur with conventional production. Following the later and assuming that the
positive externality per unit of organic production is a constant ( E ), the social profit curve
( ) Ecp ooo ++−=Π γϕ* lies above private profits in figure 2 and the social benefit of organic
farming (without internalization) is area CEGH in figure 2. Mathematically, the environmental benefit is given by
)( 12 ϕϕ −= EEBo (23)
Given the positive externality, 212 1 θϕϕ −=− is no longer the optimal market share of organic
products. Social supply of organic products is
( ) ( )
γµ
γγδϕϕ ccnooEBEBEBS
o
cpEcpx
−−Π−+−=−= *
1
*
2
* (24)
with the loss in producer welfare due to the positive external effect covering area JCEI in figure 2.

8
This gives the usual rational for government intervention in form of subsidies on the supply side or promotion of organic products on the demand side. In the following we compare a subsidy on organic production that fully internalizes the positive externality with an information policy aimed at increasing the utility consumers derive from organic products and thus increasing the share of organic food as well.
3 Subsidy on organic production In this policy scenario a subsidy s is set on each unit of organic food produced yielding a per unit
profit function of
( ) scp o
S
o
S
o ++−=Π γϕ (25)
with all other profit and indirect utility functions ((1)-(3) and (9)-(10)) left unchanged and the new
equilibrium prices denoted by S
op and S
cp , respectively. The resulting supply functions and the
equations for the equilibrium prices are given in the appendix. Welfare of organic producers S
oPW
and the government expenditure function S
G are given by
[ ] ( )( ) ( ) ( )( )2
1
2
2122
2
1
SSSS
o
S
oo
S
o
S
o scpdscpPW
S
S
ϕϕγ
ϕϕϕγϕϕ
ϕ
−−−+−=+−−= ∫ (26)
( )SSS sG 12 ϕϕ −= (27)
with all other welfare functions as in the basic model but with indices of the equilibrium prices changed and, consequently, changed market boundaries. The total welfare function is given by the
sum of all consumer and producers welfare functions and the environmental benefit SEB , reduced by
government expenditures denoted by S
G . Maximizing the total welfare function with respect to the
subsidy, the first order condition reads Es =*. Comparative statics for prices, market shares and
welfare are summarized in table 2. Partial derivatives of prices and quantities with respect to the subsidy s show that an increase in
the subsidy on organic production reduces both the organic and conventional price, increases the organic share and decreases the conventional share. Additionally, the total share of the conventional and the organic market increases. Looking at the welfare functions, an increase in the subsidy increases total consumer welfare and decreases total producer welfare. Aggregated welfare of organic consumers and producers increases for a positive change of the subsidy, whereas aggregated welfare of conventional producers and consumers decreases. However, individually conventional consumers gain as well due to the decrease in the price for the conventional product, and the increase in aggregated organic consumer welfare can compensate for the loss in aggregated conventional consumer welfare for total consumer welfare to increase. Therefore, only conventional producers experience a loss in individual welfare due to the subsidy, but the increase in organic producer welfare cannot fully offset the loss for total producer welfare to increase as well.

9
Table 2. Comparative statics – subsidy and information policy
subsidy information policy
equilibrium prices - +
- -
market shares + +
- -
- -
consumer welfare + +
- organic + +
- conventional - -
- substitute - -
producer welfare - -
- organic + +
- conventional - -
- alternative - -
op
cp
s ρ,Ψ
ox
cx
nax ,
CW
PW
Note: Table entries indicate the direction of the change that occurs in the endogenous variable for a positive change in the policy variables
4 Information policy Referring to a demand-side oriented policy, the aim of the information policy in this context is to increase the identification and acceptance of the label or simply to enhance the trust of consumers in the label, which indicates the credence attributes of the organic product. The economics literature distinguishes between persuasive and informative advertising. We believe that this kind of information policy belongs to the latter category by arguing that not any specific kind of agricultural product is advertised but simply the existence of a certain label promoted, which denotes a quality characteristic. We emphasize that the economic effect of the information policy can be interpreted as reduced search costs for consumers demanding organic products (see for example Nelson, 1970, and Butters, 1977) or reduced imperfect information on the demand side. This assumption implies, similar to the results of Giannakas (2002) regarding mislabeling of organic products, that labeling per se is a necessary, but still an insufficient mean in transferring a credence good into a search good.
Since any kind of economic modeling of an information policy (or advertising in general) is very critical (see, for example, the discussion in Cardon and Pope, 2003), two alternatives are possible:
First, it might be argued that consumers with a higher differentiating attribute θ are more sensitive to any information regarding organic products and, consequently, experience a higher utility
enhancement. As α will be further increased, this will cause the oU -curve to rotate counter-
clockwise around the point I
opU − at 0=θ by a certain amount and, thus, increases the willingness
to pay for the organic product. Alternatively, it can be argued, that all consumers reached by the information policy experience a higher utility enhancement irrespective of their differentiating
attribute θ , causing the oU -curve to shift upwards. For this option we will present the complete
analysis, which we will use for comparative purposes with the subsidy. For simplicity, let us assume
that all consumers located along θ are reached by the information policy with equal probability and that getting the information enhances utility, which leads to effective organic demand, provided that
consumers are located at a high enough θ . Since the information policy takes the form of random advertising, public expenditures are, however, subject to the probability to reach consumers (and thereby to the intensity to affect consumers’ utility in a certain manner), and subject to the costs of transferring the information to the final consumer (see, for example, the model in Butters, 1977).
To model the effect of the information policy on organic food demand we assume that any utility enhancement by reduced search costs and/or enhanced trust in the label enters the consumer’s organic
utility function in an additive way and causes the function to shift upwards by Ψρ . Ψ is the
probability to reach consumers by the information policy (i.e. the intensity of the information policy

10
and thus the policy variable for this option to increase the organic share) and ρ is an exogenously
given increase in utility once a consumer is reached by the information policy. In other words, all consumers reached by the information policy experience a higher utility enhancement irrespective of
their differentiating attribute θ :
αθρ +Ψ+−= I
o
I
o pUU (28)
Again, the resulting demand functions and equilibrium prices are given in the appendix. Welfare of organic consumers is given by
( ) ( ) ( )
Ψ−−−+
Ψ−−−Ψ+−=+Ψ+−= ∫ 2
21
12
1
2λ
ρα
λ
ρρθαθρ
θ
I
c
I
o
I
c
I
oI
o
I
o
I
o
pppppUdpUCW
I
(29)
All other welfare functions are the same as in the basic model with indices of equilibrium prices as well as market boundaries changed. Again, the total welfare function is the sum of all producer and consumer welfare functions and the positive external effect (environmental benefit) with the government expenditure function being subtracted. The government expenditure function (see, for example, Tirole, 1988) reads
Ψ−=
1
1lnvG
I (30)
with v being unit costs of sending and ad (i.e. actual costs of transferring the information to
consumers), which are exogenously given to the government. As the total number of consumers in the
market is θ , and 1=θ we can neglect the characteristic θ in the government expenditure function.
The inverse of the government expenditure function solved for the probability to reach consumers is given by
v
G I
e−
−=Ψ 1 (31) This means, given any fixed budget available to the government facing unit costs of sending an ad v , this yields the probability set by the government to reach consumers by the information policy.
Substituting Ψ of equation (31) into the total welfare function, the resulting level of total welfare can be compared to a supply-side oriented policy like the subsidy. However, treating government
expenditures endogenously, we calculate the total welfare maximizing probability *Ψ , which is given
in the appendix. The comparative statics for the information policy are given in table 2. Partial derivatives of
prices with respect to the utility enhancement ρ show that any utility enhancement of a constant
amount for all organic consumers increases the organic equilibrium price and decreases the
conventional price. Likewise, increasing the probability to reach consumers Ψ by the information policy causes the organic price to increase and the conventional price to decrease. The effect of the information policy on individual, aggregated and total welfare is exactly the same as in the case of the
subsidy. The welfare maximizing probability to reach consumers *Ψ increases for a positive change

11
of the environmental benefit E and the utility enhancement ρ with *Ψ approximating 1 and
decreases for positive changes of unit costs of sending an ad v .
5 Subsidy versus information policy and a combination of both policy measures We assume that the main goal of the policy is to attain an organic share of a certain amount with
either policy instrument (i.e. with a subsidy on organic production, an information policy on the demand side or with a combination of both). As noted, the welfare maximizing subsidy s equals the
environmental benefit E , yielding an organic share of S
ox . We now assume that the information
policy aims to internalize the positive external effect inherent in organic food production by increasing
the organic share as in the case of a subsidy, i.e. I
o
S
o xx!
= . As the increase in utility ρ due to the
information policy is exogenously given, the probability to reach consumers Ψ is set by the government to reach the desired organic share. By equating organic demand due to the subsidy and organic demand due to the information policy (or by equating the respective organic supply functions) and solving for s , the probability to reach consumers is given by
ρ
s=Ψ (32)
This implies that the indirect utility curve of organic consumers I
oU must shift upwards by Ψρ to
obtain the desired share. In this case it can be verified that S
c
I
c pp = and sppS
o
I
o += . Given the
utility enhancement ρ , the government will set the corresponding probability Ψ to reach consumers
(with Ψ being a decreasing function of ρ ) for organic shares to be equal under the two policy
scenarios. Now, the organic and the conventional equilibrium price are constant for any utility enhancement ρ . Given this, organic and conventional aggregate producer welfare, as well as organic
and conventional aggregate consumer welfare is exactly equal to the subsidy scenario. However, total welfare will be different due to government expenditures of the information policy (see equation (30)), which depend on the increase in utility ρ due to the information policy (which determines the
probability Ψ ) and unit costs of sending an ad v .
We now assume a combination of the two policy instruments, with the indirect utility function of
organic consumers IS
oU+
and the profit function of organic producers IS
o
+Π being
αθρ +Ψ+−= ++ IS
o
IS
o pUU (33)
( ) scp o
IS
o
IS
o ++−=Π ++ γϕ (34)
In determining corresponding values of the subsidy s and of the probability to reach consumers
Ψ , we, again, consider the goal to enhance the share of the organic market by the same amount as in
the scenarios of either a subsidy or an information policy. Let IS
ox+
be the desired organic market
share for I
o
S
o
IS
o xxx!!
==+. The respective supply and demand functions for this combination of policy
measures are given in the appendix. Producer welfare functions are the same as in the subsidy scenario and consumer welfare functions as in the information policy scenario with indices of prices changed. By equating organic demand due to a subsidy and organic demand due to a combination of the policy

12
measures for any given probability IS +Ψ , the corresponding subsidy as a function of the probability
( )ISISs ++ Ψ is given by
( ) ISISIS ss +++ Ψ−=Ψ ρ (35)
(or, conversely, ρ
ρ
ρ
ISISIS sss
+++ −Ψ
=−
=Ψ for any given subsidy IS
s+
). This implies, the higher
the probability to reach consumers set by the government, the lower will be the corresponding subsidy
to obtain the goal of IS
ox+
. Comparative statics are summarized in table 3. The change of direction of
the organic equilibrium price due to the policy variable(s) is the same as in the policy scenario of
solely an information policy (the organic equilibrium price increases as IS +Ψ increases), whereas
partial derivatives of the conventional price with respect to any policy variable are zero. Consequently,
as the organic market share is constant for all corresponding values of IS +Ψ and ( )ISISs ++ Ψ , the
conventional and residual market shares are constant as well, and consumer and producer welfare
remains constant for any combination of IS +Ψ and ( )ISISs ++ Ψ .
Table 3. Comparative statics - combination subsidy and information policy
exogenous
- + 0 0 0
- + 0 + 0 0
+ - 0 - 0 0
ρ
v
CW PWIS +Ψ
( )ISISs
++ ΨIS
op + IS
cp + IS +Ψ
Note: Table entries indicate the direction of the change that occurs in the endogenous variable for a positive change in the exogenous variables
Keeping the organic share fixed as implemented by equation (35), total welfare maximization can
be reached by minimizing total government expenditures ISTB + with respect to
IS +Ψ for
Ψ−+=+=
+
+++
IS
IS
o
ISISISvxsGGTB
1
1ln (36)
by substituting for ( )ISISs ++ Ψ to carry out a combination of a subsidy and an information policy
provided that I
o
S
o
IS
o xxx!!
==+. The probability
IS +Ψ*, which minimizes total government expenditures
is given in the appendix with the corresponding subsidy as a function of IS +Ψ* being
( ) ISISIS ss +++ Ψ−=Ψ *** ρ . The higher (lower) unit costs of sending an ad and the lower (higher) the
utility enhancement of organic consumers, the more IS +Ψ* tends towards zero ( ( )ISISs ++ Ψ**
becomes negative, i.e. a tax) and is therefore irrelevant for carrying out an information policy
(subsidy). Substituting IS +Ψ* and ( )ISISs ++ Ψ**
into the equations for the equilibrium prices,
comparative statics show that the organic equilibrium price increases (decreases) for a positive change in ρ (in v ), whereas the conventional equilibrium price remains constant. Again, it can be verified
that S
c
I
c
IS
c ppp ==+ and that
ISI
o
ISS
o
IS
o sppp+++ −=Ψ+= **ρ .
Table 4 summarizes by means of a numerical example the effect of the different policy measures considered. The subsidy s in column (2) was set in a way to fully internalize the environmental

13
benefit, i.e. Es = , which defines the desired organic share as a reference for the information policy and the combination of policy measures. However, using an information policy and maximizing
welfare with respect to Ψ , this might yield a lower organic share (see column (3)). Column (4) shows
the situation of an information policy, which does not maximize total welfare, but Ψ is set in a way for the desired organic share to be reached. Consequently, producer and consumer welfare as well as the provision of the environmental benefit are identical. However, total welfare is different due to different government expenditures and in this case even lower than in the baseline scenario in column (1). Alternatively, assuming a combination of a subsidy on organic production and an information policy at the same time in column (5), we determine the probability to reach consumers, which minimizes total government expenditures (i.e. maximizes total welfare) conditional on the desired organic share to be reached with the new subsidy being a function of this probability. Again, the conventional equilibrium price remains at the level of the scenarios with a single policy, but with the organic equilibrium price being the price of the information policy reduced by the subsidy of the policy mix scenario. As the expenditure minimizing probability is quite low in this example, the organic equilibrium price is lower than the respective price in the basic model. Table 4. Effect of organic food policies on prices, market shares and welfare
(1) (2) (3) (4) (5)
exogenous parameters Basic Subsidy InfoPol InfoPol Subsidy + InfoPol
20.00
9.00
4.00 organic supply/demand 0.34 0.41 0.38 0.41 0.41
3.00 conventional supply/demand 0.56 0.51 0.54 0.51 0.51
6.00 sum 0.90 0.92 0.92 0.92 0.92
8.00 organic price 10.70 10.27 10.74 10.77 10.50
3.00 conventional price 7.39 7.31 7.35 7.31 7.31
0.00 welfare:
0.50 consumers organic 5.67 6.90 6.32 6.90 6.90
7.00 conventional 7.96 7.21 7.56 7.21 7.21
0.60 residual 1.28 1.01 1.14 1.01 1.01
0.15 total consumer 14.91 15.12 15.02 15.12 15.12
producers organic 0.17 0.25 0.21 0.25 0.25
conventional 1.52 1.42 1.47 1.42 1.42
residual 0.00 0.00 0.00 0.00 0.00
total producer 1.69 1.67 1.68 1.67 1.67
gov. expenditures - 0.20 0.09 0.27 0.18
environm. benefit 0.17 0.20 0.19 0.20 0.20
total welfare 16.77 16.79 16.80 16.73 16.81
αβγδ
oc
cc
nΠE
p~
ρv
U 38.0 &=Ψ 39.0* =Ψ + IS
27.0* =+ISs
44.0* =Ψ50.0* =s
S
o
I
o xx = S
o
IS
o xx =+
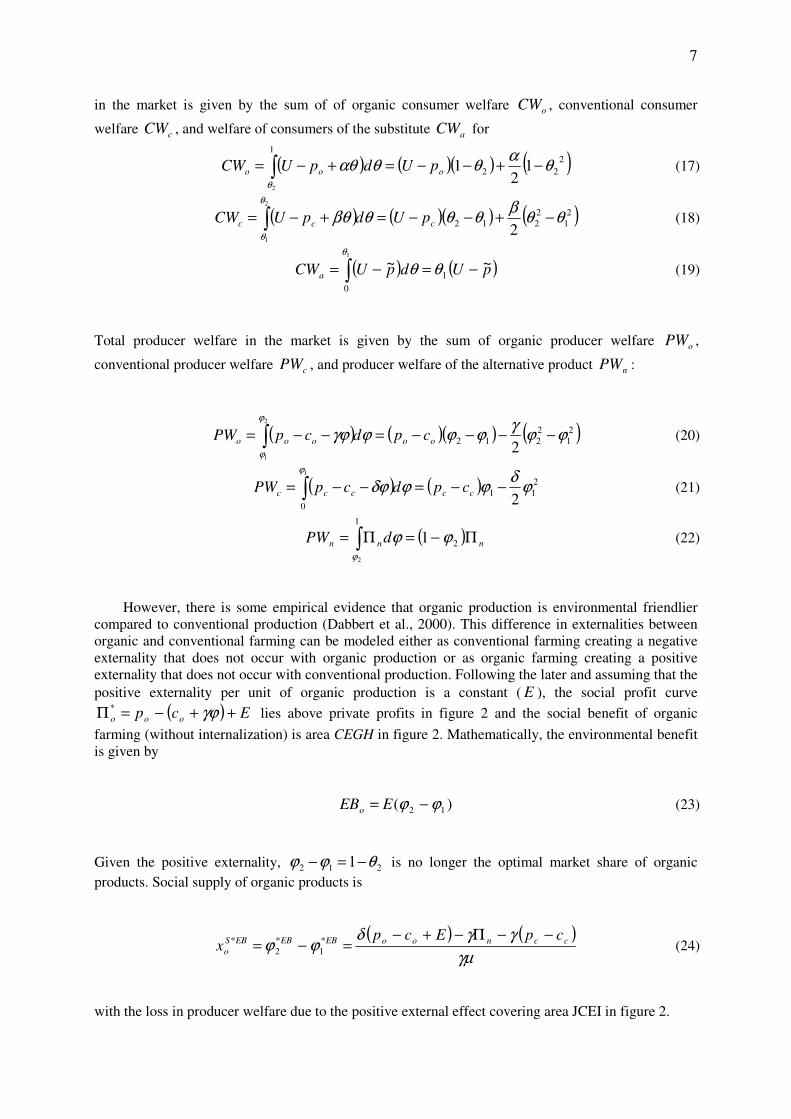
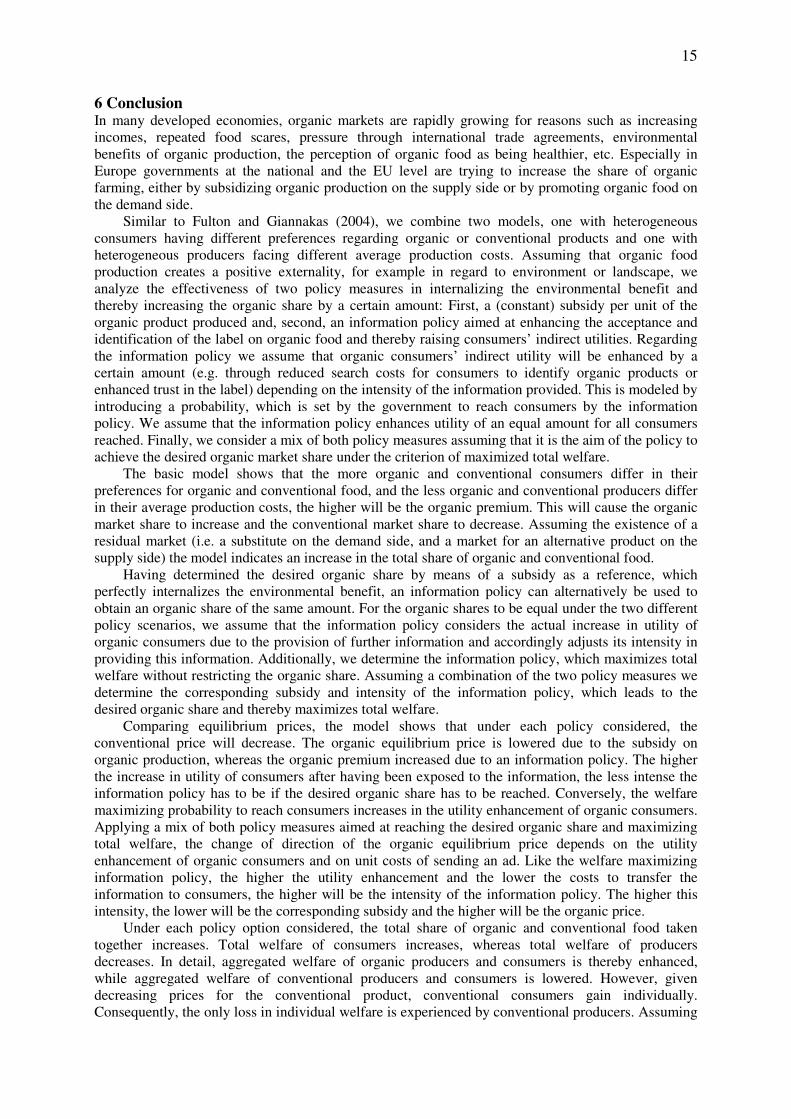
Using the numerical values of all exogenous parameters as in table 4, figure 3 denotes the relevant area for carrying out either a subsidy or an information policy (as a single policy measure) depending on the utility enhancement ρ and unit costs of sending an ad v . In the grey area above the lower
continuous line an information policy without any constraint on the organic share causes a higher total welfare than a subsidy. However, for the desired organic share as defined by the subsidy to be reached requires a higher exogenously given utility enhancement ρ as indicated by the dark grey area above
the upper continuous line. The relevant area for carrying out an information policy subject to the constraint on the desired organic share is given by the area above the dashed line. For all combinations of ρ and v in the relevant area, total welfare is lower than for an information policy without this
constraint. Consequently, using an information policy as a single policy measure without any constraint on the organic share, only in the dark grey area the environmental benefit is (more than) fully internalized. In figure 4 the combination of an information policy with a subsidy, which assumes total welfare maximization and the desired organic share to be reached, is added to the previous figure. The grey area shows the relevant combinations of ρ and v for carrying out a combination of both policy
measures (i.e. ( ) 0** >Ψ ++ ISISs and [ ]1,0* ∈Ψ + IS). Within this grey area, total welfare due to the
combination of an information policy and a subsidy is higher than total welfare for a subsidy and either kind of information policy, both as a single policy measure.

14
To summarize, for high (exogenously given) utility enhancements of organic consumers due to an information policy and low unit costs of sending an ad, an information policy as a single policy measure maximizes total welfare and provides an even higher organic share than the share as indicated by a subsidy. Conversely, if the utility enhancement is quite low and unit costs of sending an ad rather high, a subsidy may be superior in regard to welfare maximization. For utility enhancements and unit costs of sending an ad in between these two extreme positions, a combination of a subsidy with an information policy might require less resources than each of these instruments if applied alone and therefore both maximizes total welfare and perfectly internalizes the environmental benefit.
0
0.1
0.2
0.3
0.4
0.5
0.6
0.7
0.8
0.9
1
0 0.05 0.1 0.15 0.2 0.25
information policy
subsidy
Figure 3. Relevant area for carrying out either a subsidy or an information policy
Note: o indicates an information policy for S
o
I
o xx!
=
0
0.1
0.2
0.3
0.4
0.5
0.6
0.7
0.8
0.9
1
0 0.05 0.1 0.15 0.2 0.25
information policy
subsidy
policy mix
Figure 4. Choice of policy for total welfare maximization
15
6 Conclusion In many developed economies, organic markets are rapidly growing for reasons such as increasing incomes, repeated food scares, pressure through international trade agreements, environmental benefits of organic production, the perception of organic food as being healthier, etc. Especially in Europe governments at the national and the EU level are trying to increase the share of organic farming, either by subsidizing organic production on the supply side or by promoting organic food on the demand side.
Similar to Fulton and Giannakas (2004), we combine two models, one with heterogeneous consumers having different preferences regarding organic or conventional products and one with heterogeneous producers facing different average production costs. Assuming that organic food production creates a positive externality, for example in regard to environment or landscape, we analyze the effectiveness of two policy measures in internalizing the environmental benefit and thereby increasing the organic share by a certain amount: First, a (constant) subsidy per unit of the organic product produced and, second, an information policy aimed at enhancing the acceptance and identification of the label on organic food and thereby raising consumers’ indirect utilities. Regarding the information policy we assume that organic consumers’ indirect utility will be enhanced by a certain amount (e.g. through reduced search costs for consumers to identify organic products or enhanced trust in the label) depending on the intensity of the information provided. This is modeled by introducing a probability, which is set by the government to reach consumers by the information policy. We assume that the information policy enhances utility of an equal amount for all consumers reached. Finally, we consider a mix of both policy measures assuming that it is the aim of the policy to achieve the desired organic market share under the criterion of maximized total welfare.
The basic model shows that the more organic and conventional consumers differ in their preferences for organic and conventional food, and the less organic and conventional producers differ in their average production costs, the higher will be the organic premium. This will cause the organic market share to increase and the conventional market share to decrease. Assuming the existence of a residual market (i.e. a substitute on the demand side, and a market for an alternative product on the supply side) the model indicates an increase in the total share of organic and conventional food.
Having determined the desired organic share by means of a subsidy as a reference, which perfectly internalizes the environmental benefit, an information policy can alternatively be used to obtain an organic share of the same amount. For the organic shares to be equal under the two different policy scenarios, we assume that the information policy considers the actual increase in utility of organic consumers due to the provision of further information and accordingly adjusts its intensity in providing this information. Additionally, we determine the information policy, which maximizes total welfare without restricting the organic share. Assuming a combination of the two policy measures we determine the corresponding subsidy and intensity of the information policy, which leads to the desired organic share and thereby maximizes total welfare.
Comparing equilibrium prices, the model shows that under each policy considered, the conventional price will decrease. The organic equilibrium price is lowered due to the subsidy on organic production, whereas the organic premium increased due to an information policy. The higher the increase in utility of consumers after having been exposed to the information, the less intense the information policy has to be if the desired organic share has to be reached. Conversely, the welfare maximizing probability to reach consumers increases in the utility enhancement of organic consumers. Applying a mix of both policy measures aimed at reaching the desired organic share and maximizing total welfare, the change of direction of the organic equilibrium price depends on the utility enhancement of organic consumers and on unit costs of sending an ad. Like the welfare maximizing information policy, the higher the utility enhancement and the lower the costs to transfer the information to consumers, the higher will be the intensity of the information policy. The higher this intensity, the lower will be the corresponding subsidy and the higher will be the organic price.
Under each policy option considered, the total share of organic and conventional food taken together increases. Total welfare of consumers increases, whereas total welfare of producers decreases. In detail, aggregated welfare of organic producers and consumers is thereby enhanced, while aggregated welfare of conventional producers and consumers is lowered. However, given decreasing prices for the conventional product, conventional consumers gain individually. Consequently, the only loss in individual welfare is experienced by conventional producers. Assuming

16
that it is the goal to enhance the organic market share with a subsidy, with an information policy or with a combination of both policy instruments by the same amount, producer and consumer welfare as well as the provision of the environmental benefit is the same under each policy option. However, total government expenditures will be different, and therefore, the level of total welfare, depending on the one hand on the actual increase in utility due to the information policy, which determines the necessary intensity of the information policy and on the other hand on the actual costs of transferring the information to consumers.
Comparing the different policy options regarding total welfare, the model shows that an information policy can be more efficient than any other policy considered given substantially high increases in utility of organic consumers once they get the information and, of course, given low costs of transferring this information to consumers. For the opposite, a subsidy might be the better policy. For any combination of utility enhancements and unit costs of sending an ad in between these two extreme positions a combination of a subsidy with an information policy might be more efficient.
References Butters, G. (1977). Equilibrium Distribution of Sales and Advertising Prices. Review of Economic Studies 44:465-491. Cardon, J.H. and Pope, R.D. (2003). Agricultural Market Structure, Generic Advertising, and Welfare. Journal of Agricultural and Resource Economics 28:185-200. Dabbert, S., Stolze, M., Häring, A. and Piorr, A. (2000). A policy relevant assessment of the environmental impacts of organic farming. In Alföldi, T., Lockeretz, W. and Niggli, U. (eds.), Proceedings of the 13th International IFOAM Scientific Conference, IFOAM 2000 - The World Grows Organic, Hochschulverlag AG an der ETH Zürich, 148-151. Darby, M.R. and Karni, E. (1973). Free Competition and the Optimal Amount of Fraud. Journal of Law and Economics 16:67-88. Fulton, M., and L. Keyowski (1999). The Producer Benefits of Herbicide-Resistant Canola. AgBioForum 2:85-93. Fulton, M. and Giannakas, K. (2004). Inserting GM Products into the Food Chain: The Market and Welfare Effects of Different Labeling and Regulatory Regimes. American Journal of Agricultural Economics 86:42-60. Giannakas, K. (2000). Information Asymmetries and Consumption Decisions in Organic Food Product Markets. Canadian Journal of Agricultural Economics 50(2002):35-50. Nelson, P. (1970). Information and Consumer Behavior. Journal of Political Economy 78:311-329. Mussa, M. and Rosen, S. (1978). Monopoly and Product Quality. Journal of Economic Theory 18:301-337. Tirole, J. (1988). The Theory of Industrial Organization. Cambridge: The MIT Press. United States Department of Agriculture – USDA. (2004). Organic Farming and Marketing. Retrieved from the World Wide Web: http://www.ers.usda.gov/Briefing/Organic/, January 2004.

17
Appendix
Subsidy
Conventional supply: ( ) ( )
µϕ
scpcpx o
S
oc
S
cSSS
c
−−−−== 1
,
Organic supply: ( ) ( )
γµ
γµδϕϕ c
S
cno
S
oSSSS
o
cpscpx
−−Π−+−=−= 12
, for
γϕ
scp no
S
oS +Π−−=2
Alternative supply: ( )
γ
γϕ
scpx no
S
oSSS
n
−Π−−−=−= 2
, 1
Organic equil. price: ( )
−
−+
Π−
−−+−+
−−+
+
−
−−
−−+−+
−−+=
1
~
22
22
22
22*,
γµ
δ
γµγβγδβγαδαβ
αγδαβγγβαγ
βµγβγδβγαδαβ
βγδαβγγββγ
onc
coS
o
csc
psccp
Conventional equil. price: ( )
−
−+
Π−
−−+−+
−−+
+
−
−−
−−+−+
−−+=
1
~
22
22
22
22*,
γµ
δ
γµγβγδβγαδαβ
βγδαβγγββγ
βµγβγδβγαδαβ
βγδαβδδββγ
onc
coS
s
csc
psccp
Information policy
Conventional supply: µ
ϕ o
I
oc
I
cIIS
c
cpcpx
+−−== 1
,
Organic supply: ( ) ( )
γµ
γµδϕϕ c
I
cno
I
oIIIS
o
cpcpx
−−Π−−=−= 12
, for
γϕ no
I
oI cp Π−−=2
Alternative supply: ( )
γ
γϕ no
I
oIIS
n
cpx
Π−−−=−= 2
, 1
Organic demand: λ
ρλθ
Ψ++−=−=
I
c
I
oIID
o
ppx 2
, 1 for λ
ρθ
Ψ−−=
I
c
I
oI pp2
Alternative demand: β
θpp
xI
cIID~
~1
, −==
Conventional demand: βλ
λρβαβθθ
pppx
I
c
I
oIIID
c
~
12
, +Ψ−−=−=
Organic equil. price:
−
Ψ−−
Π−
−−+−+
−−+
+
−
Ψ+
−
−−+−+
−−+=
1
~
22
22
22
22*,
λ
ρ
γµ
δ
γµγβγδβγαδαβ
αγδαβγγβαγ
βλ
ρ
µγβγδβγαδαβ
βγδαβγγββγ
onc
coI
o
cc
pccp
Conventional equil. price:
−
Ψ−−
Π−
−−+−+
−−+
+
−
Ψ+
−
−−+−+
−−+=
1
~
22
22
22
22*,
λ
ρ
γµ
δ
γµγβγδβγαδαβ
βγδαβγγββγ
βλ
ρ
µγβγδβγαδαβ
βγδαβδδββγ
onc
coI
c
cc
pccp
Welfare maximizing probability to reach consumers: A
AvABABBA
4
8442 22* −++±−
=Ψ

18
for ( )
µγβλ
ρρ
2
2
222
22 2222222CDCDCDDCDDCC
A+−
+++++−+−
= ,
( )( ) ( ) ( ) ( )
( )( )ρ
µ
γβλ
ρ
+−−−+−−
+
+Π−−+
−+
+−−−=
CEccRRCD
EcRCpRDRRDRRCB
co
no
12
122121~
,
( )( )22
22
γβγδβγαδαβλ
αγαγδβγβγδρ
−−+−+
−++−=C ,
( )( )22
22
γβγδβγαδαβλ
γβαβγδβαβδρ
−−+−+
−++−=D ,
−−
Π−
−−+−+
−−+
+
−
−
−−+−+
−−+=
1
~
22
22
22
22
1
γµ
δ
γµγβγδβγαδαβ
αγδαβγγβαγ
βµγβγδβγαδαβ
βγδαβγγββγ
onc
co
cc
pccR
−−
Π−
−−+−+
−−+
+
−
−
−−+−+
−−+=
1
~
22
22
22
22
2
γµ
δ
γµγβγδβγαδαβ
βγδαβγγββγ
βµγβγδβγαδαβ
βγδαβδδββγ
onc
co
cc
pccR
Combination of subsidy and information policy
Conventional supply: ( ) ( )
µϕ
scpcpx o
IS
oc
IS
cISISS
c
−−−−==
++++
1
,
Alternative: γ
γϕ
scpx no
IS
oISISS
n
−Π++−=−=
+++
2
, 1 for γ
ϕscp no
IS
oIIS +Π−−=
++
2
Organic supply: ( ) ( )
γµ
γµδϕϕ c
IS
cno
IS
oISISISS
o
cpscpx
−−Π−+−=−=
+++++
12
,
Organic demand: λ
ρλθ
Ψ++−=−=
++++
IS
c
IS
oISISD
o
ppx 2
, 1 for λ
ρθ
Ψ−−=
+++
IS
c
IS
oIS pp2
Alternative demand: β
θpp
xIS
cISISD~
~1
, −==
+++
Conventional demand: βλ
ρβλαβθθ
Ψ−+−=−=
+++++ ppp
xIS
c
IS
oISISISD
c
~
12
,
Organic equil. price:
( )
( )22
22
22
22
1
γβγδβγαδαβ
γµ
δ
γµ
δ
λ
ρ
µγγβαγαγδαβγ
γβγδβγαδαβ
λ
ρ
µµµβγββγβγδαβγ
−−+−+
−−+
Ψ−+
Π−++−−
+−−+−+
Ψ++−−−++−−
=+
ocn
oc
IS
o
csc
ccsp
p

19
Conventional equil. price:
( )
( )22
22
22
22
1
γβγδβγαδαβ
γµ
δ
γµ
δ
λ
ρ
µγγββγβγδαβγ
γβγδβγαδαβ
λ
ρ
µµµβδββγβγδαβδ
−−+−+
−−+
Ψ−+
Π−++−−
+−−+−+
Ψ++−−−++−−
=+
ocn
oc
IS
c
csc
ccsp
p
Total budget minimizing Ψ for I
o
S
o
IS
o xxx!!
==+
( )( )( ) ( ) ( )( )( )αδββγαβγδβγδβρ
αδγβγδβγαβ
+−−+−Π−++++−
+−−+−−=Ψ +
2
22*
~1nco
IS
pccs
v