level ii scour analysis for bridge 25 ...-3 level ii scour analysis for bridge 25 (redsth00360025)...
TRANSCRIPT

-4
LEVEL II SCOUR ANALYSIS FORBRIDGE 25 (REDSTH00360025) onTOWN HIGHWAY 36, crossing theWEST BRANCH DEERFIELD RIVER,READSBORO, VERMONT
U.S. Geological SurveyOpen-File Report 97-653
Prepared in cooperation with
VERMONT AGENCY OF TRANSPORTATION
and
FEDERAL HIGHWAY ADMINISTRATION

-3
LEVEL II SCOUR ANALYSIS FORBRIDGE 25 (REDSTH00360025) onTOWN HIGHWAY 36, crossing theWEST BRANCH DEERFIELD RIVER,
READSBORO, VERMONT
By ROBERT H. FLYNN AND RONDA L. BURNS
U.S. Geological SurveyOpen-File Report 97-653
Prepared in cooperation with
VERMONT AGENCY OF TRANSPORTATION
and
FEDERAL HIGHWAY ADMINISTRATION
Pembroke, New Hampshire
1997

U.S. DEPARTMENT OF THE INTERIOR
BRUCE BABBITT, Secretary
U.S. GEOLOGICAL SURVEYGordon P. Eaton, Director
For additional information Copies of this report may bewrite to: purchased from:
District Chief U.S. Geological SurveyU.S. Geological Survey Branch of Information Services361 Commerce Way Open-File Reports UnitPembroke, NH 03275-3718 Box 25286
Denver, CO 80225-0286

-1
CONTENTSIntroduction and Summary of Results ............................................................................................................... 1
Level II summary ............................................................................................................................................... 7Description of Bridge ................................................................................................................................... 7Description of the Geomorphic Setting........................................................................................................ 8Description of the Channel........................................................................................................................... 8Hydrology..................................................................................................................................................... 9 Calculated Discharges .......................................................................................................................... 9Description of the Water-Surface Profile Model (WSPRO) Analysis ......................................................... 10 Cross-Sections Used in WSPRO Analysis............................................................................................ 10 Data and Assumptions Used in WSPRO Model ................................................................................... 11Bridge Hydraulics Summary........................................................................................................................ 12Scour Analysis Summary ............................................................................................................................. 13 Special Conditions or Assumptions Made in Scour Analysis............................................................... 13 Scour Results......................................................................................................................................... 14Riprap Sizing................................................................................................................................................ 14
References .......................................................................................................................................................... 18
Appendixes:
A. WSPRO input file.................................................................................................................................... 19
B. WSPRO output file .................................................................................................................................. 22
C. Bed-material particle-size distribution .................................................................................................... 32
D. Historical data form................................................................................................................................. 34
E. Level I data form...................................................................................................................................... 40
F. Scour computations.................................................................................................................................. 50
FIGURES
1. Map showing location of study area on USGS 1:24,000 scale map ............................................................. 3 2. Map showing location of study area on Vermont Agency of Transportation town
highway map ................................................................................................................................... 4 3. Structure REDSTH00360025 viewed from upstream (August 1, 1996) ...................................................... 5 4. Downstream channel viewed from structure REDSTH00360025 (August 1, 1996).................................... 5 5. Upstream channel viewed from structure REDSTH00360025 (August 1, 1996)......................................... 6 6. Structure REDSTH00360025 viewed from downstream (August 1, 1996). ............................................... 6 7. Water-surface profiles for the 100- and 500-year discharges at structure
REDSTH00360025 on Town Highway 36, crossing the West Branch Deerfield River, Readsboro, Vermont........................................................................................................................ 15
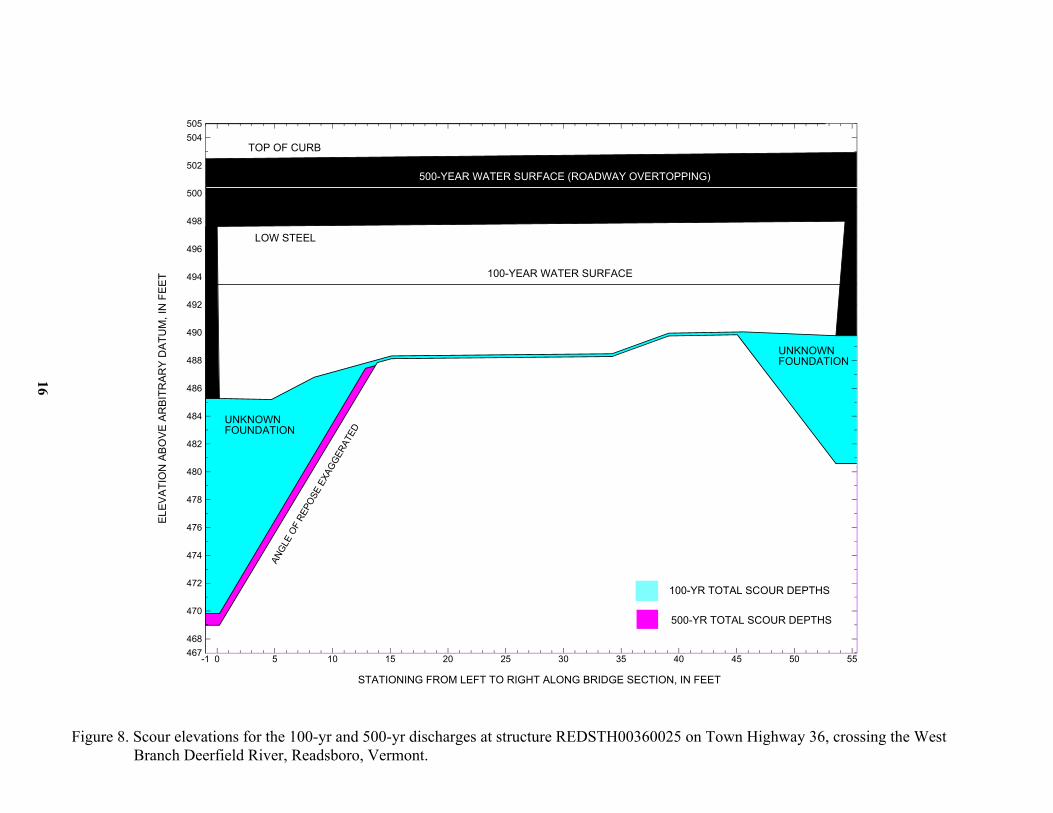
8. Scour elevations for the 100- and 500-year discharges at structure REDSTH00360025 on Town Highway 36, crossing the West Branch Deerfield River, Readsboro, Vermont........................................................................................................................ 16
TABLES
1. Remaining footing/pile depth at abutments for the 100-year discharge at structureREDSTH00360025 on Town Highway 36, crossing the West Branch Deerfield River,Readsboro, Vermont ........................................................................................................................... 17
2. Remaining footing/pile depth at abutments for the 500-year discharge at structure REDSTH00360025 on Town Highway 36, crossing the West Branch Deerfield River,Readsboro, Vermont ........................................................................................................................... 17
iii
0iv
CONVERSION FACTORS, ABBREVIATIONS, AND VERTICAL DATUM
Multiply By To obtain
Length
inch (in.) 25.4 millimeter (mm) foot (ft) 0.3048 meter (m) mile (mi) 1.609 kilometer (km)
Slope
foot per mile (ft/mi) 0.1894 meter per kilometer (m/km)Area
square mile (mi2) 2.590 square kilometer (km2) Volume
cubic foot (ft3) 0.02832 cubic meter (m3)Velocity and Flow
foot per second (ft/s) 0.3048 meter per second (m/s)cubic foot per second (ft3/s) 0.02832 cubic meter per second (m3/s)cubic foot per second per 0.01093 cubic meter per square mile second per square [(ft3/s)/mi2] kilometer [(m3/s)/km2]
OTHER ABBREVIATIONS
BF bank full LWW left wingwallcfs cubic feet per second MC main channelD50 median diameter of bed material RAB right abutmentDS downstream RABUT face of right abutmentelev. elevation RB right bankf/p flood plain ROB right overbankft2 square feet RWW right wingwallft/ft feet per foot TH town highwayJCT junction UB under bridgeLAB left abutment US upstreamLABUT face of left abutment USGS United States Geological SurveyLB left bank VTAOT Vermont Agency of TransportationLOB left overbank WSPRO water-surface profile model
In this report, the words “right” and “left” refer to directions that would be reported by an observer facing downstream.
Sea level: In this report, “sea level” refers to the National Geodetic Vertical Datum of 1929-- a geodetic datum derived from a general adjustment of the first-order level nets of the United States and Canada, formerly called Sea Level Datum of 1929.
In the appendices, the above abbreviations may be combined. For example, USLB would represent upstream left bank.

LEVEL II SCOUR ANALYSIS FOR BRIDGE 25 (REDSTH00360025) ON TOWN HIGHWAY 36,
CROSSING THE WEST BRANCH DEERFIELD RIVER,
READSBORO, VERMONTBy Robert H. Flynn and Ronda L. Burns
INTRODUCTION AND SUMMARY OF RESULTS
This report provides the results of a detailed Level II analysis of scour potential at structure REDSTH00360025 on Town Highway 36 crossing the West Branch Deerfield River, Readsboro, Vermont (figures 1–8). A Level II study is a basic engineering analysis of the site, including a quantitative analysis of stream stability and scour (U.S. Department of Transportation, 1993). Results of a Level I scour investigation also are included in Appendix E of this report. A Level I investigation provides a qualitative geomorphic characterization of the study site. Information on the bridge, gleaned from Vermont Agency of Transportation (VTAOT) files, was compiled prior to conducting Level I and Level II analyses and is found in Appendix D.
The site is in the Green Mountain section of the New England physiographic province in south-central Vermont. The 14.5-mi2 drainage area is in a predominantly rural and forested basin. In the vicinity of the study site, the surface cover is pasture on the upstream right bank and forest on the upstream left bank. The surface cover on the downstream right and left banks is primarily grass, shrubs and brush.
In the study area, the West Branch Deerfield River has an incised, sinuous channel with a slope of approximately 0.02 ft/ft, an average channel top width of 65 ft and an average bank height of 4 ft. The channel bed material ranges from gravel to boulders, with a median grain size (D50) of 117 mm (0.383 ft). The geomorphic assessment at the time of the Level I and Level II site visit on August 1, 1996, indicated that the reach was stable.
The Town Highway 36 crossing of the West Branch Deerfield River is a 59-ft-long, two-lane bridge consisting of one 57-foot concrete T-beam span (Vermont Agency of Transportation, written communication, September 28, 1995). The opening length of the structure parallel to the bridge face is 54 ft. The bridge is supported by vertical, concrete abutments with wingwalls. The channel is skewed approximately 50 degrees to the opening while the opening-skew-to-roadway is 30 degrees.
1

During the Level I assessment, a scour hole approximately 2 ft deeper than the mean thalweg depth was observed along the upstream right wingwall and a scour hole approximately 1 ft deeper than the mean thalweg depth was observed along the downstream left wingwall. The scour protection measure at the site was type-2 stone fill (less than 36 inches diameter) at the downstream end of the downstream left wingwall, at the upstream end of the upstream right wingwall, at the downstream end of the right abutment, along the entire base length of the downstream right wingwall, along the upstream right bank and along the downstream left bank. A stone wall was noted along the upstream left bank. Additional details describing conditions at the site are included in the Level II Summary and Appendices D and E.
Scour depths and recommended rock rip-rap sizes were computed using the general guidelines described in Hydraulic Engineering Circular 18 (Richardson and others, 1995). Total scour at a highway crossing is comprised of three components: 1) long-term streambed degradation; 2) contraction scour (due to accelerated flow caused by a reduction in flow area at a bridge) and; 3) local scour (caused by accelerated flow around piers and abutments). Total scour is the sum of the three components. Equations are available to compute depths for contraction and local scour and a summary of the results of these computations follows.
Contraction scour for all modelled flows ranged from 0.0 to 0.6 ft. The worst-case contraction scour occurred at the incipient-overtopping discharge. Abutment scour ranged from 15.1 to 16.3 ft along the left abutment and from 7.4 to 9.2 ft along the right abutment. The worst-case abutment scour occurred at the incipient-overtopping and 500-year discharges for the left abutment and at the 500-year discharge for the right abutment. Additional information on scour depths and depths to armoring are included in the section titled “Scour Results”. Scoured-streambed elevations, based on the calculated scour depths, are presented in tables 1 and 2. A cross-section of the scour computed at the bridge is presented in figure 8. Scour depths were calculated assuming an infinite depth of erosive material and a homogeneous particle-size distribution.
It is generally accepted that the Froehlich equation (abutment scour) gives “excessively conservative estimates of scour depths” (Richardson and others, 1995, p. 47). Usually, computed scour depths are evaluated in combination with other information including (but not limited to) historical performance during flood events, the geomorphic stability assessment, existing scour protection measures, and the results of the hydraulic analyses. Therefore, scour depths adopted by VTAOT may differ from the computed values documented herein.
2
3
Figure 1. Location of study area on USGS 1:24,000 scale map.
Stamford, VT. Quadrangle, 1:24,000, 1954 and
Readsboro, VT. Quadrangle, 1:24,000, 1987
NORTH

4
Figure 2. Location of study area on Vermont Agency of Transportation town highway map.

Figure 3. Structure REDSTH00360025 viewed from upstream (August 1, 1996).
Figure 4. Downstream channel viewed from structure REDSTH00360025 (August 1, 1996).
5

Figure 5. Upstream channel viewed from structure REDSTH00360025 (August 1, 1996).
Figure 6. Structure REDSTH00360025 viewed from downstream (August 1, 1996).
6

LEVEL II SUMMARY
Structure Number Stream
County
Bridge length
Alignment of bri
Abutment type
Stone fill on abut
Is bridge skewed
Debris accumul
Level I
Potential fo
REDSTH00360025
7
Road
Description of Bridge
ft Bridge width
ght)
Embankme
ment?
to flood flow according t rvey?
ation on bridge at time of Level I or Level
D Percent blocked
r debris
West Branch Deerfield River
District
Bennington TH36nt type
Angle
II site visit:
Percent blocked
1
59
23.4 57 ft Max span length ftCurve, left; straight, right
dge to road (on curve or straiVertical, concrete
Sloping
No
8/1/96 Type-
Date of inspection2 stone fill at the downstream end of the downstream left wingwall, at
Description of stone fillthe upstream end of the upstream right wingwall, at the downstream end of the right abutment andalong the entire base length of the downstream right wingwall.
The abutments and wingwalls are concrete. A two feet
Brief description of piers/abutments deep scour hole exists in front of the upstream right wingwall and a one foot deep scour hole exists
in front of the downstream left wingwall.
Yes
50o Level I suYes
Is bridge located on a bend in channel? If so, describe (mild, moderate, severe) There is a severe channel bend in both the upstream and downstream reach. The scour holes have
developed in the locations where the flow impacts the wingwalls.
ate of inspection 8/1/96
of channel horizontally 0
of channel vertically
0
8/1/96
0 0Low. There is no debris in the channel near the bridge and the
Level IIupstream channel is stable.
There is a point bar along the upstream left bank and a mid-channel bar underneath the bridge.
Describe any features near or at the bridge that may affect flow (include observation date).There is a bridge approximately 310 ft downstream of this site, creating a potential for backwater at
higher flows (8/1/96).

Description of the Geomorphic Setting
General topography
Geomorphic conditio
Date of insp
DS left:
DS right:
US left:
US right:
Average top width
Predominant bed ma
Vegetative c
DS left:
DS right:
US left:
US right:
The channel is located in a narrow, irregular flood plain within a moderate
relief valley setting.
wnstream (DS), upstream (US)
ns at bridge site: do8/1/96
ectionSteeply sloped channel bank.
Moderately sloped channel bank to narrow flood plain and VT100
Moderately sloped channel bank.
Steeply sloped channel bank to narrow flood plain and VT100.
Description of the Channel
teri
65
Average depthal Bank material
8
4
ftBoulder / Cobbles
ftBoulder/Cobbles
Sinuous but stable
Stream type (straight, meandering, braided, swampy, channelized) with non-alluvial channel boundaries and a narrow flood plain.
8/1/96
over on channel banks near bridge: Date of inspection Grass, shrubs and brush
Trees and brush
Trees
Trees and pasture
Yes
? If not, describe location and type of instability and -
Do banks appear stabledate of observation.
The assessment of
Describe any obstructions in channel and date of observation. 8/1/96 noted flow conditions are influenced by a point bar on the upstream left bank and a mid-
channel bar under the bridge as well as a bridge approximately 310 ft downstream of this site.

Hydrology
Drainage area i2
Percentage of dra
Is drainage a
Is there a USGS
Is there a lake/
Q
m14.5
inage area in physiographic provinces: (approximate)
Perc age area
Physiographic province/section New England/Green Mountaingage on the stream of interest
USGS gage description
USGS gage number
Gage drainage area mi2
Calculated Discharges
100 ft3/s
9
ent of drain100
Rural
rea considered rural or urban? Describe any significant
urbanization:
No
?--
--
--No
pond that will significantly affect hydrology/hydraulics?-
If so, describe
3,020
4,750Q500 ft3/sThe 100- and 500-year discharges are based on flood
Method used to determine discharges frequency estimates available from the VTAOT database. These values were selected due to the
central tendency of the discharge frequency curve with others which were developed from
empirical relationships and extended to the 500-year discharge
(Benson, 1962; Johnson and Tasker, 1974; FHWA, 1983; Potter, 1957a&b; Talbot, 1887)

Description of the Water-Surface Profile Model (WSPRO) Analysis
Datum for WSPRO analysis (USGS survey, sea level, VTAOT plans)
Datum tie between USGS survey and VTAOT plans
Cross-Sections Used in WSPRO Analysis
1 For location of cross-sections see plan-view sketch included with Level I field form, Appendix For more detail on how cross-sections were developed see WSPRO input file.
10
1Cross-section
Section Reference Distance (SRD) in
feet
2Cross-section development
Com
EXIT2 -502 1 VT100 bridge exit section.
FLV2 -352 2VT100 bridge Full-valley seEXIT2).
DSBRG -352 1 VT100 bridge section.
RDWY2 -332 1 VT100 Road Grade section.
APPR2 -257 2Modelled Approach section ofrom APTM2).
APTM2 -61 1 TH36 exit section as surveye
EXIT3 -150 2 TH36 Bridge exit section (Te
EXIT1 -61 2 TH36 Bridge exit section (A
FULLV 0 2 TH36 Full-valley section (Te
BRIDG 0 1 TH36 Bridge section.
RDWAY 14 1 TH36 Road grade section.
APPRO 76 2Modelled TH36 Approach seAPTEM).
APTEM 122 1 TH36 approach section as su
USGS survey
None.
RM1 is a chiseled X on top
Description of reference marks used to determine USGS datum.of the upstream end of the left abutment (elev. 501.51 ft, arbitrary survey datum). RM2 is a VTAOT
survey disk on top of the downstream right concrete rail on the downstream bridge (VT100) (elev. 496.90
ft, arbitrary survey datum). RM3 is a chiseled X on top of the downstream end of the right abutment (elev.
501.84 ft, arbitrary survey datum).
E.
ments
ction (Templated from
f VT100 Bridge (Templated
d (Used as a template).
mplated from APTM2).
s surveyed).
mplated from EXIT1).
ction (Templated from
rveyed (Used as a template).

Data and Assumptions Used in WSPRO Model
11
Hydraulic analyses of the reach were done by use of the Federal Highway Administration’s
WSPRO step-backwater computer program (Shearman and others, 1986, and Shearman, 1990). The
analyses reported herein reflect conditions existing at the site at the time of the study. Furthermore,
in the development of the model it was necessary to assume no accumulation of debris or ice at the
site. Results of the hydraulic model are presented in the Bridge Hydraulic Summary, Appendix B,
and figure 7.
Channel roughness factors (Manning’s “n”) used in the hydraulic model were estimated
using field inspections at each cross section following the general guidelines described by Arcement
and Schneider (1989). Final adjustments to the values were made during the modelling of the reach.
Channel “n” values for the reach ranged from 0.050 to 0.055, and overbank “n” values ranged from
0.045 to 0.065.
Critical depth at the VT100 bridge exit section (EXIT2), approximately 500 ft downstream
of this site, was assumed as the starting water surface. This depth was computed by use of the slope-
conveyance method outlined in the user’s manual for WSPRO (Shearman, 1990). The slope used
was 0.0158 ft/ft, which was estimated from the topographic map (U.S. Geological Survey, 1954,
1987). This slope resulted in a normal depth slightly less than critical depth and WSPRO defaulted
to critical depth. Critical depth in the downstream reach for the flows modelled is considered to be a
satisfactory solution.
The surveyed approach section (APTEM) was moved along the approach channel slope
(0.0098 ft/ft) to establish the modelled approach section (APPRO), one bridge length upstream of
the upstream face as recommended by Shearman and others (1986). This location also provides a
consistent method for determining scour variables.
For the 100-year and incipient-overtopping discharges, WSPRO assumes critical depth at
the bridge section. Supercritical models were developed for these discharges. After analyzing both
the supercritical and subcritical profiles for each discharge, it was determined that the water surface
profile does pass through critical depth within the bridge opening. Thus, the assumptions of critical
depth at the bridge are satisfactory solutions.
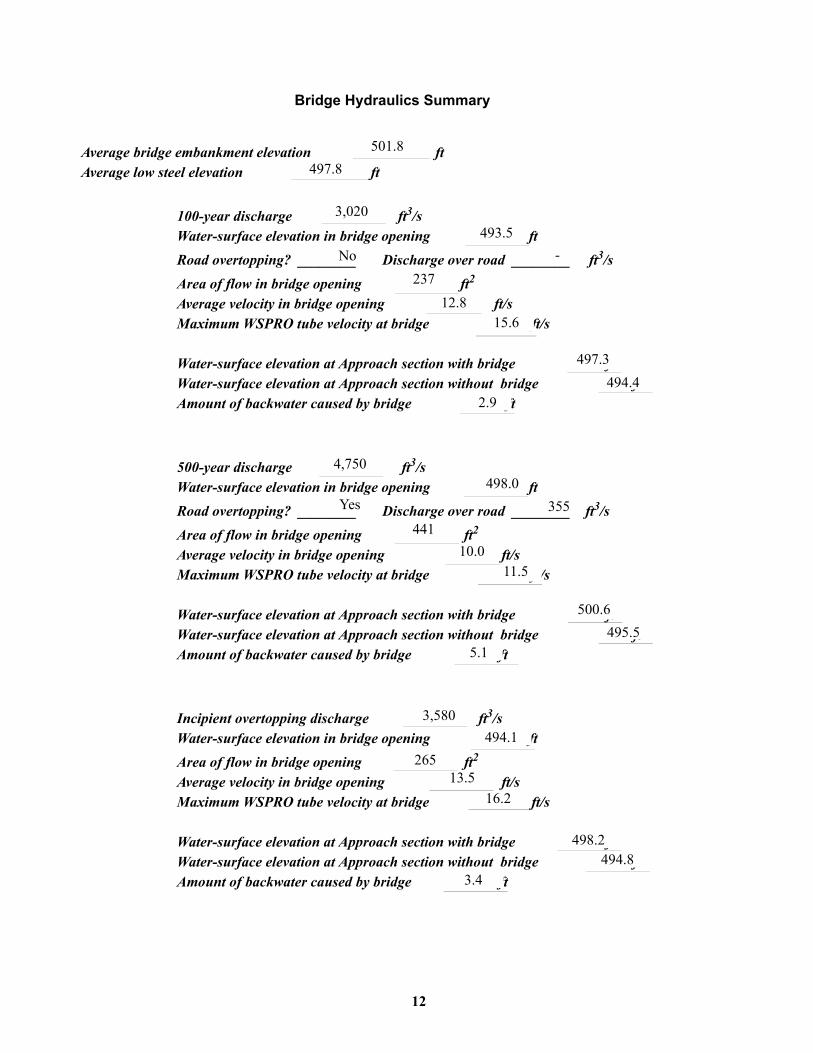
Bridge Hydraulics Summary
Average bridge embankment eleva ftAverage low steel elevation
100-year discharge Water-surface elevati
Road overtopping? _
Area of flow in bridge openAverage velocity in bridge oMaximum WSPRO tube vel Water-surface elevation at AWater-surface elevation at AAmount of backwater cause
500-year discharge Water-surface elevatio
Road overtopping? __
Area of flow in bridge openAverage velocity in bridge oMaximum WSPRO tube vel Water-surface elevation at AWater-surface elevation at AAmount of backwater cause
Incipient overtopping dischWater-surface elevation in b
Area of flow in bridge openAverage velocity in bridge oMaximum WSPRO tube vel Water-surface elevation at AWater-surface elevation at AAmount of backwater cause
501.8
ft
tion497.8
ft3/s
3,02012
ening
ing pening ocity at bridge
pproach section wipproach section wd by bridge
ft3/s ening
ing pening ocity at bridge pproach section wipproach section
d by bridge
arge ridge opening
ing pening ocity at bridge pproach section wipproach sectio
d by bridge
ft493.5
r road _ /s
on in bridge op
_______ DNo
2
th bridge
r road _2
th bridge
3
th bridge
_______ ft3-
ischarge oveft237
12.8
ft/s ft/s15.6ge
_
dge
/s
dge
ft497.3
ft494.4
ithout brid ft2.94,750
ft498.0
/s
n in bridge op
______ DYes
______ ft3355 ischarge ovef441
t ft10.0 /sft/s11.5
ft500.6
ft495.5
without bri ft5.1f3,580
t /s ft494.1f265
t2f13.5
t/s ft16.2ft498.2
ft494.8
n without bri ft3.4
Scour Analysis Summary
Special Conditions or Assumptions Made in Scour Analysis
13
Scour depths were computed using the general guidelines described in Hydraulic
Engineering Circular 18 (Richardson and others, 1995). Scour depths were calculated
assuming an infinite depth of erosive material and a homogeneous particle-size distribution.
Contraction scour for the 100-year and incipient-overtopping discharge was
computed by use of the clear-water contraction scour equation (Richardson and others, 1995,
p. 32, equation 20). At this site, the 500-year discharge resulted in unsubmerged orifice flow.
Contraction scour at bridges with orifice flow is best estimated by use of the Chang pressure-
flow scour equation (oral communication, J. Sterling Jones, October 4, 1996). Thus,
contraction scour was computed by use of the Chang equation (Richardson and others, 1995,
p. 145-146). Results of this analysis are presented in figure 8 and tables 1 and 2. Additional
estimates of contraction scour for the 500-year discharge were also computed by use of
Laursen’s clear-water scour equation and the results presented in Appendix F. The
streambed armoring depths computed suggest that armoring will not limit the depth of
contraction scour.
Abutment scour for the left abutment was computed by use of the Froehlich equation
(Richardson and others, 1995, p. 48, equation 28). Variables for the Froehlich equation
include the Froude number of the flow approaching the embankments, the length of the
embankment blocking flow, and the depth of flow approaching the embankment less any
roadway overtopping.
Scour at the right abutment was computed by use of the HIRE equation (Richardson
and others, 1995, p. 49, equation 29) because the HIRE equation is recommended when the
length to depth ratio of the embankment blocking flow exceeds 25. The variables used by
the HIRE abutment-scour equation are defined the same as those defined for the Froehlich
abutment-scour equation.

Scour Results
Incipient overtopping
Contraction scour: 100-yr discharge 500-yr discharge discharge
(Scour depths in feet)
Main channel
Live-bed scour
Clear-water scour
Depth to armoring
Left overbank
Right overbank
Local scour:
Abutment scour
Left abutment
Right abutment
Pier scour
Pier 1
Pier 2
Pier 3
Abutments:
Left abutment
Right abutment
Piers:
Pier 1
Pier 2
______--
14
______
______
______
Riprap Sizing
100-yr discharge
_
______
______--
______
______
______
500-yr discharg
et)
______
______
______--
______ 0.4
______ 0.0
______0.6
24.8 2.8
27.8 -- ______--
______--
______--
______--
______--
______15.1
______16.3
16.3 9.0o
e
9.2
______ 7.4
______ -- ______--______
--
-- --______--
______-- ______--______--
______2.1 ______ 2.2______
Incipient vertopping
discharge
2.4
(D50 in fe2.1
2.2______ 2.4
--______--
______ --
______ --
______--
--
-- -- _____--
______ ____________

15
-525 100-500 -475 -450 -425 -400 -375 -350 -325 -300 -275 -250 -225 -200 -175 -150 -125 -100 -75 -50 -25 0 25 50 75475
504
476
477
478
479
480
481
482
483
484
485
486
487
488
489
490
491
492
493
494
495
496
497
498
499
500
501
502
503
Figure 7. Water-surface profiles for the 100- and 500-yr discharges at structure REDSTH00360025 on Town Highway 36, crossing the West Branch Deerfield River, Readsboro, Vermont.
TH36 BRIDGE DECK
500-YR WATER SURFACE PROFILE
100-YR WATER SURFACE PROFILE
ELE
VA
TIO
N A
BO
VE
AR
BIT
RA
RY
DA
TU
M, I
N F
EE
T
CHANNEL DISTANCE FROM DOWNSTREAM TO UPSTREAM, IN FEET
EXIT SECTION (EXIT1)
BRIDGE SECTION (BRIDG)
APPROACH SECTION (APPRO)
MINIMUM BED ELEVATION
EXIT SECTION (EXIT2)
APPROACH SECTION (APPR2)
BRIDGE SECTION (DSBRG)
VT100 BRIDGE DECK
16
-1 0 5 10 15 20 25 30 35 40 45 50 55467
505
468
470
472
474
476
478
480
482
484
486
488
490
492
494
496
498
500
502
504
Figure 8. Scour elevations for the 100-yr and 500-yr discharges at structure REDSTH00360025 on Town Highway 36, crossing the West Branch Deerfield River, Readsboro, Vermont.
EL
EV
AT
ION
AB
OV
E A
RB
ITR
AR
Y D
AT
UM
, IN
FE
ET
STATIONING FROM LEFT TO RIGHT ALONG BRIDGE SECTION, IN FEET
500-YEAR WATER SURFACE (ROADWAY OVERTOPPING)
100-YEAR WATER SURFACE
100-YR TOTAL SCOUR DEPTHS
500-YR TOTAL SCOUR DEPTHS
UNKNOWNFOUNDATION
TOP OF CURB
LOW STEEL
AN
GLE
OF
RE
PO
SE
EX
AG
GE
RA
TED
UNKNOWNFOUNDATION

17
Table 1. Remaining footing/pile depth at abutments for the 100-year discharge at structure REDSTH00360025 on Town Highway 36, crossing the West Branch Deerfield River, Readsboro, Vermont.[VTAOT, Vermont Agency of Transportation; --,no data]
Description Station1
1.Measured along the face of the most constricting side of the bridge.
VTAOT minimum low-chord elevation
(feet)
Surveyed minimum low-chord elevation2
(feet)
2.Arbitrary datum for this study.
Bottom of footing
elevation2
(feet)
Channel elevation at abutment/
pier2
(feet)
Contraction scour depth
(feet)
Abutment scour depth (feet)
Pier scour depth (feet)
Depth of total scour
(feet)
Elevation of scour2
(feet)
Remaining footing/pile
depth(feet)
100-yr. discharge is 3,020 cubic-feet per second
Left abutment 0.2 - 497.6 - 485.3 0.4 15.1 -- 15.5 469.8 -
Right abutment 53.6 - 498.0 - 489.8 0.4 9.0 -- 9.4 480.4 -
Table 2. Remaining footing/pile depth at abutments for the 500-year discharge at structure REDSTH00360025 on Town Highway 36, crossing the West Branch Deerfield River, Readsboro, Vermont.[VTAOT, Vermont Agency of Transportation; --, no data]
Description Station1
1.Measured along the face of the most constricting side of the bridge.
VTAOT minimum low-chord elevation
(feet)
Surveyed minimum low-chord elevation2
(feet)
2.Arbitrary datum for this study.
Bottom of footing
elevation2
(feet)
Channel elevation at abutment/
pier2
(feet)
Contraction scour depth
(feet)
Abutment scour depth (feet)
Pier scour depth (feet)
Depth of total scour
(feet)
Elevation of scour2
(feet)
Remaining footing/pile
depth(feet)
500-yr. discharge is 4,750 cubic-feet per second
Left abutment 0.2 - 497.6 - 485.3 0.0 16.3 -- 16.3 469.0 -
Right abutment 53.6 - 498.0 - 489.8 0.0 9.2 -- 9.2 480.6 -

18
SELECTED REFERENCES
Arcement, G.J., Jr., and Schneider, V.R., 1989, Guide for selecting Manning’s roughness coefficients for natural channels and flood plains: U.S. Geological Survey Water-Supply Paper 2339, 38 p.
Barnes, H.H., Jr., 1967, Roughness characteristics of natural channels: U.S. Geological Survey Water-Supply Paper 1849, 213 p.
Benson, M. A., 1962, Factors Influencing the Occurrence of Floods in a Humid Region of Diverse Terrain: U.S. Geological Survey Water-Supply Paper 1580-B, 64 p.
Brown, S.A. and Clyde, E.S., 1989, Design of riprap revetment: Federal Highway Administration Hydraulic Engineering Circular No. 11, Publication FHWA-IP-89-016, 156 p.
Federal Highway Administration, 1983, Runoff estimates for small watersheds and development of sound design: Federal Highway Administration Report FHWA-RD-77-158.
Federal Highway Administration, 1993, Stream Stability and Scour at Highway Bridges: Participant Workbook: Federal Highway Administration Report FHWA-HI-91-011.
Froehlich, D.C., 1989, Local scour at bridge abutments in Ports, M.A., ed., Hydraulic Engineering--Proceedings of the 1989 National Conference on Hydraulic Engineering: New York, American Society of Civil Engineers, p. 13-18.
Hayes, D.C.,1993, Site selection and collection of bridge-scour data in Delaware, Maryland, and Virginia: U.S. Geological Survey Water-Resources Investigation Report 93-4017, 23 p.
Interagency Advisory Committee on Water Data, 1982, Guidelines for determining flood flow frequency: U.S. Geological Survey, Bulletin 17B of the Hydrology Subcommittee, 190 p.
Johnson, C.G. and Tasker, G.D.,1974, Progress report on flood magnitude and frequency of Vermont streams: U.S. Geological Survey Open-File Report 74-130, 37 p.
Lagasse, P.F., Schall, J.D., Johnson, F., Richardson, E.V., Chang, F., 1995, Stream Stability at Highway Structures: Federal Highway Administration Hydraulic Engineering Circular No. 20, Publication FHWA-IP-90-014, 144 p.
Laursen, E.M., 1960, Scour at bridge crossings: Journal of the Hydraulics Division, American Society of Civil Engineers, v. 86, no. HY2, p. 39-53.
Potter, W. D., 1957a, Peak rates of runoff in the Adirondack, White Mountains, and Maine woods area, Bureau of Public Roads
Potter, W. D., 1957b, Peak rates of runoff in the New England Hill and Lowland area, Bureau of Public Roads
Richardson, E.V. and Davis, S.R., 1995, Evaluating scour at bridges: Federal Highway Administration Hydraulic Engineering Circular No. 18, Publication FHWA-IP-90-017, 204 p.
Richardson, E.V., Simons, D.B., and Julien, P.Y., 1990, Highways in the river environment: Federal Highway Administration Publication FHWA-HI-90-016.
Ritter, D.F., 1984, Process Geomorphology: W.C. Brown Co., Debuque, Iowa, 603 p.
Shearman, J.O., 1990, User’s manual for WSPRO--a computer model for water surface profile computations: Federal Highway Administration Publication FHWA-IP-89-027, 187 p.
Shearman, J.O., Kirby, W.H., Schneider, V.R., and Flippo, H.N., 1986, Bridge waterways analysis model; research report: Federal Highway Administration Publication FHWA-RD-86-108, 112 p.
Talbot, A.N., 1887, The determination of water-way for bridges and culverts.
U.S. Department of Transportation, 1993, Stream stability and scour at highway bridges, Participant Workbook: Federal Highway Administration Publication FHWA HI-91-011.
U.S. Geological Survey, 1987, Readsboro, Vermont 7.5 Minute Series quadrangle map: U.S. Geological Survey Topographic Maps, Scale 1:24,000.
U.S. Geological Survey, 1954, Stamford, Vermont 7.5 Minute Series quadrangle map: U.S. Geological Survey Topographic Maps, Scale 1:24,000.

19
APPENDIX A:
WSPRO INPUT FILE

WSPRO INPUT FILE
T1 U.S. Geological Survey WSPRO Input File reds025.wsp T2 Hydraulic analysis for structure REDSTH00360025 Date: 07-MAR-97 T3 Bridge #25 over West Br. Deerfield River in Stamford, VT. RHF*J1 * * 0.002J3 6 29 30 552 553 551 5 16 17 13 3 * 15 14 23 21 11 12 4 7 3*Q 3020.0 4750.0 3580.0SK 0.0158 0.0158 0.0158*XS EXIT2 -502GR -422.0, 500.69 -364.8, 494.77 -248.7, 493.20 -166.2, 493.35GR -126.5, 493.16 -66.1, 491.95 -40.8, 485.43 -10.7, 484.98GR -5.7, 481.29 0.0, 479.21 3.9, 477.97 11.2, 476.72GR 22.4, 476.24 26.0, 477.46 32.0, 476.76 38.1, 479.56GR 47.0, 482.79 83.7, 481.63 137.3, 482.18 175.9, 489.85GR 467.8, 502.51*N 0.045 0.05 0.05SA -10.7 47.0*XS FLV2 -352 * * * 0.01*BR DSBRG -352 489.91 30.0 GR 0.0, 489.61 0.1, 489.41 0.2, 484.70 12.4, 480.23GR 16.0, 478.83 26.7, 478.37 33.8, 479.39 42.3, 480.51GR 53.6, 482.09 63.0, 487.73 63.7, 489.89 GR 63.9, 490.20 0.0, 489.61** BRTYPE BRWDTH EMBSS EMBELV CD 3 40 1.7 494.09N 0.055** SRD EMBWID IPAVEXR RDWY2 -332 35.0 1GR -422.0, 500.69 -137.8, 492.96 -0.9, 493.81 0.0, 494.64GR 73.9, 495.19 82.4, 495.22 84.4, 494.24 216.9, 495.57GR 467.8, 502.51*XT APTM2 -61 GR -302.5, 511.68 -190.8, 499.28 -46.8, 498.87 -11.7, 496.70GR -7.4, 495.61 0.0, 490.28 5.5, 488.31 7.9, 487.66GR 14.4, 487.18 19.0, 486.86 24.6, 487.85 32.0, 488.45GR 48.1, 489.72 99.7, 490.70 175.9, 489.85 221.8, 496.50GR 461.1, 504.19*AS APPR2 -257 * * * 0.0322GTN 0.045 0.05 0.05SA -7.4 48.1*XS EXIT3 -150 * * * 0.0322 GTN 0.045 0.05 0.05SA -7.4 48.1*XS EXIT1 -61 * * * 0.0
20
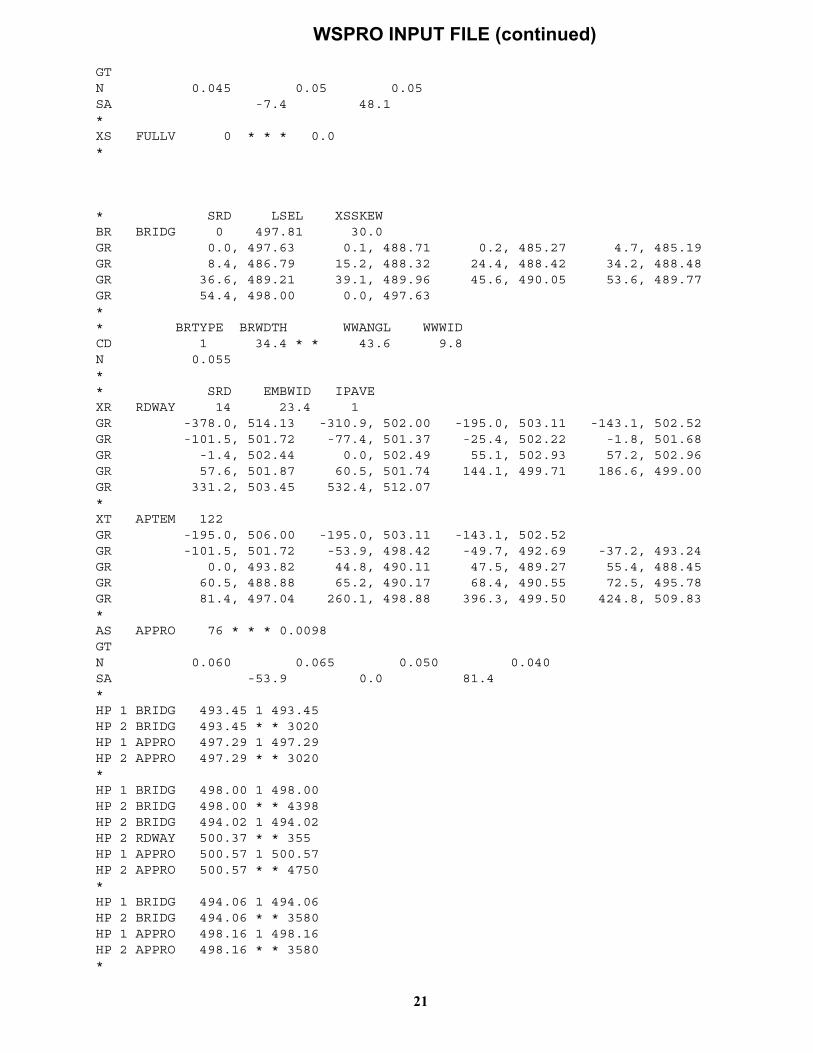
WSPRO INPUT FILE (continued)
GTN 0.045 0.05 0.05SA -7.4 48.1*XS FULLV 0 * * * 0.0*
* SRD LSEL XSSKEWBR BRIDG 0 497.81 30.0GR 0.0, 497.63 0.1, 488.71 0.2, 485.27 4.7, 485.19GR 8.4, 486.79 15.2, 488.32 24.4, 488.42 34.2, 488.48GR 36.6, 489.21 39.1, 489.96 45.6, 490.05 53.6, 489.77GR 54.4, 498.00 0.0, 497.63** BRTYPE BRWDTH WWANGL WWWIDCD 1 34.4 * * 43.6 9.8N 0.055** SRD EMBWID IPAVEXR RDWAY 14 23.4 1GR -378.0, 514.13 -310.9, 502.00 -195.0, 503.11 -143.1, 502.52GR -101.5, 501.72 -77.4, 501.37 -25.4, 502.22 -1.8, 501.68GR -1.4, 502.44 0.0, 502.49 55.1, 502.93 57.2, 502.96GR 57.6, 501.87 60.5, 501.74 144.1, 499.71 186.6, 499.00GR 331.2, 503.45 532.4, 512.07*XT APTEM 122 GR -195.0, 506.00 -195.0, 503.11 -143.1, 502.52GR -101.5, 501.72 -53.9, 498.42 -49.7, 492.69 -37.2, 493.24GR 0.0, 493.82 44.8, 490.11 47.5, 489.27 55.4, 488.45GR 60.5, 488.88 65.2, 490.17 68.4, 490.55 72.5, 495.78GR 81.4, 497.04 260.1, 498.88 396.3, 499.50 424.8, 509.83*AS APPRO 76 * * * 0.0098GTN 0.060 0.065 0.050 0.040SA -53.9 0.0 81.4*HP 1 BRIDG 493.45 1 493.45HP 2 BRIDG 493.45 * * 3020HP 1 APPRO 497.29 1 497.29HP 2 APPRO 497.29 * * 3020*HP 1 BRIDG 498.00 1 498.00HP 2 BRIDG 498.00 * * 4398HP 2 BRIDG 494.02 1 494.02HP 2 RDWAY 500.37 * * 355HP 1 APPRO 500.57 1 500.57HP 2 APPRO 500.57 * * 4750* HP 1 BRIDG 494.06 1 494.06HP 2 BRIDG 494.06 * * 3580HP 1 APPRO 498.16 1 498.16HP 2 APPRO 498.16 * * 3580 *
21

22
APPENDIX B:
WSPRO OUTPUT FILE

WSPRO OUTPUT FILE
U.S. Geological Survey WSPRO Input File reds025.wsp Hydraulic analysis for structure REDSTH00360025 Date: 07-MAR-97 Bridge #25 over West Br. Deerfield River in Stamford, VT. RHF *** RUN DATE & TIME: 06-24-97 14:22 CROSS-SECTION PROPERTIES: ISEQ = 9; SECID = BRIDG; SRD = 0.
WSEL SA# AREA K TOPW WETP ALPH LEW REW QCR 1 237 16195 47 59 3024 493.45 237 16195 47 59 1.00 0 54 3024
VELOCITY DISTRIBUTION: ISEQ = 9; SECID = BRIDG; SRD = 0.
WSEL LEW REW AREA K Q VEL 493.45 0.0 54.0 236.7 16195. 3020. 12.76
X STA. 0.0 2.9 4.6 6.1 7.6 9.3 A(I) 20.1 11.7 10.4 10.0 9.8 V(I) 7.52 12.95 14.48 15.08 15.47
X STA. 9.3 11.1 13.1 15.3 17.7 20.0 A(I) 9.7 10.0 10.2 10.4 10.3 V(I) 15.58 15.16 14.74 14.54 14.62
X STA. 20.0 22.4 24.8 27.2 29.8 32.3 A(I) 10.6 10.5 10.6 10.9 11.0 V(I) 14.31 14.38 14.27 13.84 13.71
X STA. 32.3 34.9 38.4 43.1 47.9 54.0 A(I) 11.2 12.6 14.1 14.2 18.4 V(I) 13.44 11.98 10.68 10.62 8.22
CROSS-SECTION PROPERTIES: ISEQ = 11; SECID = APPRO; SRD = 76.
WSEL SA# AREA K TOPW WETP ALPH LEW REW QCR 2 226 13105 53 56 2633 3 490 47068 81 85 6817 4 24 442 68 68 80 497.29 739 60615 203 209 1.18 -52 149 7386
VELOCITY DISTRIBUTION: ISEQ = 11; SECID = APPRO; SRD = 76.
WSEL LEW REW AREA K Q VEL 497.29 -53.4 149.5 739.3 60615. 3020. 4.08
X STA. -53.4 -39.9 -28.8 -17.0 -4.4 6.4 A(I) 56.7 49.8 50.2 51.7 44.3 V(I) 2.66 3.03 3.01 2.92 3.41
X STA. 6.4 14.1 20.5 25.9 30.8 35.2 A(I) 36.4 34.4 31.5 30.9 28.9 V(I) 4.15 4.39 4.80 4.88 5.22
X STA. 35.2 39.2 43.0 46.6 49.6 52.6 A(I) 28.3 27.8 27.6 25.9 26.6 V(I) 5.33 5.42 5.48 5.82 5.68
X STA. 52.6 55.5 58.5 61.8 66.2 149.5 A(I) 26.2 27.5 29.5 34.5 70.7 V(I) 5.77 5.48 5.12 4.37 2.14
23

WSPRO OUTPUT FILE (continued)
U.S. Geological Survey WSPRO Input File reds025.wsp Hydraulic analysis for structure REDSTH00360025 Date: 07-MAR-97 Bridge #25 over West Br. Deerfield River in Stamford, VT. RHF *** RUN DATE & TIME: 06-24-97 14:22 CROSS-SECTION PROPERTIES: ISEQ = 9; SECID = BRIDG; SRD = 0.
WSEL SA# AREA K TOPW WETP ALPH LEW REW QCR 1 441 29341 0 115 0 498.00 441 29341 0 115 1.00 0 54 0
VELOCITY DISTRIBUTION: ISEQ = 9; SECID = BRIDG; SRD = 0.
WSEL LEW REW AREA K Q VEL 498.00 0.0 54.4 441.3 29341. 4398. 9.96
X STA. 0.0 3.4 5.4 7.4 9.4 11.6 A(I) 35.7 22.0 20.1 19.1 19.4 V(I) 6.16 10.01 10.94 11.53 11.33
X STA. 11.6 13.9 16.3 18.7 21.1 23.5 A(I) 19.7 19.9 19.4 19.8 19.8 V(I) 11.16 11.08 11.36 11.10 11.12
X STA. 23.5 26.0 28.4 30.9 33.3 35.9 A(I) 19.8 19.8 20.0 19.9 20.4 V(I) 11.11 11.11 10.97 11.06 10.78
X STA. 35.9 38.9 42.2 45.6 49.1 54.4 A(I) 21.9 23.1 23.0 24.1 34.6 V(I) 10.04 9.53 9.56 9.12 6.36
VELOCITY DISTRIBUTION: ISEQ = 10; SECID = RDWAY; SRD = 14.
WSEL LEW REW AREA K Q VEL 500.37 116.9 231.1 82.6 1983. 355. 4.30
X STA. 116.9 142.1 149.7 155.5 160.2 164.3 A(I) 7.7 5.2 4.6 4.2 3.9 V(I) 2.30 3.39 3.87 4.23 4.50
X STA. 164.3 167.9 171.2 174.1 176.9 179.6 A(I) 3.7 3.6 3.4 3.3 3.3 V(I) 4.81 4.96 5.27 5.31 5.44
X STA. 179.6 182.1 184.5 186.9 189.3 192.0 A(I) 3.2 3.2 3.2 3.2 3.4 V(I) 5.54 5.54 5.62 5.52 5.25
X STA. 192.0 195.1 198.7 203.1 209.4 231.1 A(I) 3.6 3.8 4.1 4.8 7.3 V(I) 4.97 4.71 4.33 3.69 2.44
CROSS-SECTION PROPERTIES: ISEQ = 11; SECID = APPRO; SRD = 76.
WSEL SA# AREA K TOPW WETP ALPH LEW REW QCR 1 49 1441 38 38 316 2 402 34005 54 57 6237 3 757 97201 81 85 13094 4 800 54908 319 319 7181 500.57 2007 187554 492 498 1.29 -90 400 20286
24

WSPRO OUTPUT FILE (continued)
VELOCITY DISTRIBUTION: ISEQ = 11; SECID = APPRO; SRD = 76.
WSEL LEW REW AREA K Q VEL 500.57 -91.4 400.5 2007.4 187554. 4750. 2.37
X STA. -91.4 -39.5 -25.8 -11.6 2.5 12.9 A(I) 154.1 106.0 106.4 102.5 81.5 V(I) 1.54 2.24 2.23 2.32 2.91
X STA. 12.9 21.5 29.2 36.1 42.6 48.4 A(I) 74.2 72.4 68.1 68.1 64.4 V(I) 3.20 3.28 3.49 3.49 3.69
X STA. 48.4 53.6 58.6 64.3 76.3 106.0 A(I) 62.7 62.5 67.6 95.1 117.0 V(I) 3.79 3.80 3.51 2.50 2.03
X STA. 106.0 138.3 176.3 226.3 296.0 400.5 A(I) 115.1 121.5 137.4 152.0 178.7 V(I) 2.06 1.96 1.73 1.56 1.33
U.S. Geological Survey WSPRO Input File reds025.wsp Hydraulic analysis for structure REDSTH00360025 Date: 07-MAR-97 Bridge #25 over West Br. Deerfield River in Stamford, VT. RHF *** RUN DATE & TIME: 06-24-97 14:22 CROSS-SECTION PROPERTIES: ISEQ = 9; SECID = BRIDG; SRD = 0.
WSEL SA# AREA K TOPW WETP ALPH LEW REW QCR 1 265 19307 47 60 3584 494.06 265 19307 47 60 1.00 0 54 3584
VELOCITY DISTRIBUTION: ISEQ = 9; SECID = BRIDG; SRD = 0.
WSEL LEW REW AREA K Q VEL 494.06 0.0 54.0 265.2 19307. 3580. 13.50
X STA. 0.0 3.1 4.9 6.5 8.2 10.0 A(I) 23.2 13.3 11.7 11.3 11.1 V(I) 7.71 13.43 15.30 15.77 16.17
X STA. 10.0 11.9 14.0 16.3 18.6 20.9 A(I) 11.2 11.5 11.4 11.5 11.5 V(I) 16.00 15.62 15.67 15.55 15.62
X STA. 20.9 23.3 25.7 28.1 30.6 33.1 A(I) 11.7 11.6 11.7 12.1 12.2 V(I) 15.35 15.42 15.28 14.82 14.67
X STA. 33.1 35.8 39.4 43.6 48.1 54.0 A(I) 12.6 14.2 15.0 15.6 20.8 V(I) 14.26 12.59 11.95 11.49 8.59
CROSS-SECTION PROPERTIES: ISEQ = 11; SECID = APPRO; SRD = 76.
WSEL SA# AREA K TOPW WETP ALPH LEW REW QCR 1 0 1 3 3 0 2 272 17755 54 57 3475 3 561 58949 81 85 8348 4 120 3799 153 153 603 498.16 953 80505 291 297 1.27 -56 234 8681
VELOCITY DISTRIBUTION: ISEQ = 11; SECID = APPRO; SRD = 76.
WSEL LEW REW AREA K Q VEL 498.16 -56.7 234.0 953.1 80505. 3580. 3.76
X STA. -56.7 -39.7 -28.8 -17.3 -5.3 5.6 A(I) 70.0 58.0 59.6 59.5 53.5 V(I) 2.56 3.08 3.00 3.01 3.35
25

WSPRO OUTPUT FILE (continued)
X STA. 5.6 13.3 19.9 25.7 30.9 35.6 A(I) 43.1 40.8 38.4 37.0 35.6 V(I) 4.15 4.39 4.66 4.84 5.02
X STA. 35.6 40.0 44.1 47.8 51.2 54.5 A(I) 34.7 34.0 33.0 32.6 32.1 V(I) 5.16 5.26 5.43 5.48 5.58
X STA. 54.5 57.7 61.2 65.6 79.0 234.0 A(I) 33.1 34.4 38.7 60.9 124.0 V(I) 5.40 5.20 4.62 2.94 1.44
U.S. Geological Survey WSPRO Input File reds025.wsp Hydraulic analysis for structure REDSTH00360025 Date: 07-MAR-97 Bridge #25 over West Br. Deerfield River in Stamford, VT. RHF *** RUN DATE & TIME: 06-24-97 14:22
===015 WSI IN WRONG FLOW REGIME AT SECID “EXIT2”: USED WSI = CRWS. WSI,CRWS = 483.11 483.31
XSID:CODE SRDL LEW AREA VHD HF EGL CRWS Q WSEL SRD FLEN REW K ALPH HO ERR FR# VEL
EXIT2:XS ****** -7 389 1.22 ***** 484.53 483.31 3020 483.31 -501 ****** 143 26405 1.29 ***** ******* 0.97 7.77
FLV2 :FV 150 -8 458 0.86 1.59 486.12 ******* 3020 485.26 -351 150 145 32501 1.26 0.00 0.00 0.76 6.59 <<<<<THE ABOVE RESULTS REFLECT “NORMAL” (UNCONSTRICTED) FLOW>>>>>
APPR2:AS 95 -2 555 0.51 0.78 486.89 ******* 3020 486.38 -256 95 195 34065 1.11 0.00 -0.01 0.61 5.44 <<<<<THE ABOVE RESULTS REFLECT “NORMAL” (UNCONSTRICTED) FLOW>>>>>
===220 FLOW CLASS 1 (4) SOLUTION INDICATES POSSIBLE PRESSURE FLOW. WS3,WSIU,WS1,LSEL = 485.46 490.03 490.30 489.91 ===245 ATTEMPTING FLOW CLASS 2 (5) SOLUTION. ===250 INSUFFICIENT HEAD FOR PRESSURE FLOW. YU/Z,WSIU,WS = 1.10 490.65 490.77 ===270 REJECTED FLOW CLASS 2 (5) SOLUTION. ===285 CRITICAL WATER-SURFACE ELEVATION A _ S _ S _ U _ M _ E _ D !!!!! SECID “DSBRG” Q,CRWS = 3020. 485.46
<<<<<RESULTS REFLECTING THE CONSTRICTED FLOW FOLLOW>>>>>
XSID:CODE SRDL LEW AREA VHD HF EGL CRWS Q WSEL SRD FLEN REW K ALPH HO ERR FR# VEL
DSBRG:BR 150 0 244 3.32 ***** 488.78 485.46 3020 485.46 -351 150 59 17933 1.39 ***** ******* 1.18 12.39
26

WSPRO OUTPUT FILE (continued)
TYPE PPCD FLOW C P/A LSEL BLEN XLAB XRAB 3. **** 1. 0.848 ****** 489.91 ****** ****** ******
XSID:CODE SRD FLEN HF VHD EGL ERR Q WSEL RDWY2:RG -332. <<<<<EMBANKMENT IS NOT OVERTOPPED>>>>>
XSID:CODE SRDL LEW AREA VHD HF EGL CRWS Q WSEL SRD FLEN REW K ALPH HO ERR FR# VEL
APPR2:AS 55 -10 1398 0.07 0.26 490.36 485.67 3020 490.29 -256 72 225 137867 1.03 1.32 -0.01 0.16 2.16
M(G) M(K) KQ XLKQ XRKQ OTEL 0.705 0.667 45968. 24. 83. 490.26
<<<<<END OF BRIDGE COMPUTATIONS>>>>>
===135 CONVEYANCE RATIO OUTSIDE OF RECOMMENDED LIMITS. “EXIT3” KRATIO = 0.31
XSID:CODE SRDL LEW AREA VHD HF EGL CRWS Q WSEL SRD FLEN REW K ALPH HO ERR FR# VEL
EXIT3:XS 107 -3 651 0.36 0.16 490.66 ******* 3020 490.30 -149 107 199 43330 1.09 0.14 -0.01 0.48 4.64
===110 WSEL NOT FOUND AT SECID “EXIT1”: REDUCED DELTAY. WSLIM1,WSLIM2,DELTAY = 489.80 511.68 0.50 ===115 WSEL NOT FOUND AT SECID “EXIT1”: USED WSMIN = CRWS. WSLIM1,WSLIM2,CRWS = 489.80 511.68 491.98 ===130 CRITICAL WATER-SURFACE ELEVATION A _ S _ S _ U _ M _ E _ D !!!!! ENERGY EQUATION N_O_T B_A_L_A_N_C_E_D AT SECID “EXIT1” WSBEG,WSEND,CRWS = 491.98 511.68 491.98
EXIT1:XS 89 -1 417 0.97 ***** 492.95 491.98 3020 491.98 -60 89 191 22249 1.19 ***** ******* 0.95 7.24
===135 CONVEYANCE RATIO OUTSIDE OF RECOMMENDED LIMITS. “FULLV” KRATIO = 1.94
FULLV:FV 61 -3 650 0.36 0.58 493.52 ******* 3020 493.16 0 61 199 43198 1.09 0.00 -0.01 0.48 4.65 <<<<<THE ABOVE RESULTS REFLECT “NORMAL” (UNCONSTRICTED) FLOW>>>>>
===110 WSEL NOT FOUND AT SECID “APPRO”: REDUCED DELTAY. WSLIM1,WSLIM2,DELTAY = 492.66 509.38 0.50 ===115 WSEL NOT FOUND AT SECID “APPRO”: USED WSMIN = CRWS. WSLIM1,WSLIM2,CRWS = 492.66 509.38 494.45 ===130 CRITICAL WATER-SURFACE ELEVATION A _ S _ S _ U _ M _ E _ D !!!!! ENERGY EQUATION N_O_T B_A_L_A_N_C_E_D AT SECID “APPRO” WSBEG,WSEND,CRWS = 494.45 509.38 494.45
U.S. Geological Survey WSPRO Input File reds025.wsp Hydraulic analysis for structure REDSTH00360025 Date: 07-MAR-97 Bridge #25 over West Br. Deerfield River in Stamford, VT. RHF *** RUN DATE & TIME: 06-24-97 14:22
XSID:CODE SRDL LEW AREA VHD HF EGL CRWS Q WSEL SRD FLEN REW K ALPH HO ERR FR# VEL
APPRO:AS 76 -50 349 1.40 ***** 495.85 494.45 3020 494.45 76 76 72 21499 1.20 ***** ******* 0.99 8.66 <<<<<THE ABOVE RESULTS REFLECT “NORMAL” (UNCONSTRICTED) FLOW>>>>>
===285 CRITICAL WATER-SURFACE ELEVATION A _ S _ S _ U _ M _ E _ D !!!!! SECID “BRIDG” Q,CRWS = 3020. 493.45
<<<<<RESULTS REFLECTING THE CONSTRICTED FLOW FOLLOW>>>>>
XSID:CODE SRDL LEW AREA VHD HF EGL CRWS Q WSEL SRD FLEN REW K ALPH HO ERR FR# VEL
27

WSPRO OUTPUT FILE (continued)
BRIDG:BR 61 0 236 2.54 ***** 495.98 493.45 3020 493.45 0 61 54 16171 1.00 ***** ******* 1.00 12.77
TYPE PPCD FLOW C P/A LSEL BLEN XLAB XRAB 1. **** 1. 1.000 ****** 497.81 ****** ****** ******
XSID:CODE SRD FLEN HF VHD EGL ERR Q WSEL RDWAY:RG 14. <<<<<EMBANKMENT IS NOT OVERTOPPED>>>>>
XSID:CODE SRDL LEW AREA VHD HF EGL CRWS Q WSEL SRD FLEN REW K ALPH HO ERR FR# VEL
APPRO:AS 42 -52 739 0.31 0.41 497.59 494.45 3020 497.29 76 44 149 60571 1.18 1.20 0.00 0.41 4.09
M(G) M(K) KQ XLKQ XRKQ OTEL 0.562 0.418 35241. 27. 81. 497.16
<<<<<END OF BRIDGE COMPUTATIONS>>>>> FIRST USER DEFINED TABLE.
XSID:CODE SRD LEW REW Q K AREA VEL WSEL EXIT2:XS -502. -8. 143. 3020. 26405. 389. 7.77 483.31 FLV2 :FV -352. -9. 145. 3020. 32501. 458. 6.59 485.26 DSBRG:BR -352. 0. 59. 3020. 17933. 244. 12.39 485.46 RDWY2:RG -332.************** 0.********* 0. 1.00******** APPR2:AS -257. -11. 225. 3020. 137867. 1398. 2.16 490.29
XSID:CODE XLKQ XRKQ KQ APPR2:AS 24. 83. 45968. XSID:CODE SRD LEW REW Q K AREA VEL WSEL EXIT3:XS -150. -4. 199. 3020. 43330. 651. 4.64 490.30 EXIT1:XS -61. -2. 191. 3020. 22249. 417. 7.24 491.98 FULLV:FV 0. -4. 199. 3020. 43198. 650. 4.65 493.16 BRIDG:BR 0. 0. 54. 3020. 16171. 236. 12.77 493.45 RDWAY:RG 14.************** 0.****************** 1.00******** APPRO:AS 76. -53. 149. 3020. 60571. 739. 4.09 497.29
XSID:CODE XLKQ XRKQ KQ APPRO:AS 27. 81. 35241.
SECOND USER DEFINED TABLE.
XSID:CODE CRWS FR# YMIN YMAX HF HO VHD EGL WSEL EXIT2:XS 483.31 0.97 476.24 502.51************ 1.22 484.53 483.31 FLV2 :FV ******** 0.76 477.74 504.01 1.59 0.00 0.86 486.12 485.26 DSBRG:BR 485.46 1.18 478.37 490.20************ 3.32 488.78 485.46 RDWY2:RG **************** 492.96 502.51************ 0.02 493.79******** APPR2:AS 485.67 0.16 480.55 505.37 0.26 1.32 0.07 490.36 490.29 EXIT3:XS ******** 0.48 483.99 508.81 0.16 0.14 0.36 490.66 490.30 EXIT1:XS 491.98 0.95 486.86 511.68************ 0.97 492.95 491.98 FULLV:FV ******** 0.48 486.86 511.68 0.58 0.00 0.36 493.52 493.16 BRIDG:BR 493.45 1.00 485.19 498.00************ 2.54 495.98 493.45 RDWAY:RG **************** 499.00 514.13********************************** APPRO:AS 494.45 0.41 488.00 509.38 0.41 1.20 0.31 497.59 497.29 U.S. Geological Survey WSPRO Input File reds025.wsp Hydraulic analysis for structure REDSTH00360025 Date: 07-MAR-97 Bridge #25 over West Br. Deerfield River in Stamford, VT. RHF
===015 WSI IN WRONG FLOW REGIME AT SECID “EXIT2”: USED WSI = CRWS. WSI,CRWS = 484.12 484.23
XSID:CODE SRDL LEW AREA VHD HF EGL CRWS Q WSEL SRD FLEN REW K ALPH HO ERR FR# VEL
EXIT2:XS ****** -9 531 1.53 ***** 485.76 484.23 4750 484.23 -501 ****** 148 39564 1.23 ***** ******* 0.95 8.95
FLV2 :FV 150 -10 641 1.01 1.67 487.43 ******* 4750 486.42 -351 150 151 51269 1.18 0.00 0.00 0.71 7.42 <<<<<THE ABOVE RESULTS REFLECT “NORMAL” (UNCONSTRICTED) FLOW>>>>>
28
WSPRO OUTPUT FILE (continued)
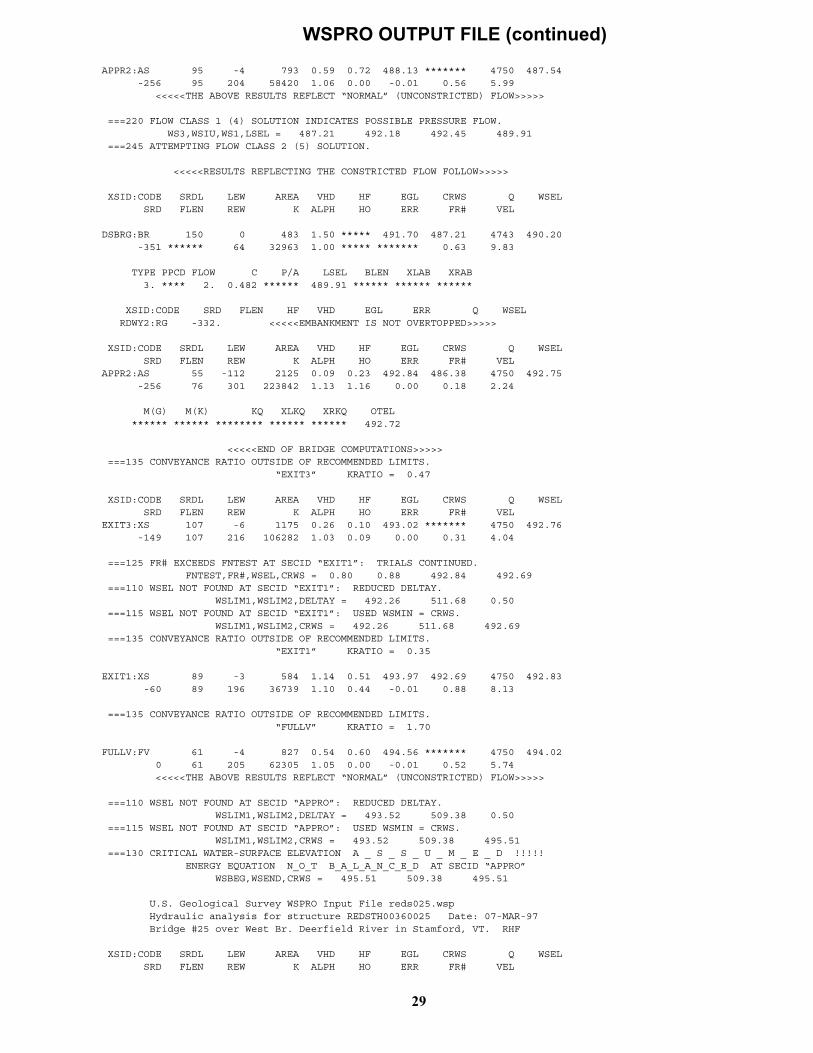
APPR2:AS 95 -4 793 0.59 0.72 488.13 ******* 4750 487.54 -256 95 204 58420 1.06 0.00 -0.01 0.56 5.99 <<<<<THE ABOVE RESULTS REFLECT “NORMAL” (UNCONSTRICTED) FLOW>>>>>
===220 FLOW CLASS 1 (4) SOLUTION INDICATES POSSIBLE PRESSURE FLOW. WS3,WSIU,WS1,LSEL = 487.21 492.18 492.45 489.91 ===245 ATTEMPTING FLOW CLASS 2 (5) SOLUTION.
<<<<<RESULTS REFLECTING THE CONSTRICTED FLOW FOLLOW>>>>>
XSID:CODE SRDL LEW AREA VHD HF EGL CRWS Q WSEL SRD FLEN REW K ALPH HO ERR FR# VEL
DSBRG:BR 150 0 483 1.50 ***** 491.70 487.21 4743 490.20 -351 ****** 64 32963 1.00 ***** ******* 0.63 9.83
TYPE PPCD FLOW C P/A LSEL BLEN XLAB XRAB 3. **** 2. 0.482 ****** 489.91 ****** ****** ******
XSID:CODE SRD FLEN HF VHD EGL ERR Q WSEL RDWY2:RG -332. <<<<<EMBANKMENT IS NOT OVERTOPPED>>>>>
XSID:CODE SRDL LEW AREA VHD HF EGL CRWS Q WSEL SRD FLEN REW K ALPH HO ERR FR# VEL APPR2:AS 55 -112 2125 0.09 0.23 492.84 486.38 4750 492.75 -256 76 301 223842 1.13 1.16 0.00 0.18 2.24
M(G) M(K) KQ XLKQ XRKQ OTEL ****** ****** ******** ****** ****** 492.72
<<<<<END OF BRIDGE COMPUTATIONS>>>>> ===135 CONVEYANCE RATIO OUTSIDE OF RECOMMENDED LIMITS. “EXIT3” KRATIO = 0.47
XSID:CODE SRDL LEW AREA VHD HF EGL CRWS Q WSEL SRD FLEN REW K ALPH HO ERR FR# VEL EXIT3:XS 107 -6 1175 0.26 0.10 493.02 ******* 4750 492.76 -149 107 216 106282 1.03 0.09 0.00 0.31 4.04
===125 FR# EXCEEDS FNTEST AT SECID “EXIT1”: TRIALS CONTINUED. FNTEST,FR#,WSEL,CRWS = 0.80 0.88 492.84 492.69 ===110 WSEL NOT FOUND AT SECID “EXIT1”: REDUCED DELTAY. WSLIM1,WSLIM2,DELTAY = 492.26 511.68 0.50 ===115 WSEL NOT FOUND AT SECID “EXIT1”: USED WSMIN = CRWS. WSLIM1,WSLIM2,CRWS = 492.26 511.68 492.69 ===135 CONVEYANCE RATIO OUTSIDE OF RECOMMENDED LIMITS. “EXIT1” KRATIO = 0.35
EXIT1:XS 89 -3 584 1.14 0.51 493.97 492.69 4750 492.83 -60 89 196 36739 1.10 0.44 -0.01 0.88 8.13
===135 CONVEYANCE RATIO OUTSIDE OF RECOMMENDED LIMITS. “FULLV” KRATIO = 1.70
FULLV:FV 61 -4 827 0.54 0.60 494.56 ******* 4750 494.02 0 61 205 62305 1.05 0.00 -0.01 0.52 5.74 <<<<<THE ABOVE RESULTS REFLECT “NORMAL” (UNCONSTRICTED) FLOW>>>>>
===110 WSEL NOT FOUND AT SECID “APPRO”: REDUCED DELTAY. WSLIM1,WSLIM2,DELTAY = 493.52 509.38 0.50 ===115 WSEL NOT FOUND AT SECID “APPRO”: USED WSMIN = CRWS. WSLIM1,WSLIM2,CRWS = 493.52 509.38 495.51 ===130 CRITICAL WATER-SURFACE ELEVATION A _ S _ S _ U _ M _ E _ D !!!!! ENERGY EQUATION N_O_T B_A_L_A_N_C_E_D AT SECID “APPRO” WSBEG,WSEND,CRWS = 495.51 509.38 495.51
U.S. Geological Survey WSPRO Input File reds025.wsp Hydraulic analysis for structure REDSTH00360025 Date: 07-MAR-97 Bridge #25 over West Br. Deerfield River in Stamford, VT. RHF
XSID:CODE SRDL LEW AREA VHD HF EGL CRWS Q WSEL SRD FLEN REW K ALPH HO ERR FR# VEL
29

WSPRO OUTPUT FILE (continued)
APPRO:AS 76 -51 480 1.79 ***** 497.29 495.51 4750 495.51 76 76 74 33975 1.18 ***** ******* 0.97 9.89 <<<<<THE ABOVE RESULTS REFLECT “NORMAL” (UNCONSTRICTED) FLOW>>>>>
===215 FLOW CLASS 1 SOLUTION INDICATES POSSIBLE ROAD OVERFLOW. WS1,WSSD,WS3,RGMIN = 499.92 0.00 495.24 499.00 ===260 ATTEMPTING FLOW CLASS 4 SOLUTION. ===220 FLOW CLASS 1 (4) SOLUTION INDICATES POSSIBLE PRESSURE FLOW. WS3,WSIU,WS1,LSEL = 495.17 499.52 499.79 497.81 ===245 ATTEMPTING FLOW CLASS 2 (5) SOLUTION.
<<<<<RESULTS REFLECTING THE CONSTRICTED FLOW FOLLOW>>>>> XSID:CODE SRDL LEW AREA VHD HF EGL CRWS Q WSEL SRD FLEN REW K ALPH HO ERR FR# VEL
BRIDG:BR 61 0 441 1.54 ***** 499.54 494.90 4398 498.00 0 ****** 54 29341 1.00 ***** ******* 0.62 9.96
TYPE PPCD FLOW C P/A LSEL BLEN XLAB XRAB 1. **** 5. 0.478 ****** 497.81 ****** ****** ******
XSID:CODE SRD FLEN HF VHD EGL ERR Q WSEL RDWAY:RG 14. 53. 0.03 0.11 500.65 0.00 355. 500.37
Q WLEN LEW REW DMAX DAVG VMAX VAVG HAVG CAVG LT: 0. 286. -316. 21. 1.5 0.7 5.6 8.0 1.4 3.1 RT: 355. 114. 117. 231. 1.4 0.7 4.7 4.3 1.0 3.1
XSID:CODE SRDL LEW AREA VHD HF EGL CRWS Q WSEL SRD FLEN REW K ALPH HO ERR FR# VEL APPRO:AS 42 -90 2006 0.11 0.17 500.68 495.51 4750 500.57 76 44 400 187350 1.29 1.16 0.00 0.23 2.37
M(G) M(K) KQ XLKQ XRKQ OTEL ****** ****** ******** ****** ****** ********
<<<<<END OF BRIDGE COMPUTATIONS>>>>> FIRST USER DEFINED TABLE. XSID:CODE SRD LEW REW Q K AREA VEL WSEL EXIT2:XS -502. -10. 148. 4750. 39564. 531. 8.95 484.23 FLV2 :FV -352. -11. 151. 4750. 51269. 641. 7.42 486.42 DSBRG:BR -352. 0. 64. 4743. 32963. 483. 9.83 490.20 RDWY2:RG -332.************** 0.********* 0. 1.00******** APPR2:AS -257. -113. 301. 4750. 223842. 2125. 2.24 492.75
XSID:CODE XLKQ XRKQ KQ APPR2:AS *********************** XSID:CODE SRD LEW REW Q K AREA VEL WSEL EXIT3:XS -150. -7. 216. 4750. 106282. 1175. 4.04 492.76 EXIT1:XS -61. -4. 196. 4750. 36739. 584. 8.13 492.83 FULLV:FV 0. -5. 205. 4750. 62305. 827. 5.74 494.02 BRIDG:BR 0. 0. 54. 4398. 29341. 441. 9.96 498.00 RDWAY:RG 14.******* 0. 355. 0.********* 1.00 500.37 APPRO:AS 76. -91. 400. 4750. 187350. 2006. 2.37 500.57
XSID:CODE XLKQ XRKQ KQ APPRO:AS ***********************
SECOND USER DEFINED TABLE.
XSID:CODE CRWS FR# YMIN YMAX HF HO VHD EGL WSEL EXIT2:XS 484.23 0.95 476.24 502.51************ 1.53 485.76 484.23 FLV2 :FV ******** 0.71 477.74 504.01 1.67 0.00 1.01 487.43 486.42 DSBRG:BR 487.21 0.63 478.37 490.20************ 1.50 491.70 490.20 RDWY2:RG **************** 492.96 502.51************ 0.06 493.82******** APPR2:AS 486.38 0.18 480.55 505.37 0.23 1.16 0.09 492.84 492.75 EXIT3:XS ******** 0.31 483.99 508.81 0.10 0.09 0.26 493.02 492.76 EXIT1:XS 492.69 0.88 486.86 511.68 0.51 0.44 1.14 493.97 492.83 FULLV:FV ******** 0.52 486.86 511.68 0.60 0.00 0.54 494.56 494.02 BRIDG:BR 494.90 0.62 485.19 498.00************ 1.54 499.54 498.00 RDWAY:RG **************** 499.00 514.13 0.03****** 0.11 500.65 500.37
30

WSPRO OUTPUT FILE (continued)
APPRO:AS 495.51 0.23 488.00 509.38 0.17 1.16 0.11 500.68 500.57
U.S. Geological Survey WSPRO Input File reds025.wsp Hydraulic analysis for structure REDSTH00360025 Date: 07-MAR-97 Bridge #25 over West Br. Deerfield River in Stamford, VT. RHF *** RUN DATE & TIME: 06-24-97 14:22
===015 WSI IN WRONG FLOW REGIME AT SECID “EXIT2”: USED WSI = CRWS. WSI,CRWS = 483.47 483.64
XSID:CODE SRDL LEW AREA VHD HF EGL CRWS Q WSEL SRD FLEN REW K ALPH HO ERR FR# VEL
EXIT2:XS ****** -8 438 1.32 ***** 484.96 483.64 3580 483.64 -501 ****** 145 30687 1.27 ***** ******* 0.96 8.17
FLV2 :FV 150 -9 522 0.90 1.62 486.58 ******* 3580 485.68 -351 150 147 38675 1.23 0.00 0.00 0.74 6.86 <<<<<THE ABOVE RESULTS REFLECT “NORMAL” (UNCONSTRICTED) FLOW>>>>>
APPR2:AS 95 -3 636 0.54 0.75 487.32 ******* 3580 486.78 -256 95 198 41825 1.09 0.00 -0.01 0.58 5.63 <<<<<THE ABOVE RESULTS REFLECT “NORMAL” (UNCONSTRICTED) FLOW>>>>>
===220 FLOW CLASS 1 (4) SOLUTION INDICATES POSSIBLE PRESSURE FLOW. WS3,WSIU,WS1,LSEL = 486.07 490.61 490.89 489.91 ===245 ATTEMPTING FLOW CLASS 2 (5) SOLUTION.
<<<<<RESULTS REFLECTING THE CONSTRICTED FLOW FOLLOW>>>>>
XSID:CODE SRDL LEW AREA VHD HF EGL CRWS Q WSEL SRD FLEN REW K ALPH HO ERR FR# VEL
DSBRG:BR 150 0 483 0.85 ***** 491.05 486.06 3575 490.20 -351 ****** 64 32963 1.00 ***** ******* 0.48 7.41
TYPE PPCD FLOW C P/A LSEL BLEN XLAB XRAB 3. **** 2. 0.416 ****** 489.91 ****** ****** ******
XSID:CODE SRD FLEN HF VHD EGL ERR Q WSEL RDWY2:RG -332. <<<<<EMBANKMENT IS NOT OVERTOPPED>>>>>
XSID:CODE SRDL LEW AREA VHD HF EGL CRWS Q WSEL SRD FLEN REW K ALPH HO ERR FR# VEL
APPR2:AS 55 -23 1619 0.08 0.17 491.24 485.92 3580 491.16 -256 73 252 163813 1.06 1.26 0.00 0.17 2.21
M(G) M(K) KQ XLKQ XRKQ OTEL ****** ****** ******** ****** ****** 491.13
<<<<<END OF BRIDGE COMPUTATIONS>>>>>
===135 CONVEYANCE RATIO OUTSIDE OF RECOMMENDED LIMITS. “EXIT3” KRATIO = 0.38
XSID:CODE SRDL LEW AREA VHD HF EGL CRWS Q WSEL SRD FLEN REW K ALPH HO ERR FR# VEL
EXIT3:XS 107 -4 831 0.30 0.13 491.48 ******* 3580 491.17 -149 107 205 62827 1.05 0.11 0.00 0.39 4.31
===110 WSEL NOT FOUND AT SECID “EXIT1”: REDUCED DELTAY. WSLIM1,WSLIM2,DELTAY = 490.67 511.68 0.50 ===115 WSEL NOT FOUND AT SECID “EXIT1”: USED WSMIN = CRWS. WSLIM1,WSLIM2,CRWS = 490.67 511.68 492.23 ===130 CRITICAL WATER-SURFACE ELEVATION A _ S _ S _ U _ M _ E _ D !!!!! ENERGY EQUATION N_O_T B_A_L_A_N_C_E_D AT SECID “EXIT1” WSBEG,WSEND,CRWS = 492.23 511.68 492.23
31

32
APPENDIX C:
BED-MATERIAL PARTICLE-SIZE DISTRIBUTION

33
Appendix C. Bed material particle-size distribution for a pebble count in the channel approach of
structure REDSTH00360025, in Readsboro, Vermont.
CU
MU
LAT
IVE
PE
RC
EN
T F
INE
R
SIZE (MM)
0
100
10
20
30
40
50
60
70
80
90
5 1,0007 10 20 30 40 50 70 100 200 300 400 500 700

34
APPENDIX D:
HISTORICAL DATA FORM

FHWA Structure Number (I - 8)
Topographic Map
United States Geological SurveyBridge Historical Data Collection and Processing Form
Gener
Data collected by (First Initial, Full last name
Date (MM/DD/YY) _
Highway District Number (I - 2; nn)
Town (FIPS place code; I - 4; nnnnn)
Waterway (I - 6)
Route Number
Latitude (I - 16; nnnn.n
Select
Maintenance responsibility (I - 21; nn) _
Year built (I - 27; YYYY)
Average daily traffic, ADT (I - 29; nnnnnn
Year of ADT (I - 30; YY) _
Opening skew to Roadway (I - 34; nn) _
Operational status (I - 41; X) _
Structure type (I - 43; nnn)
Approach span structure type (I - 44; nnn
Number of spans (I - 45; nnn)
Number of approach spans (I - 46; nnnn)
U.S
.DE
PA
RTM N OF H
I
G LC SUV
YET T E
NTERORI
E
OA RI
OL
GE Structure Number
______________REDSTH00360025al Location Descriptive
)
F
)
__. _L M
ed
________________edalie
___ /09
____ /28 ____95County (FIPS county code; I - 3; nnn) _
____01Vicinity (I - 9)
Road Name (I - 7):
Hydrologic Unit Code:
Longitude (i - 17; nnnnn.n)
eral Inventory Codes
Mile marker (I - 11; nnn.nnn)
_
Maximum span length (I - 48; nnnn
Structure length (I - 49; nnnnnn
Deck Width (I - 52; nn.n)
Channel & Protection (I - 61; n)
Waterway adequacy (I - 71; n)
Underwater Inspection Frequency (I - 92B;
Year Reconstructed (I - 106)
Clear span (nnn.n ft) _
Vertical clearance from streambed (nnn.n f
Waterway of full opening (nnn.n ft2)
35
______003
______58600
_______000000_____________________________West Branch Deerfield River
_____________________-_______C3036
________________________0.11 mi. to jct. with VT100_________________________Stamford
_________02020003) _______42496
_______73002________________10020900250209
_____03
______1929
) _______000020
____93
_____30
XYY)
_____A______104
______000
t)
_____001______0000
) _____0057
) ______000059
______234
____5
____7
______N
_______0000
_____-
_____-
______-
Comments:According to the structural inspection report dated 9/27/93, the structure is a concrete T-beam bridgewith an asphalt road surface. Abutments, wingwalls and backwalls are concrete. The left abutment concrete has several fine vertical cracks with alligator cracks and leaks on the ends of both abutments andwingwalls. The ends of both wingwalls on the left abutment have areas of deep spalling. The channel flowis along the upstream end and wingwall of the right abutment, and is diverted against the face of the leftabutment. The channel is at least 2.5-3’ deep along the upstream right abutment and 1.5-2.5’ deep alongthe left abutment. A few boulders are present in front of the downstream right (Continued, p. 37)

ge Hydrologic DataIs there hydrologic 2
Terrain character:
Stream character & type
Streambed material:
Discharge Data (cfs): Q2.33
Q50 _
Record flood date (MM / DD
Estimated Discharge (cfs):
Ice conditions (Heavy, Moderate, Light
The stage increases to maximum h
The stream response is (Flashy, Not
Watershed storage area (in perc
The watershed storage area is:
Descrstage:
Water Surface Elevation Estimates
Peak discharge frequency
Water surface elevation (ft))
Velocity (ft / sec)
Long term stream bed changes:
Is the roadway over w t
Relief Elevation (ft):
Are there other structures
Upstream dist
Highway No. :
Clear span (ft): Clear Heig
Brid ____ iN
_____ Q10 __ ____ Q25 _
__ Q100 _ ____ Q500
urfac n (ft):
t Q ft/s): _
) Debris (Heavy, Moderate
ighwat , Not rapidly):
flashy):
(1-mainly at the headwaters; 2- uniformly distributed; 3-imm
for Existing Structure:
Q Q Q Q Q
he Q100? (Yes, No, Unknown): _ Fr
Discharge over roadway at Q100 (ft3/ sec):
Yes, No, Unkno
____ Town:
ht (ft): Full Waterway (ft2):
Structure No. : tructure T
type ctrl-n o
oi the site)
36
_______
data available? f No, type ctrl-n h VTAOT Drainage area (mi ):_________________________________________________________________-
: -
_______________________________________________________________boulders
_____
________- ________- ________-_____
________- ________- ________-___ / -
___ /-___
___-
_______- / YY):________-
Water s____ (-
e elevatio_______-
_ Velocity a: __________-
____________- , Light):_______________-
er elevation (Rapidly_______________-
ibe any significant site conditions upstream or downstream that may influence the stream’s-
: ___%-
ediatly upstream
ent)
___ -
2.33 10 25 50 100
- - - - -
- - - - -
-
____-
_______- topped belo_________-
equency:________-
____-
nearby? (_______-
wn):___________________If No or Unknown,
-
______s-
ance (miles):________________-
______ S- _____________________Year Built:-
______-
______- _______ype:-

Downstream d _____ Town
Highway No. :
Clear span (ft): Clea
Comments:
Drainage area (DA)
Watershed storage (ST
Main channel slope (S) __
Bridge site elevation _
Main channel length _
10% channel length elev
Watershed Precipitation Dat
Average site precipitation _
Maximum 2yr-24hr precipit
Average seasonal snowfall
Watershed Hydrographic Da
: ______-
r Height (ft):
Struc
USGS Wate
2
%
t / mi
ft Hea
mi
ation _ ft
a
in Ave
ation event (I24,2)
(Sn) _ t
ta
Lak
3
___________________-
Full Waterway (ft2):
Structure T
rshed Data
dwater elevation _ ft
85% channel length elevation _
rage headwater precipitation _
n
e/pond/swamp area mi2
7
______-
istance (miles)
________________-
:: ______-
_____________________Year Built:-
_____-
______ture No.
-
_______ype:-
abutment, with boulders showing at the ends of the wingwalls and along the channel embankments. Minor debris and poor channel alignment were noted in the VT AOT files. No undermining or footingseen. There is a remark in the report that “water is quite swift and deep - hard to check for undermining”.
________ m14.45
_________0.901 i_________6.24
) __________1808
_________3064_________5.16
ft
_________1940 _________2300________ f73.03
in
_________- _________-________ i-
________ f-
Reference Point (MS
Is boring information
Foundation Material
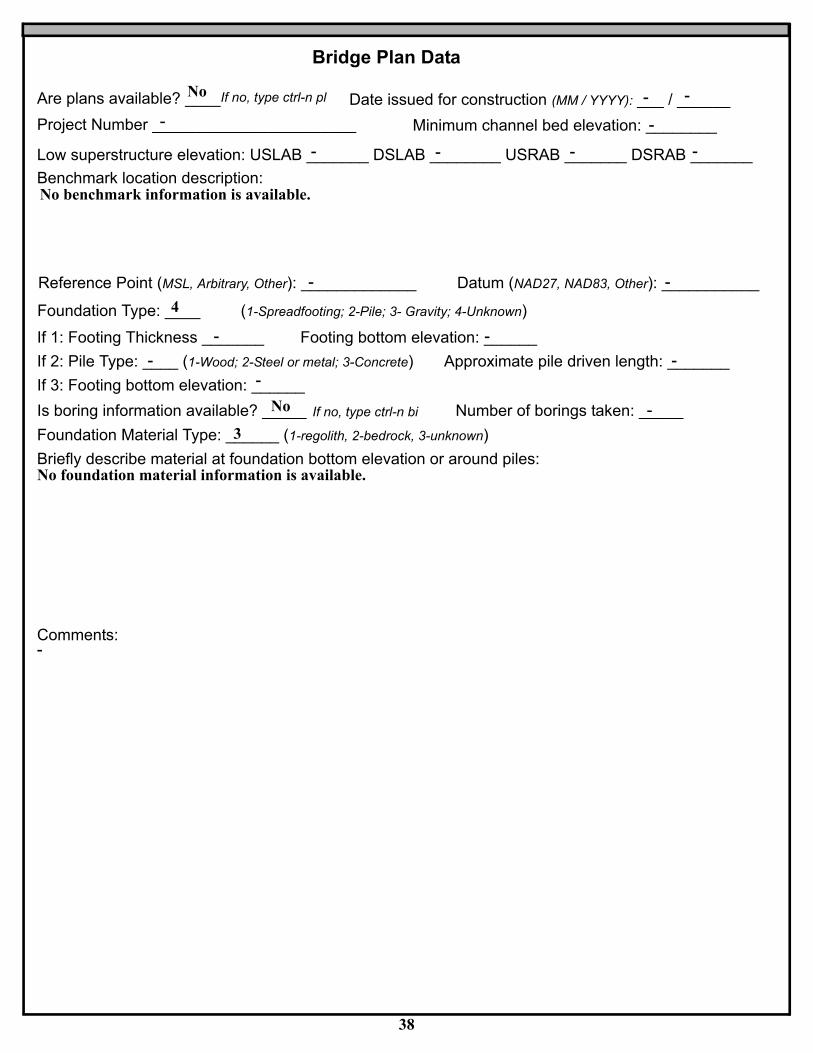
Bridge Plan Data
Are plans availa te issued for construction (MM / YYYY):
Low superstructure
Foundation Type:
If 1: Footing Thickne
If 2: Pile Type:
If 3: Footing bottom
no, type ctrl-n pl
Project Number
____IfNo
L, Arbitrary, Other): Datum (NAD27, NAD83, Oth
available?
Type: _ (1-regolith, 2-bedrock, 3-unknown)
Number of borings taken:
elevation: USLAB SLAB USRAB
Minimum channel bed elevation
(1-Spreadfooting; 2-Pile; 3- Gravity; 4-Unknown)
ss _ Footing bottom elevation
(1-Wood; 2 tal; 3-Concrete) Approximate pile driven len
elevation:
If no, type ctrl-n bi
38
___ / -
er):
SRA
:
gth:
______-
ble? Da_______________________-
________-B
_______ D- ________- _______ D- _______-Benchmark location description:No benchmark information is available.
_____________-
___________-____ 4
______-
: ______-_
____ - ______- -Steel or me______-
_____No
_____-_____3
Briefly describe material at foundation bottom elevation or around piles:No foundation material information is available.
Comments:-

ross-sectional DataIs cross-sectional data available?
Source (FE
Comments:
Station
Feature
Low cord
elevation
Bed
elevation
Low cord to
bed length
Station
Feature
Low cordelevationBedelevationLow cord tobed length
Source (FEMA, VTAOT, Other)? _Comments:
Station
Feature
elevation
elevation
bed length
Low cord
Bed
Low cord to
Low cord
Bed
Low cord to
Station
Feature
elevation
elevation
bed length
If no, type ctrl-n xs
C _____Y
_________VTAOT
MA, VTAOT, Other)?This cross section is along the upstream face. The low chord elevations are from the surveylog completed for this report on 8/1/96. The low chord to bed length data are from the sketch attached to a bridge inspection report dated 9/27/93.0 2
LAB
497.6 4
487.4 4
10.2 9
6 3
97.8 4
88.2 4
.6 1
9 5
R
97.9 4
87.0 4
0.9 1
4 -
AB -
98.0 -
87.5 -
0.5 -
-
-
-
-
-
39
-
-
-
-
-
-
-
-
-
-
-
-
-
-
-
-
-
-
-
-
-
-
-
-
-
-
-
-
-
-
-
-
-
-
-
-
-
-
-
-
-
-
-
-
-
-
-
-
-
-
-
-
-
-
-
-
-
-
-
-
-
-
-
-
-
-
-
-
-
-
-
-
-
-
-
-
-
-
-
-
________-
-
-
-
-
-
-
-
-
-
-
-
-
-
-
-
-
-
-
-
-
-
-
-
-
-
-
-
-
-
-
-
-
-
-
-
-
-
-
-
-
-
-
-
-
-
-
-
-
-
-
-
-
-
-
-
-
-
-
-
-
-
-
-
-
-
-
-
-
-
-
-
-
-
-
-
-
-
-
-
-
-
-
-
-
-
-
-
-
-
-
-
-
-
-
-
-
-
-
-
-
-
-
-
-
-
-
-
-
-
-
-

40
APPENDIX E:
LEVEL I DATA FORM

U.S
.DE
PA
RTM N OF H
I
G LC SUV
YET T E
NTERORI
E
OA RI
OL
GE
UB
US lef
U. S. Geological SurveyBridge Field Data Collection and Processing Form
Structure Number
A. Gene
1. Data collected by (First In ll last name)
2. Highw
Count
Waterway (I -
Route Numbe
B. Bri
4. Surface cover... LBUS RBUS(2b us,ds,lb,rb: 1- Urban; 2- S ; 3- Ro
5. Ambient water surfa US
6. Bridge structure typ - single span; 2- box culvert; o
7. Bridge length feet)
Road approach to bridge:
8. LB B ( 0 even, 1- lower, 2- highe
LBUS
RBUS
RBDS
LBDS
14.Severi
Erosion: 0 - none; 1- channel erosion; 2-
Erosion Severity: 0 - none; 1- slight; 2- moderate;
9. LB B 1- Paved, 2- Not paved)
US righ
10. Emban (run / rise :
Qa/Qc Check by ate
Computerized by ate
Reviewd by: ate
13.Erosion Protection
11 12
road wash; 3- both; 4- other
3- severe
Bank protection types: 0- none; 1- < 12 inches;2- < 36 inches; 3- < 48 inches;4- < 60 inches; 5- wall / artificial leve
Bank protection conditions: 1- good; 2- slumped;3- eroded; 4- failed
______________REDSTH00360025
ral Location Descriptive
/YY) 1
__. _R Bdg
- mr 7-
r)
ty
e
________________URNS
wn
oad Name
Hydrologic Unit Code
Mile
e Deck Observations
LBDS RBDS 4- P - Shrub- and brushland; 6- Fores
DS 1- pool; 2- riffle)
ultiple span; 3- single arch; 4- multiple arch; 5- cy other)
Span length feet)
Channel approach to brid
15. Angle of approach:
17. Channe zone 1: Exist?
Where? LB, RB)
Range ee US, UB, DS) to
Channel impact zone 2: Exist?
Where? LB, RB)
Range? ee S, UB, DS) to
16. Bridge
Q
Q
Approach AngleBridge Skew A
Severity
Severity
Impact Severity: 0- none to very slight; 1- Slight;
41
Bridge wi
____ /08
Overat; 7- W
lindrica
ge (B
or N)
e
or N)
e
skew
ngle
2- Mod
dth
____ / 01
letland)
l culvert;
F):
Q
Ope
erate; 3-
fee
to
9____96
itial, Fu_____01
Date (MM/DDr ______________000000
ay District Numbery___________________________Bennington 003
______________________________marke
Readsboro 58600
To6) _________________________________ RWest Branch Deerfield River
__________________________-r ________C3036
: ___________020200033. Descriptive comments:Located 0.11 miles from junction with vt 100.
_____6
_____4 _____5 _____5 l _____5 uburban______2
_____w crops;2
asture; 5
_____ (1
ce...e _____( 16
1
t)
________ (59 ________ (57 ______ (23.4____ R1
____1____ R1
____ (1ning skew
.Type
_____5
.Cond._____1
_____2 _____1_____0
_____- _____0 _____-_____0
_____- _____0 _____-_____0
_____- _____2 _____1_____50
: _____50_____ (Y
l impact_____ (RB
Y
____2
? _____ f30
t ____ (US _____fe0 t ____US_____ (Y
_____ (LB
Y____2
_____ f0
t ____(UUS _____fe10 t ____DSt ________
kment slope
-
t _______in feet / foot)
-
=
roadway
30.0
: _______ DEW
: __________10/30/96: _______ DEW
: __________10/30/96_______ DRF
: __________6/16/97Severe

C. Upstream Channel Assessment
21. Bank height (BF) 22. Bank angle (BF) 26. % Veg. cover (BF) 27. Bank material (BF) 28. Bank erosion (BF)
18. Bridge Type
1a- Vertical abutments with wingwalls
1b- Vertical abutments without wingwalls
2- Vertical abutments and wingwalls, sloping embankmentWingwalls perpendicular to abut. face
3- Spill through abutments
4- Sloping embankment, vertical wingwalls and abutmentsWingwall angle less than 90
1b without wingwalls1a with wingwalls
2
3
4
19. Bridge Deck Comments (surface cover variations, measured bridge and span lengths, bridge type variations,
_______
20. SRD
86.0
Bed and
Bank Ero
23. Bank w
30 .Bank p
Bank pro
Bank pro
SRD - Se
LB RB
_____
LB
_____ _____ _ 3.5
bank Material: 0- organics; 1-
sion: 0- not evident; 1- light flu
idth 24. Cha
4- cobble, 64 -
rotection type: LB
tection types: 0- absent; 1- < 1
tection conditions: 1- good; 2-
ction ref. dist. to US face
RB
____ 5.0
nnel width 25. Thalweg dept 29. Bed Materia
_____ 5.0% Vegesilt / clay,
vial; 2- m256mm; 5
RB
2 inches;
slumped;
_____ 50.0
tation (Veg) cover: 1- 0 to 25%; 2- 26 < 1/16mm; 2- sand, 1/16 - 2mm; 3- g
oderate fluvial; 3- heavy fluvial / mas- boulder, > 256mm; 6- bedrock; 7- m
31. Bank protection c
2- < 36 inches; 3- < 48 inches; 4- < 6
3- eroded; 4- failed
42
h _____ 73.5
: ______1a
approach overflow width, etc.)
#4. There are trees along the upstream left and right banks, as well as along the downstream right bank. The upstream right overbank is a mowed hay field. The downstream right and left overbanks have tall weeds and shrubs. The road is along the downstream left overbank. The upstream left bank has a wide area of trees and is forested beyond two bridge lengths from the stream with a clearing and gravel road beyond the forested area.
LB
_____3
RB_____3
LB_____543
to 50ravel
s wasanm
ondit
0 inc
RB
_____543
%; 3- 51 to 7, 2 - 64mm;
tingade
ion: LB
hes; 5- wall
LB
_____0
5%; 4- 76 to
RB
/ artificial lev
RB
_____0
l _____543
_____5
_____2 _____3 _____1100%
ee
32. Comments (bank material variation, minor inflows, protection extent, etc.):The bank protection on both the right and the left banks extends well beyond two bridge lengths; to at least 1000 feet upstream. On the upstream left bank, there are the remains of an old mill. Various stone walls extend along the bank and there is another wall closer to the gravel road. These walls have slumped and eroded in places.

47. Scour dimensions: Length idth epth
46. Mid-scour distance
49. Are there major c ces? o ctrl-n mc) 50. Ho
51. Confluence 1: Distance 52. Enters o B or RB) 53. Typ 1- perennial; 2- ephemeral)
Confluence 2: Distance Enters on LB or RB) Type ( 1- perennial; 2- ephemeral)
Bridge Channel Assessment
56. Height (BF)LB RB
57 Angle (BF) 61. Material (BF) 62. Erosion (BF)LB RB LB RB LB RB
55. Channel restraint (BF)? LB 1- natural bank; 2- abutment; 3- artificial levee)
45. Is channel scour present? Y or if N type ctrl-n cs)
Position LB to RB
39. Is a cut-bank t? Y or if N type ctrl-n 40. Whe )
41. Mid-bank dist 42. Cut bank extent e S, UB) t e S, UB, DS)
43. Bank damage ( 1- eroded and/or creep; 2- slip failure; 3- block failure)
33.Point/Side b en Y or N c 35. Mi th:4. Mid-bar distance
36. Point ba ee S, UB) to e S, UB, DS) positioned LB to RB
37. Material:
__________ _____ 25.5
58. Bank width (BF
Bed and bank Mate
Bank Erosion: 0- no
_____ _____ 1.5
. Channel width (Amb . Thalweg depth (Amb 63. Bed Materia
) _____ 59 -rial: 0- organics; 1- silt / clay, < 1/
t evident; 1- light fluvial; 2- mode
5- boulder, > 256mm; 6- bed
) _____ 60 -
16mm; 2- sand, 1/16 - 2mm; 3- gra
rate fluvial; 3- heavy fluvial / mass
rock; 7- manmade
43
) _____ 90.0
_____ (Y
ve
wa
: ______46
l, 2 - 64mm; 4- cobble, 64 -
sting
______16
ar pres: ______ f100t?t ____ (UUS
. if N type
______ fe30
trl-n pb)3t ____ (UUS
____ %0 d-bar wid_____ %15
r extent_____543
38. Point or side bar comments (Circle Point or Side; Note additional bars, material variation, status, etc.):_____ (N
_____ (- presen: _____-cb)
: _____ fe-
t ____ (U- re?o _____ fe-
LB or RBt ____ (U-
ance: _____ -
44. Cut bank comments (eg. additional cut banks, protection condition, etc.):NO CUT BANKS_____ (Y
: _____10 US______ W40
______ D7 : _____2 ____ %60 _____ %100 48. Scour comments (eg. additional scour areas, local scouring process, etc.):Scour depth is 2 feet, based on a 1 foot thalweg. The scour is in front of the USRWW and RABUT. The mid-scour point is at the corner, but it is 10 feet upstream measured from the center of the upstream bridge face, due to 50 degree bridge skew. Scour is from 40 feet upstream to 0 feet upstream._____ (YN
_____- onfluen _____-r if N type
n _____ (L-
w many?e _____ (-
_____-
_____ (- _____ - 54. Confluence comments (eg. confluence name):NO MAJOR CONFLUENCESD. Under _____ RB _____ (2
_____2
_____7 _____7 _____-l ______-
256mm;
64. Comments (bank material variation, minor inflows, protection extent, etc.):543At the present water level, the water is deflected by the USRWW, flows parallel to the bridge face and impacts the left abutment. At higher flows, the channel flow is straight under the bridge as the left and right banks are low.

73. Toe
82. Bank / Bridge Protection:
USLWW USRWW RABUT LB RB DSLWW DSRWW
Type
Condition
Location
80. Wingwalls:
Exist? Material?
USLWW
USRWW
DSLWW
DSRWW
Wingwall materials: 1- Concrete; 2- Stone masonry or drywall; 3- steel or metal;
Angle?
Q
USRWW
DSRWW
Length?Wingwall
Wingwallangle
Pushed: LB or RB Toe Location (Loc.): 0- even, 1- set back, 2- protrudesScour cond.: 0- not evident; 1- evident (comment); 2- footing exposed; 3-undermined footing; 4- piling expos
Abutments 71. Attack 72. Slope 74. Scour
LABUT
RABUT
(BF) (Qmax) loc. (BF)77. Material 78. Length
Materials: 1- Concrete; 2- Stone masonry or drywall; 3- steel or metal; 4- wood
Extent
Scour
Bank / Bridge protection types: 0- absent; 1- < 12 inches; 2- < 36 inches; 3- < 48 inches; 4- < 60 inches;
Bank / Bridge protection conditions: 1- good; 2- slumped; 3- eroded; 4- failed5- wall / artificial levee
Protection extent: 1- entire base length; 2- US end; 3- DS end; 4- other
75. Scour Exposure
Scour
Condition
81.
44
5- settled; 6- failed
depth depth76.
lengthExposure
4- wood
65. Debris and Is there debris accumulation? or N)
69. Is there evidence of ice build-up? or N)
66. Where 1- Upstream; 2- At bridge; 3- Both)
Ice Blockage Potentia 1- Low; 2- Moderate; 3- High)
67. Debris Potentia 1- Low; 2 rate; 3- High) 68. Capture Efficienc 1- Low; 2- Moderate; 3- High)
90.0
47.0
USLWW
ed;
_____ _____ 47.0
_____ _____ 2.0
_____ _____ 28.5
_____ _____ 29.0
____ (Y
_____ (N Icel ____ (-?
y ____ (1
___ (Y
- Mode1
l ____ (N70. Debris and Ice Comments:1 -
45
90 2 1 2 01
- 90 2 179. Abutment comments (eg. undermined penetration, unusual scour processes, debris, etc.):
201The channel turns at the upstream bridge face. Scour along the left abutment extends along the entire base length. Scour is only along the upstream half of the right abutment. The downstream half of the right abut-ment has been filled in with stones (type-2).
_____ _____:
_____ _____depth?Condition?
_____
depth?
_____ _____: Y
_____ _____1 _____0_____ _____: -
_____ _____- _____Y_____ _____: 1
_____ _____1 _____2DSLWW
-
Y
1
1
1
-
LABUT
Y
1
0
-
-
0
-
-
2
1
2
0
-
-
2
1
3
-

86. Locati
87. Type
88. Materi
89. Shape
90. Incline
91. Attack
92. Pushe
93. Length
94. # of pi
95. Cross-
96. Scour
97. Scour
Level 1 P
Piers:
84. Are there piers? or if N type ctrl-n pr)
Pier 1
w1
Pier 2
Pier no. width (w) feet elevation (e) feet
Pier 3
Pier 4
e@w1 e@w3
85.
98. Expos
w1
on (BF)
al
d?
(BF)
d
(feet)
les
members
Condition
depth
ier Descr.
ure depth
75.0
w2
8.5
e@w2
10.0
w318.0
30.0
14.5 85.0w3w2
9.0 - - - - --
- - - - -LFP, LTB, LB, MCL, MCM, MCR, RB, RTB, RFP
1- Solid pier, 2- column, 3- bent
1- Wood; 2- concrete; 3- metal; 4- stone
1- Round; 2- Square; 3- Pointed
Y- yes; N- no
LB or RB
-
- - -83. Wingwall and protection comments (eg. undermined penetration, unusual scour processes, etc.):-----213211
_____ (YTh
1
e
upst
ream
right
wing
wall
and
dow
0- none; 1- laterals; 2- diagonals; 3- both
nstre 0- not evident; 1- evident (comment);4- undermined footing; 5- settled; 6- failed 2- footing exposed; 3- piling exposed;
amleft
wing
2
wall
are
pro-
tecte
d on
the
ends
by
bank
pro-
tec-
tion.
3
The
USL
WW
is
pro-
tecte
d on
the
upst
ream
end
4
by an
old
stone
wall.
Ther
e is
also
stone
in
front
of
45
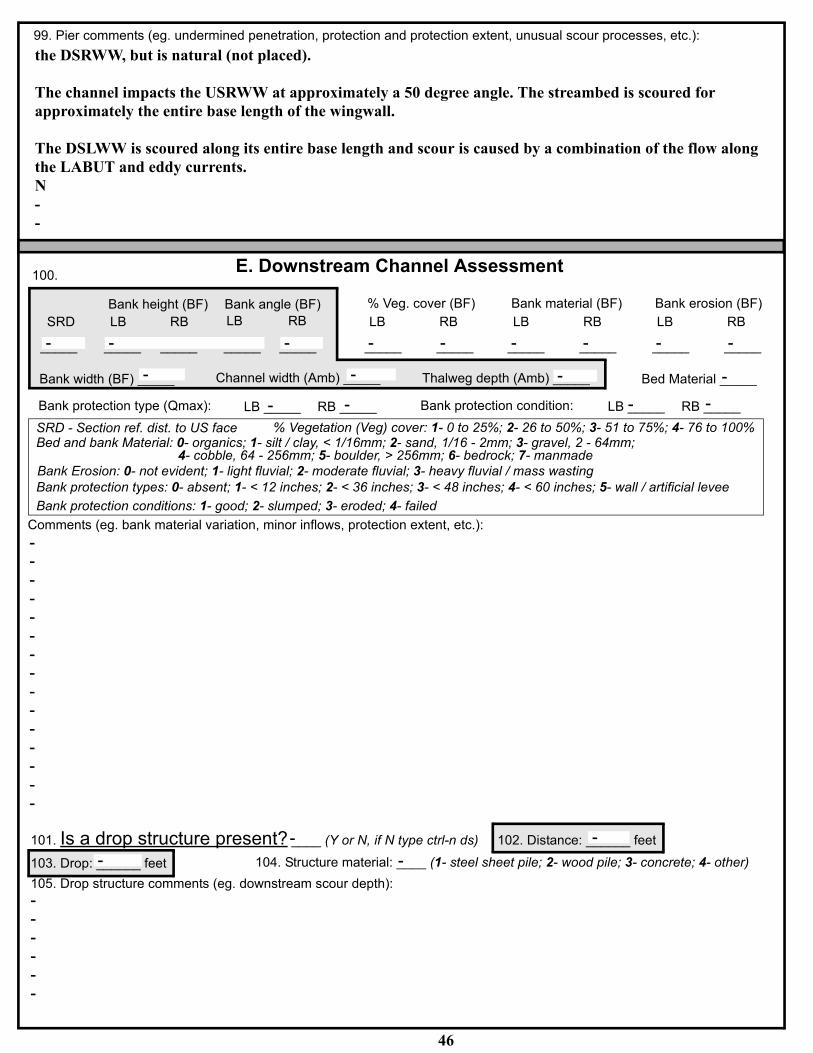
E. Downstream Channel Assessment
Bank height (BF) Bank angle (BF) % Veg. cover (BF) Bank material (BF) Bank erosion (BF)LB RB
100.
_____
SRD
-
Bank wid
Bank prot
Bed and b
Bank ErosBank prote
Bank prote
SRD - Sec
101. Is a103. Dro
LB RB
_____ _____ _____ -
th (BF Channel
ection type (Qmax): LB
ank Material: 0- organics; 1- s
ion: 0- not evident; 1- light flu 4- cobble, 64 - 2
ction types: 0- absent; 1- < 12
ction conditions: 1- good; 2- s
tion ref. dist. to US face
ucture presen10et
_____ -
width (Amb Thalweg depth (Amb Bed Materia
) _____ -RB
% Vegetatiilt / clay, < 1
vial; 2- mod56mm; 5- b
inches; 2-
lumped; 3-
t? (Y
4. Structure
) _____ -
Bank protection cond
46
on (Veg) cover: 1- 0 to 25%; 2- 26 t/16mm; 2- sand, 1/16 - 2mm; 3- gr
erate fluvial; 3- heavy fluvial / massoulder, > 256mm; 6- bedrock; 7- m
< 36 inches; 3- < 48 inches; 4- < 6
eroded; 4- failed
or N, if N rl-n ds) 102. Dis
materia 1- steel sheet pile;
) _____ -
ition: LB RB
o 50%; 3- 51 to 75%; 4- 76 to 100%avel, 2 - 64mm;
wastinganmade
0 inches; 5- wall / artificial levee
tance et
2- wo
: ______ fe -
od pile; 3- concrete; 4- other)
drop strp: ______ fe -
99. Pier comments (eg. undermined penetration, protection and protection extent, unusual scour processes, etc.):
the DSRWW, but is natural (not placed).
The channel impacts the USRWW at approximately a 50 degree angle. The streambed is scoured for approximately the entire base length of the wingwall.
The DSLWW is scoured along its entire base length and scour is caused by a combination of the flow along the LABUT and eddy currents.N--
LB
_____-
RB_____-
LB_____-
RB_____-
LB_____-
RB_____-
l _____-
_____-
_____- _____- _____-Comments (eg. bank material variation, minor inflows, protection extent, etc.):---------------
____-
type ctl: ____ (-
105. Drop structure comments (eg. downstream scour depth):------
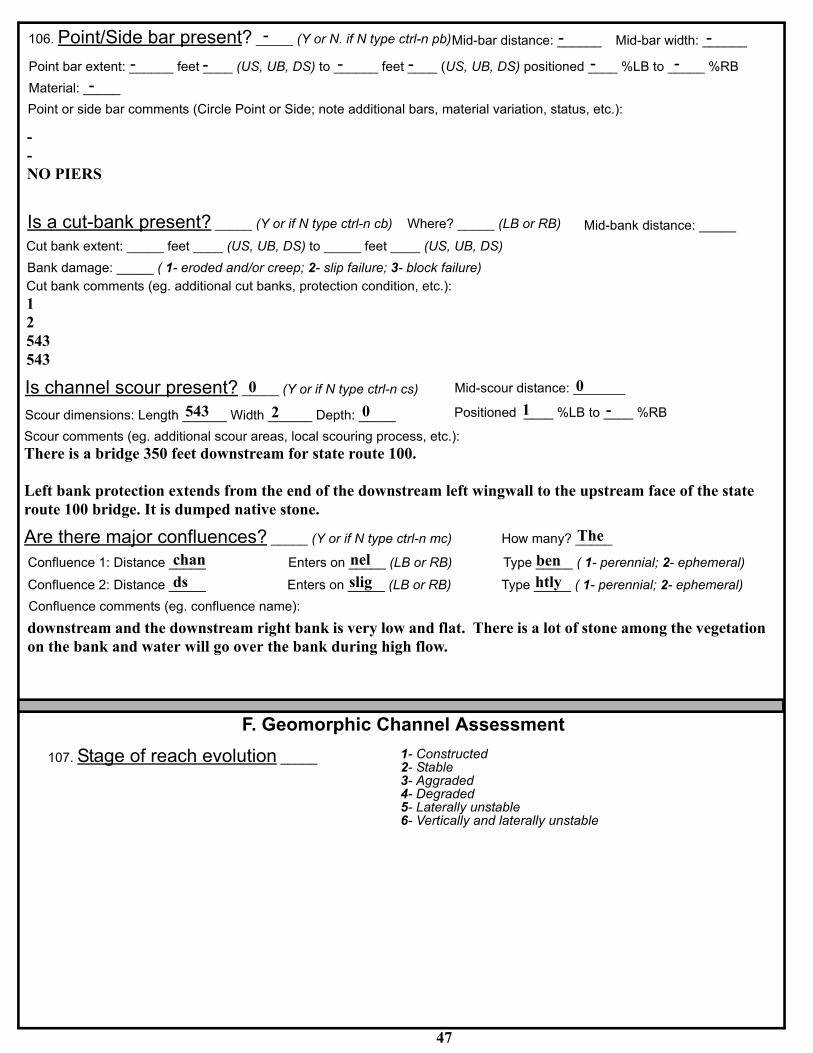
Scour dimensions: Length id
Is channel scour p
Are there major c cesConfluence 1: Distance
Confluence 2: Distance
106. Point/Side bar present? Y or N. if N type ctrl-n pb) id-bar widthMid-bar distance
Point ba ee S
Point or side bar comments (Circle Poi
Material:
Is a cut-banCut bank exte e S,
Bank damage ( 1- eroded and/
F.
107. Stage of reach evolut
_____ (-
th epth
Mid-scourY or if N typ s)
Positioned
? Y or ctrl-n mc) How
Enters o LB or RB) Typ
Enters o LB or RB) Typ
47
, UB, DS) to e S, UB, DS) posi
nt or Side; note additional bars, material variation,
Y or if N t c re? LB or R
UB, DS) t e S, UB, DS)
or creep; 2- slip failure; 3- block failure)
Geomorphic Channel Assessme
ion _ 1- Constructed2- Stable3- Aggraded4- Degraded5- Laterally unstable6- Vertically and laterally
M: ______-
LB to RB
1- perennial; 2- eph
1- perennial; 2- eph
tioned LB to
status, etc.):
B) Mid-bank distance
nt
unstable
: ______-
RB
: ______ f- t ____ (U- ______ fe- t ____ (U- ____ %- _____ %- r extent_____-
--NO PIERS
_____ (
_____ ( : _____ k preset: _____ fent?
t ____ (U
ype ctrl-n
o _____ fe
b) Whe
t ____ (U
n: _____
Cut bank comments (eg. additional cut banks, protection condition, etc.):12543543_____ (0
: _______0______ W
resent?543
______ D2 : _____e ctrl-n c
0
distance
____ %1
____ %-Scour comments (eg. additional scour areas, local scouring process, etc.):There is a bridge 350 feet downstream for state route 100.
Left bank protection extends from the end of the downstream left wingwall to the upstream face of the state route 100 bridge. It is dumped native stone.
_____ (
_____Theemeral)
onfluen _____chan
if N type
_____ (nel
many?e _____ (ben
emeral)
_____ds nn _____ (slig
e _____ (htlyConfluence comments (eg. confluence name):
downstream and the downstream right bank is very low and flat. There is a lot of stone among the vegetation on the bank and water will go over the bank during high flow.
____

108. Evolution comments (Channel evolution not considering bridge effects; See HEC-20, Figure 1 for geomorphic
descriptors):N-NO DROP STRUCTURE
48
109. G. Plan View Sketch
49
point bar
cut-bank
scour hole ambient channelrip rap or
debris stone wall
other wallflow
cross-section
pb
cb
Q
stone fill
-

50
APPENDIX F:
SCOUR COMPUTATIONS

SCOUR COMPUTATIONS Structure Number: REDSTH00360025 Town: Readsboro Road Number: C3036 County: Bennington Stream: West Branch Deerfield River Initials RHF Date: 6/24/97 Checked: EMB Analysis of contraction scour, live-bed or clear water? Critical Velocity of Bed Material (converted to English units) Vc=11.21*y1^0.1667*D50^0.33 with Ss=2.65 (Richardson and others, 1995, p. 28, eq. 16) Approach Section Characteristic 100 yr 500 yr other Q Total discharge, cfs 3020 4750 3580 Main Channel Area, ft2 490 757 561 Left overbank area, ft2 226 451 272 Right overbank area, ft2 24 800 120 Top width main channel, ft 81 81 81 Top width L overbank, ft 53 92 57 Top width R overbank, ft 68 319 153 D50 of channel, ft 0.3829 0.3829 0.3829 D50 left overbank, ft -- -- -- D50 right overbank, ft -- -- -- y1, average depth, MC, ft 6.0 9.3 6.9 y1, average depth, LOB, ft 4.3 4.9 4.8 y1, average depth, ROB, ft 0.4 2.5 0.8 Total conveyance, approach 60615 187554 80505 Conveyance, main channel 47068 97201 58949 Conveyance, LOB 13105 35446 17755 Conveyance, ROB 442 54908 3799 Percent discrepancy, conveyance 0.0000 -0.0005 0.0025 Qm, discharge, MC, cfs 2345.1 2461.7 2621.4 Ql, discharge, LOB, cfs 652.9 897.7 789.6 Qr, discharge, ROB, cfs 22.0 1390.6 168.9 Vm, mean velocity MC, ft/s 4.8 3.3 4.7 Vl, mean velocity, LOB, ft/s 2.9 2.0 2.9 Vr, mean velocity, ROB, ft/s 0.9 1.7 1.4 Vc-m, crit. velocity, MC, ft/s 11.0 11.8 11.2 Vc-l, crit. velocity, LOB, ft/s ERR ERR ERR Vc-r, crit. velocity, ROB, ft/s ERR ERR ERR Results Live-bed(1) or Clear-Water(0) Contraction Scour? Main Channel 0 0 0 Left Overbank N/A N/A N/A Right Overbank N/A N/A N/A
ARMORING D90 1.206 1.206 1.206
51

D95 1.853 1.853 1.853 Critical grain size,Dc, ft 1.0591 0.4834 1.1200 Decimal-percent coarser than Dc 0.1135 0.3436 0.1079 Depth to armoring,ft 24.82 2.77 27.78
Clear Water Contraction Scour in MAIN CHANNEL y2 = (Q2^2/(131*Dm^(2/3)*W2^2))^(3/7) Converted to English Units ys=y2-y_bridge (Richardson and others, 1995, p. 32, eq. 20, 20a) Approach Section Q100 Q500 Qother Main channel Area, ft2 490 757 561 Main channel width, ft 81 81 81 y1, main channel depth, ft 6.05 9.35 6.93 Bridge Section (Q) total discharge, cfs 3020 4750 3580 (Q) discharge thru bridge, cfs 3020 4398 3580 Main channel conveyance 16195 29341 19307 Total conveyance 16195 29341 19307 Q2, bridge MC discharge,cfs 3020 4398 3580 Main channel area, ft2 237 441 265 Main channel width (skewed), ft 46.8 47.1 46.8 Cum. width of piers in MC, ft 0.0 0.0 0.0 W, adjusted width, ft 46.765 47.11 46.765 y_bridge (avg. depth at br.), ft 5.06 9.37 5.67 Dm, median (1.25*D50), ft 0.478625 0.478625 0.478625 y2, depth in contraction,ft 5.44 7.46 6.29 ys, scour depth (y2-ybridge), ft 0.38 -1.91 0.62 Pressure Flow Scour (contraction scour for orifice flow conditions) Hb+Ys=Cq*qbr/Vc Cq=1/Cf*Cc Cf=1.5*Fr^0.43 (<=1) Chang Equation Cc=SQRT[0.10(Hb/(ya-w)-0.56)]+0.79 (<=1) (Richarson and others, 1995, p. 145-146) Q100 Q500 OtherQ Q, total, cfs 3020 4750 3580 Q, thru bridge, cfs 3020 4395 3580 Total Conveyance, bridge 16195 29341 19307 Main channel(MC) conveyance, bridge 16195 29341 19307 Q, thru bridge MC, cfs 3020 4395 3580 Vc, critical velocity, ft/s 10.99 11.81 11.24 Vc, critical velocity, m/s 3.35 3.60 3.43 Main channel width (skewed), ft 46.8 47.1 46.8 Cum. width of piers in MC, ft 0.0 0.0 0.0 W, adjusted width, ft 46.8 47.1 46.8 qbr, unit discharge, ft2/s 64.6 93.3 76.6 qbr, unit discharge, m2/s 6.0 8.7 7.1 Area of full opening, ft2 236.7 441.3 265.2 Hb, depth of full opening, ft 5.06 9.37 5.67 Hb, depth of full opening, m 1.54 2.86 1.73 Fr, Froude number, bridge MC 0 0.62 0 Cf, Fr correction factor (<=1.0) 0.00 1.00 0.00
52

Elevation of Low Steel, ft 0 497.81 0 Elevation of Bed, ft -5.06 488.44 -5.67 Elevation of Approach, ft 0 500.57 0 Friction loss, approach, ft 0 0.17 0 Elevation of WS immediately US, ft 0.00 500.40 0.00 ya, depth immediately US, ft 5.06 11.96 5.67 ya, depth immediately US, m 1.54 3.64 1.73 Mean elevation of deck, ft 0 501.77 0 w, depth of overflow, ft (>=0) 0.00 0.00 0.00 Cc, vert contrac correction (<=1.0) 1.00 0.94 1.00 Ys, depth of scour, ft N/A -0.96 N/A Comparison of Chang and Laursen results (for unsubmerged orifice flow) y2, from Laursen’s equation, ft 5.439139 7.459696 6.292925 Full valley WSEL, ft 0 494.02 0 Full valley depth, ft 5.061478 5.577438 5.670908 Ys, depth of scour (y2-yfullv), ft N/A 1.882259 N/A Abutment Scour Froehlich’s Abutment Scour Ys/Y1 = 2.27*K1*K2*(a’/Y1)^0.43*Fr1^0.61+1 (Richardson and others, 1995, p. 48, eq. 28) Left Abutment Right Abutment Characteristic 100 yr Q 500 yr Q Other Q 100 yr Q 500 yr Q Other Q (Qt), total discharge, cfs 3020 4750 3580 3020 4750 3580 a’, abut.length blocking flow, ft 57 95 60.3 99.1 349.8 183.6 Ae, area of blocked flow ft2 241.2 477.6 290.8 207.9 999.3 330.9 Qe, discharge blocked abut.,cfs 715.9 975.12 862.16 865.7 2270 1116.1 (If using Qtotal_overbank to obtain Ve, leave Qe blank and enter Ve and Fr manually) Ve, (Qe/Ae), ft/s 2.97 2.04 2.96 4.16 2.10 3.37 ya, depth of f/p flow, ft 4.23 5.03 4.82 2.10 2.86 1.80 --Coeff., K1, for abut. type (1.0, verti.; 0.82, verti. w/ wingwall; 0.55, spillthru) K1 0.82 0.82 0.82 0.82 0.82 0.82 --Angle (theta) of embankment (<90 if abut. points DS; >90 if abut. points US) theta 120 120 120 60 60 60 K2 1.04 1.04 1.04 0.95 0.95 0.95 Fr, froude number f/p flow 0.254 0.160 0.238 0.507 0.210 0.443 ys, scour depth, ft 15.08 16.29 16.32 14.94 18.25 15.94 HIRE equation (a’/ya > 25) ys = 4*Fr^0.33*y1*K/0.55 (Richardson and others, 1995, p. 49, eq. 29) a’(abut length blocked, ft) 57 95 60.3 99.1 349.8 183.6 y1 (depth f/p flow, ft) 4.23 5.03 4.82 2.10 2.86 1.80 a’/y1 13.47 18.90 12.50 47.24 122.45 101.87 Skew correction (p. 49, fig. 16) 1.07 1.07 1.07 0.90 0.90 0.90 Froude no. f/p flow 0.25 0.16 0.24 0.51 0.21 0.44 Ys w/ corr. factor K1/0.55: vertical ERR ERR ERR 10.97 11.17 9.02 vertical w/ ww’s ERR ERR ERR 9.00 9.16 7.39 spill-through ERR ERR ERR 6.03 6.14 4.96
53

Abutment riprap Sizing Isbash Relationship D50=y*K*Fr^2/(Ss-1) and D50=y*K*(Fr^2)^0.14/(Ss-1) (Richardson and others, 1995, p112, eq. 81,82) Characteristic Q100 Q500 Qother Q100 Q500 Qother Fr, Froude Number 1 0.62 1 1 0.62 1 (Fr from the characteristic V and y in contracted section--mc, bridge section) y, depth of flow in bridge, ft 5.06 9.37 5.67 5.06 9.37 5.67 Median Stone Diameter for riprap at: left abutment right abutment, ft Fr<=0.8 (vertical abut.) ERR 2.23 ERR ERR 2.23 ERR Fr>0.8 (vertical abut.) 2.12 ERR 2.37 2.12 ERR 2.37 Fr<=0.8 (spillthrough abut.) ERR 1.94 ERR ERR 1.94 ERR Fr>0.8 (spillthrough abut.) 1.87 ERR 2.10 1.87 ERR 2.10
54