levels of leadership development and top …
TRANSCRIPT

89
LEVELS OF LEADERSHIP DEVELOPMENT AND TOP MANAGEMENT'S EFFECTIVENESS:
IS THERE A CLEAR-CUT RELATIONSHIP?*
Mia Glamuzina** Received: 17. 2. 2015 Original scientific paper Accepted: 23. 4. 2015 UDC 005.5
This paper is focused on the influence of leadership development on top management's effectiveness, both from theoretical and empirical aspect. The creation of an original theoretical model of leadership development process and top management's effectiveness has the purpose of determining impact, direction and intensity of the relationship between leadership development and top management's effectiveness and offers a new methodological approach to leadership classification using the criteria of developed/undeveloped leadership process and measurement of top management's effectiveness based on contemporary conditions. A new composite variable for measuring leadership development was created and the research implied it strongly correlates with the indicators of top management's effectiveness, both in internal and external perspectives. Empirical verification of the model was conducted on the sample of 106 companies and this deepened the insight into the modern leadership paradigm, its development and affirmation in the area of management effectiveness and it confirmed the research hypotheses. The nature of relationship between management effectiveness and the main dimensions of leadership process – setting direction (by creating vision, explaining the whole and setting the strategy), including people (by communicating vision, building teams and seeking commitment) and motivating (inspiring, empowering and meeting the needs of subordinates) – was determined and it was proved that leadership development has a positive effect on the effectiveness of top management.
* Mia Glamuzina, PhD, is the last doctoral candidate, supervised by Professor Marin Buble. This
paper is based on research, conducted within the scope of her doctoral dissertation and is the last scientific study, personally supervised by the late Professor Buble.
** Mia Glamuzina, PhD, United World College Mostar, Logos Centre Mostar, Bosnia and Herzegovina. E-mail: [email protected]
Management, Vol. 20, 2015, Special issue, pp. 89-131. M. Glamuzina: Levels of leadership development and top management's effectiveness…
90
1. INTRODUCTION Today, leadership is extremely important for development and future
prospects of modern companies. Organizations with poorly developed leadership have difficulties coping with the changes in the environment, they respond reactively and eventually, not being able to counteract the competition, they often go bankrupt. Leadership and its development represent the source of competitive advantage for many organizations.
Majority of authors in the field of management define leadership as one of
the most important factors for determining organizational success (Sikavica et al, 2008; Yukl, 2008). Leadership is considered to be a very important factor that determines the success of implementing change in an organization (Gill, 2006), while poor leadership is considered to be one of the factors that may lead to bankruptcy (Emiliani, 2008).
This research aims to determine the extent to which leadership contributes
to company’s success as well as whether the top management’s effectiveness can be improved through the development of different levels and dimensions of leadership process. Special emphasis will be given to determining the relationship between leadership and top management. The research will try to address the question if there is an opportunity for increasing top management effectiveness by development of the leadership process.
2. THEORETICAL BACKGROUND Management and leadership are interconnected and they complement each
other in every organization, which means that both leadership and management contribute to reaching organizational objectives, (Drucker, 2004; Reddin, 1970; Kotter, 1991; Bass, 1985; Yukl, 2008) but at the same time only a developed leadership can help reach the outcomes that exceed expectations – this is the result of effectiveness and solving the problems that occur in companies with developed leadership. A company is an open system incorporated into a complex network of social relations, which means that maximization of wealth for its shareholders is not its only goal, but it should also serve as an instrument for all of the stakeholders involved in the process of gaining factors of production. This implies that top management should be efficient in internal perspectives (achieving the goal of growth, profit, business continuity and sustainability) as well as in external perspectives (consumer satisfaction and corporate social responsibility) of the business, because exclusion of external perspectives jeopardizes the very survival of a modern company.
Management, Vol. 20, 2015, Special issue, pp. 89-131. M. Glamuzina: Levels of leadership development and top management's effectiveness…
91
Most leadership researchers studied and determined the effect of leader on business performance of the company and most of the studies showed that there is a positive relationship between the variables (Bass, Avolio, Jung and Berson, 2003; Koene, Vogelaar and Soeters, 2002). Although they are very rare, some of the studies have proved that leadership doesn’t have an effect on business performance (Lord et al, 2001). These studies are based on an assumption that followers explain performance as a success of the leader and that leadership by itself is unnecessary. Studies conducted in order to determine the effect of transformational leadership on individual performance (Avolio and Walumbwa, 2009; Bass, 1990) have proved a positive relationship between the variables, a positive effect of leadership on team performance (Yammarino et al, 2005) as well as a positive effect of followers’ empowerment on the business performance of the company (Carmeli, Schaubroecker, Tischler, 2011).
Research conducted with a goal of determining managerial effectiveness in
the public sector showed that there is a positive relationship between the role of the leader, leadership and managerial effectiveness (Analui, 1999). A research conducted on the middle management with the aim of determining the outcomes of leadership development and management also proved that there is a relationship between leadership and management, but the results should be taken with some care since the research was conducted on a public company which provides social care (McGurk, 2010). Some studies were conducted in the army and in the navy in order to examine the link between management and leadership and all of them proved that there is a positive relationship between the personal characteristics of the leader, his behavior and the achieved performance (Young and Dulewitcz, 2009). One of the rare studies in which leadership was examined as a process on an organizational level showed there was a positive relation between developed leadership and managerial effectiveness in the processof merging financial institutions (Armstrong, 2011). All conducted studies have common disadvantages – focus is on one specific field (army, navy, public services, and acquisitions) and the view of the process of leadership is too narrow (leadership examined through only few of its components or on a level lower than organizational level).
With the purpose of increasing top management’s effectiveness developed
leadership needs to recognize people as essential members of the organization and realize that interaction is the foundation of a flexible and self-sustainable organization (Fairholm, 2004). Developed leadership must find a proper way of expressing the mission (Allio, 2013) and transferring it in order to inspire followers with the goal of increasing the overall effectiveness of the company. Meeting unsatisfied needs is an essential element of subordinates’ motivation and

Management, Vol. 20, 2015, Special issue, pp. 89-131. M. Glamuzina: Levels of leadership development and top management's effectiveness…
92
an element of developed leadership. Results of a research conducted by Carmeli, Schaubroeck and Tischler (2011) prove that top management which employs the strategy of empowerment has better financial results than the one that doesn’t, so it is logical to conclude that there is a positive link between motivation through empowerment and effectiveness of top management.
Differing perceptions of the relationship between leadership and
management is causing a lot of problems in the theory of management. Some authors consider leadership to be a process which is superior to management and they describe management as a negative and unnecessary process (Zaleznik, 1997; Bennis, 1989) - from their perspective management is a process lead by objectives which results in stability based on rationality, bureaucracy and fulfillment of commitments, while leadership is an action driven by a purpose of introducing change and transformation based on values, ideals, vision, symbols and emotional exchange (Day and Antoniakis, 2012). Some authors are of the opinion that management is superior to leadership, and leadership is only one of the managerial roles (Mintzberg, 2003), but most of the authors agree that leadership and management are interconnected and they complement each other in the organization, both leadership and management contribute to achieving organizational goals, but still leadership is indispensable for achieving outcomes that surpass expectations (Drucker, 1998; Reddin, 1970; Kotter, 1991; Bass, 2003; Yukl, 2009; Daft, 2012).
Unlike managerial efficiency, which is oriented towards resource usage and
costs, managerial effectiveness has a broader focus – market, consumers and demand – how to achieve objectives while doing the right thing. This requires a high level of creativity and imagination. Changes in the environment, technology, organization, market perspectives, and effects of the legal system on the business seriously affect the approach to leadership development. The basis of a new top management’s approach under new, changed circumstances is effectiveness (Buble, 2011), without which a company cannot survive and develop, operate on global market, be in harmony with nature etc.
Accordingly, the whole approach to top management effectiveness must
include not only internal perspectives of effectiveness, but also external perspectives – top management of a modern company, as a social and economic system with many opposed objectives, must harmonize different interests to fulfill its main purpose and achieve effectiveness and this is included in the model developed in this paper.

Management, Vol. 20, 2015, Special issue, pp. 89-131. M. Glamuzina: Levels of leadership development and top management's effectiveness…
93
Only rare studies are conducted with a goal of isolating the effect of leadership development, as a process, on top management effectiveness. One of those, the research conducted by Day and Lord (1998, 453) found out that the level of leadership development of top management in 45% of cases has the effect on organizational performance.
Assumptions under which the process of leadership can increase the
performance are still very much vague and this is an area in which further research is needed (Finkelstein, Hambrick and Canella, 2009). Main incentive for conducting this research is that there are no previously conducted studies that examine the influence of leadership development on top management effectiveness.
3. RESEARCH OBJECTIVES AND METHODOLOGY
3.1. Objectives, research model and hypotheses Theoretical and empirical studies of leadership conducted until now didn’t
pay enough attention to leadership development as a process. Leadership is a process of using non-coercive influence on defining objectives, motivating behavior that leads people towards these objectives and assisting in defining the culture of a group or an organization.
Process approach states that leadership is not a leader’s trait or feature, but
a transactional event that occurs between leaders and followers (Northouse, 2010, 3). Based on this approach, leadership is a process of influence that occurs naturally within the social system and it is dispersed among members of the group in which important decisions are made through an interactive process that includes the influence of leaders on followers, but also their impact on the leader (Knippenberg and Hogg, 2003, 244).
By analyzing different taxonomies of the process approach to leadership, it
is possible to identify three key dimensions of leadership (Yukl, 2008; Kouzes and Posner, 2002; Conger, 1991; Bass, 2003; Mumford at all, 2007) – setting direction, aligning people and motivating them in order to fulfill both individual and group objectives. Leadership as a multidimensional process (Figure 1) encompasses a range of inter-related and / or interdependent activities, which are through the process of transformation of inputs converted into the result (output).

Management, Vol. 20, 2015, Special issue, pp. 89-131. M. Glamuzina: Levels of leadership development and top management's effectiveness…
94
Figure 1. Process approach to leadership development Source: Author
Accepting a holistic approach to modern leadership, in this paper leadership is seen as a social interactive process between the leader and his followers, in which leaders, through activities of setting direction, engaging people and motivating them, influences the achievement of the objectives of the organization in a changing environment, using changes, innovation and judgment. If leadership is seen as a process then the focus cannot be on the final result (output of the process) only, but also on everything in between (Grint, 2000). In other words, focus of interest in this research is shifted from inputs (leader, followers, objectives, and environment) and outputs (effectiveness) to that between them – the process of leadership and its influence on top management’s effectiveness. Consequently, a new approach should be created, based on cause – effect relationship between leadership and results. Research of effect of leadership development on top management effectiveness must begin with classifying the activities of key leadership dimensions.
3.1.1. Leadership development Three dimensions of leadership process can be shown as a ''triad'' of
dimensions: dimension of goal setting (which includes creating the vision,

Management, Vol. 20, 2015, Special issue, pp. 89-131. M. Glamuzina: Levels of leadership development and top management's effectiveness…
95
explaining the whole and setting the strategy), dimension of aligning people (which includes of communicating the vision, building teams and seeking for commitment) and the dimension of motivating the followers (which includes inspiring subordinates, empowerment and meeting the unsatisfied needs). Three key dimensions of leadership process and nine core activities are identified based on an in-depth analysis of many theories and models of leadership created until now and on the so far determined shortcomings of the developed theories (Kotter, 1996; Snyder, 2010; Gill, 2006). Taking into account that leadership is a group of processes that include a spectrum of activities in each of its dimensions, the main question is: How to determine a level of leadership development within each of its key dimensions and each of its core activities?
In order to determine leadership development level, first step is to identify
the determinants that have crucial impact on the outcome of leadership process and consequently on top management effectiveness. The companies should be classified into those that have developed leadership and those that have undeveloped leadership. During this process, an exceptional limitation must be taken into account – the fact that there were no previously conducted studies that tried to measure leadership development and the lack of methodology for the classification of leadership development.
Classification of the companies into those with developed leadership and
those with undeveloped leadership is based on the approach used to measure the process of leadership development. Since leadership is defined as a social interactive process between the leader and his followers, during which leader, by setting direction, aligning people and their motivation, influences the achievement of the objectives, undeveloped leadership will be defined as a process of leadership in which the vision is not created, the people don’t trust it, long-term goals are not aligned with the vision, and the vision is not successfully transferred from the top management down, interaction between leader and followers is not established nor manifested in any of the activities in neither of the three dimensions of setting direction, aligning people and motivating them during the process of achieving the company’s objectives.
Undeveloped leadership will be defined through previously defined
characteristics, and developed leadership will be defined as the leadership process in which the interaction between the leader and the followers is established and manifested (in varying degrees of intensity) and in which all of the activities in the three dimensions (setting direction, aligning people and motivating them) are present in the process of leading the company.

Management, Vol. 20, 2015, Special issue, pp. 89-131. M. Glamuzina: Levels of leadership development and top management's effectiveness…
96
Based on previous discussions, the criteria for classification of (un) developed leadership have been created (Table 1).
Table 1. Classification of leadership development process
Variable
Undeveloped leadership
Developed leadership
Attribution Attribution 1. Existence of vision No Yes, in various degrees 2. Trust in the vision Small Yes, in various degrees 3. Alignment of long-term goals with
the vision No Yes, in various degrees
4. The role of vision in everyday business
No Yes, in various degrees
5. Transfer of vision from the top management level down
Rarely Yes, in various degrees
6. Clarity of the set goals No Yes, in various degrees 7. Feasibility of the chosen strategy Very small Yes, in various degrees 8. Correlation of the strategy and
plans No Yes, in various degrees
9. Familiarity of the employees with the strategy and the set goals
Very small Yes, in various degrees
10. The circulation of information to employees
Never Yes, in various degrees
11. Forming teams for problem solving Never Yes, in various degrees 12. Commitment of employees to
meeting the strategy and goals Rarely Yes, in various degrees
13. Trust of employees in the shared values and objectives
No Yes, in various degrees
14. Praise and recognition of subordinates
Rarely Yes, in various degrees
15. Management is aware of employees’ problems
No Yes, in various degrees
16. Using material and nonmaterial forms of motivating employees
No Yes, in various degrees
Source: Author
Attributions of the characteristics (the existence – affirmative or lack of confirmation - the negative attribution) to the variables listed in Table 1 are the basis for identifying the determinants of (un) developed leadership. Listed variables that will enable the classification of leadership development are dichotomous variables – that take the value 1 if there is an attribution

Management, Vol. 20, 2015, Special issue, pp. 89-131. M. Glamuzina: Levels of leadership development and top management's effectiveness…
97
(confirmation) or the value 0 if there is no attribution or are extremely small (negative attribution).
Nonexistence of confirmative attribution for any of the variables from 1 to
5 (lack of vision, long-term goals nonaligned with the vision, the vision doesn’t have importance in everyday business, the vision is not transferred from the top management) implies that the leadership of the company is not successful in leading the people towards the achievement of individual and common goals – without a vision and the explanation of why it is important to achieve the future desired state there is no basis for creating the strategy which will lead towards fulfillment of the vision. Based on the fact that creating a vision is one of the main goals of leadership, the kind of leadership which cannot create a realistic vision that cannot align the goals of the company with the vision, nor transfer the vision towards the lower levels in the company represents an undeveloped leadership. Negative attribution on variables from 1 to 5 is a first determinant of undeveloped leadership and the value 0 on any of the variables is an elimination criteria. Such company is said to have undeveloped leadership.
Negative attribution for variables from 6 to 16 is important for determining
the level of development of leadership. Unlike the first determinant which was defined as a “hard variable” – vision of the company (its existence or nonexistence), the second determinant is referred to as a “soft variable” – it is defined with the clarity of goals, feasibility of the strategy, employees’ commitment, building of teams, subordinates motivation and empowerment. The given activities represent an important aspect of classification of developed/undeveloped leadership, but unlike the first determinant (where only one negation was enough to classify a company into a group of undeveloped leadership) in this second determinant the criteria are “softer“ so that elimination from the group of developed leadership follows from two or more negative attributions for a variable.
Unlike the first criteria – hard vision without which there is no leadership,
softening (on two negative attributions from the second determinant) is done because companies which have a vision have fulfilled a necessary condition, but not the only condition for achieving developed leadership, and fulfillment of other conditions is under influence of many different factors – size of company, industry in which the company operates, characteristics of the leader and followers, contextual factors etc. This is the reason why the second determinant was introduced and why elimination from developed leadership happens when there are two negative attributions on the characteristics from the second determinant.

Management, Vol. 20, 2015, Special issue, pp. 89-131. M. Glamuzina: Levels of leadership development and top management's effectiveness…
98
In a situation where there are no similar studies that try to measure leadership development exist and with the first and second determinants as crucial factors that determine the direction and that development of leadership depends on – the author decided to use the first determinant as the automatic discriminatory criteria and companies will be classified as those with undeveloped leadership if there is at least one negation among the first 5 variables while additional discriminatory criteria will be negative attributions on two or more variables from the second determinant. By applying this approach it is possible to classify the companies into those with developed and those with undeveloped leadership, where the companies which do fulfill the criteria for developed leadership have different levels of developed leadership (the levels are defined as 1 – emerging leadership, 2 – poorly developed leadership, 3 – medium developed leadership and 4 – well developed leadership) and the methods of its measurement are shown in chapter 3.2.
3.1.2. Top management effectiveness Management effectiveness and efficiency are terms that are not well defined
in theory and there is no consensus when it comes to methods and indicators used to measure them. At the same time it is crucial to measure both management effectiveness and management efficiency in order to be able to change the style of management and to eliminate unsuccessful and inefficient management in time. The consequences that inefficient and ineffective management can cause to a company are very broad and it may be concluded that the future and sustainability of each company depends on the effectiveness and efficiency of its management. In their research focused on determining factors that affect top management effectiveness Forgie and DeRosa (2010) identified the following as key factors for achieving top management’s effectiveness: trust that managers build, being action-oriented, building teams, applyingcritical and analytical thinking, having highly specific competencies associated with each activity and successful execution of plans and initiatives
As Drucker (1988) says – neither the quantity of output nor the quality of
organizational structure represent the basis for measuring management’s contribution to corporate development. Only market position, innovations, development of people and the quality of financial results can represent this measure and are important for the corporate survival and development. Efficient manager is reactive and he is focused on correcting mistakes and errors, while effective manager is proactive and focused on creativity. While efficient manager does the things in the right way, the effective manager does the right things.

Management, Vol. 20, 2015, Special issue, pp. 89-131. M. Glamuzina: Levels of leadership development and top management's effectiveness…
99
In this paper, effectiveness of top management will be measured through the achievement of its core objectives and the method used is going to be Balanced Scorecard (BSC), since it is a method based on both qualitative and quantitative aspects of the process. Previous studies conducted on this topic used financial indicators to measure top managements effectiveness, but in the last ten years the emphasis is put on qualitative measurement of effectiveness. Since the view of effectiveness changed and it is shifted from meeting the needs of shareholders into meeting the needs of all stakeholders, the methods used to measure it must change as well and include more than just financial indicators. BSC, as a method, was already used in order to measure top management’s effectiveness in the researchers conducted by Epstein and Roy (2004) and Northcott and Smith (2011).
In order to measure top management effectiveness in this research a model
was created based on the original BSC Kaplan and Norton model from 1992 (financial perspective, customers perspective, internal process perspective and learning and growth perspective) but additionally expanded with a fifth perspective – the perspective of corporate social responsibility. This newly created model complements the financial indicators with measuring operational satisfaction of customer’s needs, measuring internal processes, organizational innovations and learning, and measuring corporate social responsibility since they all influence future performance.
One of the main objectives for every modern company is creating wealth for
future stakeholders in a responsible way following the postulates “be ethical, be responsible and be profitable” (Tipurić, 2008, 31). This is getting a new meaning through the activities of corporate top management in the modern world and because of this the introduction of the fifth perspective – corporate social responsibility (CSR) is a prerequisite for creating better toolsor measuring top management effectiveness in a modern company.
3.1.3. Conceptual framework and research model The main objective of this research is to identify the relationship between
levels of leadership development and answer the following research questions:
Does leadership development influence top management’s effectiveness positively?
Can it be proved that the companies with better developed leadership process have a more effective top management, when compared to those with undeveloped leadership?
Management, Vol. 20, 2015, Special issue, pp. 89-131. M. Glamuzina: Levels of leadership development and top management's effectiveness…
100
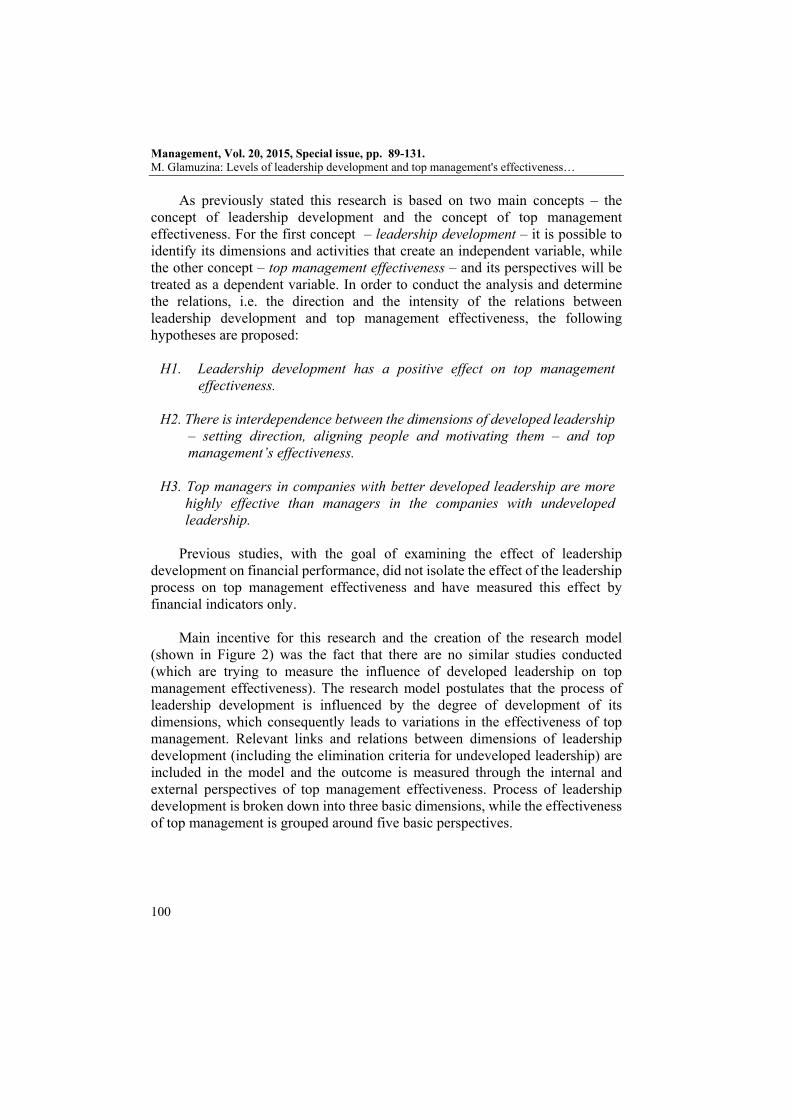
As previously stated this research is based on two main concepts – the concept of leadership development and the concept of top management effectiveness. For the first concept – leadership development – it is possible to identify its dimensions and activities that create an independent variable, while the other concept – top management effectiveness – and its perspectives will be treated as a dependent variable. In order to conduct the analysis and determine the relations, i.e. the direction and the intensity of the relations between leadership development and top management effectiveness, the following hypotheses are proposed:
H1. Leadership development has a positive effect on top management
effectiveness.
H2. There is interdependence between the dimensions of developed leadership – setting direction, aligning people and motivating them – and top management’s effectiveness.
H3. Top managers in companies with better developed leadership are more
highly effective than managers in the companies with undeveloped leadership.
Previous studies, with the goal of examining the effect of leadership
development on financial performance, did not isolate the effect of the leadership process on top management effectiveness and have measured this effect by financial indicators only.
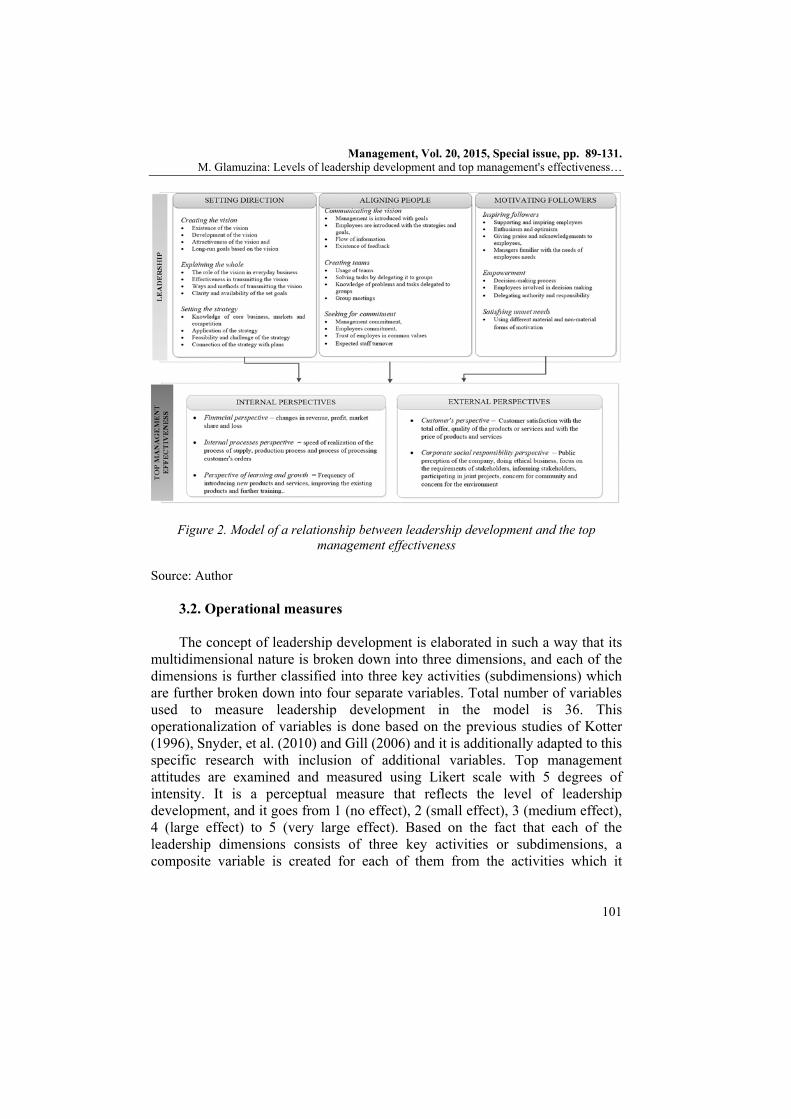
Main incentive for this research and the creation of the research model
(shown in Figure 2) was the fact that there are no similar studies conducted (which are trying to measure the influence of developed leadership on top management effectiveness). The research model postulates that the process of leadership development is influenced by the degree of development of its dimensions, which consequently leads to variations in the effectiveness of top management. Relevant links and relations between dimensions of leadership development (including the elimination criteria for undeveloped leadership) are included in the model and the outcome is measured through the internal and external perspectives of top management effectiveness. Process of leadership development is broken down into three basic dimensions, while the effectiveness of top management is grouped around five basic perspectives.
Management, Vol. 20, 2015, Special issue, pp. 89-131. M. Glamuzina: Levels of leadership development and top management's effectiveness…
101
Figure 2. Model of a relationship between leadership development and the top management effectiveness
Source: Author
3.2. Operational measures The concept of leadership development is elaborated in such a way that its
multidimensional nature is broken down into three dimensions, and each of the dimensions is further classified into three key activities (subdimensions) which are further broken down into four separate variables. Total number of variables used to measure leadership development in the model is 36. This operationalization of variables is done based on the previous studies of Kotter (1996), Snyder, et al. (2010) and Gill (2006) and it is additionally adapted to this specific research with inclusion of additional variables. Top management attitudes are examined and measured using Likert scale with 5 degrees of intensity. It is a perceptual measure that reflects the level of leadership development, and it goes from 1 (no effect), 2 (small effect), 3 (medium effect), 4 (large effect) to 5 (very large effect). Based on the fact that each of the leadership dimensions consists of three key activities or subdimensions, a composite variable is created for each of them from the activities which it

Management, Vol. 20, 2015, Special issue, pp. 89-131. M. Glamuzina: Levels of leadership development and top management's effectiveness…
102
includes and then a composite variable is created for each dimension of leadership development – setting direction, aligning people and motivating them.
After quantification of leadership development is done for each of the
leadership dimensions (RDV1-3), and with the purpose of further operationalization of leadership – leadership development index was constructed (IRVi), as a composite measure that consists of the three key dimensions of leadership. Creation of the index (IRVi) and calculations can be showed with the following formula:
,
where i=1,2,3.... n, and n is the total number of perceptions, RDV1 represents composite variable setting direction (the first part of leadership development index), RDV2 represents the composite variable aligning people (the second part of leadership development index) and RDV3 represent the composite variable motivating the subordinates (the third part of leadership development index).
Calculation of the composite variables RDVi1-3 is done based on the
following formulas:
∑ ∑ ∑
∑ ∑ ∑
∑ ∑ ∑,
where:
i= 1,2,3...n, and n is the total number of perceptions;
RDV1i represents composite variable created for the dimension setting direction, where aij, bik, cif represent variables from the three subdimensions of the dimension setting direction (creating vision, explaining the whole, setting the strategy);

Management, Vol. 20, 2015, Special issue, pp. 89-131. M. Glamuzina: Levels of leadership development and top management's effectiveness…
103
DV2i represents composite variable created for the dimension aligning people, where dij, eik, gif represent variables from the three subdimensions of the dimension aligning people (communicating the vision, building teams and seeking commitment);
RDV3i represents composite variable created for the dimension motivating the followers, where hij, lik, sif represent variables from the three subdimensions of the dimension motivating the followers (inspiring subordinates, empowerment and satisfying unsatisfied needs);
m, p, r represent the total number of variables in each of the subdimensions ( m,p,r = 1,2,3,4).
Leadership development index (IRVi) can achieve values between 1,00
(minimum value) and 5,00 (maximum value). After the companies with undeveloped leadership are eliminated using the elimination criteria and additional elimination criteria, IRVi is calculated in order to create levels of leadership development for the companies from the rest of the sample.
Emerging leadership is the level of leadership where the composite variable
– the index IRVi has the values below 3,00. Poorly developed leadership is the level of leadership identified in the companies where the index IRVi has the value between 3,00 and 3,50. Medium developed leadership is the one for which the index IRVi has values between 3,50 and 4,00 while well developed leadership has the values of the index above 4,00. In other words, undeveloped leadership and the four levels of developed leadership (1. emerging leadership, 2. poorly developed leadership, 3. medium developed leadership and 4.well developed leadership) can be shown in the one-dimensional continuum of leadership, as shown in Figure 3.
Figure 3. One-dimensional continuum of leadership Source: Author

Management, Vol. 20, 2015, Special issue, pp. 89-131. M. Glamuzina: Levels of leadership development and top management's effectiveness…
104
Top management effectiveness, as demonstrated by Figure 2, is represented and measured by five internal and external perspectives. With the objective of offering the most realistic Figure of business performance and measuring top management effectiveness by including both the effects of activities conducted in the past and the future effects of activities that are currently active – each of the five perspectives in the model is operationalized with variables which best present the perspective.
The calculation of the top management effectiveness in the model is based
on the stakeholder approach which is significantly different from the one used in the researchers conducted so far, which included only financial indicators of a business. Each of the five perspectives of effectiveness is broken down into a number of variables giving a total of 20 variables in the model – ten for internal and ten for external perspective of effectiveness.
3.3. Survey and data sources Empirical research was conducted on the population of all large and medium
sized companies on the territory of the Republic of Bosnia and Herzegovina (BiH). Medium sized companies are those with 50 and more employees, level of income between 2 and 8 million KM (stands for the Bosnian and Herzegovinian currency (konvertibilna marka), and assets value between 2 and 4 million KM. Large scale companies are those with 250 and more employees, level of income larger than 8 million KM and assets value higher than 4 million KM.
All non-profit organizations, schools, kindergartens, universities, hospitals
and social organizations were excluded from the sample because of the differences in the objectives set for their management. Companies that are in the process of liquidation and bankruptcy are also not taken into consideration. The main sample contains a total of 1342 companies of which 210 are large and 1132 medium-sized businesses.
Empirical research was conducted on a sample of 300 medium sized and
large-scale companies from BiH. The research included 54 large scale companies and 246 medium sized companies and it was conducted in the period from April 2013 until June 2013. The survey was conducted and data collected using the Internet tool Survey Monkey and then exported to Excel. The total number of submitted questionnaires is 106, which is 35.33% of the sample and is considered to be a very good rate of return. The research sample covered 7.90% of the total size of the basic population (1342 companies).

Management, Vol. 20, 2015, Special issue, pp. 89-131. M. Glamuzina: Levels of leadership development and top management's effectiveness…
105
3.4. Research instrument and data analysis The research was conducted using a close-question questionnaire. Since
leadership development and interdependence of its dimensions and top management effectiveness wasn’t previously researched, there were no other already available instruments (previously created questionnaires) and methods. Therefore, a special questionnaire was created exclusively for the purpose of this research. It consists of 49 questions divided into three parts.
The first part of the questionnaire contains 8 questions and refers to general
information about the companies that make up the sample of the research (name, address, year of establishment, core activity etc.). The second part of the questionnaire contains 36 questions focused on leadership and its dimensions - setting the direction, aligning people and motivating followers. These measure the independent variable of the research. This part of the research is constructed in such a way to clarify the distinction between undeveloped and developed leadership. The third part of the questionnaire contains 20 questions focused on effectiveness of top management – both internal and external perspective, and these measure the dependent variable of the research.
Since the variables of leadership development (36 variables) and top
management effectiveness (20 variables) are the result of a larger number of statements, reliability of the measurement scales is analyzed using the Cronbach Alpha coefficient. The collected data were analyzed on a personal computer using the software package for Microsoft Excel spreadsheets, and using the software program package for statistical data processing SPSS 20.0 for Windows.
3.5. General characteristics of the research sample The sample consists of 106 companies: 22 large-scale companies (10.48%
of companies from the basic sample) and 84 medium-sized companies (7.42% companies from the basic sample). This means that the research studied every tenth large-sized company and every fourteenth medium-sized company, or in average every thirteenth company operating in the Republic of Bosnia and Herzegovina. This confirms the representativeness of the sample used for the research.
The majority of the sample companies were established between 1991 and
2000 (53.8%), which means that in average they are 12 to 21 years old. Average number of employees is 242,69 per company and the main legal form of organizing is a limited liability company (84.0%), and every sixth company in

Management, Vol. 20, 2015, Special issue, pp. 89-131. M. Glamuzina: Levels of leadership development and top management's effectiveness…
106
the sample is a joint stock company. Most of the companies are privately owned (86.7%), 11.4% is in mixed ownership, while only 1.9% is publicly owned. Every third manager and every seventh employee are shareholders.
4. RESEARCH RESULTS 4.1. Dimensions of leadership development Leadership development analysis starts with the classification of companies
into those with undeveloped leadership and those with a particular level of developed leadership, all based on the criteria described in section 3.1.
After applying the automatic discriminatory criteria for undeveloped
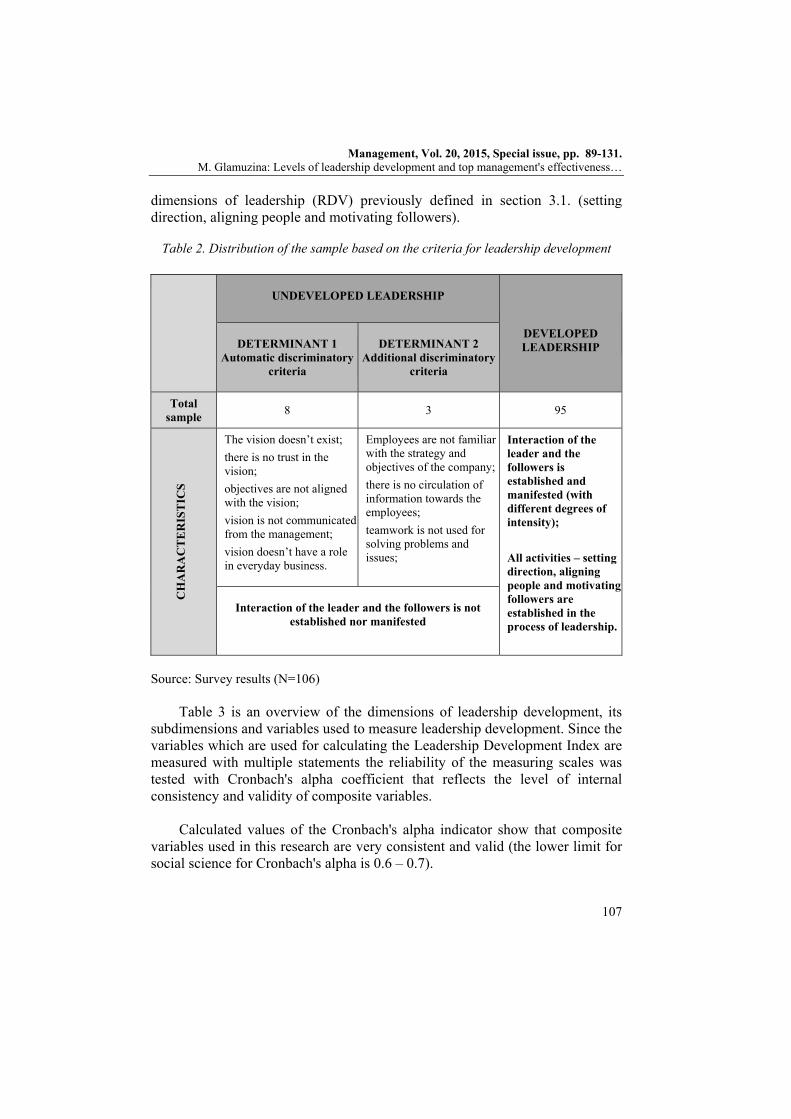
leadership, eight companies were identified as such. After applying the additional discriminatory criteria, additional three companies were added to the group. This means that the whole sample consisted of 11 companies with undeveloped leadership (10.38%) and 95 companies with somewhat developed leadership (89.62%). Application of elimination criteria of leadership development is shown in Table 2.
Since one of the main objectives of leadership is creating the vision as a
realistic challenge, leadership which is unable to develop vision, create confidence in the vision, align the objectives of the company with the vision, transfer the vision through the hierarchy, introduce the objectives that should be fulfilled and use teams to solve problems is considered to be undeveloped leadership.
The facts that the vision doesn’t exist (4), that there is no trust in the vision
(4), that there is no alignment between the long-term objectives and the vision (3), that the vision is not important for everyday business (2), the vision is not communicated from the management (2), employees are not familiar with the strategy and objectives (5), the information are not being transferred to employees (3) and teams are not used for solving problems (4) represent automatic and additional discriminatory criteria which confirm that the leadership in the 11 companies from the sample is not successful in directing the actions of employees toward achieving company goals.
After the above classification has been completed the levels of developed
leadership are identified through the construction and creation of the Leadership Development Index (IRV) which is composite indicator created out of the three
Management, Vol. 20, 2015, Special issue, pp. 89-131. M. Glamuzina: Levels of leadership development and top management's effectiveness…
107
dimensions of leadership (RDV) previously defined in section 3.1. (setting direction, aligning people and motivating followers).
Table 2. Distribution of the sample based on the criteria for leadership development
UNDEVELOPED LEADERSHIP
DEVELOPED LEADERSHIP DETERMINANT 1
Automatic discriminatory criteria
DETERMINANT 2
Additional discriminatory criteria
Total sample
8 3 95
CH
AR
AC
TE
RIS
TIC
S
The vision doesn’t exist;
there is no trust in the vision;
objectives are not aligned with the vision;
vision is not communicated from the management;
vision doesn’t have a role in everyday business.
Employees are not familiar with the strategy and objectives of the company;
there is no circulation of information towards the employees;
teamwork is not used for solving problems and issues;
Interaction of the leader and the followers is established and manifested (with different degrees of intensity);
All activities – setting direction, aligning people and motivating followers are established in the process of leadership.
Interaction of the leader and the followers is not
established nor manifested
Source: Survey results (N=106)
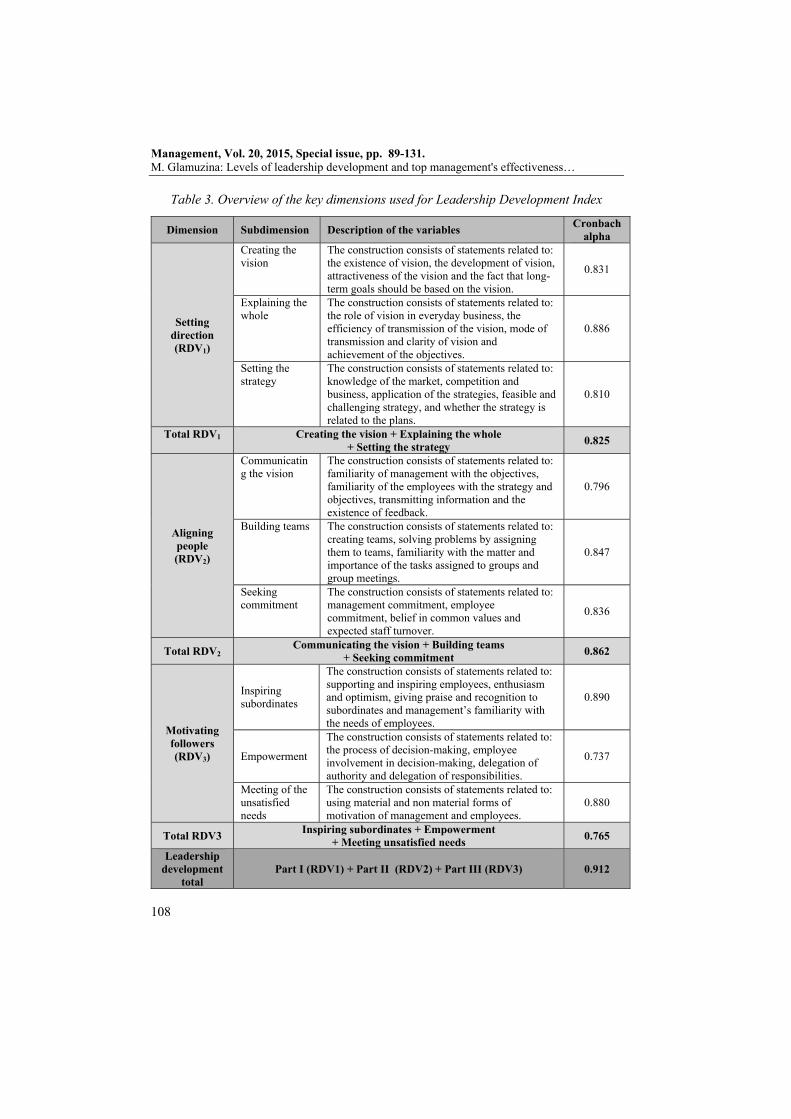
Table 3 is an overview of the dimensions of leadership development, its
subdimensions and variables used to measure leadership development. Since the variables which are used for calculating the Leadership Development Index are measured with multiple statements the reliability of the measuring scales was tested with Cronbach's alpha coefficient that reflects the level of internal consistency and validity of composite variables.
Calculated values of the Cronbach's alpha indicator show that composite
variables used in this research are very consistent and valid (the lower limit for social science for Cronbach's alpha is 0.6 – 0.7).
Management, Vol. 20, 2015, Special issue, pp. 89-131. M. Glamuzina: Levels of leadership development and top management's effectiveness…
108
Table 3. Overview of the key dimensions used for Leadership Development Index
Dimension Subdimension Description of the variables Cronbach
alpha
Setting direction (RDV1)
Creating the vision
The construction consists of statements related to: the existence of vision, the development of vision, attractiveness of the vision and the fact that long-term goals should be based on the vision.
0.831
Explaining the whole
The construction consists of statements related to: the role of vision in everyday business, the efficiency of transmission of the vision, mode of transmission and clarity of vision and achievement of the objectives.
0.886
Setting the strategy
The construction consists of statements related to: knowledge of the market, competition and business, application of the strategies, feasible and challenging strategy, and whether the strategy is related to the plans.
0.810
Total RDV1 Creating the vision + Explaining the whole + Setting the strategy
0.825
Aligning people (RDV2)
Communicating the vision
The construction consists of statements related to: familiarity of management with the objectives, familiarity of the employees with the strategy and objectives, transmitting information and the existence of feedback.
0.796
Building teams The construction consists of statements related to: creating teams, solving problems by assigning them to teams, familiarity with the matter and importance of the tasks assigned to groups and group meetings.
0.847
Seeking commitment
The construction consists of statements related to: management commitment, employee commitment, belief in common values and expected staff turnover.
0.836
Total RDV2 Communicating the vision + Building teams
+ Seeking commitment 0.862
Motivating followers (RDV3)
Inspiring subordinates
The construction consists of statements related to: supporting and inspiring employees, enthusiasm and optimism, giving praise and recognition to subordinates and management’s familiarity with the needs of employees.
0.890
Empowerment
The construction consists of statements related to: the process of decision-making, employee involvement in decision-making, delegation of authority and delegation of responsibilities.
0.737
Meeting of the unsatisfied needs
The construction consists of statements related to: using material and non material forms of motivation of management and employees.
0.880
Total RDV3 Inspiring subordinates + Empowerment
+ Meeting unsatisfied needs 0.765
Leadership development
total Part I (RDV1) + Part II (RDV2) + Part III (RDV3) 0.912
Management, Vol. 20, 2015, Special issue, pp. 89-131. M. Glamuzina: Levels of leadership development and top management's effectiveness…
109
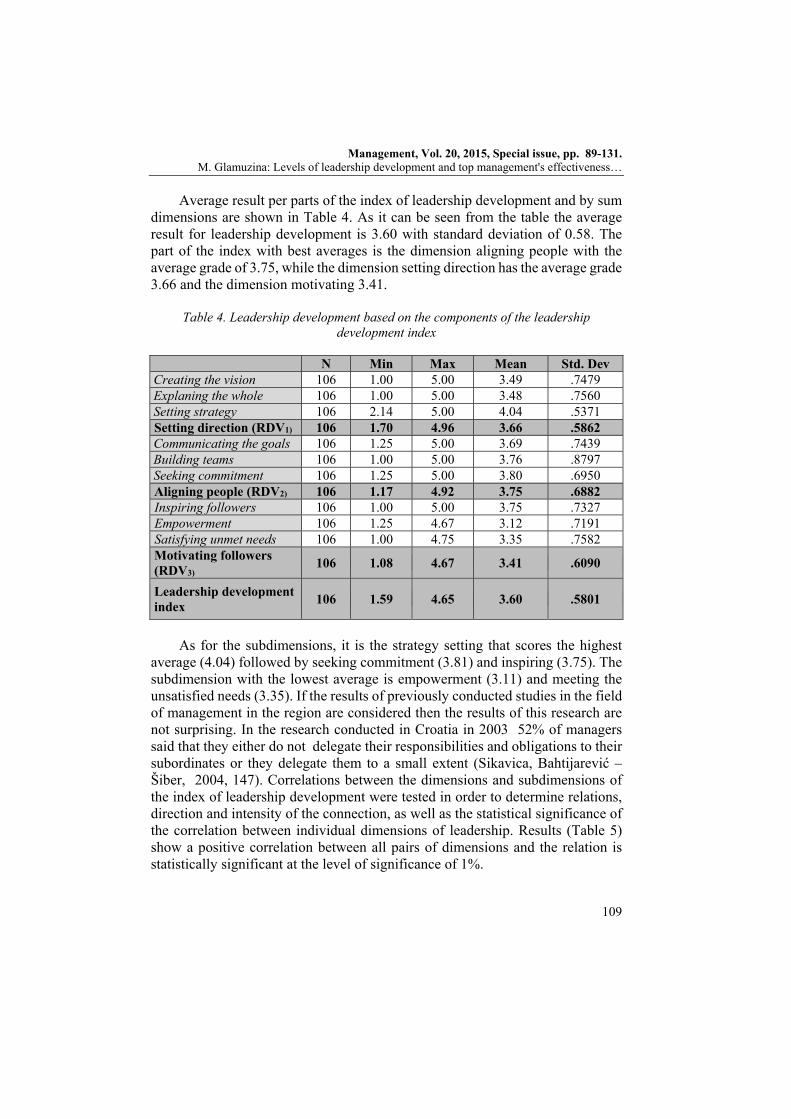
Average result per parts of the index of leadership development and by sum dimensions are shown in Table 4. As it can be seen from the table the average result for leadership development is 3.60 with standard deviation of 0.58. The part of the index with best averages is the dimension aligning people with the average grade of 3.75, while the dimension setting direction has the average grade 3.66 and the dimension motivating 3.41.
Table 4. Leadership development based on the components of the leadership development index
N Min Max Mean Std. Dev Creating the vision 106 1.00 5.00 3.49 .7479 Explaning the whole 106 1.00 5.00 3.48 .7560 Setting strategy 106 2.14 5.00 4.04 .5371 Setting direction (RDV1) 106 1.70 4.96 3.66 .5862 Communicating the goals 106 1.25 5.00 3.69 .7439 Building teams 106 1.00 5.00 3.76 .8797 Seeking commitment 106 1.25 5.00 3.80 .6950 Aligning people (RDV2) 106 1.17 4.92 3.75 .6882 Inspiring followers 106 1.00 5.00 3.75 .7327 Empowerment 106 1.25 4.67 3.12 .7191 Satisfying unmet needs 106 1.00 4.75 3.35 .7582 Motivating followers (RDV3)
106 1.08 4.67 3.41 .6090
Leadership development index
106 1.59 4.65 3.60 .5801
As for the subdimensions, it is the strategy setting that scores the highest
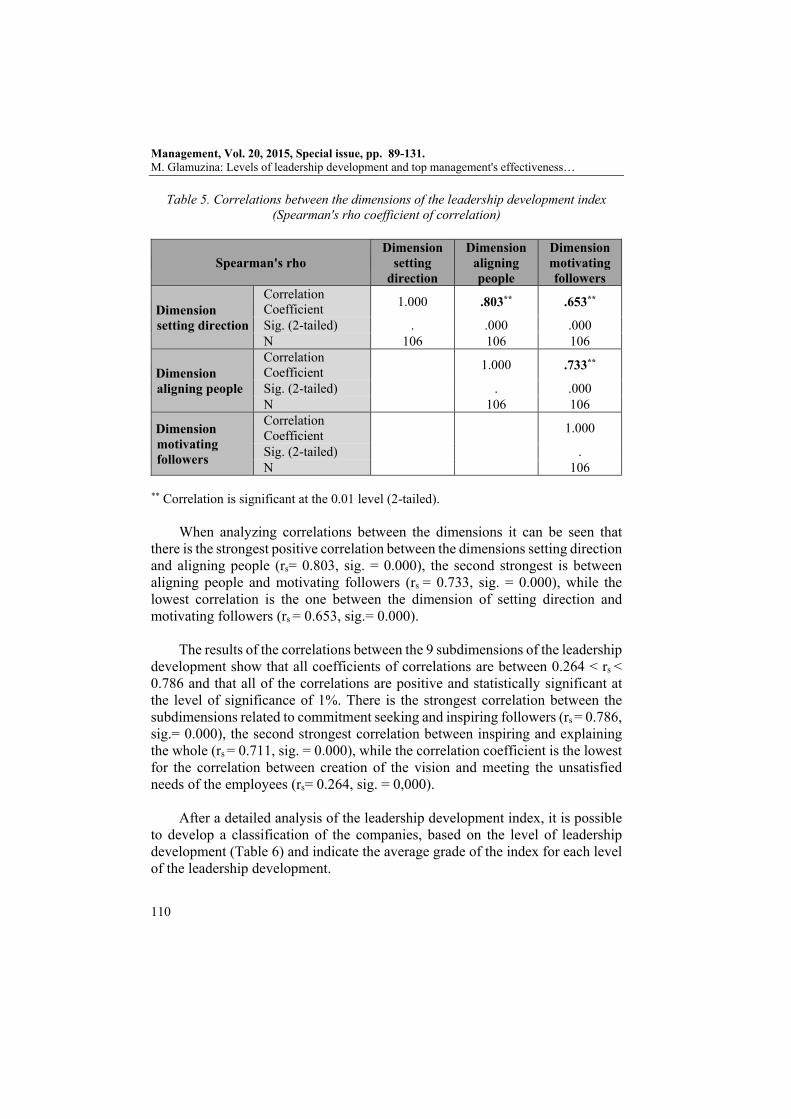
average (4.04) followed by seeking commitment (3.81) and inspiring (3.75). The subdimension with the lowest average is empowerment (3.11) and meeting the unsatisfied needs (3.35). If the results of previously conducted studies in the field of management in the region are considered then the results of this research are not surprising. In the research conducted in Croatia in 2003 52% of managers said that they either do not delegate their responsibilities and obligations to their subordinates or they delegate them to a small extent (Sikavica, Bahtijarević – Šiber, 2004, 147). Correlations between the dimensions and subdimensions of the index of leadership development were tested in order to determine relations, direction and intensity of the connection, as well as the statistical significance of the correlation between individual dimensions of leadership. Results (Table 5) show a positive correlation between all pairs of dimensions and the relation is statistically significant at the level of significance of 1%.
Management, Vol. 20, 2015, Special issue, pp. 89-131. M. Glamuzina: Levels of leadership development and top management's effectiveness…
110
Table 5. Correlations between the dimensions of the leadership development index (Spearman's rho coefficient of correlation)
Spearman's rho Dimension
setting direction
Dimension aligning people
Dimension motivating followers
Dimension setting direction
Correlation Coefficient
1.000 .803** .653**
Sig. (2-tailed) . .000 .000 N 106 106 106
Dimension aligning people
Correlation Coefficient
1.000 .733**
Sig. (2-tailed) . .000 N 106 106
Dimension motivating followers
Correlation Coefficient
1.000
Sig. (2-tailed) . N 106
** Correlation is significant at the 0.01 level (2-tailed).
When analyzing correlations between the dimensions it can be seen that there is the strongest positive correlation between the dimensions setting direction and aligning people (rs= 0.803, sig. = 0.000), the second strongest is between aligning people and motivating followers (rs = 0.733, sig. = 0.000), while the lowest correlation is the one between the dimension of setting direction and motivating followers (rs = 0.653, sig.= 0.000).
The results of the correlations between the 9 subdimensions of the leadership development show that all coefficients of correlations are between 0.264 < rs < 0.786 and that all of the correlations are positive and statistically significant at the level of significance of 1%. There is the strongest correlation between the subdimensions related to commitment seeking and inspiring followers (rs = 0.786, sig.= 0.000), the second strongest correlation between inspiring and explaining the whole (rs = 0.711, sig. = 0.000), while the correlation coefficient is the lowest for the correlation between creation of the vision and meeting the unsatisfied needs of the employees (rs= 0.264, sig. = 0,000).
After a detailed analysis of the leadership development index, it is possible
to develop a classification of the companies, based on the level of leadership development (Table 6) and indicate the average grade of the index for each level of the leadership development.
Management, Vol. 20, 2015, Special issue, pp. 89-131. M. Glamuzina: Levels of leadership development and top management's effectiveness…
111
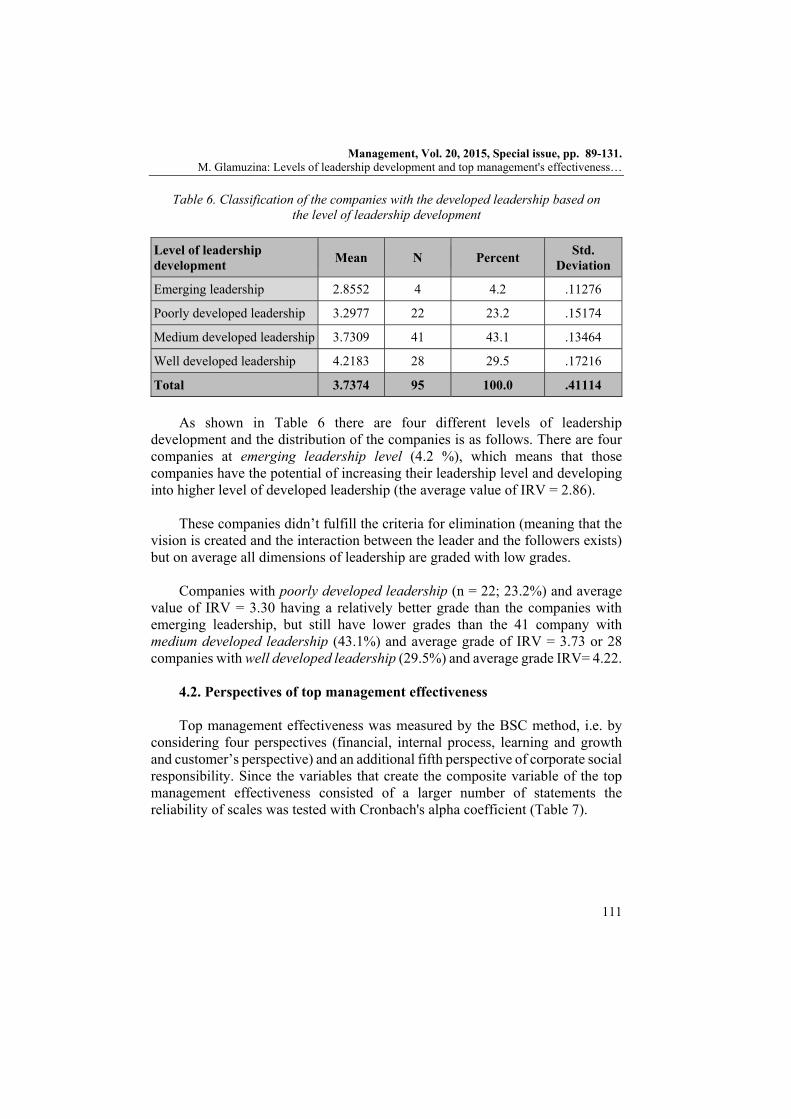
Table 6. Classification of the companies with the developed leadership based on the level of leadership development
Level of leadership development
Mean N Percent Std.
Deviation
Emerging leadership 2.8552 4 4.2 .11276
Poorly developed leadership 3.2977 22 23.2 .15174
Medium developed leadership 3.7309 41 43.1 .13464
Well developed leadership 4.2183 28 29.5 .17216
Total 3.7374 95 100.0 .41114
As shown in Table 6 there are four different levels of leadership
development and the distribution of the companies is as follows. There are four companies at emerging leadership level (4.2 %), which means that those companies have the potential of increasing their leadership level and developing into higher level of developed leadership (the average value of IRV = 2.86).
These companies didn’t fulfill the criteria for elimination (meaning that the
vision is created and the interaction between the leader and the followers exists) but on average all dimensions of leadership are graded with low grades.
Companies with poorly developed leadership (n = 22; 23.2%) and average
value of IRV = 3.30 having a relatively better grade than the companies with emerging leadership, but still have lower grades than the 41 company with medium developed leadership (43.1%) and average grade of IRV = 3.73 or 28 companies with well developed leadership (29.5%) and average grade IRV= 4.22.
4.2. Perspectives of top management effectiveness Top management effectiveness was measured by the BSC method, i.e. by
considering four perspectives (financial, internal process, learning and growth and customer’s perspective) and an additional fifth perspective of corporate social responsibility. Since the variables that create the composite variable of the top management effectiveness consisted of a larger number of statements the reliability of scales was tested with Cronbach's alpha coefficient (Table 7).

Management, Vol. 20, 2015, Special issue, pp. 89-131. M. Glamuzina: Levels of leadership development and top management's effectiveness…
112
Table 7. The overview of the key perspectives of top management effectiveness
Perspective Description of variables Cronbach
alpha Financial perspective
The construction consists of statements related to changes in: income, profit, market share and loss.
0.809
Internal processes perspective
The construction consists of statements related to the speed of implementation of: supply process, manufacturing process and processing clients’ orders.
0.832
Learning/ growth perspective
The construction consists of statements related to frequency of: introducing new products and services, improvements in existing products and services and additional training given to employees.
0.657
Total internal perspectives
Financial perspective + Internal processes perspective + Learning/ growth perspective 0.702
Customers’ perspective
The construction consists of statements related to: the customer satisfaction with the quality, customer satisfaction with the price and customer satisfaction with the complete product portfolio.
0.791
Corporate social responsibility (CSR) perspective
The construction consists of statements related to: the public perception of the company, ethical business behavior, focus on the requirements and needs of stakeholders, providing information to stakeholders, participating in joint projects, and concern for the community and for environmental protection.
0.872
Total external perspectives
Customers’ perspective + CSR perspective 0.767
Total top management effectiveness
Internal perspectives + External perspectives 0.854
Values of Cronbach's alpha show a high consistency of composite variables
and alignment in creating and measuring top management effectiveness. The summary of the results of the top management effectiveness is given in
Table 8, where descriptive analysis of all internal and external perspectives is provided.
Management, Vol. 20, 2015, Special issue, pp. 89-131. M. Glamuzina: Levels of leadership development and top management's effectiveness…
113
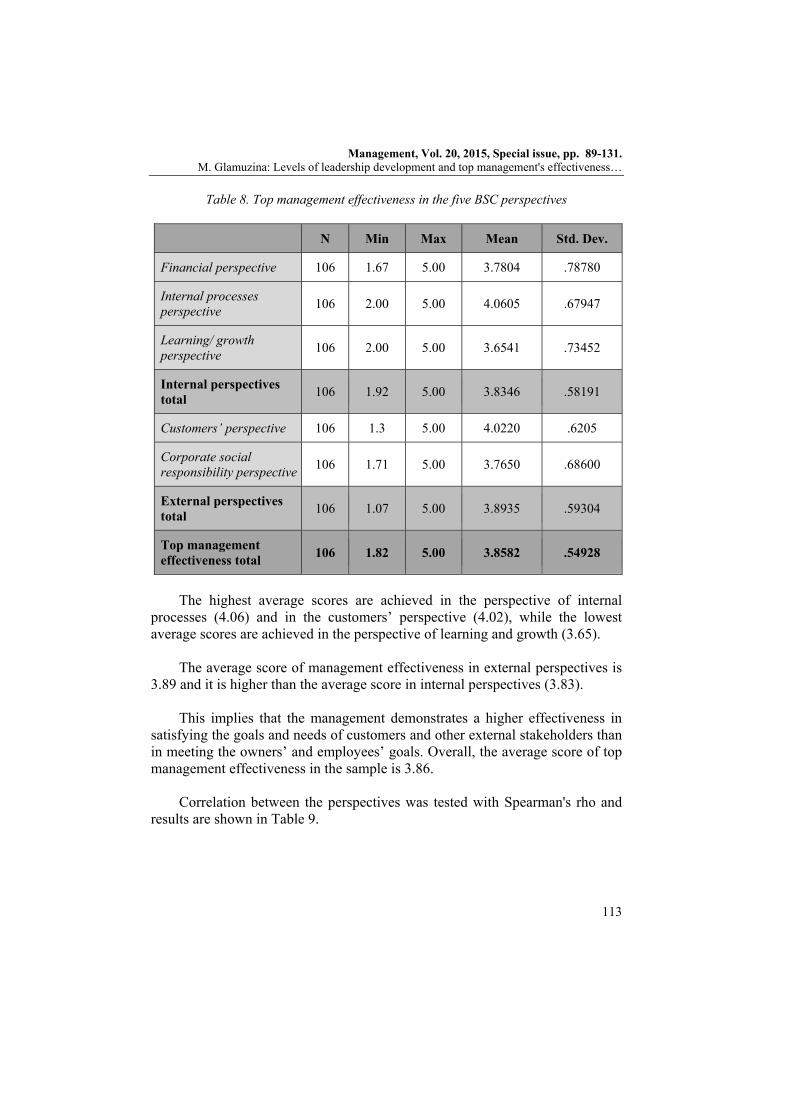
Table 8. Top management effectiveness in the five BSC perspectives
N Min Max Mean Std. Dev.
Financial perspective 106 1.67 5.00 3.7804 .78780
Internal processes perspective
106 2.00 5.00 4.0605 .67947
Learning/ growth perspective
106 2.00 5.00 3.6541 .73452
Internal perspectives total
106 1.92 5.00 3.8346 .58191
Customers’ perspective 106 1.3 5.00 4.0220 .6205
Corporate social responsibility perspective
106 1.71 5.00 3.7650 .68600
External perspectives total
106 1.07 5.00 3.8935 .59304
Top management effectiveness total
106 1.82 5.00 3.8582 .54928
The highest average scores are achieved in the perspective of internal
processes (4.06) and in the customers’ perspective (4.02), while the lowest average scores are achieved in the perspective of learning and growth (3.65).
The average score of management effectiveness in external perspectives is
3.89 and it is higher than the average score in internal perspectives (3.83). This implies that the management demonstrates a higher effectiveness in
satisfying the goals and needs of customers and other external stakeholders than in meeting the owners’ and employees’ goals. Overall, the average score of top management effectiveness in the sample is 3.86.
Correlation between the perspectives was tested with Spearman's rho and
results are shown in Table 9.

Management, Vol. 20, 2015, Special issue, pp. 89-131. M. Glamuzina: Levels of leadership development and top management's effectiveness…
114
Table 9. Correlation between the five perspectives of top management effectiveness
I II III IV V
Financial perspective (I)
Correlation Coefficient
1.000 .478** .472** .438** .417**
Sig. (2-tailed) . .000 .000 .000 .000
N 106 106 106 106 106
Internal processes perspective (II)
Correlation Coefficient
.478** 1.000 .573** .456** .476**
Sig. (2-tailed) .000 . .000 .000 .000
N 106 106 106 106 106
Customers perspective (III)
Correlation Coefficient
.472** .573** 1.000 .569** .567**
Sig. (2-tailed) .000 .000 . .000 .000
N 106 106 106 106 106
Learning/ growth perspective (IV)
Correlation Coefficient
.438** .456** .569** 1.000 .627**
Sig. (2-tailed) .000 .000 .000 . .000
N 106 106 106 106 106
Corporate social responsibility (CSR) perspective (V)
Correlation Coefficient
.417** .476** .567** .627** 1.000
Sig. (2-tailed) .000 .000 .000 .000 .
N 106 106 106 106 106
** Correlation is significant at the 0.01 level (2-tailed).
Table 9 shows that there are positive correlations between all perspectives of top management effectiveness. Coefficient of correlation is between 0.417<rs<0.627 which represents medium to strong positive correlation and all of the correlations are statistically significant at the level of significance of 1%.
Strong correlation exists between the perspective of learning and growth and the perspective of corporate social responsibility (rs = 0.627, sig.= 0.000), while the lowest correlation is between the financial perspective and the perspective of corporate social responsibility (rs= 0.417, sig.=0.000). These results indicate that

Management, Vol. 20, 2015, Special issue, pp. 89-131. M. Glamuzina: Levels of leadership development and top management's effectiveness…
115
corporate social responsibility can be increased much more through training employees than through the increase of value from the financial perspective.
The analysis of the correlations of the perspectives of top management effectiveness has shown that there is a statistically significant positive correlation between all of the five perspectives of the management effectiveness.
4.3. Interdependence of leadership development levels and top
management's effectiveness Correlation analysis was conducted between leadership development and top
management effectiveness with the goal of determining the interdependence of leadership development and top management effectiveness and checking whether there is a quantitative matching of variations between these two phenomena. As it can be seen in Table 10 the correlation analysis proved that there is a strong positive correlation (rs=0.639, sig.=0.000) between the variables and that the correlation is statistically significant at the level of significance of 1%. Such correlation means that if there is a progress in leadership development then there will be an increase in the effectiveness of top management.
Table 10. Interdependence of leadership development and top management effectiveness
Top management
effectiveness Leadership
development
Spearman's rho
Top management effectiveness
Correlation Coefficient
1.000 .639**
Sig. (1-tailed) . .000 N 106 106
Leadership development
Correlation Coefficient
.639** 1.000
Sig. (1-tailed) .000 . N 106 106
** Correlation is significant at the 0.01 level (1-tailed).
After the correlation was analyzed composite numerical variable of leadership development is converted into ordinal (dichotomous or categorical) variable with the goal of determining the differences in the level of leadership development and top management effectiveness. Based on the previously explained determinants of undeveloped leadership (and the given elimination criteria) companies are classified into those with developed leadership and those

Management, Vol. 20, 2015, Special issue, pp. 89-131. M. Glamuzina: Levels of leadership development and top management's effectiveness…
116
with undeveloped leadership. The first analysis was conducted between the companies with developed and undeveloped leadership in order to determine the level of difference of the top management effectiveness in these cases.
The tests for normality of distribution and equality of variances were
conducted to check if the data were suitable for conducting the t-test. Since both variables – leadership development (represented with a dichotomous variable) and top management effectiveness fulfilled the conditions (significance higher than 0.05 for Kolmogorov – Smirnov and Shapiro – Wilks test and valid Levene's test for equality of variances) the differences between the variables were tested with the t-test.
Table 11. Differences in top management effectiveness for the companies with developed and undeveloped leadership
Leadership development
N Mean Std. Deviation Std. Error
Mean
Top management effectiveness
Undeveloped leadership
11 3.0242 .61354 .18499
Developed leadership
95 3.9548 .45404 .04658
Levene's Test for Equality of
Variances t-test for Equality of Means
F Sig. t df Sig. (2-
tail.)
Mean Diff.
Std. Error Diff.
95% Confidence
Interval
Lower Upper
Top
man
agem
ent
effe
ctiv
enes
s
Equal variances assumed
1.545 .217 -6.194 104 .000 -.93052 .15024 -1.228 -.632
Equal variances not assumed
-4.878 11.304 .000 -.93052 .19076 -1.349 -.512
The t-test results (Table 11) show a statistically significant difference (t=-
6.194, sig.=0.000) at the level of significance of 1% between the top management effectiveness in the companies with developed leadership and those with undeveloped leadership, with the effect power of r= 0.53. This leads to the conclusion that the companies with developed leadership (mean=3.95, SE=0.05)

Management, Vol. 20, 2015, Special issue, pp. 89-131. M. Glamuzina: Levels of leadership development and top management's effectiveness…
117
having a much higher level of top management effectiveness than the companies with undeveloped leadership (mean= 3.02, SE=0.18).
If the results of all the tests are taken into account it is possible to conclude that there is a strong positive correlation between the companies with different levels of leadership development and top management effectiveness. Since there are a lot of companies with developed leadership (95 companies) there is a need for classification of these companies based on different levels of leadership development. Then tests need to be run in order to check whether there are significant differences among these companies in terms of interrelatedness of levels of leadership development and top management effectiveness. Developed leadership is classified, based on the values of leadership development index, into: 1. Emerging leadership, 2. Poorly developed leadership, 3. Medium developed leadership and 4. Well developed leadership.
The analysis of descriptive statistics (Table 12) shows that there is a
difference in the average value of top management effectiveness according to different levels of leadership development, but these difference have to be statistically tested in order to determine the level of significance.
Table 12. Top management effectiveness and the level of leadership development
Leadership development
Mean N Std. Deviation Minimum Maximum
1. Emerging leadership
3.2780 4 .31856 2.86 3.61
2. Poorly developed leadership
3.7433 22 .25121 3.28 4.32
3. Medium developed leadership
3.8949 41 .43502 3.14 4.77
4. Well developed leadership
4.3052 28 .37408 3.55 5.00
Total 3.9548 95 .45404 2.86 5.00
Univariate analysis of variance is a test conducted to determine the significance of the differences (Table 13).
Management, Vol. 20, 2015, Special issue, pp. 89-131. M. Glamuzina: Levels of leadership development and top management's effectiveness…
118
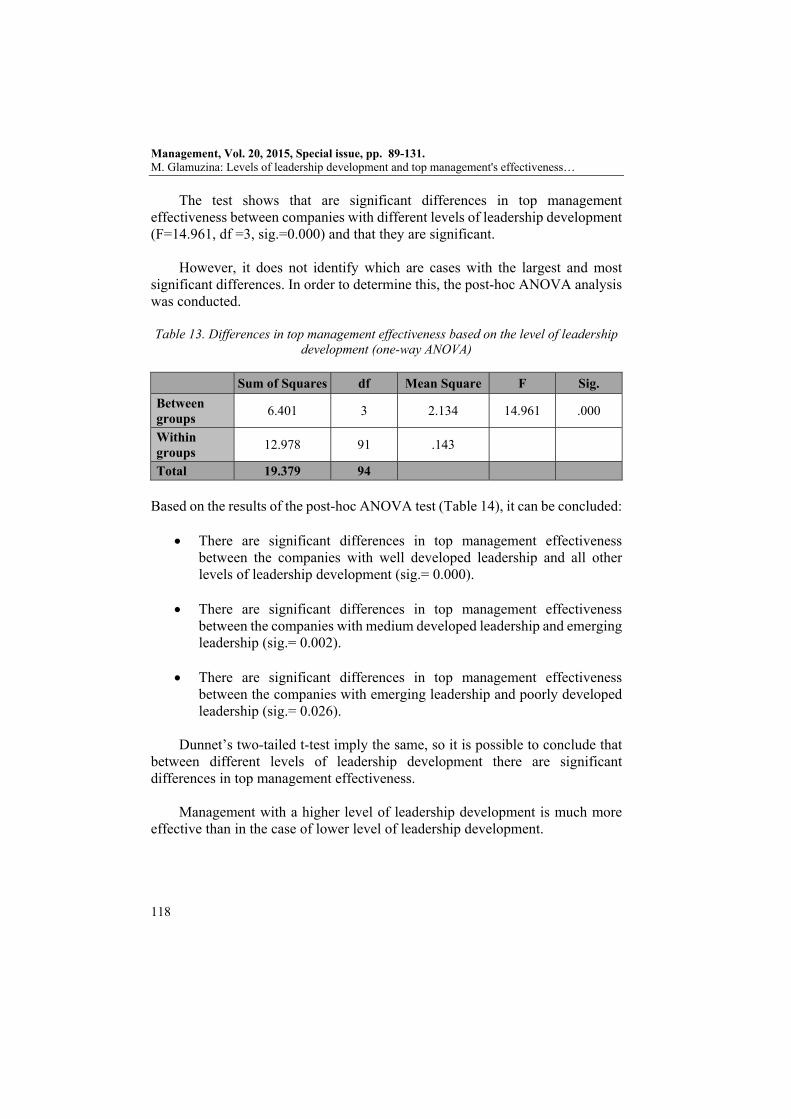
The test shows that are significant differences in top management effectiveness between companies with different levels of leadership development (F=14.961, df =3, sig.=0.000) and that they are significant.
However, it does not identify which are cases with the largest and most
significant differences. In order to determine this, the post-hoc ANOVA analysis was conducted.
Table 13. Differences in top management effectiveness based on the level of leadership
development (one-way ANOVA)
Sum of Squares df Mean Square F Sig.
Between groups
6.401 3 2.134 14.961 .000
Within groups
12.978 91 .143
Total 19.379 94
Based on the results of the post-hoc ANOVA test (Table 14), it can be concluded:
There are significant differences in top management effectiveness between the companies with well developed leadership and all other levels of leadership development (sig.= 0.000).
There are significant differences in top management effectiveness between the companies with medium developed leadership and emerging leadership (sig.= 0.002).
There are significant differences in top management effectiveness
between the companies with emerging leadership and poorly developed leadership (sig.= 0.026).
Dunnet’s two-tailed t-test imply the same, so it is possible to conclude that
between different levels of leadership development there are significant differences in top management effectiveness.
Management with a higher level of leadership development is much more
effective than in the case of lower level of leadership development.

Management, Vol. 20, 2015, Special issue, pp. 89-131. M. Glamuzina: Levels of leadership development and top management's effectiveness…
119
Table 14. Differences in top management effectiveness based on the level of leadership development (post hoc ANOVA test)
(I) Level of leadership
development
(J) Level of leadership
development
Mean Difference
(I-J)
Std. Error
Sig.
95% Confidence Interval
Lower Bound
Upper Bound
LSD
Emerging leadership
Poor -.46531* .20527 .026 -.8731 -.0576
Medium -.61697* .19782 .002 -1.0099 -.2240
High -1.02721* .20186 .000 -1.4282 -.6262
Poorly developed leadership
Poor .46531* .20527 .026 .0576 .8731
Medium -.15166 .09980 .132 -.3499 .0466
High -.56190* .10759 .000 -.7756 -.3482
Medium developed leadership
Poor .61697* .19782 .002 .2240 1.0099
Medium .15166 .09980 .132 -.0466 .3499
High -.41024* .09258 .000 -.5941 -.2263
Well developed leadership
Poor 1.02721* .20186 .000 .6262 1.4282
Medium .56190* .10759 .000 .3482 .7756
High .41024* .09258 .000 .2263 .5941
Dunnett t (2-tailed)b
Emerging leadership
Poor -1.02721* .20186 .000 -1.5135 -.5409
Poorly developed
Poor -.56190* .10759 .000 -.8211 -.3027
Medium developed
Poor -.41024* .09258 .000 -.6333 -.1872
* The mean difference is significant at the 0.05 level. b Dunnett t-tests treat one group as the control one and compare all other groups against
it.
It was interesting to check with which of the perspectives of top management effectiveness the leadership development correlated the most (Table 15).
Top management effectiveness is measured through five perspectives
grouped in two categories – internal perspectives of effectiveness (financial perspective, internal process perspective and growth/learning perspective) and external perspectives of effectiveness (consumers’ perspective and perspective of corporate social responsibility – CSR).

Management, Vol. 20, 2015, Special issue, pp. 89-131. M. Glamuzina: Levels of leadership development and top management's effectiveness…
120
Table 15. Correlation between leadership development and individual perspectives of top management effectiveness
Financial perspective
Internal processes
perspective
Consumers’perspective
Growth / learning persp.
CSR perspective
Sp
earm
an's
rho
Lea
der
ship
d
evel
opm
ent
Correlation coefficient
.344** .515** .556** .571** .620**
Sig. (1-tailed)
.000 .000 .000 .000 .000
N 106 106 106 106 106
** Correlation is significant at the 0.01 level (1-tailed).
As demonstrated by Table 15:
There is a statistically significant positive correlation of medium intensity (rs=0.344, sig.=0.000) between the financial perspective of top management effectiveness and the leadership development.
There is a statistically significant positive correlation of strong intensity between all other perspectives of effectiveness (internal processes perspective rs=0.515, sig.=0.000, customers perspectives rs=0.556, sig.=0.000, learning/growth perspective rs=0.571, sig.=0.000, and corporate social responsibility perspective rs=0.620, sig.=0.000) and the leadership development.
All correlations are statistically significant at the level of significance of
1%.
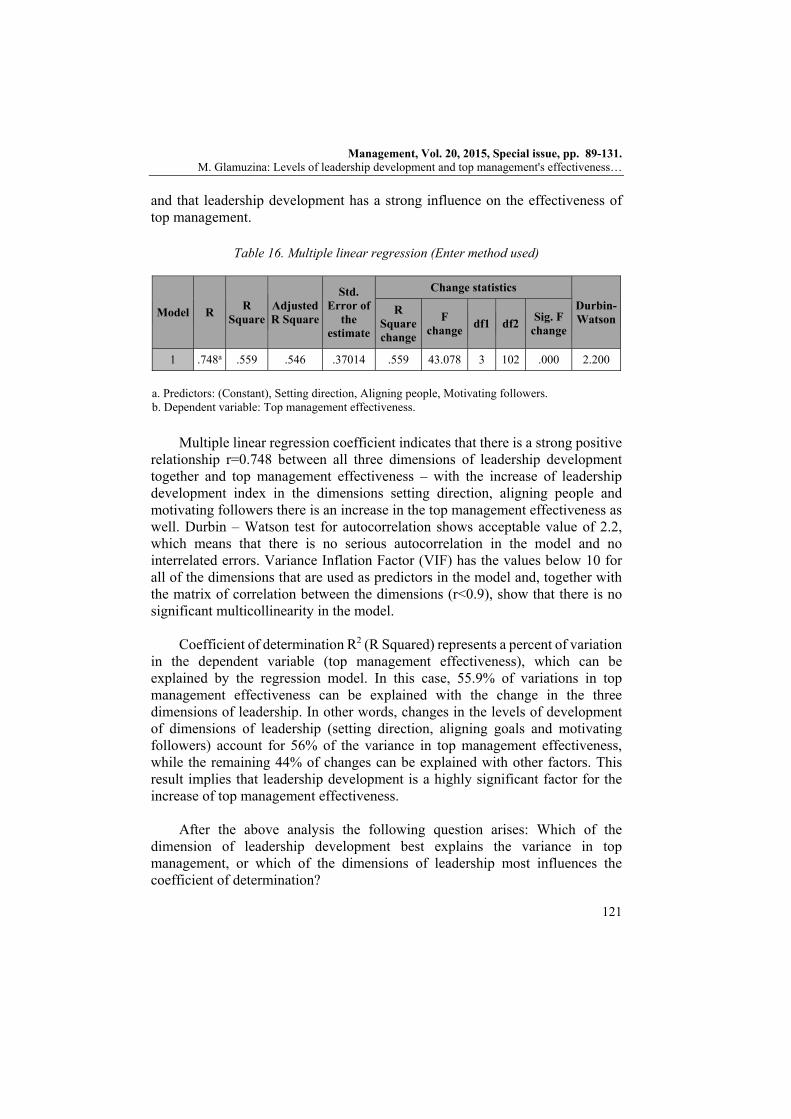
Multiple linear regression was conducted, in order to examine the causal link between the individual components of leadership development index (setting direction, motivating and aligning people) and top management effectiveness, with the goal of determining whether the listed variables are good predictors of the dependent variable top management effectiveness. The results of the multiple linear regression (Table 16) where all dimensions of leadership development are included and treated as predictors of top management effectiveness (Enter method), show that the model with all three dimensions of leadership development included (setting direction, aligning people and motivating followers) has a statistically significant power of prediction (r=0.748, sig.=0.000)
Management, Vol. 20, 2015, Special issue, pp. 89-131. M. Glamuzina: Levels of leadership development and top management's effectiveness…
121
and that leadership development has a strong influence on the effectiveness of top management.
Table 16. Multiple linear regression (Enter method used)
Model R R
Square Adjusted R Square
Std. Error of
the estimate
Change statistics
Durbin-Watson
R Square change
F change
df1 df2 Sig. F
change
1 .748a .559 .546 .37014 .559 43.078 3 102 .000 2.200
a. Predictors: (Constant), Setting direction, Aligning people, Motivating followers. b. Dependent variable: Top management effectiveness.
Multiple linear regression coefficient indicates that there is a strong positive
relationship r=0.748 between all three dimensions of leadership development together and top management effectiveness – with the increase of leadership development index in the dimensions setting direction, aligning people and motivating followers there is an increase in the top management effectiveness as well. Durbin – Watson test for autocorrelation shows acceptable value of 2.2, which means that there is no serious autocorrelation in the model and no interrelated errors. Variance Inflation Factor (VIF) has the values below 10 for all of the dimensions that are used as predictors in the model and, together with the matrix of correlation between the dimensions (r<0.9), show that there is no significant multicollinearity in the model.
Coefficient of determination R2 (R Squared) represents a percent of variation
in the dependent variable (top management effectiveness), which can be explained by the regression model. In this case, 55.9% of variations in top management effectiveness can be explained with the change in the three dimensions of leadership. In other words, changes in the levels of development of dimensions of leadership (setting direction, aligning goals and motivating followers) account for 56% of the variance in top management effectiveness, while the remaining 44% of changes can be explained with other factors. This result implies that leadership development is a highly significant factor for the increase of top management effectiveness.
After the above analysis the following question arises: Which of the
dimension of leadership development best explains the variance in top management, or which of the dimensions of leadership most influences the coefficient of determination?

Management, Vol. 20, 2015, Special issue, pp. 89-131. M. Glamuzina: Levels of leadership development and top management's effectiveness…
122
As to examine the change in the coefficient of determination based on separate predictors of top management effectiveness hierarchical multiple regression was conducted (Table 17).
Table 17. Hierarchical multiple linear regression
Model R R
Square Adjusted R Square
Std. Error of
the estimate
Change statistics
Durbin-Watson
R Square change
F change
df1 df2 Sig. F
change
1 .629a .396 .390 .42893 .396 68.184 1 104 .000
2 .703b .494 .484 .39461 .098 19.880 1 103 .000
3 .748c .559 .546 .37014 .065 15.071 1 102 .000 2.200
a. Predictors: (Constant), Setting direction. b. Predictors: (Constant), Setting direction, Aligning people. c. Predictors: (Constant), Setting direction, Aligning people, Motivating followers. d. Dependent variable: Top management effectiveness.
It is interesting to observe how the coefficient of determination (r2) changes
at every step of multiple linear regressions after a new predictor is included in the model. If only the dimension setting direction (r=0.629, r2=0.396) is used as a predictor it is possible to explain 39.6% of variance in top management effectiveness. When as an additional predictor the dimension aligning people (r=0.703, r2=0.494) is introduced the level of explained variance increases and the two account for 49.4% of variance in top management. If an additional predictor, motivating followers (r=0.748, r2=0.559) is introduced, with all three predictors included it is possible to explain 55.9% of variance in the dependent variable – top management effectiveness, while 441% of variations is under the influence of some other factors.
General model of multiple linear regression defines the relationship between
dependent or endogenous variable Yi and a set of independent or exogenous variables xj where j= 1,2...,k. Values xji are fixed numbers, Y is a random variable defined for each observation i, where i = 1,2, .. n and n number of observations. The model is defined in the following way:
Yi = 0 + 1x1i + 2x2i + ..... + kxki + i
where j are constant coefficients and is a random variable with mean 0 and variance 2.
Management, Vol. 20, 2015, Special issue, pp. 89-131. M. Glamuzina: Levels of leadership development and top management's effectiveness…
123
Based on the results of multiple linear regressions it is possible to create a final model of the causal relationship between top management effectiveness and the dimensions of leadership development, using coefficient as follows:
TMEi = 1,380 + 0,099x1i+0,217x2i+0,382x3i
where TMEi represents the dependent variable top management effectiveness and independent variables are marked with: x1i represents setting direction, x2i aligning people, and x3i motivating followers, i=1,2,3....n, and n is a total number of observations.
As seen from the given model, all coefficients are positive, which means that all three dimensions of leadership development – setting direction, aligning people and motivating followers – exercise a positive influence on top management effectiveness. If all other predictors are held under ceteris paribus condition, the following conclusions can be made:
Setting direction (=0.099) has a positive influence on top management effectiveness in such a way that if the value of composite variable setting direction is increased by one, top management effectiveness will increase by 0.099 (valid only in case the two other predictors are constant).
Aligning people (=0.217), has a positive influence on top management effectiveness in such a way that if the value of composite variable aligning people is increased by one, top management effectiveness will increase by 0.217 (valid only in case the two other predictors are constant).
Motivating followers (=0.382), has a positive influence on top
management effectiveness in such a way that if the value of composite variable motivating followers is increased by one, top management effectiveness will increase by 0.382 (valid only in case the two other predictors are constant).
The presented results confirm that leadership development in modern companies, expressed through the development of its dimensions setting direction, aligning people and motivating followers, has a significant influence on top management effectiveness. It is possible to conclude that through the development of the dimensions of leadership it is possible to increase top management effectiveness.
Management, Vol. 20, 2015, Special issue, pp. 89-131. M. Glamuzina: Levels of leadership development and top management's effectiveness…
124
These results indicate that the effectiveness of top level of management is very important for the development of companies. The effectiveness of top management is an important factor that cannot be easily copied by other companies and thus presents a comparative advantage for every organization. The results of the research are a proof that leadership development can be used as a predictor of top management effectiveness. Leadership of every company has a strong influence on the overall results of a business and its development in a changing environment must be a priority for all modern organizations. Top managers in modern companies should be constantly seeking methods and ways of developing the leadership and increasing the efficiency of their companies. Manager’s education on leadership, its characteristics and techniques of leading can empower them and increase the effectiveness of their companies.
5. CONCLUSION Leadership is defined as a social interactive process between the leader and
its followers in course of which the leader, through the activities of setting direction, aligning people and motivating followers, attains the goals of the organization. In this research leadership development is quantified and this presents an important methodological contribution to this research area. The determinants of attributes which influence the leadership process were identified and this created preconditions for distinguishing between developed and undeveloped leadership and eventually resulted in the construction of leadership development index (IRV) as a new measure for classifying leadership levels. Based on this two key research fields were identified: examining the influence of leadership development on top management effectiveness and examining the relations between the dimensions of leadership development and the results of top management effectiveness. These two research fields resulted in main research hypotheses – leadership development has a positive influence on top management effectiveness (H1), there is an interdependence of the dimensions of leadership and top management effectiveness (H2), managers in companies with more developed leadership are more highly effective than those in companies with less developed leadership (H3).
The first hypothesis assumes that leadership development positively
influences top management effectiveness. Analysis of correlation between leadership development and top management effectiveness shows that there is a positive correlation of strong intensity between the variables (rs=0.639, sig. 0.000) and that this correlation is statistically significant at the level of significance of 1%. Results of multiple linear regressions prove that leadership development has a positive statistically significant influence on top management
Management, Vol. 20, 2015, Special issue, pp. 89-131. M. Glamuzina: Levels of leadership development and top management's effectiveness…
125
effectiveness (r=0.748, sig.=0.000). Companies with developed leadership (mean=3.95, SE=0.05) have a significantly more effective top management when compared to the companies with undeveloped leadership (mean= 3.02, SE=0.18). There is a statistically significant difference (t=-6.194, sig.=0.000) at the level of significance of 1% between the effectiveness of top management in the companies with developed leadership and the companies with undeveloped leadership, so it is possible to conclude that there is a positive relationship between leadership development and top management effectiveness. The results of regression analysis show that leadership development is a significant predictor of top management effectiveness and that leadership development increases it.
Classification of companies based on different levels of leadership
development: (1) emerging leadership, (2) poorly developed leadership, (3) medium developed leadership, (4) well developed leadership, shows that there are differences between effectiveness of top management based on the levels of leadership development (F=14.961, df=3, sig.=0.000) with the following characteristics: there are significant differences in top management effectiveness between the companies with well developed leadership and all other levels of leadership development (sig.= 0.000); there are significant differences in top management effectiveness between the companies with medium developed leadership and emerging leadership (sig.= 0.002); there are significant differences in top management effectiveness between the companies with emerging leadership and poorly developed leadership (sig.= 0.026). Based on these results a conclusion can be drawn that companies with different levels of leadership development have different values of top management effectiveness.
The second hypothesis assumes that there is an interdependence between
different dimensions of developed leadership – setting direction, aligning people and motivating followers and top management effectiveness. The conducted correlation and regression confirm this hypothesis and prove that there is a statistically significant difference between the companies with developed and undeveloped leadership. It was also interesting to examine the extent to which each of the dimensions of developed leadership increases top management effectiveness.
The results of multiple linear regression (r=0.748, sig.=0.000) confirm that
there is a causal relationship between the dimensions of developed leadership and top management effectiveness and they also show that the relationship is statistically significant at the level of significance 1%. Setting direction (t=0.879, sig.=0.382), aligning people (t=1.914, sig.=0.058) and motivating followers (t=3.882, sig.=0.000) are all significant predictors of top management

Management, Vol. 20, 2015, Special issue, pp. 89-131. M. Glamuzina: Levels of leadership development and top management's effectiveness…
126
effectiveness. If setting direction (r=0.629, r2=0.396) is the only dimension used as predictor it is possible to explain 39.6% of variation in top management effectiveness. When an additional dimension is added, aligning people (r=0.703, r2=0.494), the percentage of explained variance increases to 49.4% of variance and if a third dimension is added to the model, motivating followers (r=0.748, r2=0.559) it is possible to explain 55.9% of variance in top management effectiveness. The presented results lead to the conclusion that leadership development, expressed through its variables setting direction, aligning people and motivating followers exercises a large influence on the effectiveness of top management and by its development it is possible to increase top management effectiveness.
The third hypothesis assumes that top managers in the companies with
developed leadership are more highly effective than the top managers in companies with less developed level of leadership. Analysis of the correlation of leadership development and individual perspectives of top management effectiveness shows that there is a strong positive statistically significant correlation between the financial perspective (rs=0.344, sig.=0.000) of top management effectiveness and leadership development, and medium positive statistically significant correlation between all other perspectives of top management effectiveness and leadership development (internal processes perspective rs=0.515, sig.=0.000; consumers perspective rs=0.556, sig.=0.000; perspective of growth/learning rs=0.571, sig.=0.000; perspective of corporate social responsibility rs=0.620, sig.=0.000). All of these correlations are statistically significant at the level of significance of 1%. Based on this, it is possible to conclude that top managers in the companies with developed leadership have a higher level of top management effectiveness when compared to managers in the companies with less developed leadership. Between the levels of leadership and top management effectiveness there is a positive relationship.
Results of the research lead to the conclusion that leadership development
influences positively top management effectiveness, which means that higher level of leadership development creates a solid precondition for top management effectiveness. Still, there is no general rule for leadership success. Leadership is a science for itself and the development of leadership is a managerial skill based on knowledge. Leadership cannot be learned or copied, but the basis for development of leadership can be increased through the activities of setting direction, aligning people and motivating followers which would enable organizational objectives to be achieved.
Management, Vol. 20, 2015, Special issue, pp. 89-131. M. Glamuzina: Levels of leadership development and top management's effectiveness…
127
6. LIMITATIONS AND RECOMMENDATIONS FOR FURTHER RESEARCH
A couple of main limitations of the research can be identified. First limitation
is related to the approach to defining leadership process and subjectivity of the researcher in choosing variables for measuring the process of leadership development and top management effectiveness. Second limitation is the use of questionnaire as an instrument for conducting the research, which often leads to biased answers and may reflect the subjective opinion of the examinees. Third limitation is the generalization of interpretation of the results. To justify the generalization the model should be tested not only in BiH, but in other countries as well, and this was not possible in this research.
Previously described limitations can serve as a starting point of the
recommendations for future studies. There is a lot of space for improvement of the presented methodological approach to leadership process and possibly design a new alternative classification of levels of leadership development. Variables in each of the dimensions of leadership development could be investigated into depth along with the variables in internal and external dimensions of top management effectiveness. Future studies could analyze the dynamical aspect of leadership development and top management effectiveness. This kind of longitudinal study would be very time and cost consuming, but it could give a new insight into the process of leadership development and top management effectiveness and their correlation.
It would be useful to conduct a research of leadership development and top
management effectiveness based on different industries in different countries and additionally test the hypotheses and results of this research. It would be interesting to see whether there are differences in leadership development between different countries. All of this implies that future studies should be conducted on a larger sample and that they may indicate possible differences based on different economic, historic and other factors influencing the sample. Also, a different methodology could be helpful in better understanding the researched phenomena and it would create a more detailed Figure of the correlation between leadership development and top management effectiveness then the one provided in this research.
REFERENCES 1. Allio, R. J. (2013). “Leaders and leadership – many theories, but what advice
is reliable?” Strategy and Leadership, 41, pp. 4 -14.
Management, Vol. 20, 2015, Special issue, pp. 89-131. M. Glamuzina: Levels of leadership development and top management's effectiveness…
128
2. Analui, F. (1999). “Eight parameters of managerial effectiveness: A study of senior managers in Ghana” Journal of Management Development, 18, pp. 362-389.
3. Armstrong, G. (2011). Leadership in Times of Change: An Examination of Merger Experience. University of Toronto.
4. Avolio, B. J., Walumbwa, F. O., Weber, T. J. (2009). “Leadership: Current Theories, Research and Future Directions”. Annual Review of Psychology, 60, pp. 421- 449.
5. Bass, B. M. (1990). “From Transactional to Transformal Leadership: Learning to Share the Vision”. Organizational Dynamics, 18, pp. 19-31.
6. Bass, B. M. (1985). Leadership and performance beyond expectations. Free Press, New York.
7. Bass, B. M., Avolio, B., J., Jung, D. I., Berson, Y. (2003). “Predicting Unit Performance by Assesing Transformational and Transactional Leadership”. Journal of Applied Psychology, 2, pp. 207-218.
8. Bennis, W. (1989). On Becoming a Leader, Addison Wesley, New York, 1989.
9. Buble, M. (2011). „Tendencije u razvoju menadžmenta 21. stoljeća“, in: Menadžment, vođenje i organizacija u XXI stoljeću, (Dis)kontinuiteti u praksi organizacije i menadžmenta, Split, 28.-30. September, pp. 1-9.
10. Carmeli, A., Schaubroeck, J, Tischler, A. (2011). “How CEO empowering leadership shapes top management team processes: Implications for firms performance”. Leadership Quarterly, 22, pp. 399-411.
11. Conger, J., A. (1991). “Inspiring Others: The Language of Leadership”. Academy of Management Executive, McGill University, vol. 5, 31-45.
12. Daft, R. L. (2012), Management, tenth edition, South Western, USA. 13. Day D. V, Lord R. G. (1998). “Executive Leadership and Organizational
Performance: Suggestions for a New Theory and Methodology”. Journal of Management, 14, p.p. 453-464.
14. Day, D. V. (2001). “Leadership development – A Review in Context”. Leadership Quarterly, 11 (4), Elsevier Science, pp. 581-613.
15. Day, D. V., Antonakis, J. (2012), The nature of leadership, 2nd ed., Sage Publications.
16. Drucker, P. F. (1998). „Management's New Paradigms“, Forbes, 01.05.1998. 17. Drucker, P. F. (2004). What Makes an Effective Executive? Harvard Business
Review. 18. Emiliani, M. L. (2008). “Standardized work for executive leadership”.
Leadership and Organizaition Development Journal, Emerald Group Publishing Limited, 29 (1), pp. 24-46.
19. Epstein, M. J., Roy, M. J. (2004). How does your board rate? Strategic Finance, Vol. 85, No. 8, pp. 24-31.

Management, Vol. 20, 2015, Special issue, pp. 89-131. M. Glamuzina: Levels of leadership development and top management's effectiveness…
129
20. Fairholm, M. (2004). “A New Sciences Outline for Leadership Development”. The Leadership & Organization Development Journal, Vol. 25 No. 4, pp. 369-383.
21. Finkelstein, S., Hambrick, D. C., Canella, A. A. (2009). Strategic leadership, theory and research on executives, top management teams and boards. Oxford University Press, New York.
22. Forgie, J., DeRosa, D. (2010). “Profiles of effectiveness: differentiators of top performing leaders“. Industrial and Commercial Training, Vol. 42 (2), pp. 76-80.
23. Gill, R. (2006). Theory and Practice of Leadership. Sage Publications, London, UK.
24. Grint, K. (2000). The Arts of Leadership. Oxford University Press, Oxford. 25. Kaplan, R. S., Norton, D. P. (1992). „The Balanced Scorecard – Measures
that Drive Performance“, Harvard Business Review, January – Ferbruary, pp. 71-79.
26. Knippenberg, D., Hogg M. A. (2003). “A Social Identity Model of Leadership Effectiveness in Organizations”. Research in Organizational Behaviour, Vol. 25, Elsevier Ltd, pp. 243-297.
27. Kotter, J. P. (1991). A Force for Change: How Leadership Differs from Management? Harvard Business Review.
28. Kotter, J. P. (1996). Leading Change. Harvard Business School Press. 29. Kouzes, J. M., Posner, B. Z. (2002). The leadership challenge. San Francisco:
Jossey-Bass. 30. Lord, R. G., Brown, D. J., Harvey, J. L. I., Hall, R. J. (2001). “Contextual
constrains on prototype generation and their multi-level consequences for leadership perceptions”. Leadership Quarterly, 12, pp. 311-338.
31. McGuire, P. (2010). “Outcomes of management and leadership development”. Journal of Management Development, Vol. 29, No. 5, Emerald Publishing Limited, str, 457- 470.
32. Mintzberg, H., Gosling, J. (2003). “The Five Minds of a Manager”. Harvard Business Review, pp. 54-63.
33. Mumford, T. V., Campion, M. A., Morgeson F. P. (2007). “The Leadership skills strataplex: Leadership skill requirements across organizational levels”. The Leadership Quarterly, 18, pp. 154 -166.
34. Northcott, D., Smith, J. (2011). “Managing performance at the top: a balanced scorecard for board of directors”. Journal of Accounting and Organizational Change, Vol. 7 (1), pp. 33-56.
35. Northouse, P. G. (2010). Leadership: Theory and Practice. Sage Publications.
36. Reddin, W. J. (1970). Managerial effectiveness. McGraw-Hill.

Management, Vol. 20, 2015, Special issue, pp. 89-131. M. Glamuzina: Levels of leadership development and top management's effectiveness…
130
37. Sikavica, P., Bahtijarević-Šiber, F. (2004). Teorija managementa i veliko empirijsko istraživanje u Hrvatskoj. Masmedia, Zagreb.
38. Sikavica, P., Bahtijarević-Šiber, F., Pološki Vokić, N. (2008). Temelji menadžmenta. Školska knjiga, Zagreb.
39. Snyder, H. N. et al (2010). Vision, Values and Courage – Leadership for Quality Management. The Free Press, New York.
40. Tipurić, D., ur., (2008). Korporativno upravljanje, Sinergija nakladništvo, Zagreb.
41. Yammarino F. J., Dionne S. J., Chun J. U. i Dansereau F. (2005). “Leadership and level of analysis: A state of science review”. Leadership Quarterly, 16, pp. 879 -919.
42. Young, M; Dulewitcz, V. (2009). “A study into leadership and management competencies predicting superior performance in the British Royal Navy”. Journal of Management Development, Vol. 28, No. 9, pp. 794-820.
43. Yukl, G. (1999). “An evaluation of weaknesses in transformational and charismatic leadership theories”. Leadership Quarterly, 10, pp. 285-305.
44. Yukl, G. (1999). “An evaluative essay about current conceptions of effective leadership”. European Journal of Work and Organizational Psychology, 8, pp. 33 – 48.
45. Yukl, G. (2008). Rukovođenje u organizacijama. Naklada Slap, Zagreb. 46. Zeleznik, A. (1977). “Managers and leaders: Are they different?” Harvard
Business Review, May-June, pp. 67-78.
RAZINE RAZVIJENOSTI VODSTVA I UČINKOVITOST TOP MENADŽMENTA: POSTOJI LI JASNA POVEZANOST?
SAŽETAK
U radu je s teorijskog i empirijskog aspekta obrađena problematika utjecaja razvijenosti vodstva na učinkovitost top menadžmenta. Dovodeći u odnos razvijenost procesa vodstva i učinkovitost top menadžmenta kroz izradu originalnog teorijskog modela njihove povezanosti, omogućena je identifikacija determinanti utjecaja na ishod procesa vodstva, pružanje novog metodološkog pristupa klasifikaciji vodstva prema kriteriju (ne)razvijenosti i mjerenje učinkovitosti top menadžmenta prilagođeno suvremenim uvjetima. Oblikovana je potpuno nova mjera stupnja razvijenosti vodstva za koju se pokazalo kako je čvrsto povezana s pokazateljima top menadžerske učinkovitosti u internim i eksternim perspektivama poslovanja poduzeća. Empirijskom verifikacijom istraživačkog modela na uzorku od 106 srednjih i velikih poduzeća proširen je i produbljen uvid u paradigmu suvremenog vodstva, njegovu razvijenost i afirmaciju u području menadžerske učinkovitosti i potvrđene su hipoteze istraživanja. Utvrđena je priroda veze između učinkovitosti top menadžmenta i ključnih varijabli razvijenosti vodstva - postavljanja smjera (putem kreiranja vizije, objašnjenja cjeline i postavljanja

Management, Vol. 20, 2015, Special issue, pp. 89-131. M. Glamuzina: Levels of leadership development and top management's effectiveness…
131
strategije), uključivanja ljudi (komuniciranja vizije, gradnje timova i traženja predanosti) odnosno motiviranja podređenih (inspiriranja, opunomoćenja zaposlenih i zadovoljenja njihovih potreba) i dokazalo se da postoji veza između razvijenosti vodstva i učinkovitosti, odnosno da razvijenost vodstva pozitivno utječe na učinkovitost top menadžmenta.
