levels, trends and determinants of lifetime and desired ... · levels, trends and determinants of...
TRANSCRIPT
Levels, Trends and Determinants of Lifetime and Desired Fertility in Ethiopia 1
Ethiopian Society of Population Studies
Levels, Trends and Determinants of Lifetime and Desired Fertility in Ethiopia: Findings from EDHS 2005
In-depth Analysis of the Ethiopian Demographic and Health Survey 2005
Addis Ababa, October 2008
In-depth Analysis of the Ethiopian Demographic and Health Survey 20052
In-depth Analysis of the Ethiopian Demographic and Health Survey 2005
Ethiopian Society of Population Studies
Levels, Trends and Determinants of Lifetime and Desired Fertility in Ethiopia: Findings from EDHS 2005
Addis Ababa, October 2008

Levels, Trends and Determinants of Lifetime and Desired Fertility in Ethiopia 3
Addis Ababa, October 2008
This document was printed with funds provided by UNFPA.
Note: the findings, interpretations, and conclusions expressed in this publication are entirely those of the author(s) and should not be attributed in any manner to UNFPA.
In-depth Analysis of the Ethiopian Demographic and Health Survey 20054
Contents
List of Tables 5
List of Figures 6
Abstract 7
1. Introduction 8
2. Objectives of the Study 11
3. Review of Literature on Determinants of Fertility Decline in Developing Countries 12
4. Data and Methods of Analysis 15
5. Levels and Trends of Current Fertility in Ethiopia 18
6. Actual and Desired Fertility Differentials 23
6.1 Trends in Lifetime Fertility 23
6.2 Levels and Differentials in Age at first Marriage, First Birth and Birth Intervals 26
6.3 Determinants of Lifetime Fertility in Ethiopia 31
6.4 Trends in Desired Fertility 35
6.5 Determinants of Fertility Intention in Ethiopia 37
7. Discussions of Major Findings 41
8. Summary and Conclusions 46
References 50
Annex 53

Levels, Trends and Determinants of Lifetime and Desired Fertility in Ethiopia 5
List of Tables
Table 1. Selected demographic and socio-economic indicators by region
Table 2. Trends and differentials in mean number of children ever born among all women in reproductive age, by age group and selected background characteristics: EDHS 2000 and 2005
Table 3. Percentage distribution of ever married women, and median age at first marriage, first birth and birth interval in relation to socio-economic and demographic characteristics of respondents: EDHS 2005
Table 4. Poisson regression analysis results predicting determinants of children ever born among currently married women, by age group: EDHS 2005
Table 5. Trends and differentials in percentage of women who want no more additional children among currently married women, by background characteristics of respondents: EDHS 2000 and 2005
Table 6. Logistic regression multivariate results predicting determinants of intention to limit additional child(ren) among currently married women: EDHS 2005

In-depth Analysis of the Ethiopian Demographic and Health Survey 20056
List of Figures
Figure 1. Total fertility rate, by place of residence: 2000-2005
Figure 2. Total fertility rate, by education: 2000-2005
Figure 3. Total fertility rate, by region: 2000-2005
Figure 4. Total fertility rate, by education: 2000-2005
Figure 5. Percentage distribution of women having had birth before age 20, by educational level and age groups
Figure 6. Proportion of women having had birth before age 20, by region
Figure 7. Median age at first marriage and first birth, by selected background characteristics of respondents: 2005
Levels, Trends and Determinants of Lifetime and Desired Fertility in Ethiopia 7
Abstract
Fertility is one of the most important elements determining the rate of population growth in developing
countries like Ethiopia. It has the potential of affecting the well being of mothers and their offspring. High
fertility and shorter birth intervals affect the survival chance of children, and the health status of mothers.
Their effects even go to the extent of affecting the socio-economic development of a given country if proper
care and action are not taken. The main objective of this paper is to identify socio-economic and demographic
factors affecting lifetime and desired fertility of women in Ethiopia so that appropriate measures would be
taken to achieve the policy goals set in the national policies and programs. Analysis of this study is based on
the 2000 and 2005 Ethiopian Demographic and Health Survey data collected by the Central Statistical Agency
and ORC Macro. Currently married women in the child-bearing age (i.e. 15-49) were used to fit multivariate
results predicting determinants of lifetime fertility using Poisson distribution, and desired fertility using
logistic regression models. Findings of the current study, in general, demonstrate that fertility has shown slight
decline at national level and in rural areas; the decline is substantial in urban centres. Results of the multivariate
models, too, reveal that there is significant variation in actual and desired fertility among selective groups.
Women living in urban areas, educated and employed women, tend to have lower lifetime fertility while those
living in Somali, Oromia and SNNP regions and experiencing child death lean to have more children. Women
belonging to Protestant and Muslim religious groups are also found to have relatively higher lifetime fertility
when compared to those following Orthodox Christian religion. Region specific studies based on reasonable
samples are required to identify factors regulating lifetime and desired fertility in each of the regions. Assessing
the extent to which reproductive health and family planning programs are implemented in each of the regions
is also one of the important conditions to narrow the gaps in levels of fertility across regions.
In-depth Analysis of the Ethiopian Demographic and Health Survey 20058
1. Introduction
Fertility is one of the elements in population dynamics that has significant contribution towards changing
population size and structure over time. Fertility rate is the highest in sub-Saharan Africa than any parts of
the world, mainly due to strong kinship networks and high economic and social values attached to children
(Romaniuk, 1980; Caldwell and Caldwell, 1987; Hinde and Mturi, 2000). The low level of economic development
contributing to high infant and child morality in the region is also another factor contributing to high fertility
resulting in rapid rate of population growth (Lindistorm and Berhanu, 1999). According to Bongaart (1999) the
desired family size is more than four children in sub-Saharan African countries, where child mortality is high
and poverty is rampant. This trend appears to continue in the future.
As mentioned above, Ethiopia is one of the developing countries with high fertility and rapid population
growth rate. The country’s population in 2005 was estimated at 77 million (CSA, 2006), placing it as the second
most populous nation in sub-Saharan Africa. According to the 2005 Ethiopian Demographic and Health Survey,
the total fertility rate at national level was 5.4 children per woman (CSA and ORC Macro, 2006) indicating that
much efforts should be made to attain the targets set in the national population policy of Ethiopia by 2015.
Early age at first marriage, desire for more children and extremely low contraceptive use are some of the major
reasons behind such high fertility rate (Assefa, 1992; Kinfu, 2001; Gibson and Mace, 2002).
Ethiopia, being one of the developing countries where subsistence agriculture is the major economic activity,
families often prefer large number of children since they are considered as an economic asset rather than
liabilities. In rural areas, parents want to have large number of children to get assistance in farming activities
(Bairagi, 2001) and emotional as well as economic support during old ages (Fapohunda and Todaro, 1988).
According to Caldwell (1982), the economic importance of children is over lifetime. African children do not only
provide support during childhood and adolescent ages but also beyond these ages. More psycho-social and
economic support is expected when parents are getting older. Old-age security is one of the major motivational
forces for having as many children as possible in Africa. In traditional societies, children are also expected to
strengthen the extent of kin relations, which implies not only economic benefits but also physical protection.
Getting larger in number is tantamount to strength in physical security. Like many countries in sub-Saharan
Africa, traditional norms and values in Ethiopia are in favour of high fertility. Having many children is considered
as a virtue and respect of God in a number of Ethiopian rural communities (Desta and Seyoum, 1998).
The Ethiopian government has been making several efforts to reduce fertility levels since 1993, the first time an
explicit national population policy aimed at reducing total fertility rate from the then 7.7 children per woman
Levels, Trends and Determinants of Lifetime and Desired Fertility in Ethiopia 9
to 4.0 by 2015 was launched (NPO, 1993). Increasing age at first marriage to at least 18 years, enhancing women’s
status through providing them with better employment and educational opportunities, expanding family
planning services and information, communication and education on ways and means of limiting family size
are some of the strategies designed to implement the population program. Various international agencies and
non-governmental organizations have also made efforts to provide technical, material and financial support to
the Ethiopian Government in implementing the population program so that fertility would decline over time.
Even though fertility has shown a declining trend at the national level, the transition has not begun in some
of the regions. There are clear regional differences in fertility levels and trends in Ethiopia. Some of the regions
like Addis Ababa have achieved a below replacement level of fertility (TFR=1.8) while others such as Oromia
(6.2), Somali (6.0), and SNNP (5.6) regions have total fertility rates that are above the national average. Cultural
and traditional barriers to effectively utilize modern birth control methods, low status of women and gender
inequality, as well as poor health service coverage are some of the difficulties in implementing programs that
would contribute to fertility transition in these regions (Machera, 1997). According to Caldwell and Caldwell
(1987), in areas where traditional social and economic systems persist, fertility hardly shows change. It rather
stagnates if not increasing. The fundamental change in fertility level requires disintegration of the traditional
social system as well as transformation of the economy from consumption to market oriented activities. Lack
of change in the family system from extended to nuclear, as well as the persistence of agrarian economy that
favours large family size could maintain high fertility levels.
Despite a decline in mortality level over the last couple of decades, malnutrition, limited access to health
facilities, epidemics and low standards of living are hindering further improvement in health. Consequently,
parents’ concern over the survivorship of infants and children are factors still deterring a further decline in
fertility at least in areas where access to maternal and child services are very limited. The effect of infant and
child mortality on fertility is one of the major concerns of parents, public health planners and policy makers.
Like other developing countries, significant variation in fertility level was observed among rural and urban
residents of Ethiopia. For instance, according to the 2005 Ethiopian Demographic and Health Survey report,
fertility is the lowest (TFR = 3.3 children per woman) in urban Ethiopia while it is the highest (about 6 children
per woman) in rural areas. Modernization factors such as better access to education and media, employment
opportunities in the modern economic sector and wider access to family planning services are some of the
major factors that put urban fertility down in the Ethiopian context (Kinfu, 2001; Sibanda et al., 2001). The effect
of poverty on fertility decline in major towns of Ethiopia is also not negligible (Eshetu and Mace, 2001).

In-depth Analysis of the Ethiopian Demographic and Health Survey 200510
Different fertility regulation mechanisms such as use of modern contraceptives, termination of pregnancies and
delayed marriages that have contributed much towards fertility reduction in urban areas are not available in
rural areas to play similar roles (Markos, 1997). In addition, socio-cultural factors leading to large family through
high value attached to children and kin support have not yet been diminished to result in scarcity of resources/
time to bring up children (Smith, 2004; Eshetu and Mace, 2008). Because of controversies on the rationales
behind the onset of fertility decline in developing countries, there is a strong need to undertake a study aimed
at identifying factors contributing to fertility decline (if any) and assessing the prevalence of fertility decline at
national and subnational levels. The main issues to be addressed in this paper are, therefore, to investigate (a)
whether or not fertility decline has started in Ethiopia, and (b) if the practice is the same across regions.

Levels, Trends and Determinants of Lifetime and Desired Fertility in Ethiopia 11
2. Objectives of the Study
The main objective of this study is to assess levels and determinants of lifetime and desired fertility at national
and regional levels that have implications for program review and implementation of the population programs
in Ethiopia.
Specifically, the study aims at:
• Assessingwhetherthereisdeclineinfertilityrateatthenationallevelornot;
• Examiningfactorsresponsibleforfertilitychange(declineorincrease)ineachoftheregionsandacrossothervariables;
• Identifyingfactorsaffectingfertilityintention;and
• Suggestingappropriatepolicymeasures tobe taken inEthiopia toachieve thestipulatedgoals in thesphereofreproductivehealthoutcomes.
In-depth Analysis of the Ethiopian Demographic and Health Survey 200512
3. Review of Literature on Determinants of Fertility Decline in Developing Countries
Different theories on fertility decline such as the demographic transition theory (Kirk, 1996), and neo-classical
micro-economic theory (Becker and Lewis, 1973; Willis, 1974) have suggested that the low level of economic
development that results in high infant and child mortality, low contraceptive use, low status of women and
their limited achievements in the sphere of educational and employment opportunities are the major causes
of high fertility in sub-Saharan Africa. According to this group of scholars and population experts, the onset
of fertility decline could only be possible if and only if sound and radical socio-economic development calling
for low fertility is taking place. For this group, poverty is an escalating factor of high fertility norm and poor
countries continue to have high birth rate until they would be successful in implementing their poverty
eradication programs. In view of the classical economists, ‘economic development’ is the only and best way of
regulating fertility.
High fertility in traditional African societies, according to Caldwell and Caldwell (1987), is associated with
the economic benefits that children provide to their parents. Children are not only sources of joy but also of
economic benefit from the very beginning. African children contribute labour to farming activities during their
adolescent and youth age besides being major financial support later on. The need for such supports (i.e. labour
and financial contributions) is believed to maintain the high fertility norm in African countries. Comparing such
a scenario with the situation in the Western World, Caldwell (1982) stated that modern and industrial societies
prefer small family as they need to invest more time and resource on fewer children. Parents from developing
countries, on the contrary, wish to have more children for they do not bear much cost to bring them up; they
rather gain a lot from their children.
Exploring other possibilities that lead to fertility decline in developing countries, Cleland and Wilson (1987) also
came up with the new theory of fertility transition – the ideational theory of fertility decline. This theory states
that fertility decline in developing countries should not necessarily require economic advancement through
industrialization; parents should have better access to family planning information and services. Diffusion of
new ideas that penetrate into traditional norms and values could bring about change in fertility behaviour
without necessarily calling for the preconditions stated in other theories: a decline in infant and child mortality
(Palloni and Rafalimanana, 1999) as well as a radical change in socio-economic development (Kirk, 1996).
Levels, Trends and Determinants of Lifetime and Desired Fertility in Ethiopia 13
Contrary to the arguments mentioned above, other scholars in the fields of evolutionary demography (Betzig,
1988; Kaplan, 1996), anthropological demography (Smith, 1984; Turke, 1989), and behavioural ecologists
(Abernethy, 1992; Low, 2000; Mace, 2000), nonetheless, argue that fertility decline is not only a function of
economic development but could also be the outcome of undesirable circumstances that lead to frustration
and desperation due to economic hardship and catastrophes as well as socio-cultural traditions. According
to the arguments made by the latter group, limited access to resources to bring up newly born babies has
significant impact in postponing timing of marriage and child delivery. Use of contraceptive supplies to space
the interval between births and/or the attempt to stop having children as well as terminating unplanned and
unwanted pregnancies among the unemployed and less educated women could be the results of resource
constraints to support newly born babies than time constraints to bear and rear children. In their view, had
poverty always perpetuated high fertility, the decline in fertility rate would have never been observed in some
of the non-industrialized countries.
Cultural factors such as kin support and traditional values as well as norms perpetuating high fertility have
also their own independent and intrinsic effect on fertility in developing countries like Ethiopia. In traditional
societies where high values are attached to male heir and child rearing is not only the responsibility of biological
parents but shared by close relatives and neighbours, fertility remains to be high (Turke, 1989; Low, Clarke and
Lockridge, 1992). Among these societies, fertility may not decline in response to economic hardship since the
costs are shared and individual mothers would not feel the pain of resource constraints. The signal of fertility
decline among traditional societies where such support was temporarily absent as a result of drought and
famine has already been observed in drought prone areas of Northern Ethiopia (for details see Markos, 1997).
Qualitative studies aimed at explaining fertility differentials in traditional societies (Borgerhoff Mudler, 1987;
Turke, 1989), in general, state that what matters in fertility transition is not only women’s access to resources
(wealth, information, employment opportunities and the like) but also the cultural elements and nature of
interfamilial support to bring up the newly born child. In societies where kin support prevails, the pressure and
influence of having additional child is also profound (Turke, 1989).
Experiences from Latin America (Guzman, 1994), East as well as South East Asia (Casterline, 1994), in general,
showed that fertility decline is the outcome of modernization factors and social transformation that are
expressed in rapid falls in persons engaged in agriculture, the growth of market economy along with
expansion of the wage earning sector, the steady rise in schooling, active participation of women in production
activities, and wider access to family planning information and services. Rapid decline in fertility was possible
in these parts of the world due to the integration of three key elements required for change in family size:
modernization of the economy, diffusion of new family ideals and active government policies favouring family
In-depth Analysis of the Ethiopian Demographic and Health Survey 200514
planning programs. Compared to what is discussed above, the prevailing situation in Ethiopia is quite different.
Children are still playing a decisive role in the agrarian economy while the traditional family system is playing
active roles in the production as well as reproduction spheres. The level of urbanization is under 20 percent
while female literacy rate, the engine for promotion of development, is quite low - only 29.2 percent in 2005
(CSA and ORC Macro, 2006).
As indicated above, there is no single factor responsible for explaining fertility transition as argued by
demographers and development studies experts. Depending on the prevailing situation of a given country, the
rationale behind fertility decline could be attributed to changes in socio-economic conditions as well as cultural
transformation. Fundamental issues and approaches used in each of the theories mentioned above could thus
be taken into account while assessing the determinants of fertility in Ethiopia at regional and national levels.
Levels, Trends and Determinants of Lifetime and Desired Fertility in Ethiopia 15
4. Data and Methods of Analysis
In this study, the 2005 Ethiopian Demographic and Health Survey data is used to explain variations in fertility. In
order to assess fertility levels, trends, differentials and determinants, information compiled on lifetime fertility
(i.e. total number of children ever born), birth interval (i.e. the interval between consecutive births) and fertility
intention (i.e. intention to have additional child (ren)) are used to undertake bivariate and multivariate analyses.
Apart from taking percentage distributions and average values on the number of children ever born and the
span between consecutive births, different models have also been fitted using the Poisson distribution and the
logistic regression models. Kaplan-Meier life table (Norusis, 1994) is also used to calculate median values by
taking censored events into account.
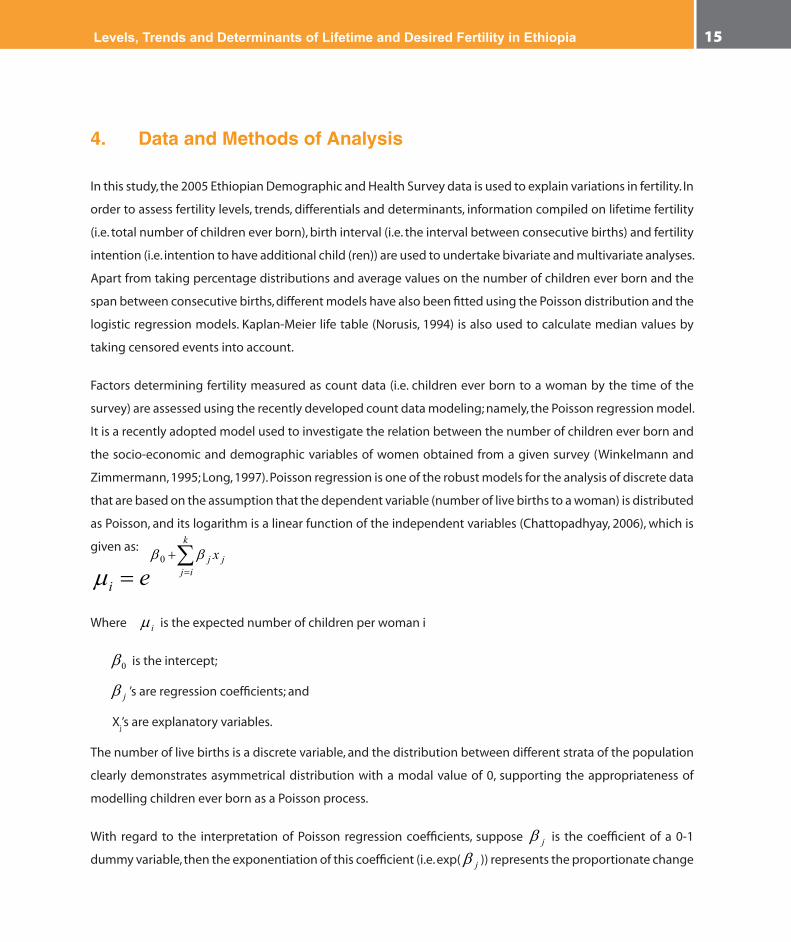
Factors determining fertility measured as count data (i.e. children ever born to a woman by the time of the
survey) are assessed using the recently developed count data modeling; namely, the Poisson regression model.
It is a recently adopted model used to investigate the relation between the number of children ever born and
the socio-economic and demographic variables of women obtained from a given survey (Winkelmann and
Zimmermann, 1995; Long, 1997). Poisson regression is one of the robust models for the analysis of discrete data
that are based on the assumption that the dependent variable (number of live births to a woman) is distributed
as Poisson, and its logarithm is a linear function of the independent variables (Chattopadhyay, 2006), which is
given as: ∑= =
+k
ijjj x
i eββ
µ0
Where iµ is the expected number of children per woman i
0β is the intercept;
jβ ’s are regression coefficients; and
Xj’s are explanatory variables.
The number of live births is a discrete variable, and the distribution between different strata of the population
clearly demonstrates asymmetrical distribution with a modal value of 0, supporting the appropriateness of
modelling children ever born as a Poisson process.
With regard to the interpretation of Poisson regression coefficients, suppose jβ is the coefficient of a 0-1
dummy variable, then the exponentiation of this coefficient (i.e. exp( jβ )) represents the proportionate change
In-depth Analysis of the Ethiopian Demographic and Health Survey 200516
in the average number of children ever born when the value of the variable changes from 0 to 1, holding
everything else constant. Similarly, when jβ is a Poisson regression coefficient for a continuous variable, then
exp ( jβ ) represents the proportionate change in the mean number of children ever born when the value of
the predictor variable increases by one unit, holding everything else constant (Wang and Famoye, 1997).
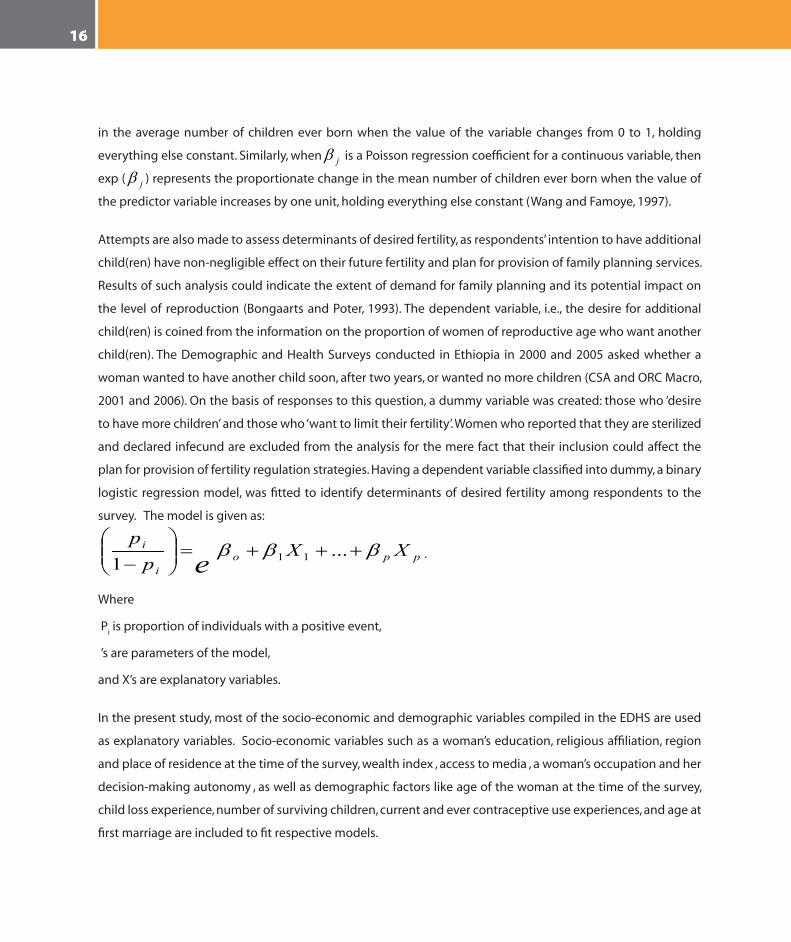
Attempts are also made to assess determinants of desired fertility, as respondents’ intention to have additional
child(ren) have non-negligible effect on their future fertility and plan for provision of family planning services.
Results of such analysis could indicate the extent of demand for family planning and its potential impact on
the level of reproduction (Bongaarts and Poter, 1993). The dependent variable, i.e., the desire for additional
child(ren) is coined from the information on the proportion of women of reproductive age who want another
child(ren). The Demographic and Health Surveys conducted in Ethiopia in 2000 and 2005 asked whether a
woman wanted to have another child soon, after two years, or wanted no more children (CSA and ORC Macro,
2001 and 2006). On the basis of responses to this question, a dummy variable was created: those who ‘desire
to have more children’ and those who ‘want to limit their fertility’. Women who reported that they are sterilized
and declared infecund are excluded from the analysis for the mere fact that their inclusion could affect the
plan for provision of fertility regulation strategies. Having a dependent variable classified into dummy, a binary
logistic regression model, was fitted to identify determinants of desired fertility among respondents to the
survey. The model is given as:
ppoi
i XXp
pe βββ +++=
−
...1 11 .
Where
Pi is proportion of individuals with a positive event,
β’s are parameters of the model,
and X’s are explanatory variables.
In the present study, most of the socio-economic and demographic variables compiled in the EDHS are used
as explanatory variables. Socio-economic variables such as a woman’s education, religious affiliation, region
and place of residence at the time of the survey, wealth index , access to media , a woman’s occupation and her
decision-making autonomy , as well as demographic factors like age of the woman at the time of the survey,
child loss experience, number of surviving children, current and ever contraceptive use experiences, and age at
first marriage are included to fit respective models.

Levels, Trends and Determinants of Lifetime and Desired Fertility in Ethiopia 17
The quality of data was checked, before fitting the models, using different techniques such as single age
distribution, sex ratio at birth, mean parity and proportion of dead children. Despite some fluctuation in
women’s age distribution, evidencing for the existence of digital preference and age heaping while reporting
current age and age at the birth of each of the children and bias in reporting sex of dead children, the overall
quality of the 2005 Ethiopian Demographic and Health Survey data is within acceptable range to undertake
further analysis.
In addition, focus group discussions and key informant interviewers from all regions except Dire Dawa and
Harari regions which have similar demographic characteristics with Addis Ababa and other major towns in
Ethiopia were used to further enrich the statistical findings. The data collected using these instruments focused
on values of children, fertility intention, traditional norms and values governing timing of birth as well as
the impact of early marriage and child mortality on fertility. The summarized responses, obtained from the
interviews and focus group discussions, are used to explain the reasons behind fertility change at national and
regional levels.
In-depth Analysis of the Ethiopian Demographic and Health Survey 200518
5. Levels and Trends of Current Fertility in Ethiopia
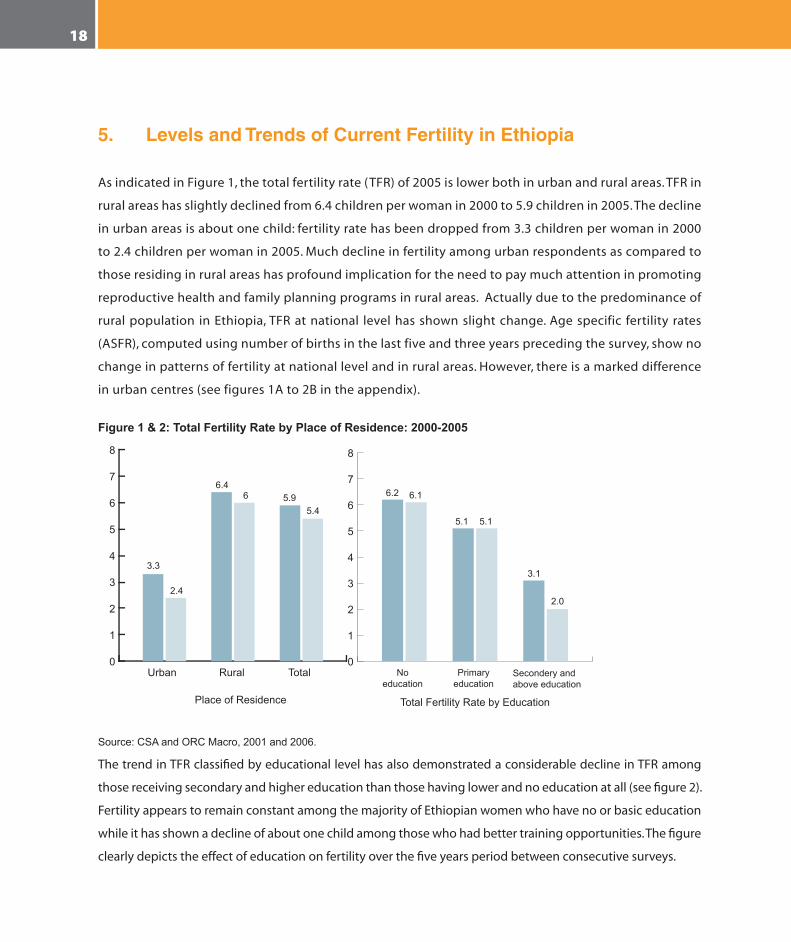
As indicated in Figure 1, the total fertility rate (TFR) of 2005 is lower both in urban and rural areas. TFR in
rural areas has slightly declined from 6.4 children per woman in 2000 to 5.9 children in 2005. The decline
in urban areas is about one child: fertility rate has been dropped from 3.3 children per woman in 2000
to 2.4 children per woman in 2005. Much decline in fertility among urban respondents as compared to
those residing in rural areas has profound implication for the need to pay much attention in promoting
reproductive health and family planning programs in rural areas. Actually due to the predominance of
rural population in Ethiopia, TFR at national level has shown slight change. Age specific fertility rates
(ASFR), computed using number of births in the last five and three years preceding the survey, show no
change in patterns of fertility at national level and in rural areas. However, there is a marked difference
in urban centres (see figures 1A to 2B in the appendix).
Figure 1 & 2: Total Fertility Rate by Place of Residence: 2000-2005
3.3
6.2 6.1
5.1
3.1
2.0
5.1
6.46
5.45.9
2.4
Urban No education
Primary education
Secondery and above education
Rural Total0
1
2
3
4
5
6
7
8
Place of Residence
0
1
2
3
4
5
6
7
8
Total Fertility Rate by Education
Source:CSAandORCMacro,2001and2006.
The trend in TFR classified by educational level has also demonstrated a considerable decline in TFR among
those receiving secondary and higher education than those having lower and no education at all (see figure 2).
Fertility appears to remain constant among the majority of Ethiopian women who have no or basic education
while it has shown a decline of about one child among those who had better training opportunities. The figure
clearly depicts the effect of education on fertility over the five years period between consecutive surveys.
Levels, Trends and Determinants of Lifetime and Desired Fertility in Ethiopia 19
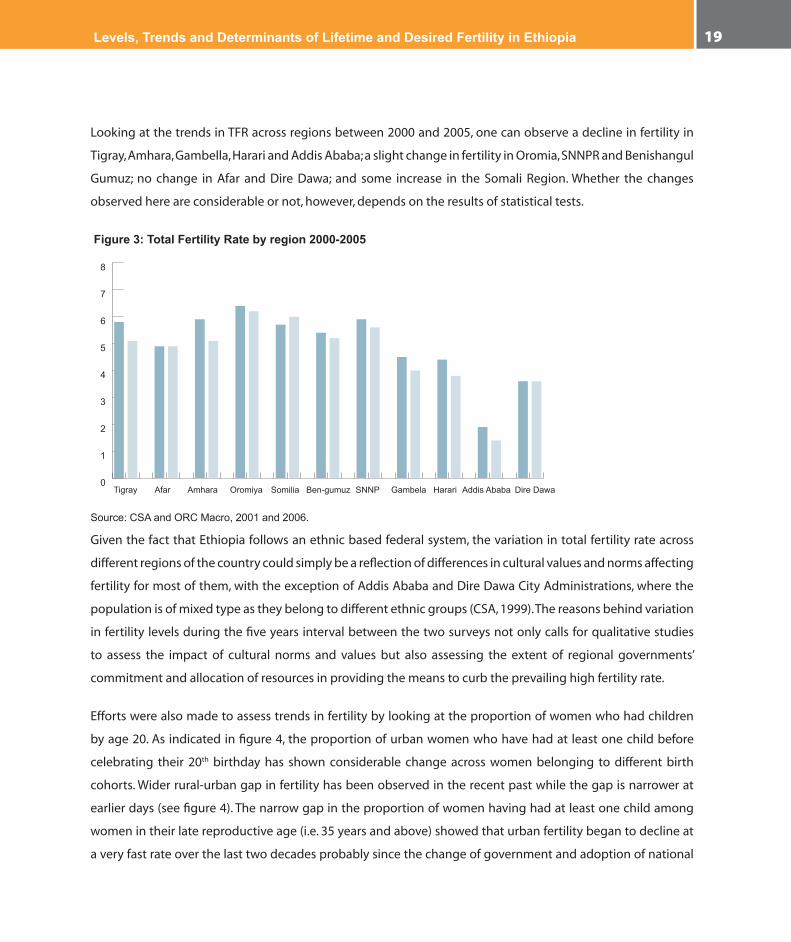
Looking at the trends in TFR across regions between 2000 and 2005, one can observe a decline in fertility in
Tigray, Amhara, Gambella, Harari and Addis Ababa; a slight change in fertility in Oromia, SNNPR and Benishangul
Gumuz; no change in Afar and Dire Dawa; and some increase in the Somali Region. Whether the changes
observed here are considerable or not, however, depends on the results of statistical tests.
Figure 3: Total Fertility Rate by region 2000-2005
Tigray Afar Amhara Oromiya Somilia Ben-gumuz SNNP Gambela Harari Addis Ababa Dire Dawa0
1
2
3
4
5
6
7
8
Source:CSAandORCMacro,2001and2006.
Given the fact that Ethiopia follows an ethnic based federal system, the variation in total fertility rate across
different regions of the country could simply be a reflection of differences in cultural values and norms affecting
fertility for most of them, with the exception of Addis Ababa and Dire Dawa City Administrations, where the
population is of mixed type as they belong to different ethnic groups (CSA, 1999). The reasons behind variation
in fertility levels during the five years interval between the two surveys not only calls for qualitative studies
to assess the impact of cultural norms and values but also assessing the extent of regional governments’
commitment and allocation of resources in providing the means to curb the prevailing high fertility rate.
Efforts were also made to assess trends in fertility by looking at the proportion of women who had children
by age 20. As indicated in figure 4, the proportion of urban women who have had at least one child before
celebrating their 20th birthday has shown considerable change across women belonging to different birth
cohorts. Wider rural-urban gap in fertility has been observed in the recent past while the gap is narrower at
earlier days (see figure 4). The narrow gap in the proportion of women having had at least one child among
women in their late reproductive age (i.e. 35 years and above) showed that urban fertility began to decline at
a very fast rate over the last two decades probably since the change of government and adoption of national

In-depth Analysis of the Ethiopian Demographic and Health Survey 200520
population and other policies creating favourable condition to regulate fertility. An increasing cost of living in
urban areas since early 1990s (Ethiopian Economic Association, 2002) could also be another factor explaining
the repaid decline in fertility among urban dwellers.
Figure 4: Percentage of women having had first birth before age 20 by place of residence
20-24 25-29 30-34 35-39 40-44 45-4020
30
40
50
60
70
80
RuralUrban
Age
Perc
ent
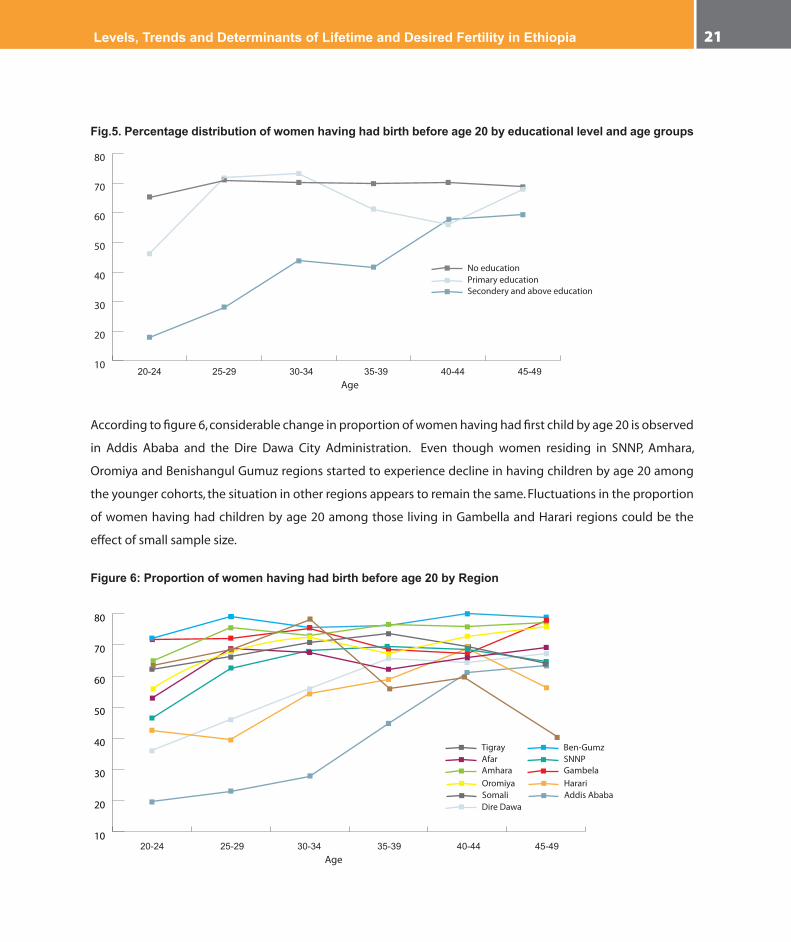
Noticeable differentials in trends having had at least one child by age 20 are also observed among women
achieving different levels of education. As can be seen from figure 5, the proportion of women having had
at least one child by age 20 had shown tremendous decline among those women receiving secondary
or more education while the change is inconsistent among those who attained primary level education.
No change has been observed among those who had never been to school. The proportion of better-
educated women experiencing child delivery by age 20 had declined from about sixty percent among
older cohorts to below 20 percent among youngsters (see figure 5). This indicates that fertility transition
is not taking place among women belonging to all socio-economic strata but selectively. Overall fertility
reduction may not be observed if it does not happen uniformly or proportionately among all women
belonging to different categories.
Levels, Trends and Determinants of Lifetime and Desired Fertility in Ethiopia 21
Fig.5. Percentage distribution of women having had birth before age 20 by educational level and age groups
20-24 25-29 30-34 35-39 40-44 45-49
No educationPrimary educationSecondery and above education
10
20
30
40
50
60
70
80
Age
According to figure 6, considerable change in proportion of women having had first child by age 20 is observed
in Addis Ababa and the Dire Dawa City Administration. Even though women residing in SNNP, Amhara,
Oromiya and Benishangul Gumuz regions started to experience decline in having children by age 20 among
the younger cohorts, the situation in other regions appears to remain the same. Fluctuations in the proportion
of women having had children by age 20 among those living in Gambella and Harari regions could be the
effect of small sample size.
Figure 6: Proportion of women having had birth before age 20 by Region
20-24 25-29 30-34 35-39 40-44 45-49
TigrayAfar AmharaOromiyaSomali
Ben-GumzSNNPGambelaHarariAddis Ababa
Dire Dawa
10
20
30
40
50
60
70
80
Age
In-depth Analysis of the Ethiopian Demographic and Health Survey 200522
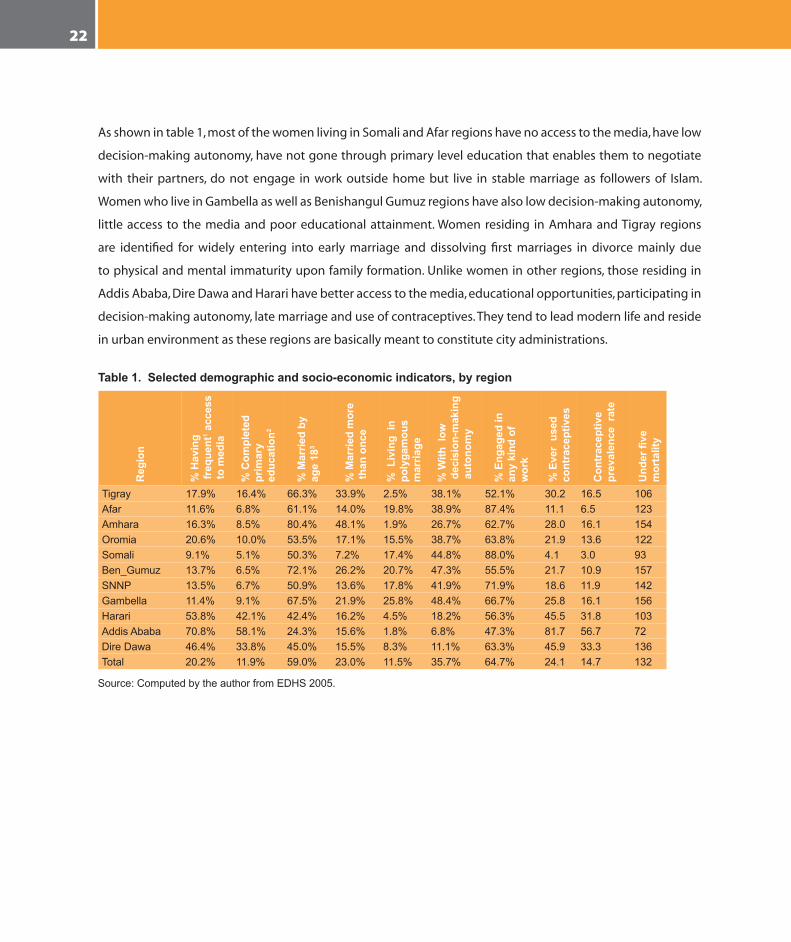
As shown in table 1, most of the women living in Somali and Afar regions have no access to the media, have low
decision-making autonomy, have not gone through primary level education that enables them to negotiate
with their partners, do not engage in work outside home but live in stable marriage as followers of Islam.
Women who live in Gambella as well as Benishangul Gumuz regions have also low decision-making autonomy,
little access to the media and poor educational attainment. Women residing in Amhara and Tigray regions
are identified for widely entering into early marriage and dissolving first marriages in divorce mainly due
to physical and mental immaturity upon family formation. Unlike women in other regions, those residing in
Addis Ababa, Dire Dawa and Harari have better access to the media, educational opportunities, participating in
decision-making autonomy, late marriage and use of contraceptives. They tend to lead modern life and reside
in urban environment as these regions are basically meant to constitute city administrations.
Table 1. Selected demographic and socio-economic indicators, by region
Reg
ion
% H
avin
g
freq
uent
1 acc
ess
to m
edia
% C
ompl
eted
pr
imar
y ed
ucat
ion2
% M
arrie
d by
ag
e 18
3
% M
arrie
d m
ore
than
onc
e
% L
ivin
g in
po
lyga
mou
s m
arria
ge
% W
ith l
ow d
ecis
ion-
mak
ing
aut
onom
y
% E
ngag
ed in
an
y ki
nd o
f w
ork
% E
ver
used
co
ntra
cept
ives
Con
trac
eptiv
e pr
eval
ence
rat
e
Und
er fi
ve
mor
talit
y
Tigray 17.9% 16.4% 66.3% 33.9% 2.5% 38.1% 52.1% 30.2 16.5 106Afar 11.6% 6.8% 61.1% 14.0% 19.8% 38.9% 87.4% 11.1 6.5 123Amhara 16.3% 8.5% 80.4% 48.1% 1.9% 26.7% 62.7% 28.0 16.1 154Oromia 20.6% 10.0% 53.5% 17.1% 15.5% 38.7% 63.8% 21.9 13.6 122Somali 9.1% 5.1% 50.3% 7.2% 17.4% 44.8% 88.0% 4.1 3.0 93Ben_Gumuz 13.7% 6.5% 72.1% 26.2% 20.7% 47.3% 55.5% 21.7 10.9 157SNNP 13.5% 6.7% 50.9% 13.6% 17.8% 41.9% 71.9% 18.6 11.9 142Gambella 11.4% 9.1% 67.5% 21.9% 25.8% 48.4% 66.7% 25.8 16.1 156Harari 53.8% 42.1% 42.4% 16.2% 4.5% 18.2% 56.3% 45.5 31.8 103AddisAbaba 70.8% 58.1% 24.3% 15.6% 1.8% 6.8% 47.3% 81.7 56.7 72DireDawa 46.4% 33.8% 45.0% 15.5% 8.3% 11.1% 63.3% 45.9 33.3 136Total 20.2% 11.9% 59.0% 23.0% 11.5% 35.7% 64.7% 24.1 14.7 132
Source:ComputedbytheauthorfromEDHS2005.
Levels, Trends and Determinants of Lifetime and Desired Fertility in Ethiopia 23
6. Actual and Desired Fertility Differentials
The reproductive behaviour of women in a given society is affected not only by their physiological structure
and biological makeup but also by a number of socio-economic and demographic factors. Differences in age
at entry into marriage, access to family planning services and their ability to utilize these services effectively
and efficiently, respondents’ age which has effect on their fertility experiences and desire to have more or
less children, economic status of the household (i.e. possession of wealth to invest on offspring), and cultural
and traditional norms in which the woman lives appear to play significant roles in creating variation in the
level of fertility. In assessing differentials in fertility, attempts are made to observe the situation among women
belonging to different categories of reproductive age: early (15-24 years), peak (25-34 years) and late (35 and
above); such an assessment could help to observe the change across different age cohorts.
6.1 Trends in Lifetime Fertility
Mean number of children measured as average parity among all women of reproductive age is found to be 3.09
among all women in the 2000 EDHS but 3.14 in the 2005 survey (table 2). Though there was a slight increase
in the average number of children ever born to a woman, the difference was not statistically significant to be
considered. Mean number of children ever born has not shown statistically significant change by broader age
groups of women in the reproductive age too. A statistically significant decline in mean parity is, however,
consistently observed among urban residents while the changes in rural areas are not consistent. Rural women
in their peak fertility age (i.e. 25-34 years) have shown a statistically significant increase in mean parity while the
changes among women in other age groups were not considerable. This could be due to shift in timing of birth
following the change in age at first marriage due to changes in policies and laws pertaining to timing of family
formation (NOP, 1993; FDRE, 2000). Though there is a tendency of decline in mean parity among those having
secondary and above education, there is unclear pattern among those having primary level education (table
2). A significant decline in mean parities is observed among those in their early reproductive age but there is
an increase among those in later ages. This could again be because of shift in the timing of births towards later
age rather than a decline in fertility as such. An increasing trend in mean parity among those having received
no education could be the effect of traditional norms and values perpetuating large family size.
In-depth Analysis of the Ethiopian Demographic and Health Survey 200524
Table 2. Trends and differentials in mean number of children ever born among all women of reproductive age, by age group and selected background characteristics: EDHS 2000 and 2005
15-24 25-34 35-49 All women2000 2005 T-test 2000 2005 T-test 2000 2005 T-test 2000 2005 T-test
RegionTigray 0.67 0.59 -1.086 3.33 3.26 -0.45 6.33 6.28 -0.228 3.16 2.99 -1.24Afar 0.64 0.61 -0.141 2.96 3.69 1.69 5.90 5.77 -0.230 3.08 3.22 0.42Amhara 0.78 0.66 -3.098 3.63 3.42 -2.43** 6.33 6.48 1.297 3.39 3.26 -1.78Oromia 0.62 0.69 2.153 3.78 3.83 0.72 6.79 6.63 -1.570 3.08 3.26 2.94**Somali .58 0.82 1.492 3.96 3.85 -0.33 6.95 6.47 -1.096 3.48 3.62 0.54Ben_Gumuz 0.63 0.85 1.100 3.36 3.81 1.05 6.41 6.29 -0.195 3.01 3.29 0.78SNNP 0.50 0.49 -0.91 3.18 3.70 5.50*** 6.54 6.97 3.457** 3.11 3.29 2.19*Gambella 0.75 0.99 0.62 2.97 3.06 0.127 5.59 5.05 -0.460 2.64 2.81 0.30Harari 0.54 0.50 -0.12 2.60 2.22 -0.43 6.06 4.69 -0.914 2.65 2.02 -0.95AddisAbaba 0.16 0.16 0.203 1.41 1.06 -2.38* 4.25 3.64 -2.096* 1.46 1.22 -2.15*DireDawa 0.25 0.45 1.01 2.23 2.38 0.25 4.95 4.98 0.022 2.03 2.32 0.65PlaceofResidenceUrban 0.33 0.26 -2.43* 2.17 1.80 -3.90*** 5.07 4.44 -3.99*** 1.93 1.65 -4.17***Rural 0.68 0.70 0.72 3.73 3.85 2.46* 6.81 6.69 1.890 3.35 3.46 2.79**Respondent’sEducationIlliterate 0.73 0.94 7.56*** 3.74 3.80 1.10 6.62 6.74 1.955 3.62 3.99 8.23***Primary 0.43 0.34 -2.79** 3.19 3.71 4.84*** 5.06 5.57 2.248* 1.71 1.76 0.83Secondary 0.29 0.18 -3.89*** 1.73 1.52 -1.89 4.06 3.49 -2.237* 1.08 0.99 -1.47
Total 0.61 0.61 -2.72 3.45 3.53 1.762 6.46 6.46 0.058 3.09 3.14 1.36Numberofcases 14070
***=P<0.000,**=P<0.01,*=p<0.05
Source:CompiledbytheauthorfromEDHS2000and2005datasets.
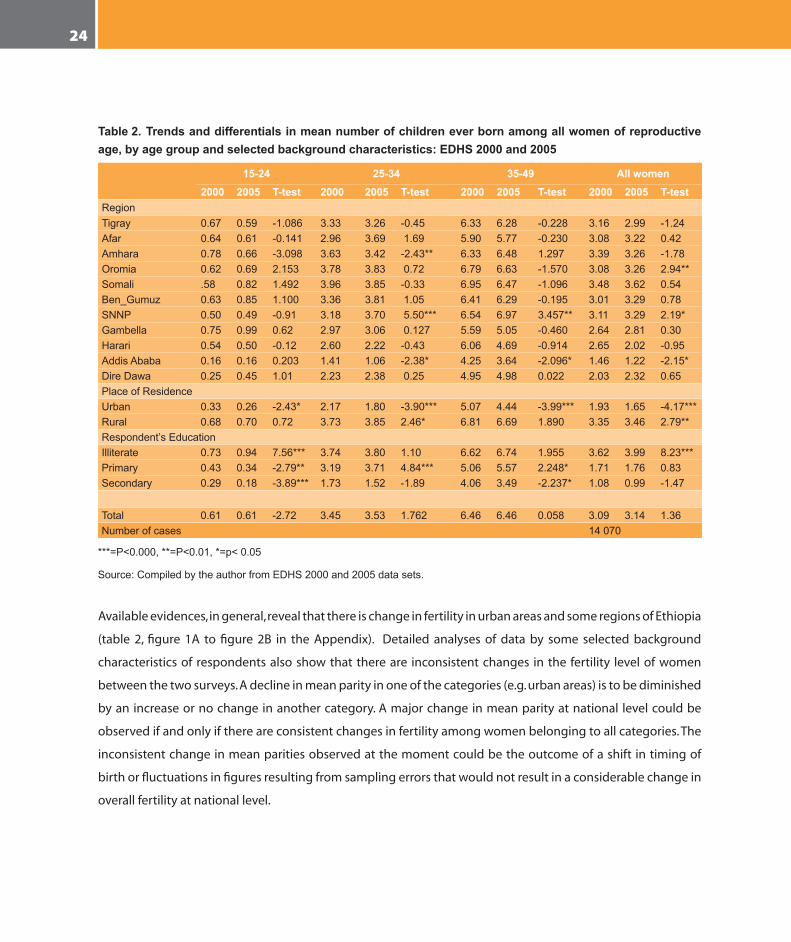
Available evidences, in general, reveal that there is change in fertility in urban areas and some regions of Ethiopia
(table 2, figure 1A to figure 2B in the Appendix). Detailed analyses of data by some selected background
characteristics of respondents also show that there are inconsistent changes in the fertility level of women
between the two surveys. A decline in mean parity in one of the categories (e.g. urban areas) is to be diminished
by an increase or no change in another category. A major change in mean parity at national level could be
observed if and only if there are consistent changes in fertility among women belonging to all categories. The
inconsistent change in mean parities observed at the moment could be the outcome of a shift in timing of
birth or fluctuations in figures resulting from sampling errors that would not result in a considerable change in
overall fertility at national level.
Levels, Trends and Determinants of Lifetime and Desired Fertility in Ethiopia 25
As observed in table 2, there is slight variation in mean number of children ever born belonging to different
categories of age group by region. Mean parity for the year 2005 is nearly the same as that for 2000 for most of
the regions. A statistically significant decline in mean parities is, however, observed only among women in their
peak reproductive age and residing in Amhara Region and those middle aged and older women living in Addis
Ababa (table 2). Contrary to this, a considerable increase in mean parities is seen among some of the women
residing in Oromia and SNNP regions. The change in mean parities among these groups of women is basically
due to giving up using traditional birth control methods without adopting modern ones. The overall effect is,
nevertheless, no change in fertility at national level. A decline in some of the regions appears to be offset by an
increase elsewhere.
Unlike the situation in the regions, there is a noticeable variation among mean parities of women by their place
of residence. Women living in urban areas demonstrate a statistically significant decline in average parities in
all sub-age groups when comparison is made for EDHS data in 2000 and 2005. The difference in mean parities
across various age cohorts is, however, inconsistent. No statistically significant change in mean parities are
observed for women in early and late reproductive ages while a considerable change is observed for those in
the peak fertility age probably due to a shift in timing of birth.
In general, there appears to be a considerable variation in average parities by region, place of residence and
educational attainment. Women living in Addis Ababa and Dire Dawa city administrations as well as Harari
Region, where the majority of the population are urban residents, have lower mean parities compared to those
residing in other regions predominantly inhabited by rural residents. Even though an inverse relationship
between educational attainment and mean parities are observed in all age groups, a consistent decline in
fertility is not observed in all categories of educational level among women belonging to different age cohorts.
The haphazard effect of education on fertility may not, thus, lead to fertility transition as it rather tries to
maintain the status quo over time. A sharp decline in mean parity among those who have attained secondary
and above education alone would not bring about fertility transition unless similar trend is observed in other
categories of the educational level. Inconsistent change in patterns of mean parity across various categories
of the women in different age groups, in general, reveals that fertility transition has not yet started in rural
Ethiopia, where the majority of the population is living. Considerable change in fertility may not be observed
in this country unless there are significant changes in fertility among the majority of the rural and uneducated
women. A decline in fertility among selective groups (i.e. those residing in urban areas and attaining secondary
and higher level education) alone would not alter the situation at the national level. Fertility transition is
impossible when changes are confined to selective groups.

In-depth Analysis of the Ethiopian Demographic and Health Survey 200526
6.2 Levels and Differentials in Age at first Marriage, First Birth and Birth Intervals
Variation in birth intervals could be one of the factors affecting the total number of children a woman would
have at the end of her reproductive life (Jejeebhoy, 1995). In non-contraceptive population, if marriage is
stable and entry into marital life is early, fertility would definitely be higher as most of the women are at the
risk of pregnancy starting from early ages. The total number of children born to a woman could, however,
be less if there are interruptions in marital life and the tradition in a given society would not allow sexual
consummation shortly after child delivery and there is a tendency to breast feed a child for longer duration
without supplementary food.
In Ethiopia, where marriage is universal and takes place early (Desta and Seyoum, 1998) and the means to
control fertility is not widely available, traditional norms and values such as duration of breast-feeding and
postpartum sexual abstinence are expected to have non-negligible effect on the interval between consecutive
births. Assessing the timing of entry into marital life and extent of marital instability may also help to explain
the effect of such cultural norms and values on fertility behaviour of Ethiopian women.
Evidences from the current study show that average age at entry into marital life appears to be the lowest
(i.e. 15 years) among women residing in Amhara and Benishangul Gumuz regions followed by those residing
in Gambella and Tigray (16 years each). Highest age of entry into marital life is, however, observed among
those living in urban dominant regions: Addis Ababa (25 years), Dire Dawa and Harari Region (21 years each).
Median age of entry into marital life is 16 years among rural women of Ethiopia, still below the minimum age of
marriage stipulated in the National Population Policy of Ethiopia (NOP, 1993) and the recently adopted Revised
Family Law (FDRE, 2000). Since marriage takes place early in rural Ethiopia, child delivery is also taking place
early. Median age at first birth among rural women is 19 years (table 3).
Levels, Trends and Determinants of Lifetime and Desired Fertility in Ethiopia 27
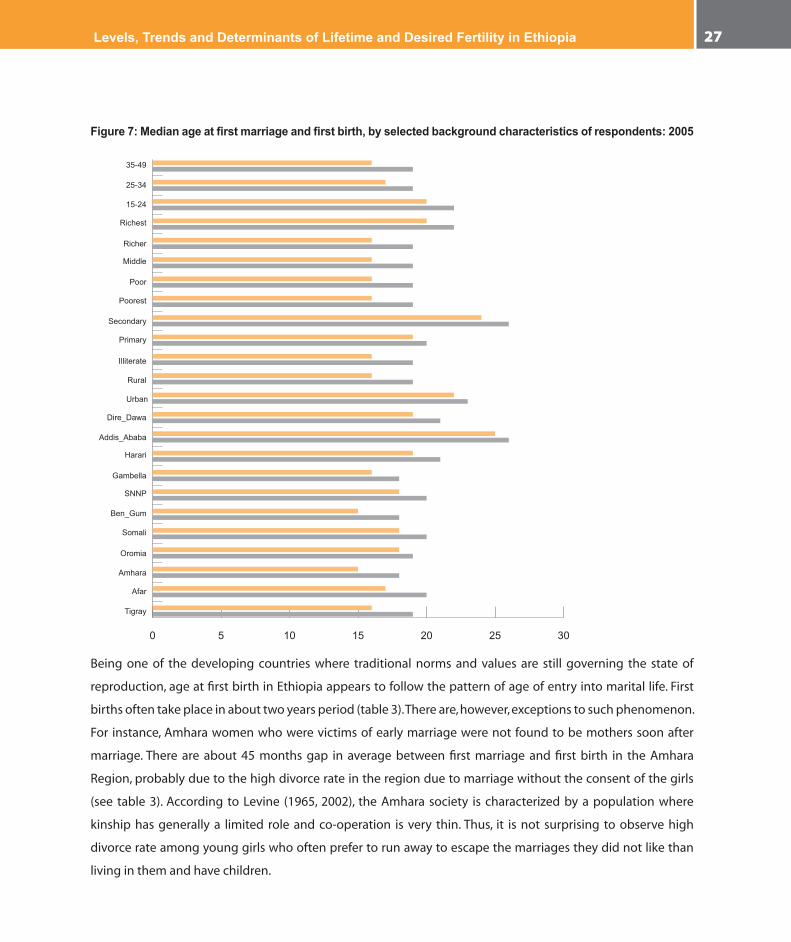
Figure 7: Median age at first marriage and first birth, by selected background characteristics of respondents: 2005
35-49
25-34
15-24
Richest
Richer
Middle
Poor
Poorest
Illiterate
Primary
Secondary
Rural
Urban
Dire_Dawa
Addis_Ababa
Harari
Gambella
SNNP
Ben_Gum
Somali
Oromia
Amhara
Afar
Tigray
0 5 10 15 20 25 30
Being one of the developing countries where traditional norms and values are still governing the state of
reproduction, age at first birth in Ethiopia appears to follow the pattern of age of entry into marital life. First
births often take place in about two years period (table 3). There are, however, exceptions to such phenomenon.
For instance, Amhara women who were victims of early marriage were not found to be mothers soon after
marriage. There are about 45 months gap in average between first marriage and first birth in the Amhara
Region, probably due to the high divorce rate in the region due to marriage without the consent of the girls
(see table 3). According to Levine (1965, 2002), the Amhara society is characterized by a population where
kinship has generally a limited role and co-operation is very thin. Thus, it is not surprising to observe high
divorce rate among young girls who often prefer to run away to escape the marriages they did not like than
living in them and have children.

In-depth Analysis of the Ethiopian Demographic and Health Survey 200528
Unlike what is mentioned above, the gap between age at first marriage and birth is shorter for those women
who marry late. For instance, the gap between age at first marriage and first birth is less than two years in Addis
Ababa where marriage tends to be late. Women in Addis Ababa, on average marry in their mid 20s (table 3).
Premarital consensual union is also evolving in the city (Eshetu, 2005).
As observed from the data, teenage pregnancy and motherhood is one of the serious problems in rural areas
and most of the regions. Though median age at first birth is 20 years at national level, most of the uneducated
and rural women are at high risk of teenage pregnancy and motherhood. Further analysis of data by age cohorts
of women, however, shows that there is a slight change in the timing of first marriage and child delivery (see
figure7). The median age at first marriage and birth among those in their early reproductive age (i.e. 15-24 years
cohort) has increased to 20 and 22 years, respectively. Though it is an indication of progress with the ongoing
effort to overcome the problems of early marriage and teenage pregnancy, the situation is still worse as most
of the rural and uneducated women are at the risk of early marriage and teenage motherhood. Only women
with secondary and higher education as well as those residing in Addis Ababa and other urban areas are in a
better position as far as entry into marital life and motherhood are concerned. With the exception of women in
the highest category of wealth status to some extent, no difference is observed in their timing of marriage and
first birth. The evidences suggest that socio-cultural traditions in Ethiopia appear to have significant effects in
determining timing of births and marriage than access to resources at the household level.
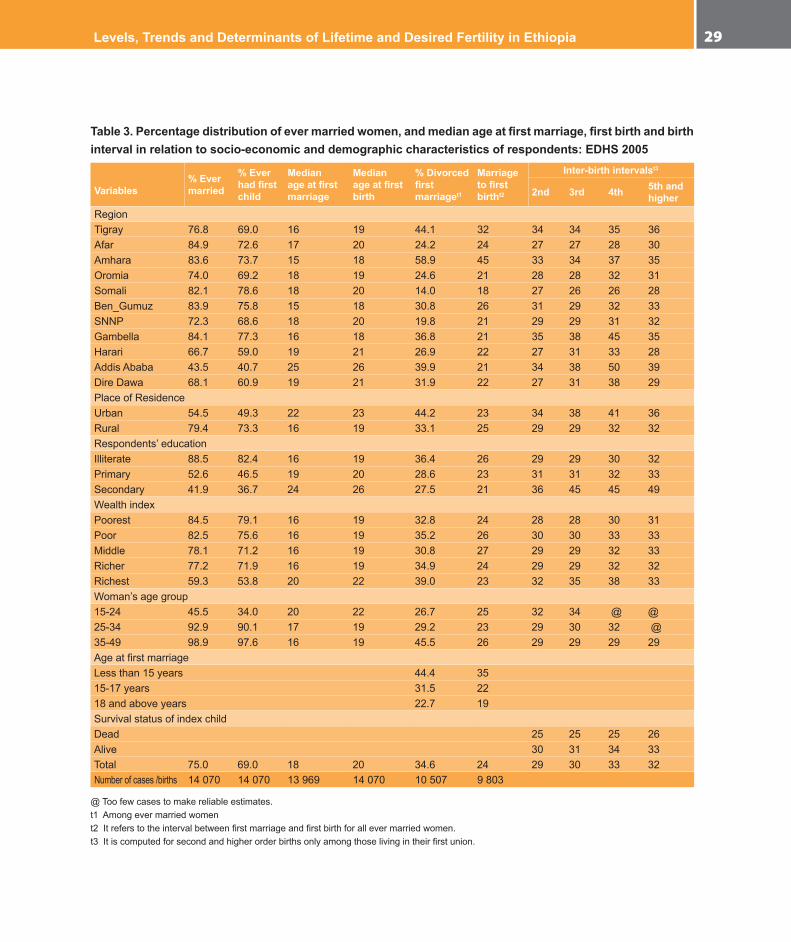
The average span between first marriage and first birth is found to be 24 months at the national level with a
difference of two months between urban (25 months) and rural (23 months) residents (table 3). Longer interval
between first marriage and first birth is documented in Amhara Region (45 months), followed by those residing
in Tigray Region (32 months), where early age at first marriage is quite evident. Looking at the interrelationship
between age at first marriage and age at first birth, one can easily notice longer interval among those who got
married very early (i.e. before age 15) but shorter interval among those who got married after age 18 (table 3).
Levels, Trends and Determinants of Lifetime and Desired Fertility in Ethiopia 29
Table 3. Percentage distribution of ever married women, and median age at first marriage, first birth and birth interval in relation to socio-economic and demographic characteristics of respondents: EDHS 2005
Variables% Ever married
% Ever had first child
Medianage at first marriage
Median age at first birth
% Divorced first marriaget1
Marriage to first birtht2
Inter-birth intervalst3
2nd 3rd 4th 5th and higher
RegionTigray 76.8 69.0 16 19 44.1 32 34 34 35 36Afar 84.9 72.6 17 20 24.2 24 27 27 28 30Amhara 83.6 73.7 15 18 58.9 45 33 34 37 35Oromia 74.0 69.2 18 19 24.6 21 28 28 32 31Somali 82.1 78.6 18 20 14.0 18 27 26 26 28Ben_Gumuz 83.9 75.8 15 18 30.8 26 31 29 32 33SNNP 72.3 68.6 18 20 19.8 21 29 29 31 32Gambella 84.1 77.3 16 18 36.8 21 35 38 45 35Harari 66.7 59.0 19 21 26.9 22 27 31 33 28AddisAbaba 43.5 40.7 25 26 39.9 21 34 38 50 39DireDawa 68.1 60.9 19 21 31.9 22 27 31 38 29PlaceofResidenceUrban 54.5 49.3 22 23 44.2 23 34 38 41 36Rural 79.4 73.3 16 19 33.1 25 29 29 32 32Respondents’educationIlliterate 88.5 82.4 16 19 36.4 26 29 29 30 32Primary 52.6 46.5 19 20 28.6 23 31 31 32 33Secondary 41.9 36.7 24 26 27.5 21 36 45 45 49WealthindexPoorest 84.5 79.1 16 19 32.8 24 28 28 30 31Poor 82.5 75.6 16 19 35.2 26 30 30 33 33Middle 78.1 71.2 16 19 30.8 27 29 29 32 33Richer 77.2 71.9 16 19 34.9 24 29 29 32 32Richest 59.3 53.8 20 22 39.0 23 32 35 38 33Woman’sagegroup15-24 45.5 34.0 20 22 26.7 25 32 34 @ @25-34 92.9 90.1 17 19 29.2 23 29 30 32 @35-49 98.9 97.6 16 19 45.5 26 29 29 29 29AgeatfirstmarriageLessthan15years 44.4 3515-17years 31.5 2218andaboveyears 22.7 19SurvivalstatusofindexchildDead 25 25 25 26Alive 30 31 34 33Total 75.0 69.0 18 20 34.6 24 29 30 33 32Numberofcases/births 14070 14070 13969 14070 10507 9803
@Toofewcasestomakereliableestimates.t1Amongevermarriedwoment2Itreferstotheintervalbetweenfirstmarriageandfirstbirthforallevermarriedwomen.t3Itiscomputedforsecondandhigherorderbirthsonlyamongthoselivingintheirfirstunion.

In-depth Analysis of the Ethiopian Demographic and Health Survey 200530
This could be due to the effect of marital instability among those who got married early. Further analysis of
data on the stability of first marriage, by the time of the survey, revealed that 60 percent and 44 percent of
women residing in Amhara and Tigray regions, respectively, were not living in their first marriage. Most of them
are assumed to end their marriage in divorce due to the arrangement of the union by their respective parents
without their consent (Tilson and Larsen, 2000).
Essentially due to getting married at later ages, educated women often have their first babies within shorter
interval after marriage. Interruption of first marriage among this group of women was also found to be the
least (27 percent) as compared to those who have never been to school (36.4 percent). Not much change in
the interval between first marriage and first birth is, however, observed among women belonging to various
categories of wealth status across different age cohorts (table 3).
Non-first birth intervals between consecutive births were also computed for women living in their first
marriage at the time of the survey, to overcome the effect of marital disruption. In addition to women residing
in urban areas and attaining secondary and above education, women living in Tigray, Amhara, Gambella and
Addis Ababa were found to experience longer inter-birth intervals. They exhibited over 33 months of gap
between second and higher order consecutive births, while women in other categories were observed having
a relatively shorter interval between births. The inter-birth interval in Somali, Afar and Oromia regions are,
specifically, the shortest. These figures are even lower than the national average among all birth orders.
An immediate fertility response to the effects of infant/child mortality is clearly manifested across all births as
shorter inter-birth intervals are documented for those losing their index child to death. Women experiencing
child death, on average, got pregnant six months earlier than those who never faced the problem. Like the
situations observed in the analysis of mean parities, a consistent increase in inter-birth intervals is observed only
among women attaining secondary and higher level of education and those residing in urban areas (see table 3).
Levels, Trends and Determinants of Lifetime and Desired Fertility in Ethiopia 31
6.3 Determinants of Lifetime Fertility in Ethiopia
A Poisson regression model was fitted to assess factors affecting lifetime fertility among currently married
women of reproductive age. This model is preferred to others since it has the potential to indicate determinants
of lifetime fertility by taking children ever born as count data (Winkelmann and Zimmermann, 1995). Knowledge
of fertility determinants is crucial to take action towards regulating the occurrence of births among those
experiencing relatively higher fertility and encouraging others to maintain existing status quo even if they do
not want to get their fertility reduced. In order to observe determinants of lifetime fertility among women in
different age categories, the model was fitted for all women as well as those belonging to different reproductive
age cohorts: early (15-24), peak (25-34) and late (35-49). Explanatory variables included in the model are region,
place of residence, educational level, religious affiliation, access to media, wealth index, child loss experience,
experience in contraceptive use, age at first marriage and woman’s decision-making autonomy. A woman’s age
and age square are also included in the model as covariance.
In conformity to the results of the bivariate analyses, low fertility is observed among urban residents, those
achieving secondary and above education, women who have frequent access to media, employed in the
modern sector of the economy and are getting married after age 18. High fertility, on the other hand, prevailed
among those experiencing child loss and women residing in some of the regions where values of children are
supposed to be high. No statistically significant differences in lifetime fertility is, however, observed among
women belonging to different categories of wealth status and decision-making autonomy, suggesting that
development factors have not yet fully penetrated into fertility regulation as far as the Ethiopian situation is
considered.
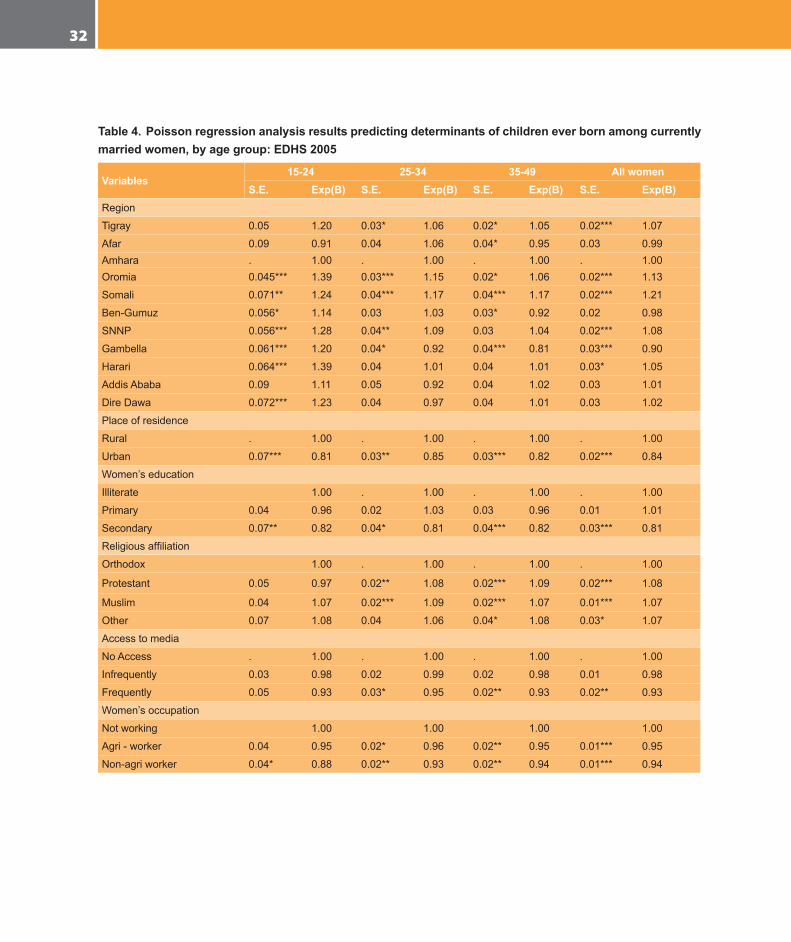
Lifetime fertility has been reduce by ((1-EXP(β))*100) 16 percent among residents of urban areas as compared to
those residing in the countryside (table 4). The extent of variation is nearly the same among women belonging
to different age cohorts as well. Similarly, lifetime fertility has shown a declining trend among those attaining
secondary and above education by 19 percent compared to those who have never been to school. Similar
trend is, more or less, observed among women belonging to different age cohorts when educational level
is taken into account. Frequent access to media as well as gainful employment both in agricultural and non-
agricultural work also tend to reduce fertility (by about six percent each) compared to those who have no
access to media and not working, respectively (see table 4).
In-depth Analysis of the Ethiopian Demographic and Health Survey 200532
Table 4. Poisson regression analysis results predicting determinants of children ever born among currently married women, by age group: EDHS 2005
Variables15-24 25-34 35-49 All women
S.E. Exp(B) S.E. Exp(B) S.E. Exp(B) S.E. Exp(B)Region
Tigray 0.05 1.20 0.03* 1.06 0.02* 1.05 0.02*** 1.07
Afar 0.09 0.91 0.04 1.06 0.04* 0.95 0.03 0.99Amhara . 1.00 . 1.00 . 1.00 . 1.00Oromia 0.045*** 1.39 0.03*** 1.15 0.02* 1.06 0.02*** 1.13
Somali 0.071** 1.24 0.04*** 1.17 0.04*** 1.17 0.02*** 1.21
Ben-Gumuz 0.056* 1.14 0.03 1.03 0.03* 0.92 0.02 0.98
SNNP 0.056*** 1.28 0.04** 1.09 0.03 1.04 0.02*** 1.08
Gambella 0.061*** 1.20 0.04* 0.92 0.04*** 0.81 0.03*** 0.90
Harari 0.064*** 1.39 0.04 1.01 0.04 1.01 0.03* 1.05
AddisAbaba 0.09 1.11 0.05 0.92 0.04 1.02 0.03 1.01
DireDawa 0.072*** 1.23 0.04 0.97 0.04 1.01 0.03 1.02
Placeofresidence
Rural . 1.00 . 1.00 . 1.00 . 1.00
Urban 0.07*** 0.81 0.03** 0.85 0.03*** 0.82 0.02*** 0.84
Women’seducation
Illiterate 1.00 . 1.00 . 1.00 . 1.00
Primary 0.04 0.96 0.02 1.03 0.03 0.96 0.01 1.01
Secondary 0.07** 0.82 0.04* 0.81 0.04*** 0.82 0.03*** 0.81
Religiousaffiliation
Orthodox 1.00 . 1.00 . 1.00 . 1.00
Protestant 0.05 0.97 0.02** 1.08 0.02*** 1.09 0.02*** 1.08
Muslim 0.04 1.07 0.02*** 1.09 0.02*** 1.07 0.01*** 1.07
Other 0.07 1.08 0.04 1.06 0.04* 1.08 0.03* 1.07
Accesstomedia
NoAccess . 1.00 . 1.00 . 1.00 . 1.00
Infrequently 0.03 0.98 0.02 0.99 0.02 0.98 0.01 0.98
Frequently 0.05 0.93 0.03* 0.95 0.02** 0.93 0.02** 0.93
Women’soccupation
Notworking 1.00 1.00 1.00 1.00
Agri-worker 0.04 0.95 0.02* 0.96 0.02** 0.95 0.01*** 0.95
Non-agriworker 0.04* 0.88 0.02** 0.93 0.02** 0.94 0.01*** 0.94
Levels, Trends and Determinants of Lifetime and Desired Fertility in Ethiopia 33
Table 4. Poisson regression analysis results … among currently married women (cont’d)
Variables15-24 25-34 35-49 All women
S.E. Exp(B) S.E. Exp(B) S.E. Exp(B) S.E. Exp(B)WealthindexPoorest . 1.00 . 1.00 . 1.00 . 1.00Poor 0.04 0.93 0.02 0.98 0.02 0.98 0.01 0.98Middle 0.04 0.95 0.02 1.00 0.02 1.01 0.02 1.00Richer 0.04 0.99 0.02 1.01 0.02 1.06 0.02* 1.03Richest 0.06 1.03 0.03 0.99 0.03 1.02 0.02 0.99ChildlossexperienceNone . 1.00 . 1.00 . 1.00 . 1.00One 0.03*** 1.39 0.02*** 1.24 0.02*** 1.21 0.01*** 1.25Atleasttwo 0.05*** 1.96 0.02*** 1.46 0.02*** 1.44 0.01*** 1.45ContraceptiveuseNon-use . 1.00 . 1.00 . 1.00 . 1.00Everuse 0.03 1.02 0.02** 1.05 0.02*** 1.14 0.01*** 1.09AgeatfirstmarriageBefore18yrs 1.00 1.00 1.00 . 1.0018+yrs 0.04*** 0.45 0.02*** 0.69 0.02*** 0.86 0.01*** 0.76Women’sdecision-makingautonomy
Low 1.00 1.00 1.00 . 1.00Medium 0.03 1.04 .014 1.02 0.02 0.99 0.01 1.01High 0.04 0.94 .021 1.02 0.02 0.99 0.01 0.99Age 0.13*** 3.50 .05*** 1.43 0.03** 1.11 0.00*** 1.28Agesquared 0.01*** 0.98 .01*** 0.99 0.00** 0.99 0.00*** 1.00Intercept 1.37*** 0.00 .75*** 0.01 0.64* 0.08 0.08*** .029Totalnumberofcases 2163 3402 2960 8397
Referencecategorieshaveavalueof1.00forExp(B).
Source:Computedbytheauthorfrom2005EDHSdataset.
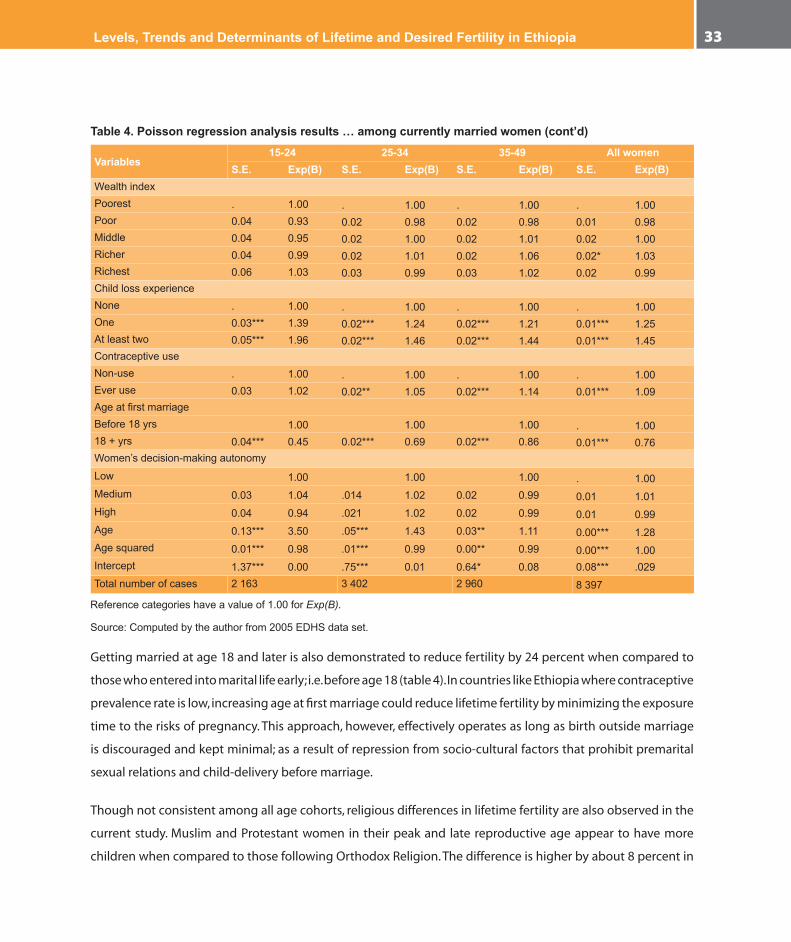
Getting married at age 18 and later is also demonstrated to reduce fertility by 24 percent when compared to
those who entered into marital life early; i.e. before age 18 (table 4). In countries like Ethiopia where contraceptive
prevalence rate is low, increasing age at first marriage could reduce lifetime fertility by minimizing the exposure
time to the risks of pregnancy. This approach, however, effectively operates as long as birth outside marriage
is discouraged and kept minimal; as a result of repression from socio-cultural factors that prohibit premarital
sexual relations and child-delivery before marriage.
Though not consistent among all age cohorts, religious differences in lifetime fertility are also observed in the
current study. Muslim and Protestant women in their peak and late reproductive age appear to have more
children when compared to those following Orthodox Religion. The difference is higher by about 8 percent in
In-depth Analysis of the Ethiopian Demographic and Health Survey 200534
each of the groups, and that is statistically significant (see table 4). Further analysis of the data by rural/urban
settings, however, reveals that higher lifetime fertility is observed among Muslims living in urban areas while
Protestants in rural areas tend to have larger family (data not shown here). The rationale behind having higher
fertility among the Protestant religion followers in Ethiopia, which is contrary to the global situation1, again
needs further investigation. Despite showing a signal for fertility decline, no statistically significant difference
in lifetime fertility is observed among those attaining primary level education and having infrequent access to
media. Their lifetime fertility is nearly the same as those taken as a reference category.
There are significant differences in lifetime fertility among women residing in different regions of the country.
When Amhara Region, which has a completed mean parity closer to the national average (CSA and ORC Macro,
2006), is taken as a reference category, Tigray, Oromia, Somali and SNNP regions appear to have higher lifetime
fertility while Gambella Region was found to have the lowest fertility rate. Lifetime fertility in Somali Region
is found to be higher by 21 percent when compared to the level in Amhara Region, followed by Oromia (13
percent), SNNP (8 percent), Tigray (7 percent) and Harari regions (5 percent). It is only women in the Gambella
Region that exhibit 10 percent lower lifetime fertility. Women residing in other regions tend to have relatively
the same lifetime fertility as that of women living in the Amhara Region when other confounding factors are
held constant (table 4). Apart from slight changes among those women in their early reproductive age, lifetime
fertility among women in the peak and late reproductive ages tends to replicate the situation observed among
all women of reproductive age. The reason behind fluctuations in lifetime fertility among women in the early
childbearing ages is partly due to the tendency of shifting the timing of births to later ages without intending
to minimize desired family size or reduce the total number of children they wish to have in their lifetime.
According to results given in table 4, high fertility is observed among women experiencing child mortality.
Death of a child tends to increase lifetime fertility by 25 percent while the death of two or more children
increases it by 45 percent among all women of reproductive age. Fertility response to death of one and
more children is, however, the highest (39 and 96 percent, respectively) among women in early childbearing
ages indicating that child survival has significant effect on fertility if it happens at the very beginning. Even
among women in their late reproductive age, fertility response to child death is considerable: 21 percent and
44 percent, for those losing one and two or more children, respectively. On the basis of such evidences, one
could, therefore, argue that making efforts towards reducing infant and child mortality in Ethiopia could lead
to further decline in fertility in the long run.
1Protestantreligionfollowersareexpectedtohaveliberalstandontheuseoffamilyplanningmethods,andthushavesmallfamilynorm(Tawiah,1984).
Levels, Trends and Determinants of Lifetime and Desired Fertility in Ethiopia 35
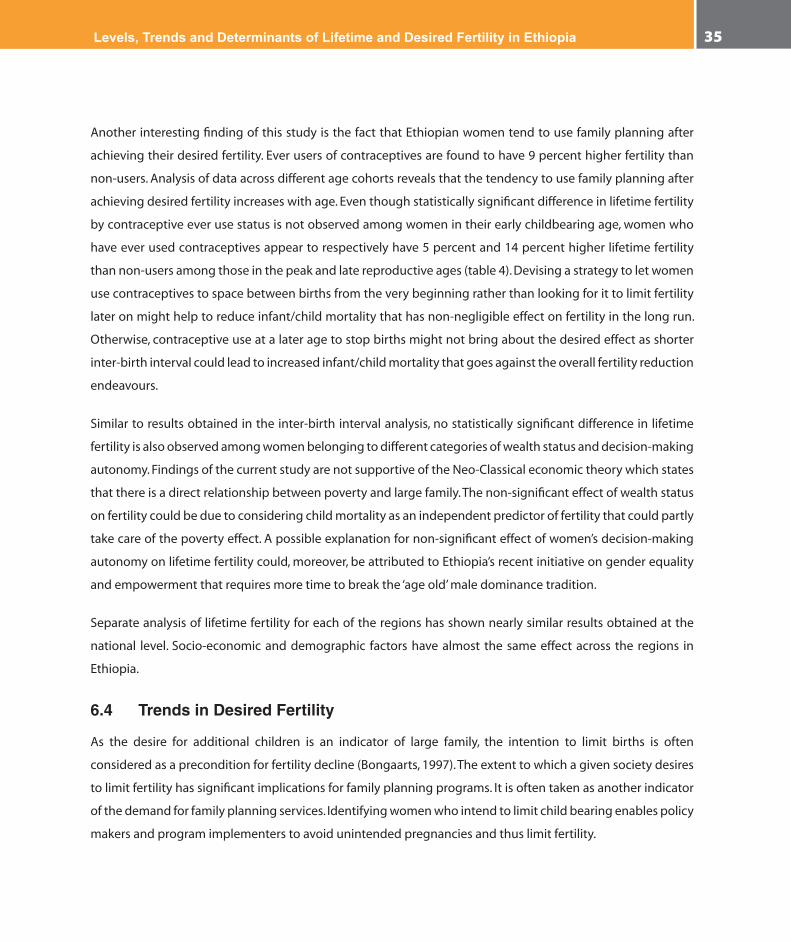
Another interesting finding of this study is the fact that Ethiopian women tend to use family planning after
achieving their desired fertility. Ever users of contraceptives are found to have 9 percent higher fertility than
non-users. Analysis of data across different age cohorts reveals that the tendency to use family planning after
achieving desired fertility increases with age. Even though statistically significant difference in lifetime fertility
by contraceptive ever use status is not observed among women in their early childbearing age, women who
have ever used contraceptives appear to respectively have 5 percent and 14 percent higher lifetime fertility
than non-users among those in the peak and late reproductive ages (table 4). Devising a strategy to let women
use contraceptives to space between births from the very beginning rather than looking for it to limit fertility
later on might help to reduce infant/child mortality that has non-negligible effect on fertility in the long run.
Otherwise, contraceptive use at a later age to stop births might not bring about the desired effect as shorter
inter-birth interval could lead to increased infant/child mortality that goes against the overall fertility reduction
endeavours.
Similar to results obtained in the inter-birth interval analysis, no statistically significant difference in lifetime
fertility is also observed among women belonging to different categories of wealth status and decision-making
autonomy. Findings of the current study are not supportive of the Neo-Classical economic theory which states
that there is a direct relationship between poverty and large family. The non-significant effect of wealth status
on fertility could be due to considering child mortality as an independent predictor of fertility that could partly
take care of the poverty effect. A possible explanation for non-significant effect of women’s decision-making
autonomy on lifetime fertility could, moreover, be attributed to Ethiopia’s recent initiative on gender equality
and empowerment that requires more time to break the ‘age old’ male dominance tradition.
Separate analysis of lifetime fertility for each of the regions has shown nearly similar results obtained at the
national level. Socio-economic and demographic factors have almost the same effect across the regions in
Ethiopia.
6.4 Trends in Desired Fertility
As the desire for additional children is an indicator of large family, the intention to limit births is often
considered as a precondition for fertility decline (Bongaarts, 1997). The extent to which a given society desires
to limit fertility has significant implications for family planning programs. It is often taken as another indicator
of the demand for family planning services. Identifying women who intend to limit child bearing enables policy
makers and program implementers to avoid unintended pregnancies and thus limit fertility.

In-depth Analysis of the Ethiopian Demographic and Health Survey 200536
Table 5. Trends and differentials in percentage of currently married women who do not want additional children, by background characteristics of respondents: EDHS 2000 and 2005
Explanatory variablesPercentage of women who do not want
additional children Change2000 2005 χ2
RegionTigray 26.4 29.3 1.203Afar 16.2 19.6 0.437Amhara 43.0 48.4 14.383*** +Oromia 30.7 47.9 210.544*** +Somali 11.2 11.1 0.002BenishangulGumuz 33.3 42.0 1.575SNNP 26.0 38.5 72.693*** +Gambella 28.6 45.2 1.732Harari 40.9 40.9 0.000AddisAbaba 47.5 49.5 0.188DireDawa 35.1 38.2 0.073PlaceofresidenceUrban 40.9 48.2 11.119** +Rural 31.6 42.3 198.740*** +Respondents’educationIlliterate 32.9 44.0 190.601*** +Primary 29.7 39.9 28.714*** +Secondary 36.7 36.8 0.001Respondents’agegroup15-24 11.1 18.9 58.528*** +25-34 27.2 36.9 78.762*** +35-49 56.9 68.5 88.483*** +Total 32.7 42.9 201.638*** +
***=P<0.000 **=P<0.01 *=p<0.05
According to results obtained from the 2000 and 2005 EDHS data, the proportion of women who want no
additional children increased from 32.7 to 42.9 percent (table 5), and the difference is statistically significant.
Though there is an increase in proportion of women who want no additional children among rural and urban
residents and in all age cohorts, commendable difference in the intention to limit additional birth is only
observed among women having no and primary level education and those living in Amhara, Oromia and SNNP
regions. A statistically significant increase among women belonging to all age groups and living in rural as
well as urban areas indicates that there is a potential for fertility decline if appropriate measures are taken to
support those who want to limit their fertility through provision of family planning services and improving
child survival status (see table 4).
No considerable change in the desire to limit additional birth is, however, observed among women living in the
three urban dominant regions (Addis Ababa, Dire Dawa and Harari) and those attaining secondary and above
Levels, Trends and Determinants of Lifetime and Desired Fertility in Ethiopia 37
education (table 5), probably due to their relatively better access to family planning services. Much difference
in the intention to limit fertility, during the interval between the two surveys, was also not observed among
women living in the peripheral regions (Afar, Benishangul Gumuz and Gambella) may be due to their low
level of actual fertility, which needs further investigation by administering special surveys and conducting
qualitative studies. Exceptional in the current study is the very little intention to limit fertility, despite having
large family sizes, among women residing in the Somali Region (see table 5).
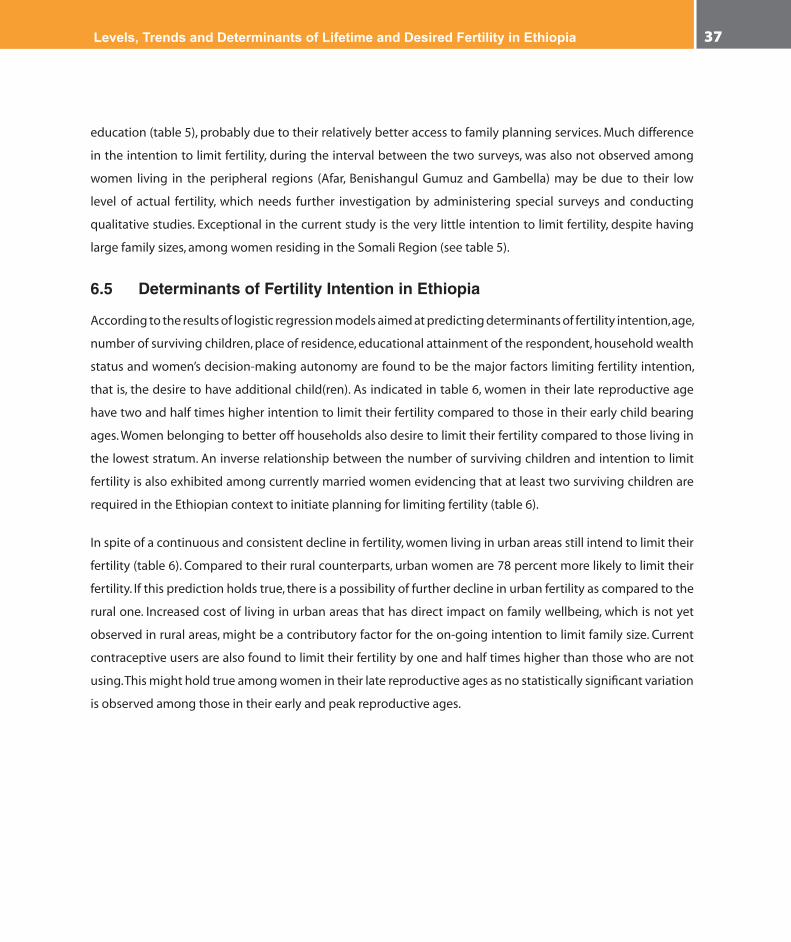
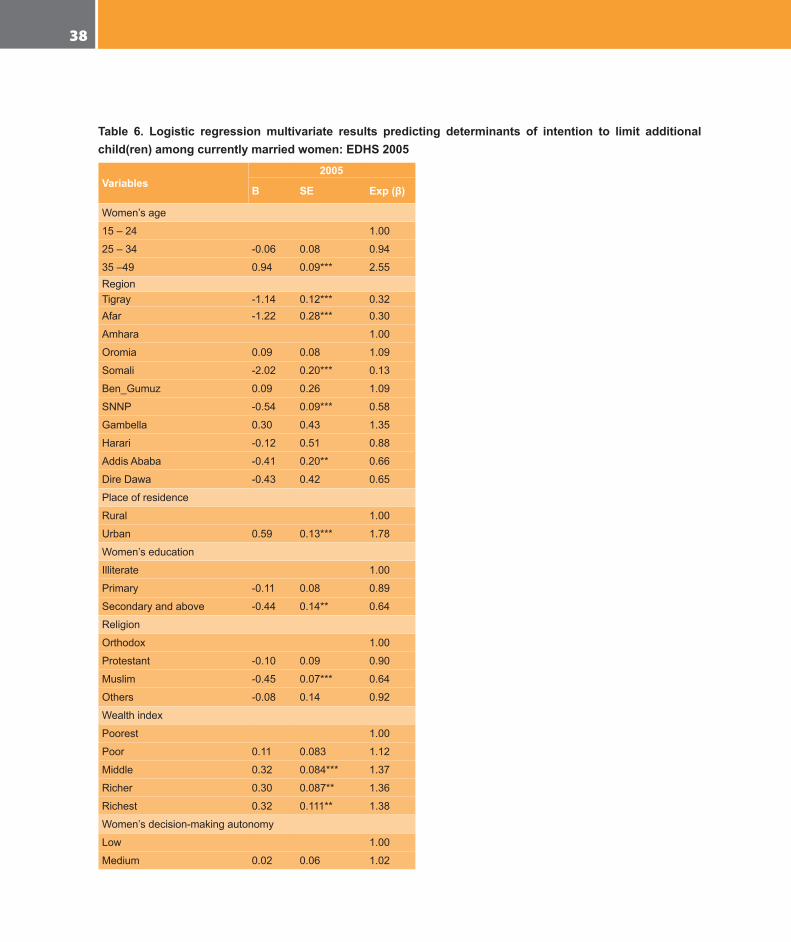
6.5 Determinants of Fertility Intention in Ethiopia
According to the results of logistic regression models aimed at predicting determinants of fertility intention, age,
number of surviving children, place of residence, educational attainment of the respondent, household wealth
status and women’s decision-making autonomy are found to be the major factors limiting fertility intention,
that is, the desire to have additional child(ren). As indicated in table 6, women in their late reproductive age
have two and half times higher intention to limit their fertility compared to those in their early child bearing
ages. Women belonging to better off households also desire to limit their fertility compared to those living in
the lowest stratum. An inverse relationship between the number of surviving children and intention to limit
fertility is also exhibited among currently married women evidencing that at least two surviving children are
required in the Ethiopian context to initiate planning for limiting fertility (table 6).
In spite of a continuous and consistent decline in fertility, women living in urban areas still intend to limit their
fertility (table 6). Compared to their rural counterparts, urban women are 78 percent more likely to limit their
fertility. If this prediction holds true, there is a possibility of further decline in urban fertility as compared to the
rural one. Increased cost of living in urban areas that has direct impact on family wellbeing, which is not yet
observed in rural areas, might be a contributory factor for the on-going intention to limit family size. Current
contraceptive users are also found to limit their fertility by one and half times higher than those who are not
using. This might hold true among women in their late reproductive ages as no statistically significant variation
is observed among those in their early and peak reproductive ages.
In-depth Analysis of the Ethiopian Demographic and Health Survey 200538
Table 6. Logistic regression multivariate results predicting determinants of intention to limit additional child(ren) among currently married women: EDHS 2005
Variables2005
Β SE Exp (β)
Women’sage
15–24 1.00
25–34 -0.06 0.08 0.94
35–49 0.94 0.09*** 2.55RegionTigray -1.14 0.12*** 0.32Afar -1.22 0.28*** 0.30
Amhara 1.00
Oromia 0.09 0.08 1.09
Somali -2.02 0.20*** 0.13
Ben_Gumuz 0.09 0.26 1.09
SNNP -0.54 0.09*** 0.58
Gambella 0.30 0.43 1.35
Harari -0.12 0.51 0.88
AddisAbaba -0.41 0.20** 0.66
DireDawa -0.43 0.42 0.65
Placeofresidence
Rural 1.00
Urban 0.59 0.13*** 1.78
Women’seducation
Illiterate 1.00
Primary -0.11 0.08 0.89
Secondaryandabove -0.44 0.14** 0.64
Religion
Orthodox 1.00
Protestant -0.10 0.09 0.90
Muslim -0.45 0.07*** 0.64
Others -0.08 0.14 0.92
Wealthindex
Poorest 1.00
Poor 0.11 0.083 1.12
Middle 0.32 0.084*** 1.37
Richer 0.30 0.087** 1.36
Richest 0.32 0.111** 1.38
Women’sdecision-makingautonomy
Low 1.00
Medium 0.02 0.06 1.02
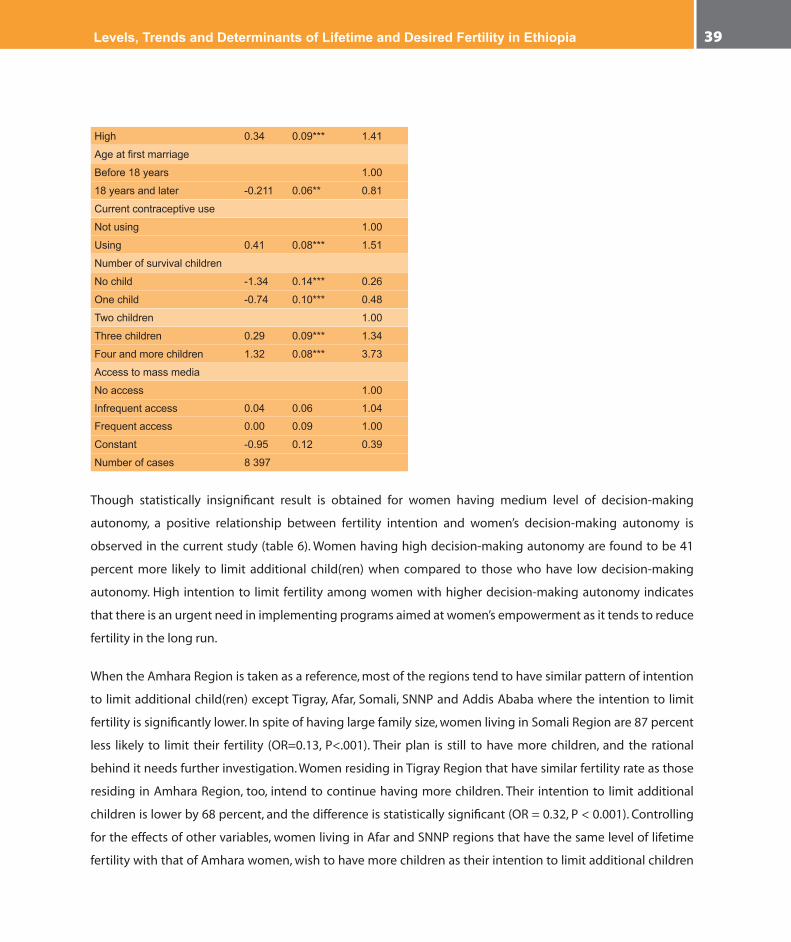
Levels, Trends and Determinants of Lifetime and Desired Fertility in Ethiopia 39
High 0.34 0.09*** 1.41
Ageatfirstmarriage
Before18years 1.00
18yearsandlater -0.211 0.06** 0.81
Currentcontraceptiveuse
Notusing 1.00
Using 0.41 0.08*** 1.51
Numberofsurvivalchildren
Nochild -1.34 0.14*** 0.26
Onechild -0.74 0.10*** 0.48
Twochildren 1.00
Threechildren 0.29 0.09*** 1.34
Fourandmorechildren 1.32 0.08*** 3.73
Accesstomassmedia
Noaccess 1.00
Infrequentaccess 0.04 0.06 1.04
Frequentaccess 0.00 0.09 1.00
Constant -0.95 0.12 0.39
Numberofcases 8397
Though statistically insignificant result is obtained for women having medium level of decision-making
autonomy, a positive relationship between fertility intention and women’s decision-making autonomy is
observed in the current study (table 6). Women having high decision-making autonomy are found to be 41
percent more likely to limit additional child(ren) when compared to those who have low decision-making
autonomy. High intention to limit fertility among women with higher decision-making autonomy indicates
that there is an urgent need in implementing programs aimed at women’s empowerment as it tends to reduce
fertility in the long run.
When the Amhara Region is taken as a reference, most of the regions tend to have similar pattern of intention
to limit additional child(ren) except Tigray, Afar, Somali, SNNP and Addis Ababa where the intention to limit
fertility is significantly lower. In spite of having large family size, women living in Somali Region are 87 percent
less likely to limit their fertility (OR=0.13, P<.001). Their plan is still to have more children, and the rational
behind it needs further investigation. Women residing in Tigray Region that have similar fertility rate as those
residing in Amhara Region, too, intend to continue having more children. Their intention to limit additional
children is lower by 68 percent, and the difference is statistically significant (OR = 0.32, P < 0.001). Controlling
for the effects of other variables, women living in Afar and SNNP regions that have the same level of lifetime
fertility with that of Amhara women, wish to have more children as their intention to limit additional children

In-depth Analysis of the Ethiopian Demographic and Health Survey 200540
is lower by 70 percent and 42 percent, respectively (table 6). Due to the low fertility level observed at the
moment, women living in Addis Ababa have not shown any intention to limit their fertility further (OR = 0.66,
P<.001). Rather they have plans to have more children assuming that there would be improvement in living
conditions as a result of provision of residential quarters, better employment opportunities, etc. No intention
to limit additional birth is also documented among women having secondary and higher level education (OR
= 0.64, P < 0.001) and those who got married late (OR = 0.81, P< .01) basically due to their prior arrangements
to have fewer births.
As a whole, the intention to limit additional child(ren) tends to go hand in hand with the extent of unmet
need for family planning. Women who reported high unmet need for family planning were also observed
having high intention to limit fertility (data not shown here). On the basis of available evidences, it is possible
to anticipate that meeting the unmet needs for family planning could reduce fertility further.
Levels, Trends and Determinants of Lifetime and Desired Fertility in Ethiopia 41
7. Discussions of Major Findings
Fertility has declined among some selected groups and regions of Ethiopia. Different factors ranging from
modernization elements such as attainment of better education and residing in urban areas to traditional
fertility control mechanisms are responsible for variation in fertility level in the country. Factors like kin support
and pressure from extended family members, gender inequality and patriarchy, high infant and child mortality
rates, early and universal marriage are responsible for high fertility both at national and regional levels. On the
other hand, increased cost of living in urban areas and prolonged duration of breast-feeding as well as longer
postpartum amenorrhea are factors inhibiting large family size.
Increased cost of raising children motivates couples to limit family size
According to Caldwell (1982), in societies where the cost of child rearing is shared between family members
neither the poor nor the rich wish to limit family size. Here any attempt to control birth is socially disapproved
for there is support in bringing up the child (Foster, 1975). Compulsory education is one of the important factors
calling for increased costs of raising children (Van de Walle and Foster, 1990). Active participation of children in
the schooling system reduces their contribution to household economy through participation in the production
system. As education is not yet taken as a decisive and necessary condition for future life of children in rural
Ethiopia, a greater proportion of rural parents have not yet developed the habit of sending their children to
school though the trend is showing improvement recently. As most of the children are spending their childhood
and adolescent age working on the farm land or looking after herds, there is little or no burden of raising
children among rural families. With the exception of urban residents, a greater proportion of Ethiopian women
in the reproductive age groups have not yet adopted modern birth control methods. The current contraceptive
prevalence rate in rural Ethiopia is 10.9 vis-à-vis 46.7 percent in urban Ethiopia (CSA and ORC Macro, 2006)
indicating that there are many initiatives to reduce fertility in urban communities than in rural villages.
Qualitative information collected to triangulate statistical findings also revealed that there are differences in the
perception of cost of raising children among rural and urban residents of Ethiopia. According to the consensus reached
at by most of the focus group discussion participants, high values traditionally attached to children are getting revised
among urban residents of Ethiopia since the social system fails to carry on their expectations due to the dominance
of the economy by secondary and tertiary sectors that limit the participation of children in the production process. An
increase in the costs of living in urban Ethiopia is believed to reduce family size mainly through increasing the active
participation of husbands in the joint decision on the desired family size. Contrary to this, husbands in rural areas exert
more pressure on their wives to have additional children as they are assets than being liabilities.
In-depth Analysis of the Ethiopian Demographic and Health Survey 200542
Gender inequality and patriarchy tend to promote large family size
Culturally, men are in need of large family since they hold the major responsibility of ensuring the continuity of
family lineage (Donadie and Tabutin, 1994). Their role in the reproductive system is also central as they have the
upper hand in controlling the marriage market (i.e. have much freedom of mate selection) and wider scope of
action than women. In addition, they are not the primary care givers to motivate limiting family size. According
to qualitative information obtained from urban Ethiopia, there is a noticeable difference in couples’ view on
costs of raising children. For men, the major expense in raising children is education followed by food and
clothing. For women, food is the major expense followed by clothing and education. Consequently, men are in
need of large family since the cost of schooling is modest in Ethiopia and child education is not yet compulsory
and nearly free at primary level (World Bank, 1998).
The patriarchal system in Ethiopia, which does not allow women to own property, also threatens their decision
to control fertility. Qualitative data collected from different parts of the country revealed that for Ethiopian
women divorce has a risk of losing the property acquired during the course of marriage. To minimize such a
risk, most of them are obliged to have a large number of children not only to safeguard the marriage but also to
maximize their access to resources in case the marriage dissolves by divorce. Although the Revised Family Code
of Ethiopia (Federal Negarit Gazetta, 2000) gave courts the power to distribute property between husband and
wife upon divorce, none of them are confident that this provision is executed accordingly unless they have
children in that marriage. For the uneducated, unemployed and rural Ethiopian women, having more children
in a given marriage is tantamount to having more access to property owned in that marriage.
Kin support is encouraging high fertility in Ethiopia
The extent to which resources are exchanged among extended family members and the degree to which kinship
serve as risk insurance have a non-negligible effect on the level of fertility in Ethiopia. Qualitative information
obtained from rural areas of most of the regions depicted that extended family members have the power to exert
much pressure on Ethiopian women to bear as many children as they could. For instance, in the Somali and Afar
regions, any attempt to terminate pregnancy or postpone the timing of pregnancy is tantamount to belittling the
supremacy of a given clan. Clan leaders often wish to overcome conflicts over resources in their respective localities
through fighting with other parties, than taking legal measures in which males play decisive roles. Thus, a woman that
gives birth to more sons is often blessed as someone contributing much to the community’s autonomy. On equal
footing, most of the societies in SNNP, Gambella and Oromia regions are also encouraging women to have as many
daughters as they could since members of the kin are benefiting from bride prices paid by grooms upon marriage.
Levels, Trends and Determinants of Lifetime and Desired Fertility in Ethiopia 43
According to the argument of neo-classical economists (Becker and Lewis, 1973), fertility never goes down
unless parents feel that they lack adequate resources to provide their children with basic needs (i.e. not only
food but also education, leisure time, etc.). Contrary to this, kin support appears to minimize the extent of such
pressure on biological parents; it rather mitigates their demand for small family through adoption of birth
control methods. Substantiating such findings, Makinwa-Adebusoye (1994) stated that the unique nature of
African family system that distributes the responsibility of managing the costs and benefits of children among
extended family members encourages couples to continue having large families than taking the initiative to
minimize fertility to the economic well-being of a nuclear family that is responsible to look after its own children.
One of the major reasons for high fertility norm in Ethiopia, therefore, is the structure of the family organization
that ensures the spreading out of the costs of reproduction specifically through the practice of fostering.
Infant and child mortality still have active roles in resisting fertility decline
Evidences on demographic transition from Latin America have shown that the decline in childhood mortality
is one of the essential conditions for a change in fertility (Guzman, 1994). Studies undertaken in Botswana and
Zimbabwe (Berbieri, 1994) also revealed that a noticeable fall in fertility came after a sustained and steady fall
in childhood mortality. Unlike this, results of the multivariate analysis have shown that child loss experience
has significant effect on the level of lifetime fertility in Ethiopia both at national and regional levels (see table
4 and table A1 in the appendix). According to available evidence from the analysis of the 2005 EDHS data, the
likelihood of having additional child is significantly higher among those who lost at least one child. Qualitative
evidences also indicate that the possibility of losing some of the offspring before they grow up often forces
couples to have more children to develop confidence for some to survive.
Attainment of secondary and above education appears to reduce fertility:
Theoretically, it is argued that education reduces fertility as it changes the outlook of women on the number of children
to be born to her (Cochran and Farid, 1990). First of all, educated women try to trade off between quality and quantity
of children. They often aspire to have small number of children that acquire training and skills in the modern labour
market. The desire to invest more on each of the children motivates them to minimize the number of children to be
born in their lifetime. Illiterate women, on the other hand, wish to have as many children as they could as they think
some of the children would be successful by chance and would support them later on. The difference on the perceived
costs of raising children among mothers by educational level has the capacity to bring about considerable variation
in their motivations to limit family size. Secondly, education is likely to delay timing of marriage, increase a woman’s
awareness and motivation to adopt contraceptive methods besides improving her decision-making autonomy that
enhances bargaining power on all aspects of marital life (Mhloyi, 1994).
In-depth Analysis of the Ethiopian Demographic and Health Survey 200544
As observed in the results of multivariate analysis, women receiving secondary education and above have
lower risks of having additional children compared to those who have never been to school (see table 4 and
table A2 in the appendix). According to qualitative information obtained through focus group discussions and
key informants in different parts of Ethiopia, education reduces fertility not only by increasing a woman’s ability
and motivation to protect her rights through legal means but also by developing her capacity in supporting
the family financially as well as socially. Moreover, it is indicated that education gives them the courage to
withstand any pressure exerted from in-laws to have additional children or threats to dissolve the marriage
in divorce if she resists having additional children. Far beyond this, educated and employed women have the
courage of taking independent decisions such as using birth control methods without their husbands’ consent
after achieving an acceptable fertility level and family size.
Fertility in rural Ethiopia is accelerated by universal and early age at first marriage
As clearly indicated in demographic literature (Ascadi and John-Ascadi, 1990; Ocholla-Ayayo, 1991; Casterline
1994) the timing of family formation and marital stability have significant roles to play on the onset of fertility
transition. In the absence of contraceptive use, early age at first marriage and stable marital life have significant
effect on the duration of women’s exposure to the risk of pregnancy. The higher the age at first marriage for
the majority of women in reproductive age, the lower the marital fertility would be since the delay in age at
first marriage has the potential to reduce lifetime fertility. Similarly, analysis of multivariate results for the 2005
EDHS (table 4) have shown that lifetime fertility reduces by 24 percent among those who got married after age
18 (as compared to those who entered into marital life earlier. Similar and consistent results have also been
observed among women residing in different regions (see table A1 in the appendix). On the basis of these
tangible evidences, it is possible to argue that in societies where contraceptive use is quite low and marriage
is entered into early, universal as well as stable, women have large families as there is no means to curb the risk
of pregnancy over longer interval.
There are exceptions to the arguments mentioned above, however. Despite the fact that early marriage is quite
common (table 3), the fertility levels in Amhara and Tigray regions are modest. On the basis of information
obtained from focus group discussions (FGDs), the fertility level of the two regions is partly affected by the
consequences of “child marriage2” that has significant impact on marital stability and adolescent sterility or
subfecundity. According to data given in table 3, panel 6, first marriage had not necessarily led to early birth
both in Amhara and Tigray regions. The interval between first marriage and first birth is 45 months and 32
2Childmarriagereferstomarriagestakingplacebeforeage15(i.e.beforematurity)whileearlymarriageinmostofthecasesreferstomarriagestakingplacebeforeage18butafterpuberty(seealsoAscadiandJohnson-Ascadi,1990).
Levels, Trends and Determinants of Lifetime and Desired Fertility in Ethiopia 45
months in Amhara and Tigray regions, respectively; whilst divorce rate of first marriage in both of the regions is
quite high: 58.9 percent and 44.1 percent in the given order.
Traditional fertility control schemes such as longer duration of breast-feeding and postpartum amenorrhea in regulating fertility in some of the regions
In societies where contraceptive prevalence rate is low, the effects of prolonged breast-feeding and postpartum
abstinence are not negligible (Bongaarts, Frank and Lesthaghe, 1990; Ocholla-Ayayo, 1991). Despite living
under same condition (table 1), women living in the Afar Region tend to have a relatively lower fertility as
compared to women in Somali region for they have a custom of breast-feeding their children intensively and
frequently for a longer duration. Extensive breast-feeding with intensity has the power to extend the duration
of postpartum amenorrhea and gives mothers a better chance of protecting themselves against pregnancy
(Bongaarts, Frank and Lesthaghe, 1990). According to the qualitative data obtained through focus group
discussion and key informant interviews conducted in the Somali and Afar regions, mothers in the Afar Region
have the tradition of feeding their children with breast-milk while those in the Somali Region have the habit of
providing newly born babies with supplementary food shortly after birth. Culturally an Afar mother is provided
with nutritious food to let her give the child more breast-milk, whilst the Somalis provide the nutritious food
to the children directly. For having different cultural practices on timing of breast-feeding, Afar and Somali
women have different exposure to the risk of pregnancy, given the low contraceptive prevalence rate in both
of the regions (table 1).
Qualitative information gathered from the Gambella and Benishangul Gumuz regions also show that women
in these regions have low fertility mainly due to the effects of secondary sterility and the initiatives to
regulate fertility using traditional herbs. These women have the liberty to practice sexual
relations before marriage though premarital child bearing is not encouraged. In the view of the
medical practitioners from Gambella Hospital, pathogenic diseases leading to secondary sterility
are common in such peripheral regions due to wider practices of extramarital sexual relations
where access to health services is limited.
Although some of the traditional Ethiopian societies have deeply rooted child spacing in their culture,
modernization factors such as attainment of primary level education could erode these traditional practices
through time. Unless effective and efficient family planning system is in place, fertility could show an increasing
trend temporarily during this transitional era. The slight increase in fertility in some of the regions such as
Oromia and Somali could be a signal for the breakdown of traditional norms and values such as prolonged
duration of breast-feeding and postpartum amenorrhea as factors controlling the risk of pregnancy.
In-depth Analysis of the Ethiopian Demographic and Health Survey 200546
8. Summary and Conclusions
Fertility has shown a declining as well as stalling situations in Africa over the last two decades. Some of the
sub-Saharan African countries such as Kenya and Ghana, Latin American countries like Peru and Colombia,
and Asian countries like Bangladesh started fertility transition before the mid-1990s but stalled then after
(Bongaarts, 2005). Fertility decline in these counties began to take place in the absence of fundamental
economic development led by industrialization, as it happened in the Western World. Better education as well as
employment opportunities, wider access to family planning information and services in urban centres coupled
with economic difficulties is supposed to contribute to the decline in fertility. The onset of fertility transition in
some pockets of African, Asian and Latin American countries (particularly in urban centres) in causes associated
with economic hardship, political upheaval leading to psycho-social frustrations and depressions as well as
crumbling of the kin support system, calls for the emergence of new thinking on the dimension of fertility
transition in developing countries.
The purpose of this study is to assess determinants of lifetime and desired fertility that have implications
for program review and implementation of population programs in Ethiopia. The study specifically aimed at
assessing the extent of fertility decline (if any) in the country and examining factors responsible for the change
in each of the regions and other pertinent variables that have significant implications for policy intervention.
In order to assess the extent to which family planning programs are required, detailed analysis is also made on
factors affecting fertility intention in the country.
Analysis of this study is based on the 2000 and 2005 Ethiopian Demographic and Health Survey data collected
by the Central Statistical Agency and ORC Macro. Currently married women in the child-bearing age (i.e. 15-49)
are used to fit multivariate results predicting determinants of lifetime fertility using Poisson distribution, and
desired fertility using logistic regression models. Kaplan-Meier life table approaches have also been used to
estimate median values of age at first marriage, age at first birth, interval between first marriage and birth as
well as inter-birth intervals. Duration of breast-feeding, postpartum sexual amenorrhea and abstinence are also
estimated using such approach, which is robust in including censored events as well.
Major findings of the study revealed that there is a slight change in fertility in Ethiopia as far as evidences
obtained from the 2000 and 2005 EDHS data sets are concerned. Fertility has, of course, shown a tremendous
decline among selected groups: highly educated, gainfully employed and urban residents. The decline does
not only lack uniformity but also appear to be accompanied by a shift in timing of births. Available evidences
suggest that there is a tendency of lagging child delivery towards the peak reproductive age group (for instance,
Levels, Trends and Determinants of Lifetime and Desired Fertility in Ethiopia 47
women who attained basic education), which tends to show a decline in fertility among the younger women
but a slight increase in other age categories. In most of the cases, the decline in fertility in some of the categories
appears to be diminished by an increase in other categories either due to shifting in timing of child delivery or
the inconsistent response to fertility inhibition factors. Rural women, for instance, appear to maintain the high
fertility norm while urban women tend to decrease their lifetime as well as desired fertility. Similar inconsistent
trends and patterns have also been observed in most of the variables included in the model.
Significant variation in fertility levels and intention to regulate additional births has also been observed in the
current study. Urban regions (Addis Ababa, Dire Dawa and Harari) tend to have lower fertility due to the socio-
economic setting of their population. However, when major factors contributing to fertility decline such as place
of residence and educational attainment of respondents are controlled, their lifetime fertility and intention to
limit additional child tends to be similar to the situation in Amhara Region which was taken as a reference
category. Currently married women residing in Addis Ababa rather tend to have more births suggesting that
there might be an increase in fertility in the city if there would be improvement in standard of living.
Women residing in regions where traditional norms and values still appear to perpetuate high fertility, namely,
Somali, Oromia and SNNP regions, have not shown any signal for fertility decline. Lifetime as well as current
fertility is the highest in all of these regions (see figure 3 and table 4). Major reasons for high fertility in such
regions are the prevalence of kin support system that does not only exert pressure in having more babies but
also sharing the costs of child rearing. An additional factor fuelling high fertility in Oromia and SNNP regions
is the high unmet need for family planning services in each of the regions3. Had it been possible to meet the
demands for family planning in the two regions, fertility would have been reduced at least by two children.
Simulation model developed by Sinding et al. (1994) suggests that increasing family planning services by
about fifteen percent could reduce a total fertility rate by about one child. The key issue to regulate fertility
in the said regions, therefore, partly tends towards providing effective and efficient family planning services
in their rural settings irrespective of their geographic proximity to urban centres and/or access to main roads.
The significant effect of child mortality on fertility is an important issue that is worth giving top priority in the
reproductive health programs of this country. According to results of the current study, ensuring the survival
of each and every child born in this county could reduce fertility at least by 25 percent (table 4). It also has
the advantage of reducing maternal morbidity and mortality since frequent and too close births have non-
negligible effect on the wellbeing of mothers and children.
3Unmetneedforfamilyplanningis47.9%and38.5%ofwomenresidinginOromiaandSNNPregions,respectively(CSAandORCMacro,2006).
In-depth Analysis of the Ethiopian Demographic and Health Survey 200548
Despite reviewing religious doctrines and their implication on fertility and fertility regulation
schemes, there is also a need to assess how each religious institution addresses procreation
issues at the community level. Findings of the present study indicate signals for differential
fertility behaviour among Protestants and Muslims living in the rural and urban areas. High
fertility norm among the Protestants is a bit surprising given the liberal position of the
Church in letting the use of family planning methods and limiting family size in congruence
with modern life.
Issues for policy consideration:
In the Ethiopian context, education is not yet serving as the most important mode of inter-generational
status transfer in all urban areas let alone in rural localities. Rural residents are still reliant on land for their
source of livelihood, and family labour is still important to produce more. As the rural economy is still
based on subsistence farming, no one is interested in the cost-benefit analysis of family labour. As long
as low standard of living is accepted as a norm among rural Ethiopian families, no initiatives will also be
taken to reduce fertility levels with the aspiration of going through social mobility ladder. The existing
family structure is also against the move towards taking measures to reduce fertility in Ethiopia. The social
obligation of elders to provide financial support to their younger siblings, for example, is another factor
that encourages parents to maintain large family size. A radical change in fertility could, nonetheless, occur
when the new generation begins to be self supportive and kin support ceases to operate. This would
definitely happen as costs of raising children increase due to changes in the prevailing economic system
(i.e. monetization of the economy) that heavily demands compulsory child education for future survival.
In order to change rural Ethiopian parents’ perception of values of children, child schooling needs to be
compulsory through time so that costs of raising children are getting higher both in rural and urban places.
The Government of Ethiopia shall thus adopt and enforce the policy of compulsory primary education for
all besides encouraging females to go to schools through giving incentives and awards for those who are
successful in their studies at all levels.
In addition to what is mentioned above, three scenarios must be fulfilled for fertility to decline rapidly throughout
the nation: (a) the drastic change of couples’ reproductive behaviour; (b) abolishment of early marriage and
maintenance of the minimum age at first marriage in all of the regions; and (c) expansion of efficient and
effective family planning services that are available and accessible to the entire population irrespective of their
residence locations and socio-economic status.
Levels, Trends and Determinants of Lifetime and Desired Fertility in Ethiopia 49
Low fertility is totally unthinkable in scenarios where the costs of rearing children are shared, access to
contraceptive methods remains very difficult and the initiative to regulate fertility is neither valued nor given
social recognition. Modernization may not necessarily be a mandatory or obligatory condition to bring about
decline in fertility but a favourable condition to accelerate the change in fertility rates. As observed from the
analysis of national and regional data sets, a single variable cannot be responsible for fertility transition. The
demographic, economic and social systems should operate together to bring about radical change in fertility.
Even if economic advancement is attained, the likelihood of fertility decline might be far from reality as long
as the social structure is intrinsically pronatalist. For instance, clan leaders in peripheral regions such as Afar,
Somali, Gambella and Benishangul Gumuz, have the power to reject any person who tries to alter the high values
attached to procreation. As a result, innovative and dynamic policies aimed at curbing large family size might face
difficulties of implementing the population program in the short run though it is possible in the long run.
In-depth Analysis of the Ethiopian Demographic and Health Survey 200550
References
Abernethy V (1992). The Demographic Transition Revisited: Lessons for Foreign Aid and U.S.ImmigrationPolicy.Ecological Economics,8,235-252.
AcsadiG,AcsadiJG(1990).PopulationConditionsinMainlandsub-SaharanAfricainPopulationGrowthandReproductioninsub-SaharanAfrica:TechnicalAnalysisofFertilityandItsConsequenceseditedbyGeorgeT.F.Acsadi,GwendolynJohnson-AcsadiandRodolfoA.Bulatao.Washington,D.C.,TheWorldBank.
AssefaH(1992).AnOverviewof theDeterminantsofHighFertility inEthiopia.Ethiopian Journal of Development Research, 14(2):1-30.
Bairagi R (2001). Effect of Sex Preference on Contraceptive Use,Abortion and Fertility in Matlab,Bangladesh.International Family Planning perspectives,27(3):137-143.
BeckerG,LewisH(1973).OntheInteractionbetweentheQuantityandQualityofChildren.Journal of Political Economy,81(2),279-288.
BerbieriM(1994).IstheCurrentDeclineinInfantandChildMortalityinsub-SaharanAfricaaSignforFertilityChange?InTheOnsetofFertilityTransitioninsub-SaharanAfrica.EditedbyThereseLocohandVoreniqueHertrich.IUSSP.
Bongaarts J (1997). Trends in Unwanted Childbearing in the DevelopingWorld.Studies in Family Planning,28(4)267-277.
BongaartsJ(1999).FertilityDeclineintheDevelopedWorld:WhereWillItEnd?The American Economic Review,89(2)
BongaartsJ(2005).TheCausesofStallingFertilityTransition.PopulationCouncilWorkingPapersNo.204.PolicyResearchDivision.
BongaartsJ,OdileF,RonL(1990).PopulationConditionsinMainlandsub-SaharanAfricainPopulationGrowth and Reproduction in sub-Saharan Africa: Technical Analysis of Fertility and ItsConsequences edited by George T. F.Acsadi, Gwendolyn Johnson-Acsadi and RodolfoA.Bulatao.Washington,D.C.,TheWorldBank.
Borgerhoff M.M. (1987). On Cultural and Reproductive Success: Kipsigis Evidence. American Anthropologists,89:617-634.
Cain M (1982) Perspectives on Family and Fertility in Developing Countries. Population Studies, 36(2):159-175.
CaldwellJ.C.(1982).TheoryofFertilityDeclineLondonandNewYork:AcademicPress.
CaldwellJ.C.,CaldwellP(1987).TheCulturalContextofHighFertilityinsub-SaharanAfrica.Population and Development Review,16(3),409-437.
CasterlineJ.B. (1994).FertilityTransition inAsia. In theOnsetofFertilityTransition insub-SaharanAfrica.EditedbyThereseLocohandVoreniqueHertrich.IUSSP.
Levels, Trends and Determinants of Lifetime and Desired Fertility in Ethiopia 51
CentralStatisticalAgency(Ethiopia)andORCMacro(2006).Ethiopia Demographic and Health Survey 2005.AddisAbaba,andCalverton:CentralStatisticalAgencyandORCMacro.
CentralStatisticalAuthority(1999).The1994PopulationandHousingCensusofEthiopia:ResultsatCountryLevel.AddisAbaba.
CentralStatisticalAuthority(Ethiopia)andORCMacro(2001).Ethiopia Demographic and Health Survey 2000.AddisAbabaandCalverton:CentralStatisticalAuthorityandORCMacro.
ChattopadhyayA,MichaelJ,WhiteD,CorneliusD(2006)MigrantFertilityinGhana:SelectionversusAdaptationandDisruptionasCausalMechanisms.Population Studies,60(2):189–203.
ClelandJ,WilsonC(1987).DemandTheoriesoftheFertilityTransition:anIconoclasticView.Population Studies,41(1),5-30.
CochraneS.H.,SamirF(1990).PopulationConditionsinMainlandsub-SaharanAfricainPopulationGrowth and Reproduction in sub-Saharan Africa: Technical Analysis of Fertility and ItsConsequences edited by George T. F.Acsadi, Gwendolyn Johnson-Acsadi and RodolfoA.Bulatao.Washington,D.C.,TheWorldBank.
DestaK,SeyoumG(1998).FamilySysteminEthiopia.In:Hand Book on Population and Family line Education for Secondary School Teachers in Ethiopia.EditedbySeyoumGebreselassieandMarkosEzraDTRCandICDR,AddisAbaba.
EshetuG(2005).FertilityTransitionDrivenbyPoverty:TheCaseofAddisAbaba(Ethiopia).UnpublishedPh.D.Thesis,UniversityofLondon.
EshetuG,MaceR(2008).FertilityDeclineandPovertyinAddisAbaba(Ethiopia).Journal of Biosocial Sciences.
FederalDemocraticRepublic ofEthiopia (2000).TheRevisedFamily Law.FederalNegaritGazettaExtraordinaryIssueNo.1/2000.TherevisedFamilyCodeProclamationNo.213/2000.AddisAbaba.
GibsonM,MaceR (2002).LabourSavingTechnologyandFertility Increase inRuralAfrica.Current Anthropology,43:213-222.
GuzmanJ.M.(1994).TheOnsetofFertilityDeclineinLatinAmerica.InTheOnsetofFertilityTransitioninsub-SaharanAfrica.EditedbyThereseLocohandVoreniqueHertrich.IUSSP.
HindeA,MturiAJ(2000).RecentTrendsinTanzanianFertility. Population Studies,54(2):177-191.
JejeebhoyS.J.(1995).Women’s Education, Autonomy, and Reproduction Behaviour: Experience from Developing Countries.Oxford:ClarendonPress.
KinfuY(2001).TheQuiteRevolution:AnAnalysisofChangeTowardBelow-replacementLevelFertilityinAddisAbaba.UnpublishedPhDThesis,AustralianNationalUniversity
KirkD(1996).TheDemographicTransitionTheory.Population Studies,50(3):361-387.
LongJ.S.(1997)RegressionModelsforCategoricalandLimitedDependentVariables.California:SagePublications.
LowB.S. (2000).Sex,Wealth,andFertility:OldRules,NewEnvironment. InCronk,Lee;Napoleon
In-depth Analysis of the Ethiopian Demographic and Health Survey 200552
Chagnon and William Irons (Ed.), Adaptation and Human Behaviour: An AnthropologicalPerspective(pp.261-281).NewYork:AldineDeGruyter.
LowB.S.,ClarkeAL,LockridgeKA(1992).TowardanEcologicalDemography.PopulationDevelopment Review,18(1),1-31.
Mace R (2000).AnAdaptiveModel of HumanReproductive RateWhereWealth is Inherited:WhyPeopleHaveSmall Families. In Cronket al. (Eds.),Adaptation and Human Behaviour: An anthropological Perspective (pp.261-281).NewYork:AldineDeGruyter.
Makinwa-AdebusoyeP(1994).ChangesintheCostsandBenefitsofChildrentotheirParents.IntheOnset of Fertility Transition in sub-SaharanAfrica Edited byTherese Locoh andVoreniqueHertrich.IUSSP.
MarkosE(1997).DemographicResponsetoEcologicalDegradationandFoodInsecurity.Amsterdam:ThesisPublishers
NationalPopulationOffice.OfficeofthePrimeMinister(1993)NationalPopulationPolicyofEthiopia,AddisAbaba.
NorusisM.J.S.I.(1994).SPSS Advanced Statistics TM 6.1.Chicago:Chicago:SPSSInc
Ocholla-AyayoABC(1991).TheSpritofaNation:anAnalysisofPolicy,EthicsandCustomarilyRulesofConductforRegulatingFertilityLevelsinKenya.Nairobi:ShirikonPublishers.
PalloniA,RafalimananaH(1999)TheEffectsofInfantMortalityonFertilityRevisited:NewEvidencefromLatin.America Demography,36(1):41-58.
RomaniukA(1980). Increase inNaturalFertilityduring theEarlyStagesofModernization:EvidencefromanAfricanCaseStudy,Zaire.Population Studies,34(2),293-310.
SibandaA,WoubalemZ,HoganDP,LindstormDP(2003).TheProximateDeterminantsoftheDeclineBelow-replacementFertilityinAddisAbaba,Ethiopia.Studies in Family Planning,34(1),1-7.
SindingS.W.,RossJA,RosenfieldAG(1994).SeekingCommonGround:UnmetNeedsandDemographicGoals.International Family Planning Perspectives,20(1):23-32.
SmithDJ(2004).Contradictions inNigeria’sFertilityTransition:TheBurdensandBenefitsofHavingPeople.Population and Development Review,30(2):221-238.
TilsonD,LarsenU(2000).DivorceinEthiopia:theImpactofEarlyMarriageandChildlessness.Journal of Biosocial Sciences,32(2):355-372.
TurkePW(1989).EvolutionandtheDemandforChildren.Population and Development Review,15(1),61-90.
WangW,FelixF(1997).ModellingHouseholdFertilityDecisionswithGeneralizedPoissonRegression.Journal of Population Economics, 10(3):273-283.
WinkelmannR,ZimmermannF (1995).RecentDevelopments inCountDataModelling:TheoryandApplication.Journal of Economic Surveys.9(1):1-24.
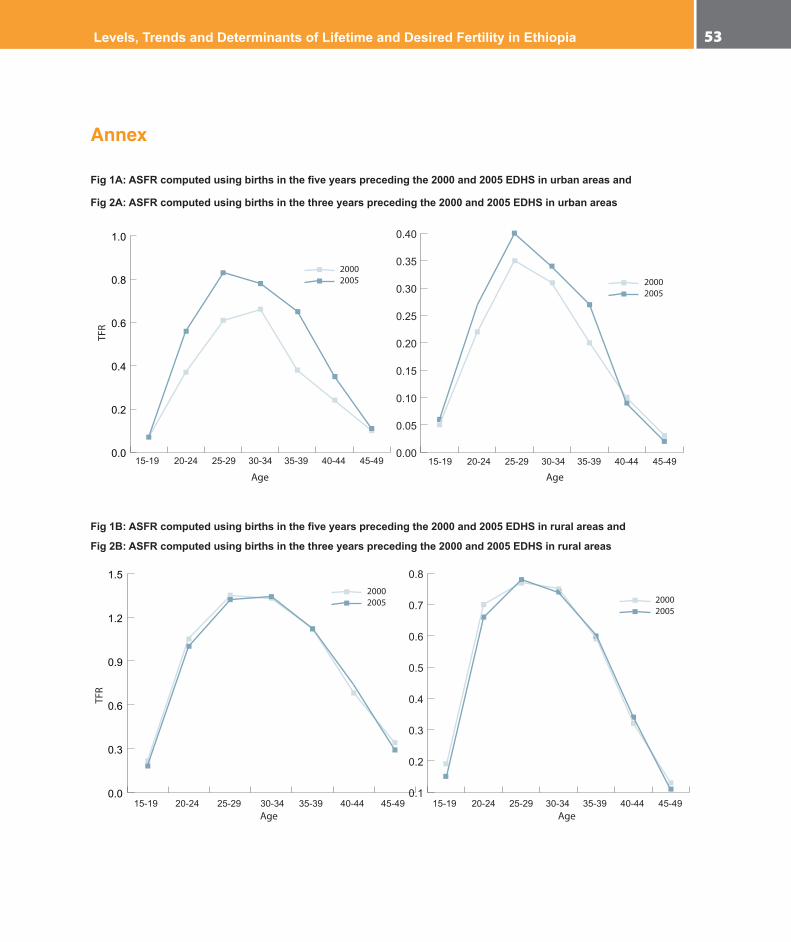
Levels, Trends and Determinants of Lifetime and Desired Fertility in Ethiopia 53
Annex
Fig 1A: ASFR computed using births in the five years preceding the 2000 and 2005 EDHS in urban areas and
Fig 2A: ASFR computed using births in the three years preceding the 2000 and 2005 EDHS in urban areas
15-19 20-24 25-29 30-34 35-39 40-44 45-49 15-19 20-24 25-29 30-34 35-39 40-44 45-49
20002005 2000
2005
Age Age
TFR
0.0
0.2
0.4
0.6
0.8
1.0
0.00
0.05
0.10
0.15
0.20
0.25
0.30
0.35
0.40
Fig 1B: ASFR computed using births in the five years preceding the 2000 and 2005 EDHS in rural areas and
Fig 2B: ASFR computed using births in the three years preceding the 2000 and 2005 EDHS in rural areas
15-19 20-24 25-29 30-34 35-39 40-44 45-49 15-19 20-24 25-29 30-34 35-39 40-44 45-49
20002005
20002005
Age Age
0.0
0.3
0.6
0.9
1.2
1.5
0.1
0.2
0.3
0.4
0.5
0.6
0.7
0.8
TFR

In-depth Analysis of the Ethiopian Demographic and Health Survey 200554
Fig 3A: ASFR computed using births in the five years preceding the 2000 and 2005 EDHS at national level and Fig 3B: ASFR computed using births in the three years preceding the 2000 and 2005 EDHS data at national level
15-19 20-24 25-29 30-34 35-39 40-44 45-49
Age
15-19 20-24 25-29 30-34 35-39 40-44 45-49
Age
0.0
0.2
0.4
0.6
0.8
1.0
1.2
0.0
0.1
0.2
0.3
0.4
0.5
0.6
0.7
0.8
TFR
Table A1. Poisson regression analysis results predicting determinants of children ever born among currently married women, by region: EDHS 2005
VariablesRegion
Amhara Tigray Afar Oromia Somali Ben_ Gumuz SNNP Gambella Harari Addis
AbabaDire Dawa
Placeofresidence
Rural(ref) 1.00 1.00 1.00 1.00 1.00 1.00 1.00 1.00 1.00 1.00 1.00
Urban 0.80*** 1.03 0.93 0.74*** 1.00 0.82 0.92 0.96 0.75** 1.06 0.76**
Women’seducation
Illiterate(ref) 1.00 1.00 1.00 1.00 1.00 1.00 1.00 1.00 1.00 1.00 1.00
Primary 1.08* 0.96 1.23*** 0.99 1.06 0.98 1.05 1.03 0.91 0.88 0.86
Secondary 0.90 0.75* 0.93 0.75*** 0.88 0.68* 0.99 0.88 0.74** 0.82** 0.81**
Accesstomedia
Noaccess(ref) 1.00 1.00 1.00 1.00 1.00 1.00 1.00 1.00 1.00 1.00 1.00
Infrequent 1.01 0.97 0.90* 0.99 1.01 0.98 0.98 0.93 0.95 0.92 0.97
Frequent 1.03 0.91 0.80*** 0.99 1.00 1.04 0.95 0.83* 0.88 0.85 0.76**
Women’soccupation
Nowork(ref) 1.00 1.00 1.00 1.00 1.00 1.00 1.00 1.00 1.00 1.00 1.00
Agriworker 0.95 0.98 1.01 0.89*** 0.64 1.00 1.05 0.80* 1.01 1.08 1.00
Non-agriworker 0.93 0.87** 1.01 0.94 1.02 0.92 0.99 0.95 0.90* 0.87** 0.92
Wealthindex

Levels, Trends and Determinants of Lifetime and Desired Fertility in Ethiopia 55
Poorest(ref) 1.00 1.00 1.00 1.00 1.00 1.00 1.00 1.00 1.00 1.00 1.00
Poor 1.00 1.01 0.91 0.97 0.97 1.01 1.05 0.95 0.97 @ 1.01
Medium 1.01 0.99 0.89 1.00 0.84 0.99 1.10* 0.87 1.06 @ 1.03
Rich 1.05 1.03 0.99 0.97 1.04 0.98 1.13** 0.93 1.12 @ 1.16
Richest 0.94 0.94 0.68* 0.98 0.90 1.10* 1.14** 0.78** 1.04 1.16
Childlossexperience
None(ref) 1.00 1.00 1.00 1.00 1.00 1.00 1.00 1.00 1.00 1.00 1.00
Onechild 1.52*** 1.30*** 1.45*** 1.41*** 1.40*** 1.44*** 1.44*** 1.60*** 1.53** 1.65*** 1.62***
Atleasttwo 1.31*** 1.17*** 1.17*** 1.20*** 1.26*** 1.15*** 1.25*** 1.38*** 1.33*** 1.42*** 1.43***
ContraceptiveuseNeverused(ref)
Everused 1.11*** 1.04 0.96 1.13*** 0.71* 1.00 1.07** 1.20** 1.18*** 1.46*** 1.12*
Ageatfirstmarriage
Before18yrs 1.00 1.00 1.00 1.00 1.00 1.00 1.00 1.00 1.00 1.00 1.00
18andmore 0.79** 0.79*** 0.73*** 0.77** 0.78*** 0.74*** 0.77*** 0.71*** .77*** .74*** 0.78***
Women’sdecision-makingautonomy
Low(ref) 1.00 1.00 1.00 1.00 1.00 1.00 1.00 1.00 1.00 1.00 1.00
Medium 1.02 0.96 .992 1.02 1.06 0.99 0.99 0.96 1.09 0.94 1.06
High 1.00 0.86 .995 0.97 1.01 0.89 0.97 0.99 0.96 0.94 1.10
Age 1.29*** 1.280 1.39*** 1.29 1.28*** 1.29*** 1.29*** 1.26*** 1.27*** 1.23*** 1.28***
Agesquare 1.00** 1.00*** 1.00*** 1.00 1.00*** 1.00*** 1.00*** 1.00*** 1.00*** 1.00*** 1.00***
(Intercept) 0.03*** 0.03*** 0.01*** 0.04*** 0.04*** 0.03*** 0.03*** 0.05*** 0.04** 0.09*** 0.03***
Numberofcases 1274 779 610 1453 501 628 1350 499 479 538 418
@Toofewcasestomakereliableestimates.
NB:Religionisnotcontrolledfortherearedominanceofagivenreligiousaffiliationinsomeoftheregions.
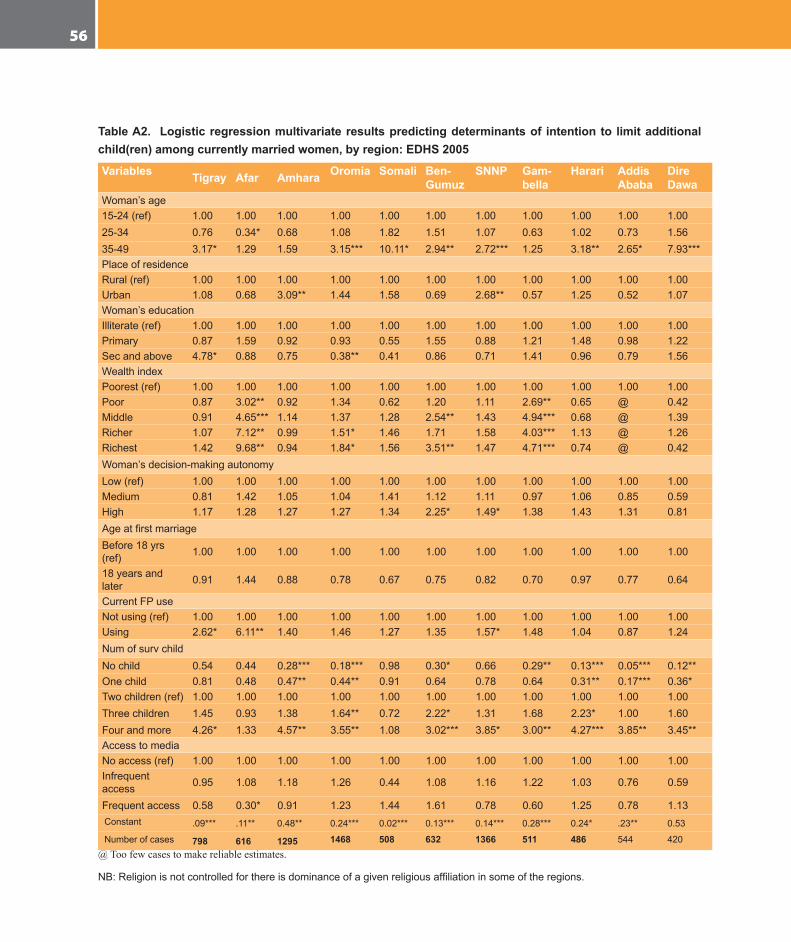
In-depth Analysis of the Ethiopian Demographic and Health Survey 200556
Table A2. Logistic regression multivariate results predicting determinants of intention to limit additional child(ren) among currently married women, by region: EDHS 2005
Variables Tigray Afar Amhara Oromia Somali Ben-Gumuz
SNNP Gam-bella
Harari Addis Ababa
Dire Dawa
Woman’sage15-24(ref) 1.00 1.00 1.00 1.00 1.00 1.00 1.00 1.00 1.00 1.00 1.0025-34 0.76 0.34* 0.68 1.08 1.82 1.51 1.07 0.63 1.02 0.73 1.5635-49 3.17* 1.29 1.59 3.15*** 10.11* 2.94** 2.72*** 1.25 3.18** 2.65* 7.93***PlaceofresidenceRural(ref) 1.00 1.00 1.00 1.00 1.00 1.00 1.00 1.00 1.00 1.00 1.00Urban 1.08 0.68 3.09** 1.44 1.58 0.69 2.68** 0.57 1.25 0.52 1.07Woman’seducationIlliterate(ref) 1.00 1.00 1.00 1.00 1.00 1.00 1.00 1.00 1.00 1.00 1.00Primary 0.87 1.59 0.92 0.93 0.55 1.55 0.88 1.21 1.48 0.98 1.22Secandabove 4.78* 0.88 0.75 0.38** 0.41 0.86 0.71 1.41 0.96 0.79 1.56WealthindexPoorest(ref) 1.00 1.00 1.00 1.00 1.00 1.00 1.00 1.00 1.00 1.00 1.00Poor 0.87 3.02** 0.92 1.34 0.62 1.20 1.11 2.69** 0.65 @ 0.42Middle 0.91 4.65*** 1.14 1.37 1.28 2.54** 1.43 4.94*** 0.68 @ 1.39Richer 1.07 7.12** 0.99 1.51* 1.46 1.71 1.58 4.03*** 1.13 @ 1.26Richest 1.42 9.68** 0.94 1.84* 1.56 3.51** 1.47 4.71*** 0.74 @ 0.42Woman’sdecision-makingautonomyLow(ref) 1.00 1.00 1.00 1.00 1.00 1.00 1.00 1.00 1.00 1.00 1.00Medium 0.81 1.42 1.05 1.04 1.41 1.12 1.11 0.97 1.06 0.85 0.59High 1.17 1.28 1.27 1.27 1.34 2.25* 1.49* 1.38 1.43 1.31 0.81AgeatfirstmarriageBefore18yrs(ref) 1.00 1.00 1.00 1.00 1.00 1.00 1.00 1.00 1.00 1.00 1.00
18yearsandlater 0.91 1.44 0.88 0.78 0.67 0.75 0.82 0.70 0.97 0.77 0.64
CurrentFPuseNotusing(ref) 1.00 1.00 1.00 1.00 1.00 1.00 1.00 1.00 1.00 1.00 1.00Using 2.62* 6.11** 1.40 1.46 1.27 1.35 1.57* 1.48 1.04 0.87 1.24NumofsurvchildNochild 0.54 0.44 0.28*** 0.18*** 0.98 0.30* 0.66 0.29** 0.13*** 0.05*** 0.12**Onechild 0.81 0.48 0.47** 0.44** 0.91 0.64 0.78 0.64 0.31** 0.17*** 0.36*Twochildren(ref) 1.00 1.00 1.00 1.00 1.00 1.00 1.00 1.00 1.00 1.00 1.00Threechildren 1.45 0.93 1.38 1.64** 0.72 2.22* 1.31 1.68 2.23* 1.00 1.60Fourandmore 4.26* 1.33 4.57** 3.55** 1.08 3.02*** 3.85* 3.00** 4.27*** 3.85** 3.45**AccesstomediaNoaccess(ref) 1.00 1.00 1.00 1.00 1.00 1.00 1.00 1.00 1.00 1.00 1.00Infrequentaccess 0.95 1.08 1.18 1.26 0.44 1.08 1.16 1.22 1.03 0.76 0.59
Frequentaccess 0.58 0.30* 0.91 1.23 1.44 1.61 0.78 0.60 1.25 0.78 1.13Constant .09*** .11** 0.48** 0.24*** 0.02*** 0.13*** 0.14*** 0.28*** 0.24* .23** 0.53
Numberofcases 798 616 1295 1468 508 632 1366 511 486 544 420@ Too few cases to make reliable estimates.
NB:Religionisnotcontrolledforthereisdominanceofagivenreligiousaffiliationinsomeoftheregions.

Levels, Trends and Determinants of Lifetime and Desired Fertility in Ethiopia 57