leverage an enterprise intelligence strategy to capitalize ...2).pdf · leverage an enterprise...
TRANSCRIPT
Leverage an Enterprise Intelligence Strategy to Capitalize on MES Data
John Dzelme, CPIM Regional Director, North America
Seabrook Technology Group Inc.
Applicability
MES is a new initiative and you are planning
what data to collect and what to report on...
You are an MES veteran and have terabytes of data sitting around collection virtual dust and you are now looking for new ways to get value from
your data…
What is Your Data Telling You?
• Do you know your break even point
• Do you track actuals to know how close your
theoretical figures are?
• Do you know when a sale costs you more than it will
make you?

Single Source of the Truth
Contextualization
• “I am giving you a $20 raise…”o The value depends on the rate (per hour, day, month, year, etc.)
o Without the rate, the value has little meaning
• Removing ambiguity from the data.o Isolating facts from grammar (i.e. good, great, etc.)
• Preventing misinterpretations
Contextualization is the difference between a Headache and a Heart-Attack
• Do you interpret data the same across the
organization?

Data Acquisition• How much does your data tell you?
Are you capturing enough data, too much data, the right data?
• Process Details?• Batch History?• CTQ Parameters• Bottlenecks? • Causes of Waste? • Areas of Improvements?
The supply chain is not as small as you may think it is…
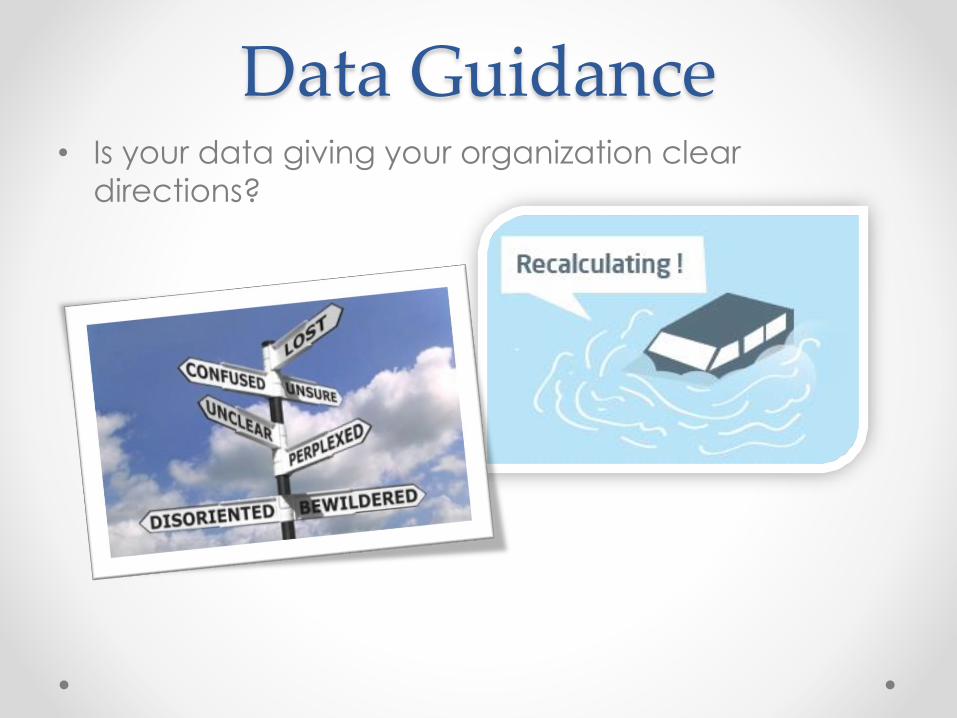
Data Guidance• Is your data giving your organization clear
directions?
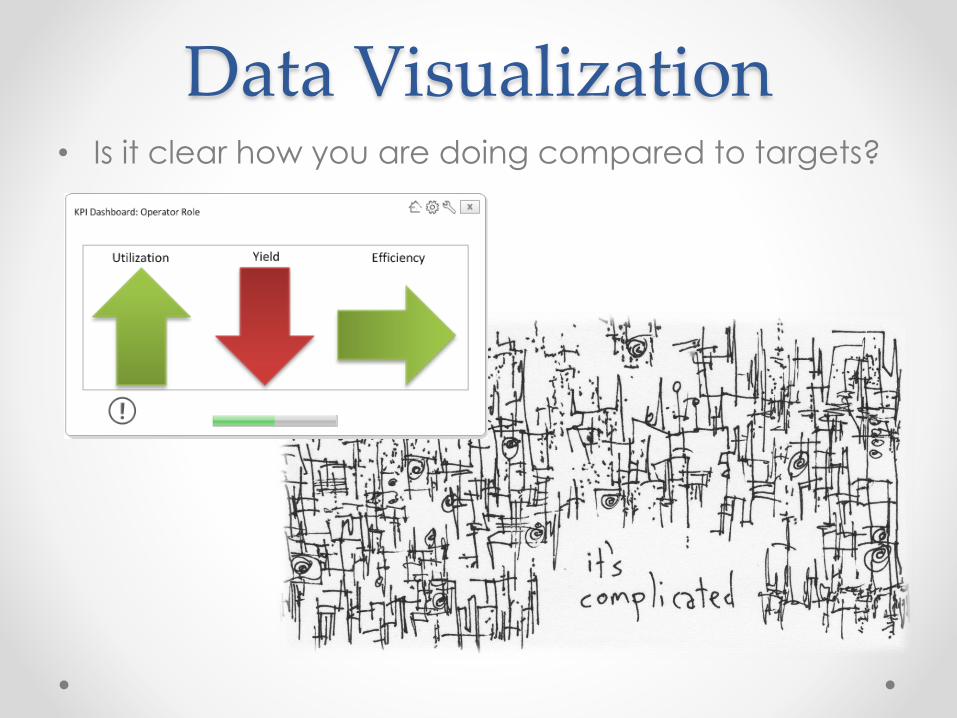
Data Visualization• Is it clear how you are doing compared to targets?
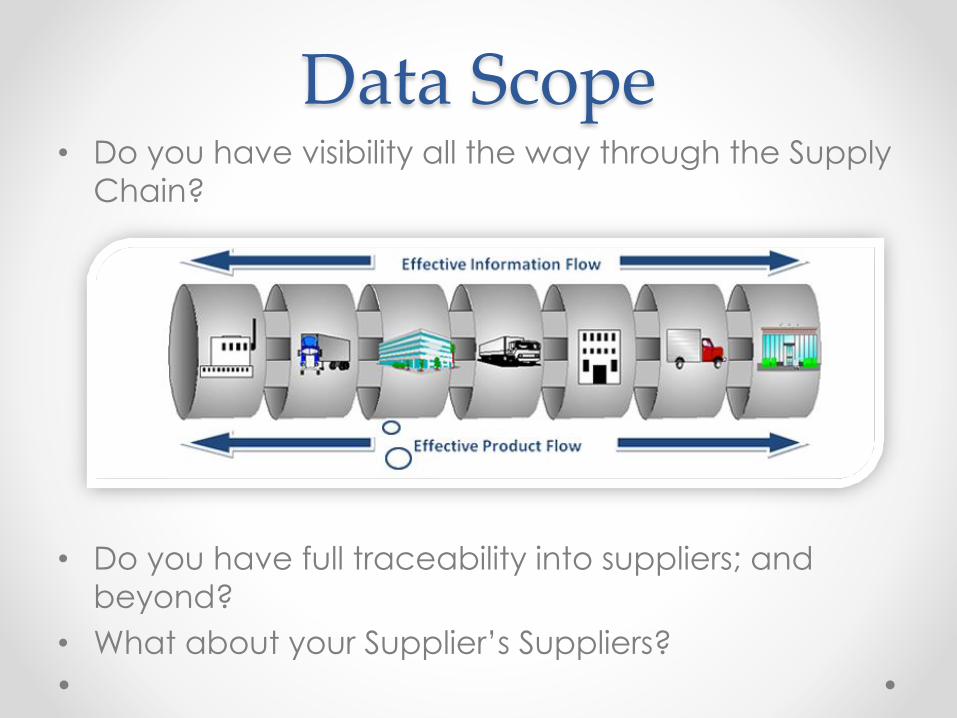
Data Scope• Do you have visibility all the way through the Supply
Chain?
• Do you have full traceability into suppliers; and
beyond?
• What about your Supplier’s Suppliers?
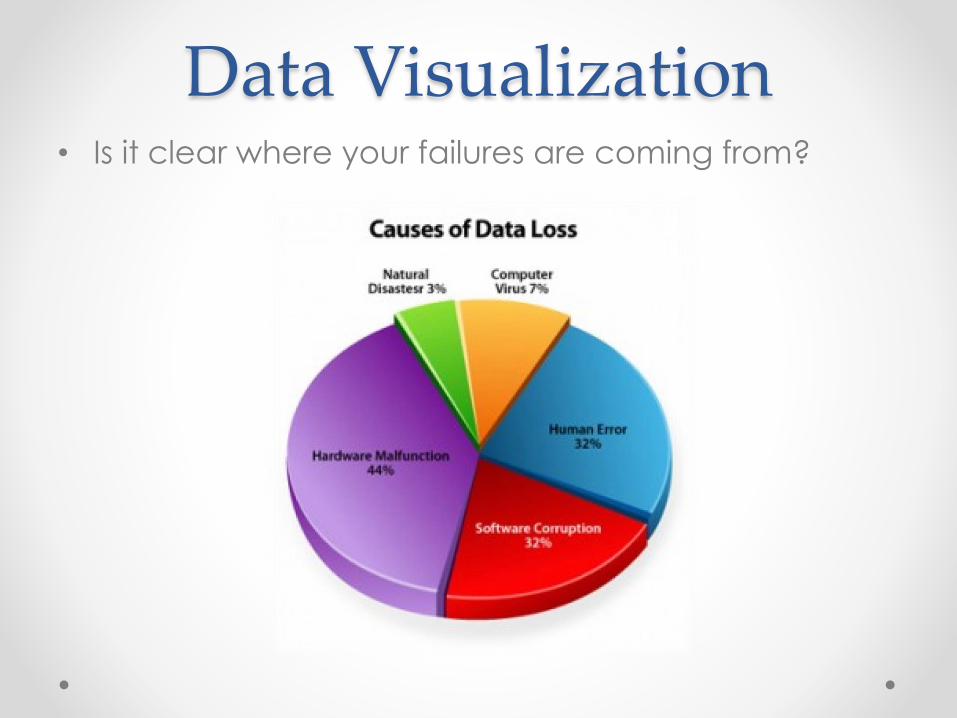
Data Visualization• Is it clear where your failures are coming from?
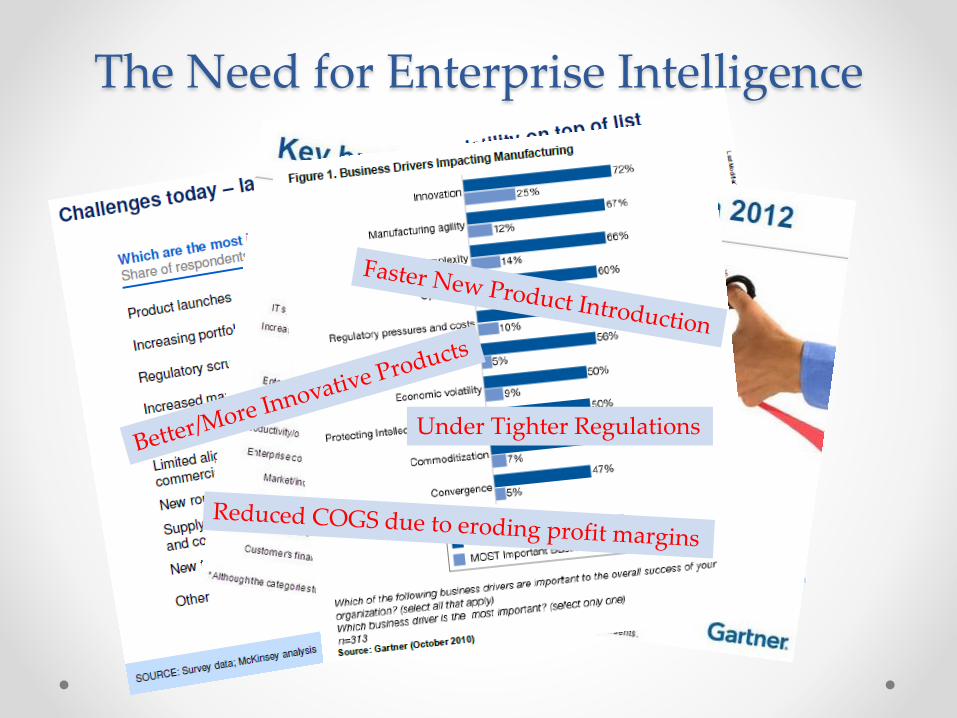
The Need for Enterprise Intelligence
Under Tighter Regulations
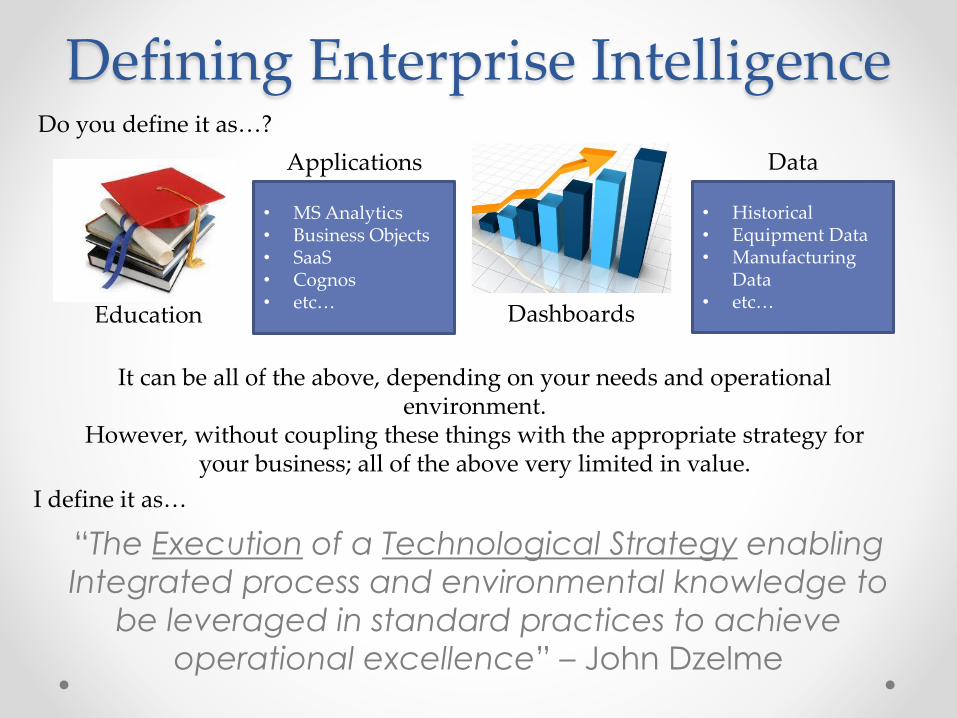
Defining Enterprise Intelligence
“The Execution of a Technological Strategy enabling
Integrated process and environmental knowledge to
be leveraged in standard practices to achieve
operational excellence” – John Dzelme
Dashboards
Applications
• MS Analytics• Business Objects• SaaS• Cognos• etc…
Education
Data
• Historical• Equipment Data• Manufacturing
Data• etc…
It can be all of the above, depending on your needs and operational environment.
However, without coupling these things with the appropriate strategy for your business; all of the above very limited in value.
Do you define it as…?
I define it as…
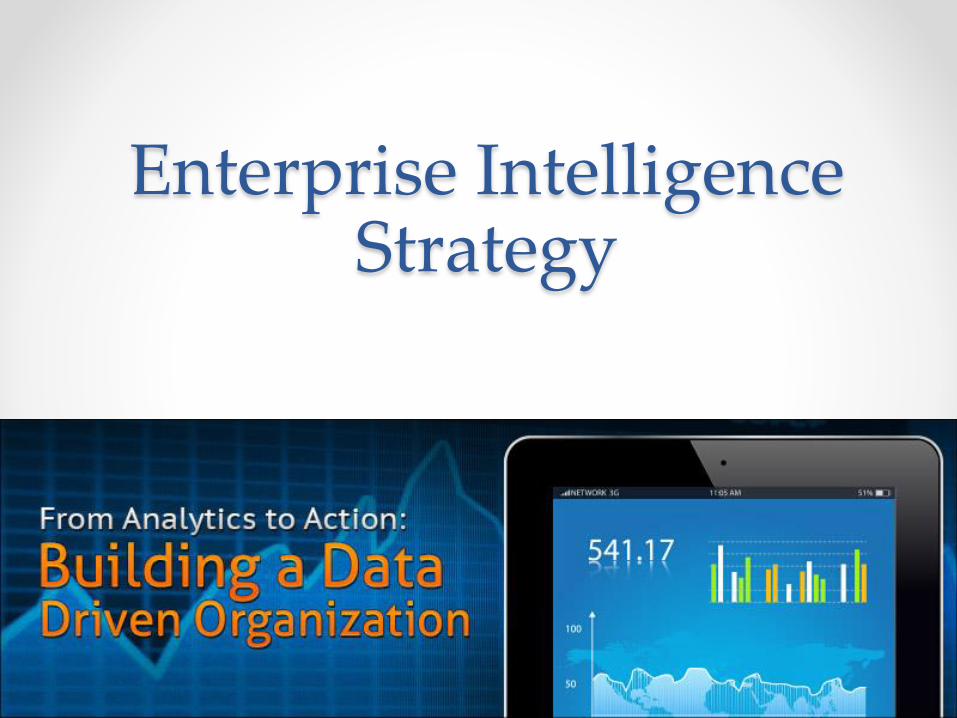
Enterprise Intelligence Strategy
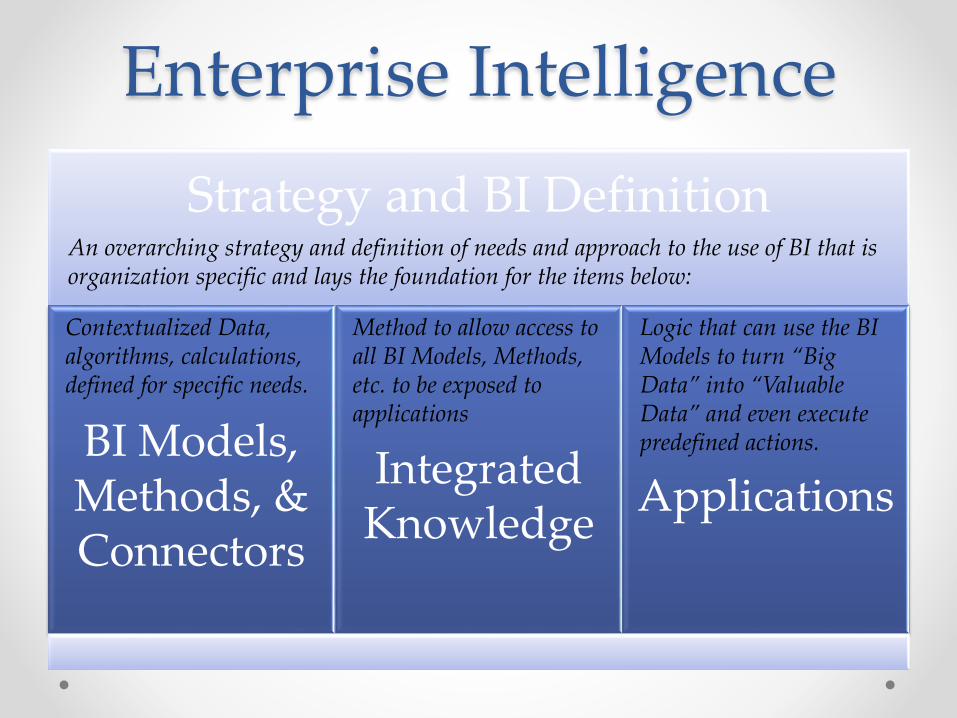
Enterprise Intelligence
Strategy and BI Definition
Integrated Knowledge
BI Models, Methods, & Connectors
Applications
Contextualized Data, algorithms, calculations, defined for specific needs.
Method to allow access to all BI Models, Methods, etc. to be exposed to applications
Logic that can use the BI Models to turn “Big Data” into “Valuable Data” and even execute predefined actions.
An overarching strategy and definition of needs and approach to the use of BI that is organization specific and lays the foundation for the items below:
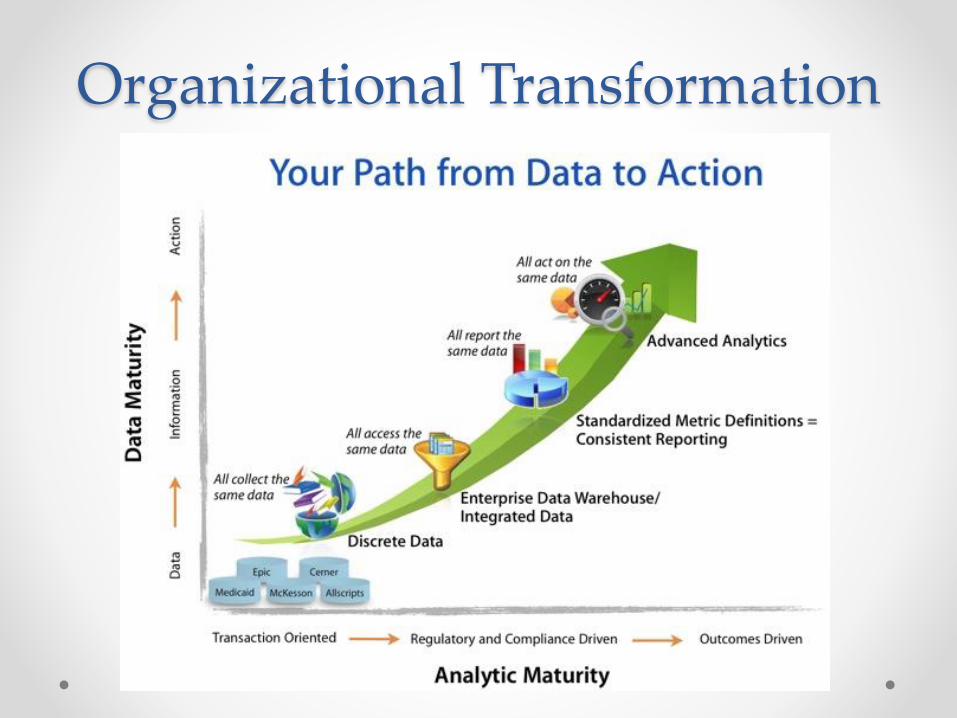
Organizational Transformation
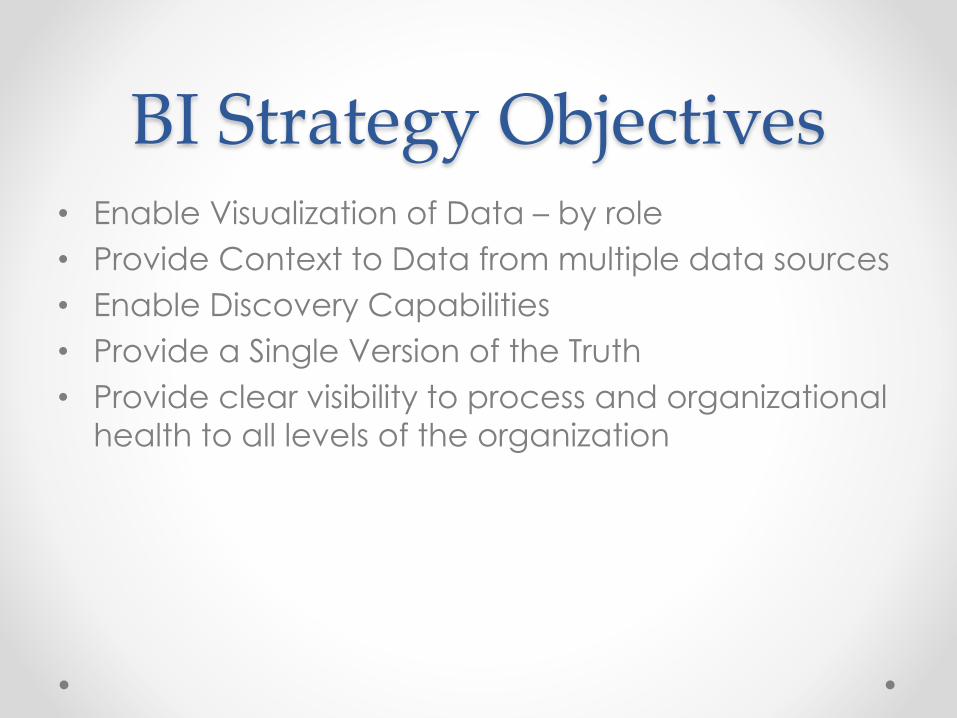
BI Strategy Objectives• Enable Visualization of Data – by role
• Provide Context to Data from multiple data sources
• Enable Discovery Capabilities
• Provide a Single Version of the Truth
• Provide clear visibility to process and organizational
health to all levels of the organization
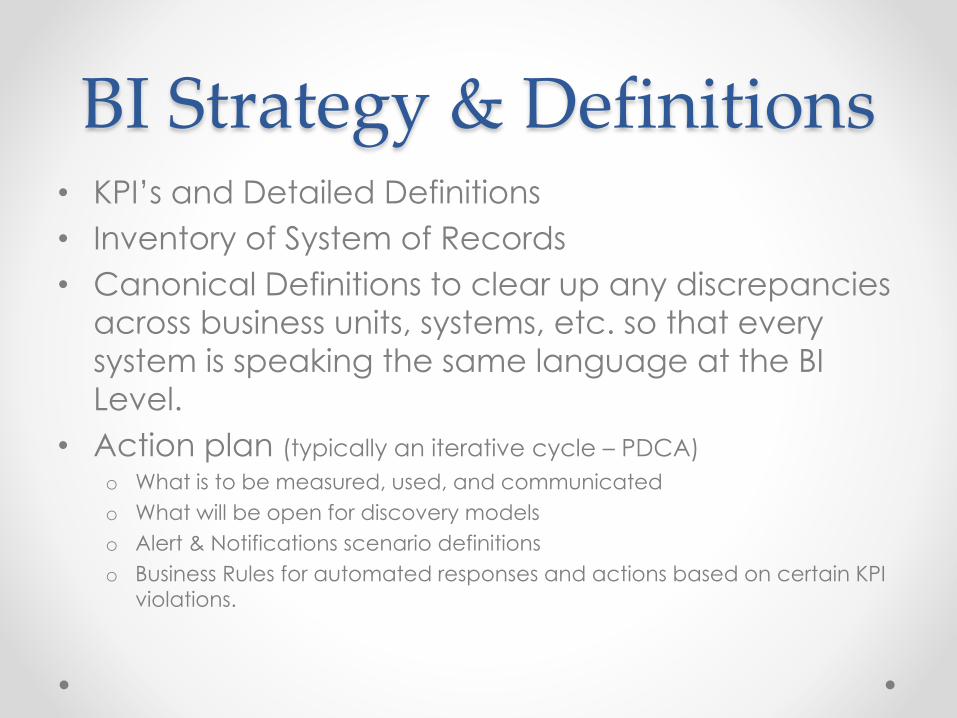
BI Strategy & Definitions• KPI’s and Detailed Definitions
• Inventory of System of Records
• Canonical Definitions to clear up any discrepancies
across business units, systems, etc. so that every
system is speaking the same language at the BI
Level.
• Action plan (typically an iterative cycle – PDCA)
o What is to be measured, used, and communicated
o What will be open for discovery models
o Alert & Notifications scenario definitions
o Business Rules for automated responses and actions based on certain KPI
violations.
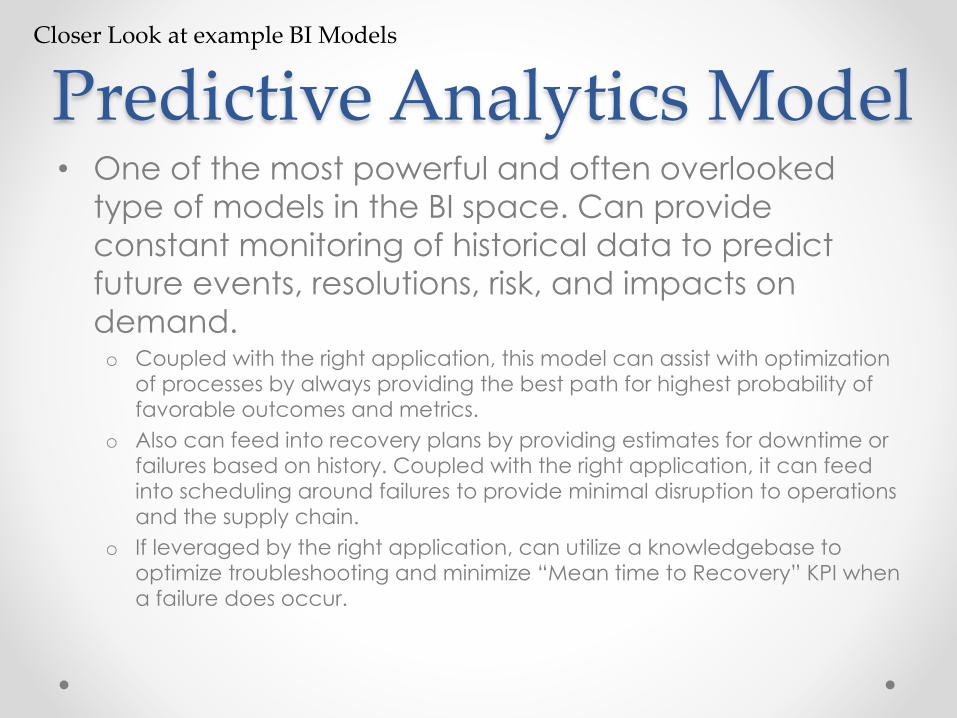
Predictive Analytics Model• One of the most powerful and often overlooked
type of models in the BI space. Can provide
constant monitoring of historical data to predict
future events, resolutions, risk, and impacts on
demand.o Coupled with the right application, this model can assist with optimization
of processes by always providing the best path for highest probability of
favorable outcomes and metrics.
o Also can feed into recovery plans by providing estimates for downtime or
failures based on history. Coupled with the right application, it can feed
into scheduling around failures to provide minimal disruption to operations
and the supply chain.
o If leveraged by the right application, can utilize a knowledgebase to
optimize troubleshooting and minimize “Mean time to Recovery” KPI when
a failure does occur.
Closer Look at example BI Models

Applications (Best of Breed and Composite)
Applications• Applications can provide process enforcement and
control
• If integrated, Applications can enable the use of BI models to drive business logic and automate decision making.
• With the proper integration strategy applications can interact with each other as well as the BI models to systematically drive action across the enterprise.
• Applications can be utilized to provide alerts and notification capabilities enabling you to initiate a response before a problem escalates out of control.
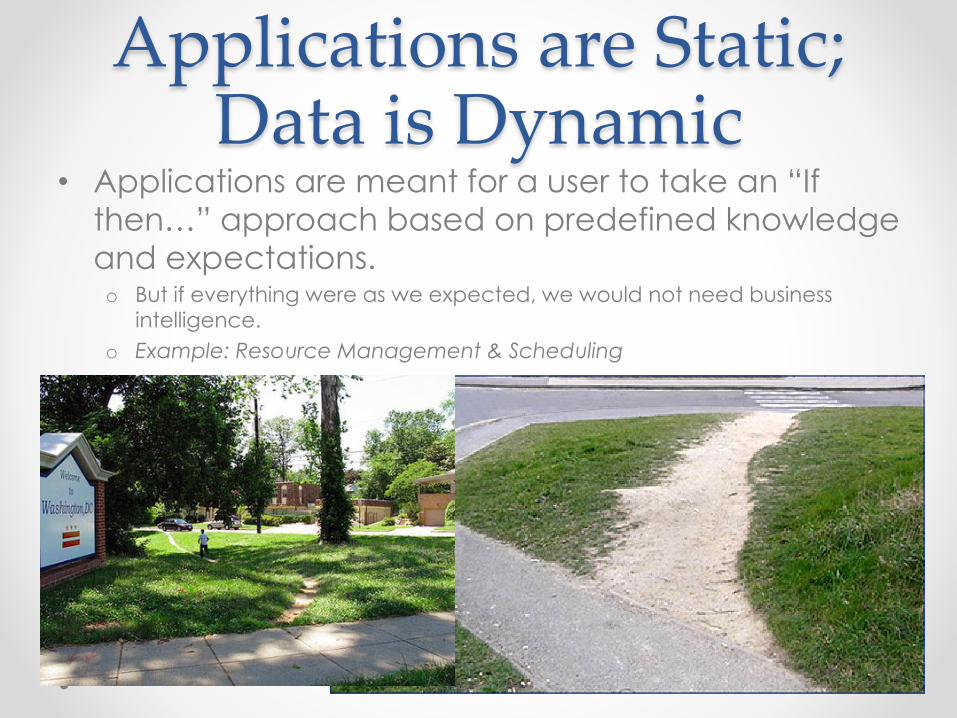
Applications are Static; Data is Dynamic
• Applications are meant for a user to take an “If
then…” approach based on predefined knowledge
and expectations.o But if everything were as we expected, we would not need business
intelligence.
o Example: Resource Management & Scheduling

Reporting & Dashboards
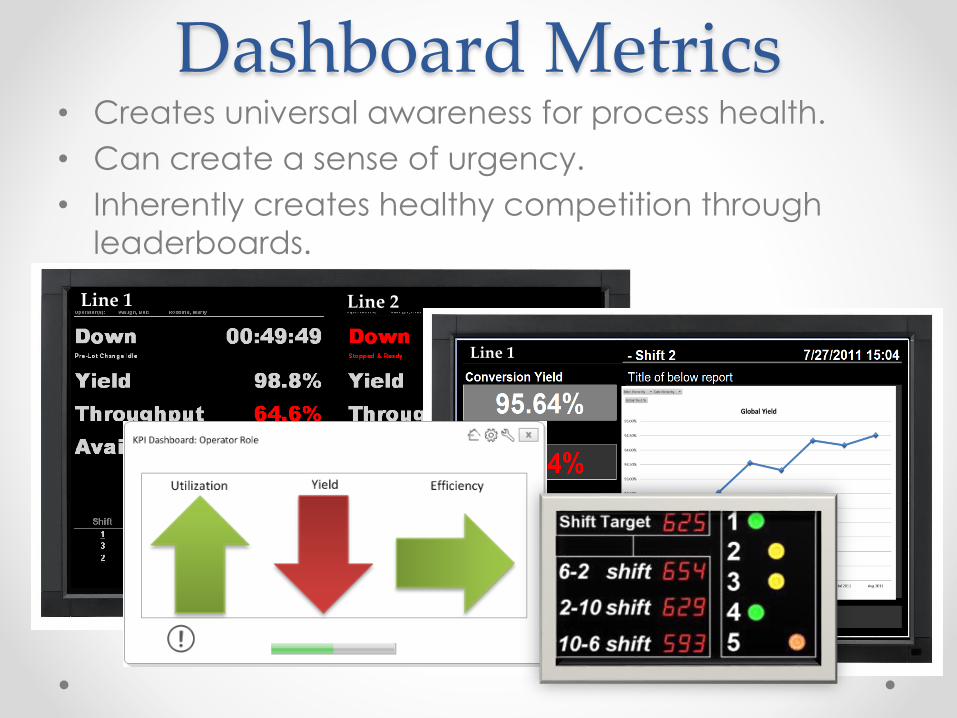
Dashboard Metrics• Creates universal awareness for process health.
• Can create a sense of urgency.
• Inherently creates healthy competition through
leaderboards.
Line 2Line 1
Line 1

Misguided through Chaos• When Chaos is status quo, how do you know when
there is really a fire?
• Don’t succumb to the firefighter syndrome…
Dashboard Limitations• Audience has to know how to react to the metric
• There is no systematic enforcement that the metric
is being responded to.
• Dashboards do not usually provide enough detail
for the user to know what is impacting the metrics
specifically
Static & Drillable Reports• Allows the display of comprehensive amounts of
data in a very structured format.
• Can pull data from multiple data repositories giving
a holistic view of the result set.
• Retrieved data can be archived as a document
(DHRs/BHRs, etc.)
Problems with Reports• Reports do not adequately support analytical
discovery.o Many times during investigations, the result of one report only creates
more questions that require additional report modifications in order to
answer.
• They are static (again based on predetermined
factors and variables) and potentially providing
only a portion of the truth, which in some cases is
more dangerous than no truth at all.
• Reports don’t enforce anything. Someone still has to
act based on the results.

Integrated Knowledge(Providing Universal Access to Intelligence)
Integrated Knowledge• Enables the sharing of data across applications
• Enables the access to BI Models that can provide
intelligence to automate business processes and
responses
• Allows an organization to constantly feed the
intelligence gathered back into their systems to
drive excellence
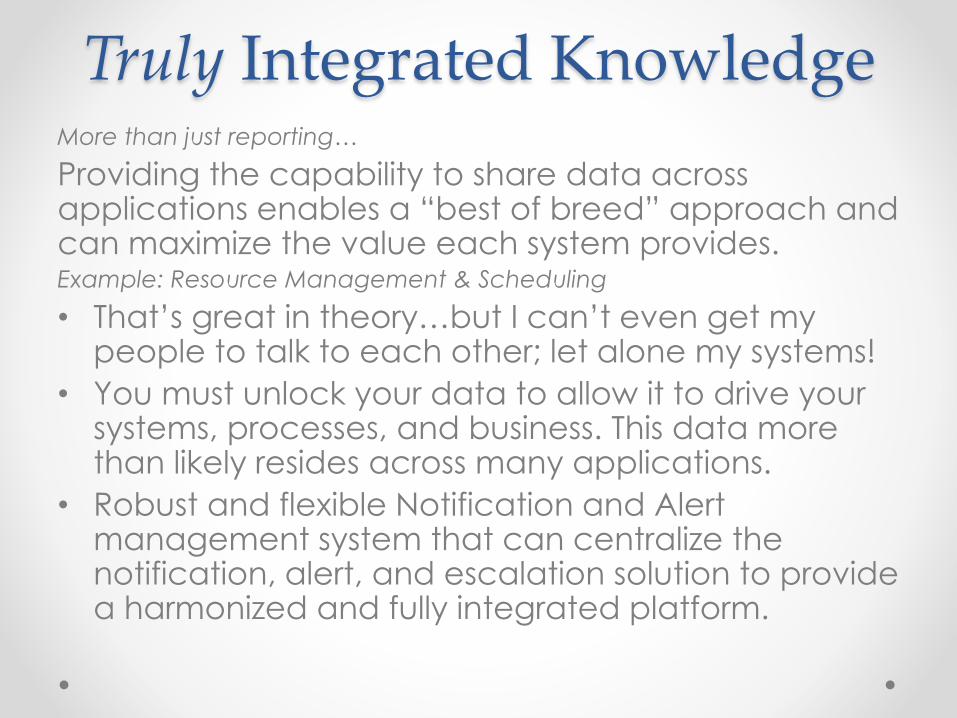
Truly Integrated KnowledgeMore than just reporting…
Providing the capability to share data across applications enables a “best of breed” approach and can maximize the value each system provides.Example: Resource Management & Scheduling
• That’s great in theory…but I can’t even get my people to talk to each other; let alone my systems!
• You must unlock your data to allow it to drive your systems, processes, and business. This data more than likely resides across many applications.
• Robust and flexible Notification and Alert management system that can centralize the notification, alert, and escalation solution to provide a harmonized and fully integrated platform.
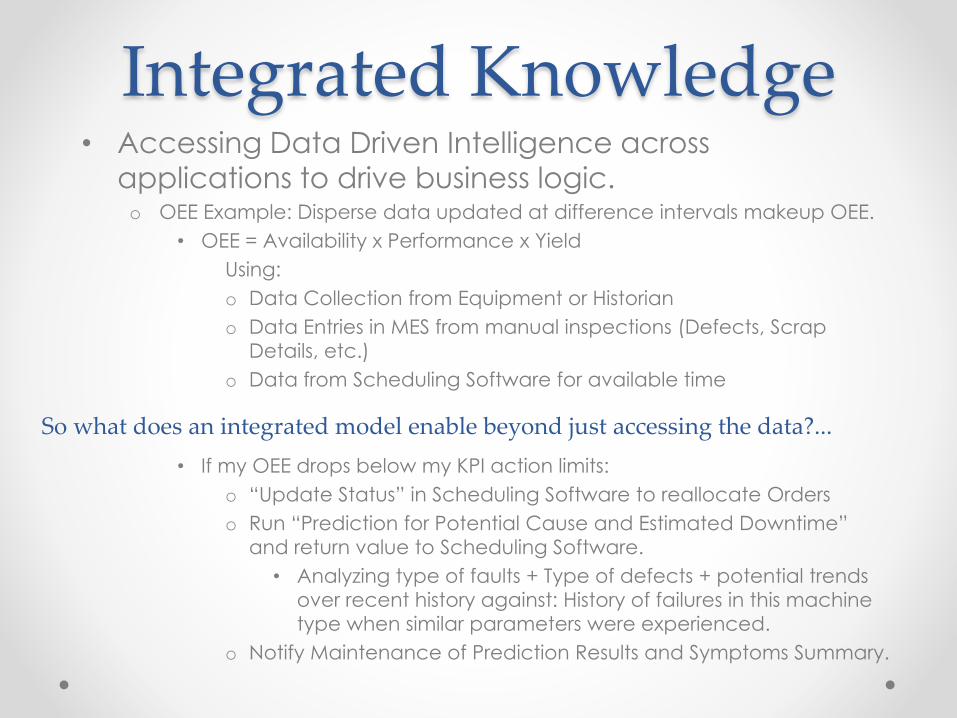
Integrated Knowledge• Accessing Data Driven Intelligence across
applications to drive business logic. o OEE Example: Disperse data updated at difference intervals makeup OEE.
• OEE = Availability x Performance x Yield
Using:
o Data Collection from Equipment or Historian
o Data Entries in MES from manual inspections (Defects, Scrap
Details, etc.)
o Data from Scheduling Software for available time
• If my OEE drops below my KPI action limits:
o “Update Status” in Scheduling Software to reallocate Orders
o Run “Prediction for Potential Cause and Estimated Downtime”
and return value to Scheduling Software.
• Analyzing type of faults + Type of defects + potential trends
over recent history against: History of failures in this machine
type when similar parameters were experienced.
o Notify Maintenance of Prediction Results and Symptoms Summary.
So what does an integrated model enable beyond just accessing the data?...
Tying it all together -Applications that turn
“Big Data” into “Valuable Data”
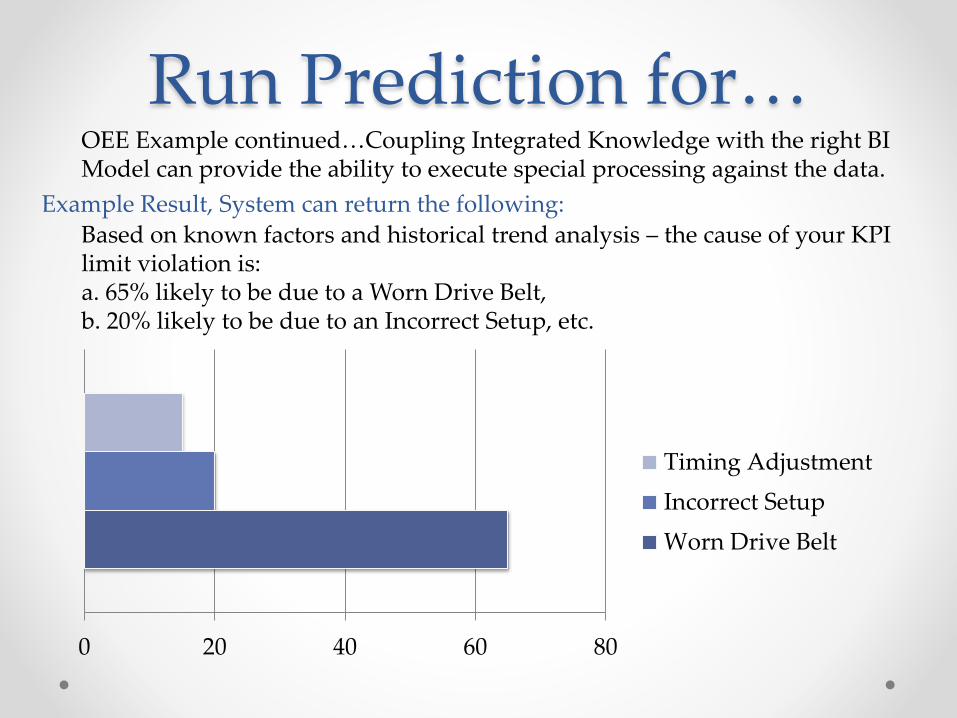
Run Prediction for…
0 20 40 60 80
Timing Adjustment
Incorrect Setup
Worn Drive Belt
OEE Example continued…Coupling Integrated Knowledge with the right BI Model can provide the ability to execute special processing against the data.
Based on known factors and historical trend analysis – the cause of your KPI limit violation is:a. 65% likely to be due to a Worn Drive Belt, b. 20% likely to be due to an Incorrect Setup, etc.
Example Result, System can return the following:

So What Could BI Look Like in
the Practical World?
A Collection of Case Studies

Reducing Lead TimesMAJOR CONCEPTS
•Provide Visibility into Value Chain
•Eliminate Unnecessary Work and Wait Times
•Use Pull System for Materials
•Simplify or Automate Demand Signals/Communication
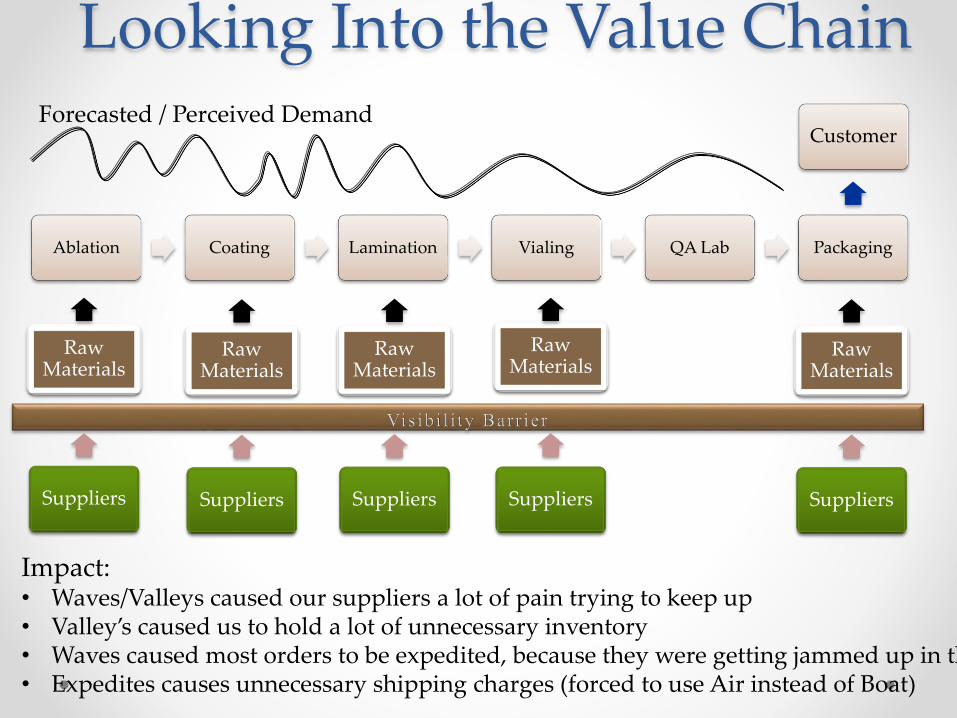
Looking Into the Value Chain
Ablation Coating Lamination Vialing QA Lab Packaging
Raw Materials
Raw Materials
Raw Materials
Raw Materials
Raw Materials
Suppliers Suppliers Suppliers Suppliers Suppliers
CustomerForecasted / Perceived Demand
Impact:• Waves/Valleys caused our suppliers a lot of pain trying to keep up• Valley’s caused us to hold a lot of unnecessary inventory• Waves caused most orders to be expedited, because they were getting jammed up in the process• Expedites causes unnecessary shipping charges (forced to use Air instead of Boat)
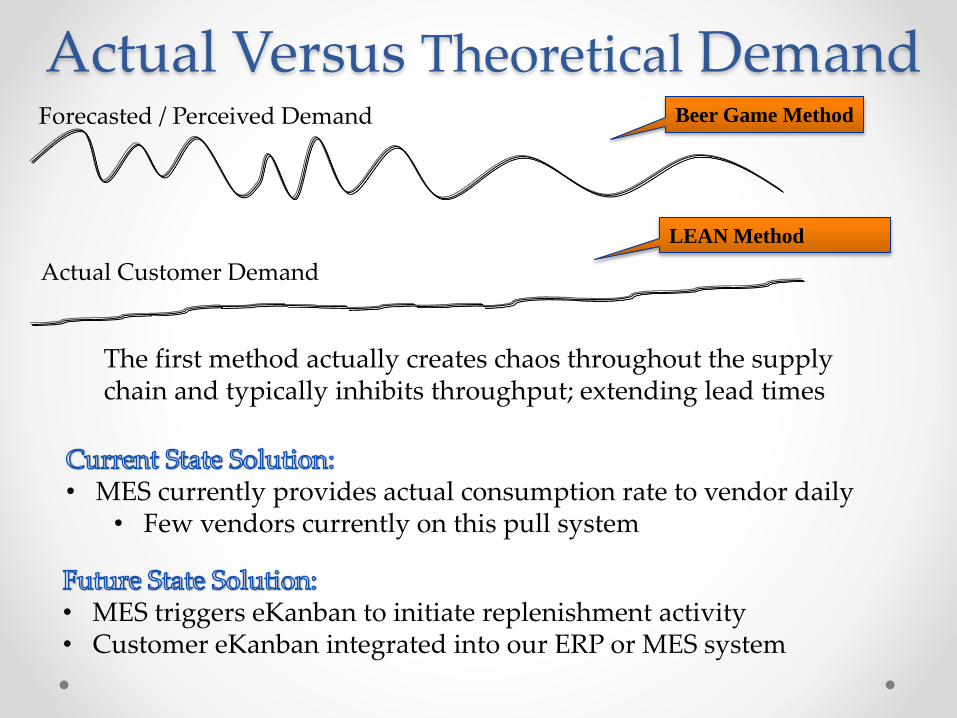
Actual Versus Theoretical DemandForecasted / Perceived Demand
Actual Customer Demand
Beer Game Method
LEAN Method
The first method actually creates chaos throughout the supply chain and typically inhibits throughput; extending lead times
• MES currently provides actual consumption rate to vendor daily• Few vendors currently on this pull system
• MES triggers eKanban to initiate replenishment activity• Customer eKanban integrated into our ERP or MES system
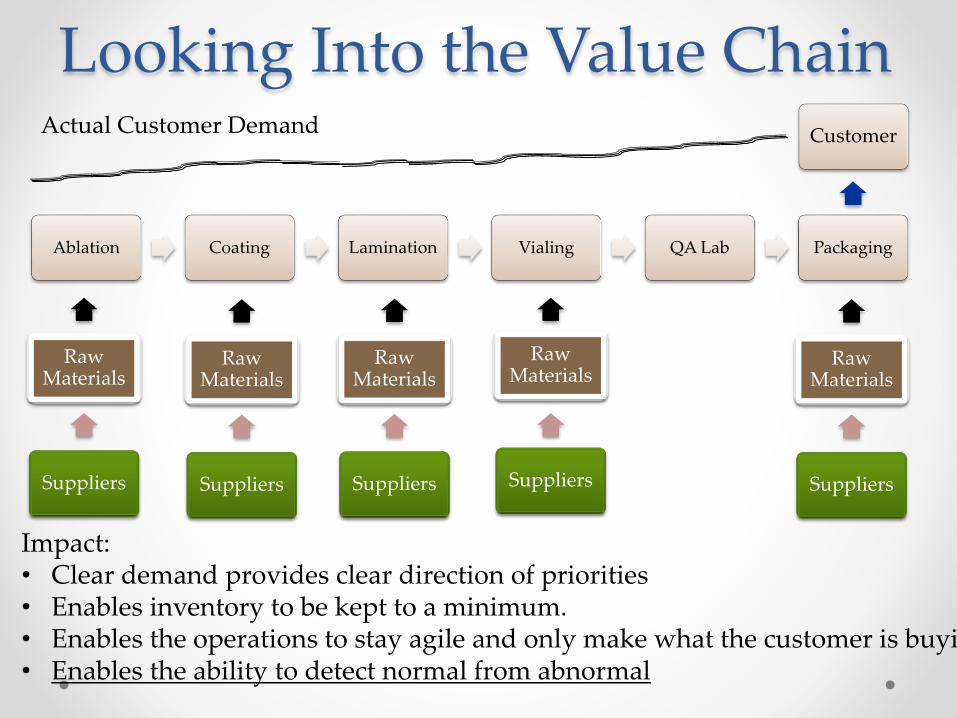
Looking Into the Value Chain
Ablation Coating Lamination Vialing QA Lab Packaging
Raw Materials
Raw Materials
Raw Materials
Raw Materials
Raw Materials
Suppliers Suppliers Suppliers Suppliers Suppliers
Customer
Impact:• Clear demand provides clear direction of priorities• Enables inventory to be kept to a minimum.• Enables the operations to stay agile and only make what the customer is buying• Enables the ability to detect normal from abnormal
Actual Customer Demand
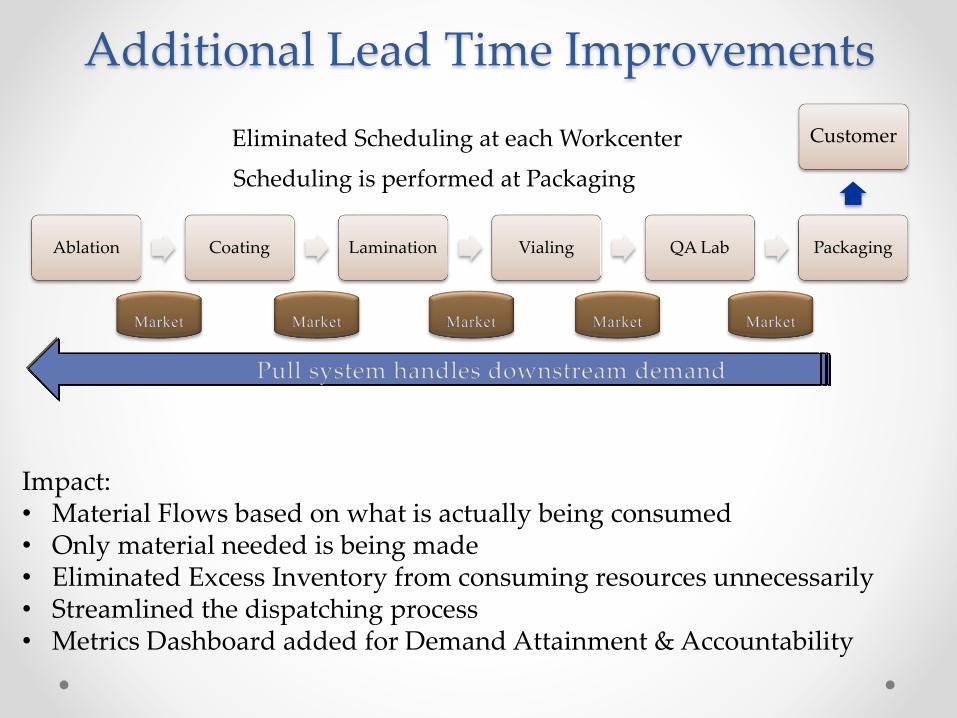
Additional Lead Time Improvements
Ablation Coating Lamination Vialing QA Lab Packaging
Customer
Impact:• Material Flows based on what is actually being consumed• Only material needed is being made• Eliminated Excess Inventory from consuming resources unnecessarily• Streamlined the dispatching process• Metrics Dashboard added for Demand Attainment & Accountability
Eliminated Scheduling at each Workcenter
Scheduling is performed at Packaging
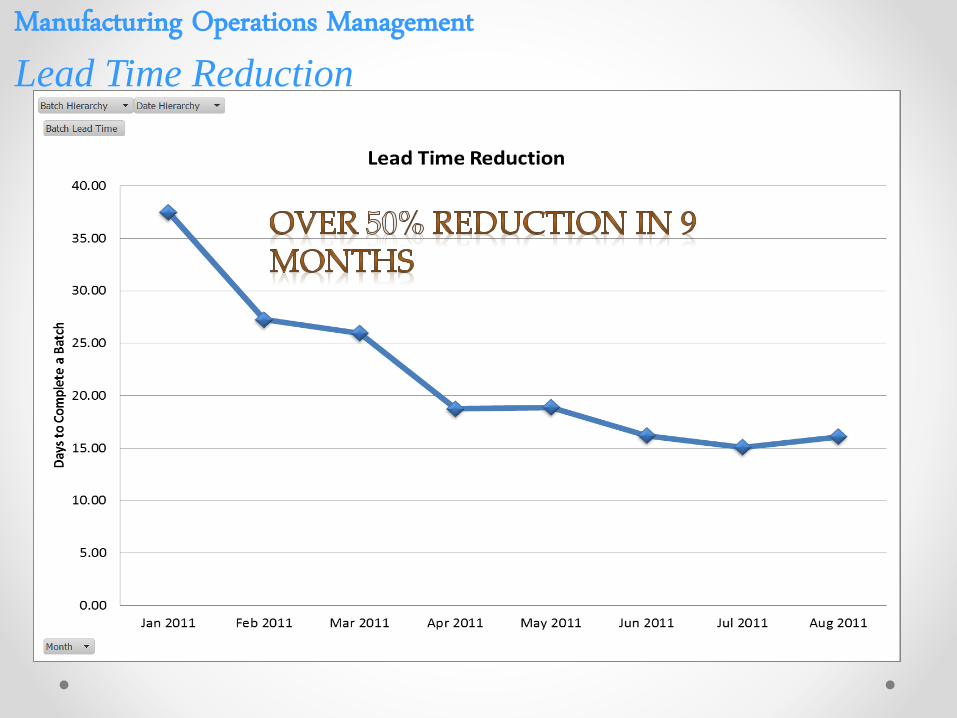
Manufacturing Operations ManagementLead Time Reduction
Manufacturing Operations ManagementLead Time Improvement Lead Time Reduction: Over 50% reduction in 9 months.
Definition: The time it takes to complete a batch from start of process
(LA) until it is released to packaging.
Enabled by MOM system by:
Pareto analysis used to identify top areas of focus.
Real-time visibility into upstream demand requirements and priority.
Trend analysis used for continuous improvement and to ensure
sustainability.
Benefits of reduction:
Improve quality management by reducing the opportunity for work to
be damaged/expired and shortening the time between manufacturing
and performance testing limits risk.
Reduce in-process inventories to free cash flow.
Reduce the dependence on distant forecasts.
Allow easier management of mfg floor due to fewer special cases
(expedited jobs) to oversee.
Intrinsic Results of Real-time
Monitoring
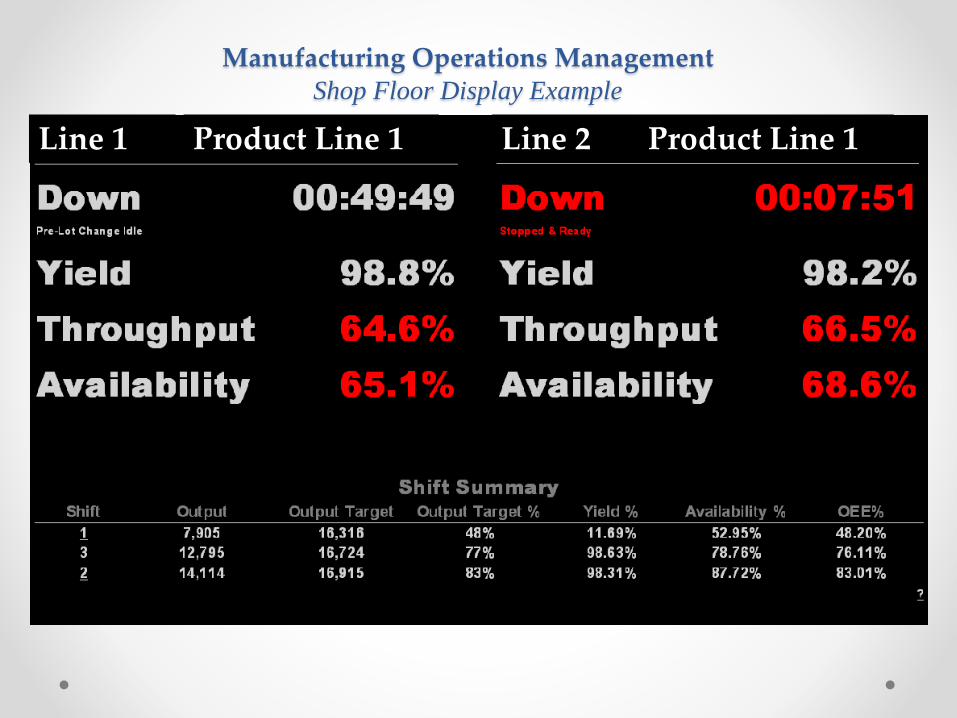
Manufacturing Operations ManagementShop Floor Display Example
Line 1 Line 2Product Line 1 Product Line 1
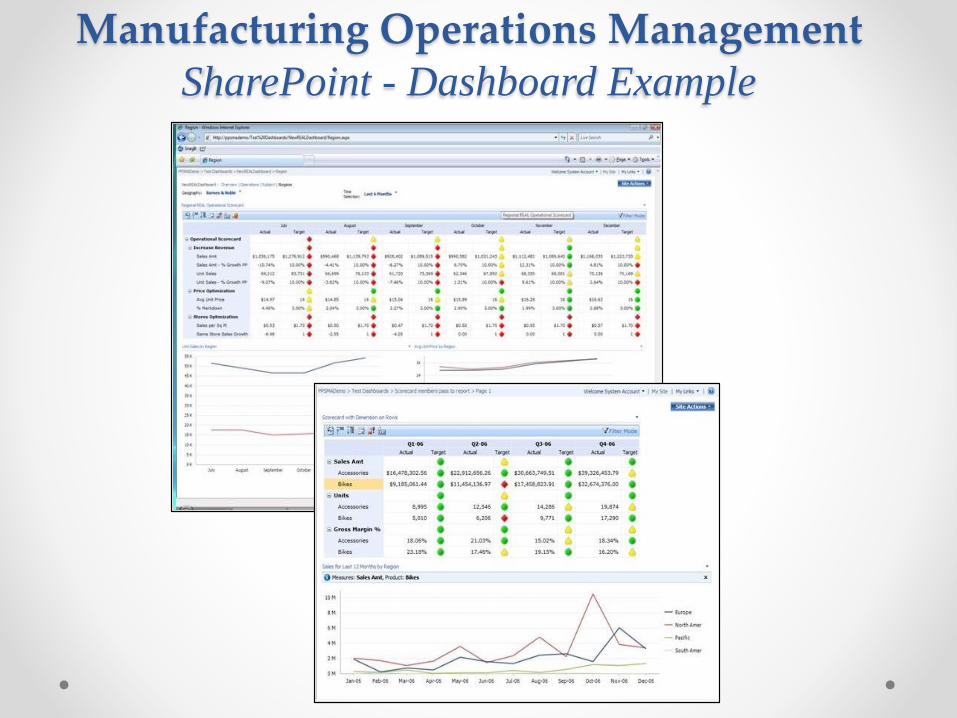
Manufacturing Operations ManagementSharePoint - Dashboard Example

Manufacturing Operations ManagementEfficiency Improvement
…and this is just the improvements made
for one process
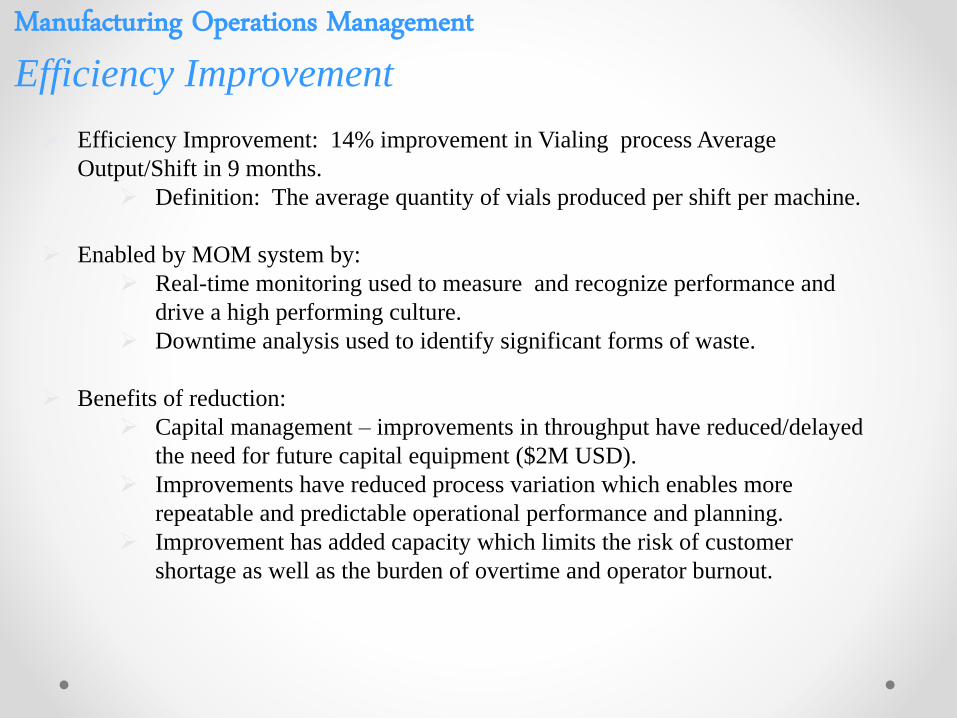
Manufacturing Operations ManagementEfficiency Improvement
Efficiency Improvement: 14% improvement in Vialing process Average
Output/Shift in 9 months.
Definition: The average quantity of vials produced per shift per machine.
Enabled by MOM system by:
Real-time monitoring used to measure and recognize performance and
drive a high performing culture.
Downtime analysis used to identify significant forms of waste.
Benefits of reduction:
Capital management – improvements in throughput have reduced/delayed
the need for future capital equipment ($2M USD).
Improvements have reduced process variation which enables more
repeatable and predictable operational performance and planning.
Improvement has added capacity which limits the risk of customer
shortage as well as the burden of overtime and operator burnout.
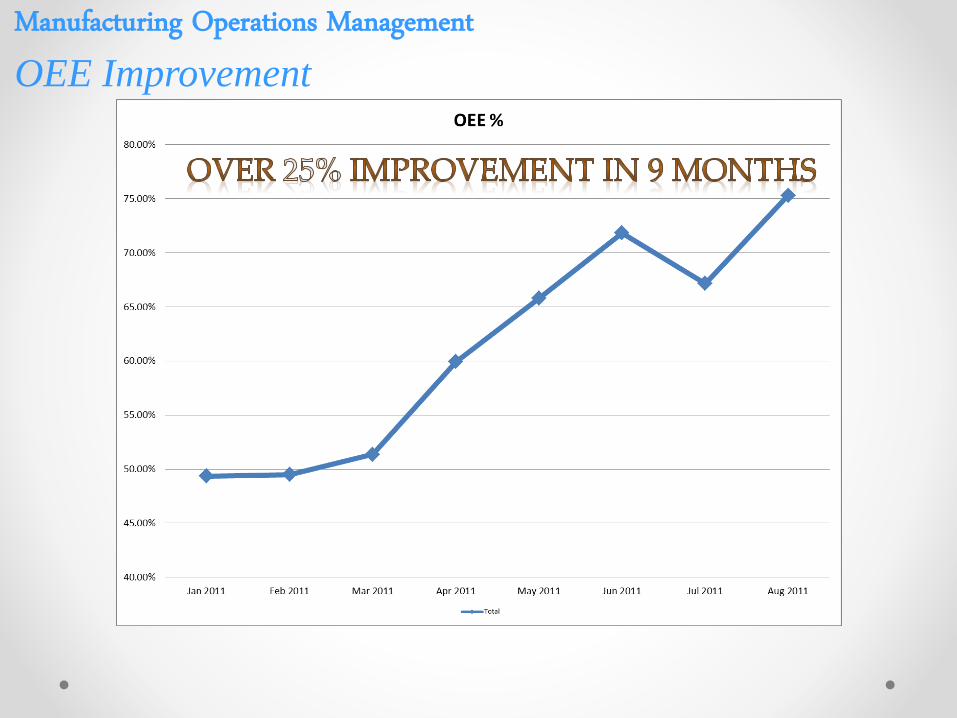
Manufacturing Operations ManagementOEE Improvement
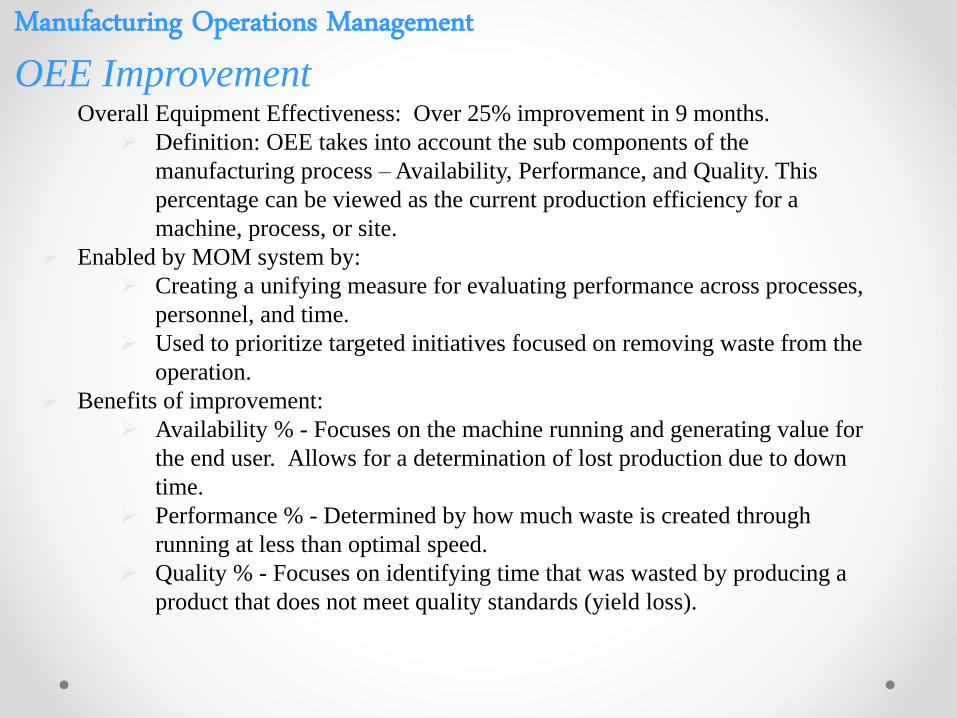
Manufacturing Operations ManagementOEE Improvement Overall Equipment Effectiveness: Over 25% improvement in 9 months.
Definition: OEE takes into account the sub components of the
manufacturing process – Availability, Performance, and Quality. This
percentage can be viewed as the current production efficiency for a
machine, process, or site.
Enabled by MOM system by:
Creating a unifying measure for evaluating performance across processes,
personnel, and time.
Used to prioritize targeted initiatives focused on removing waste from the
operation.
Benefits of improvement:
Availability % - Focuses on the machine running and generating value for
the end user. Allows for a determination of lost production due to down
time.
Performance % - Determined by how much waste is created through
running at less than optimal speed.
Quality % - Focuses on identifying time that was wasted by producing a
product that does not meet quality standards (yield loss).
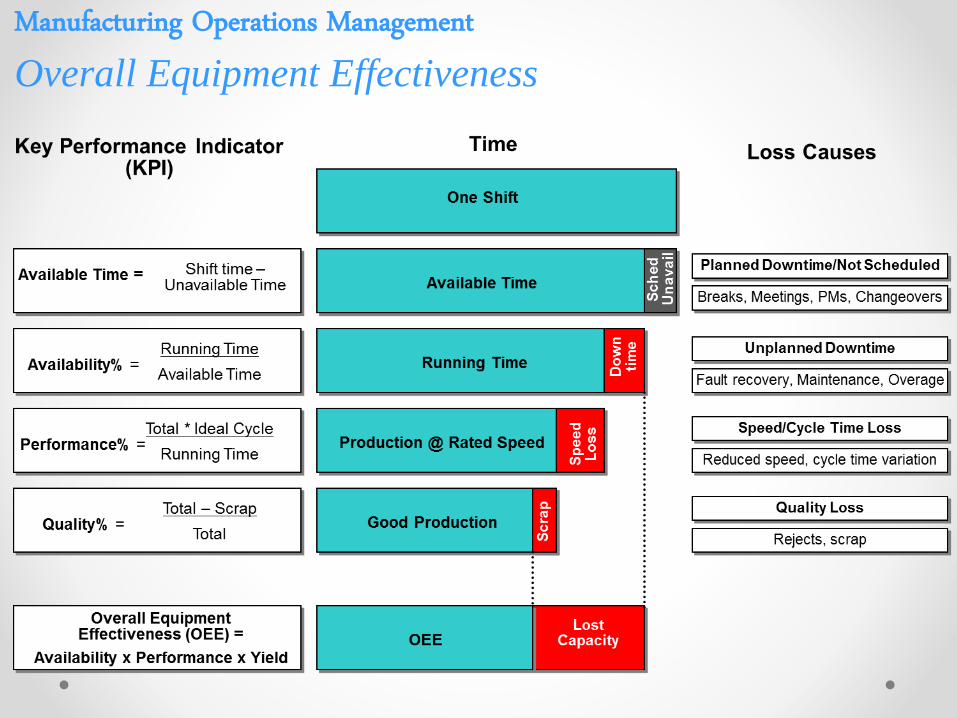
Manufacturing Operations ManagementOverall Equipment Effectiveness
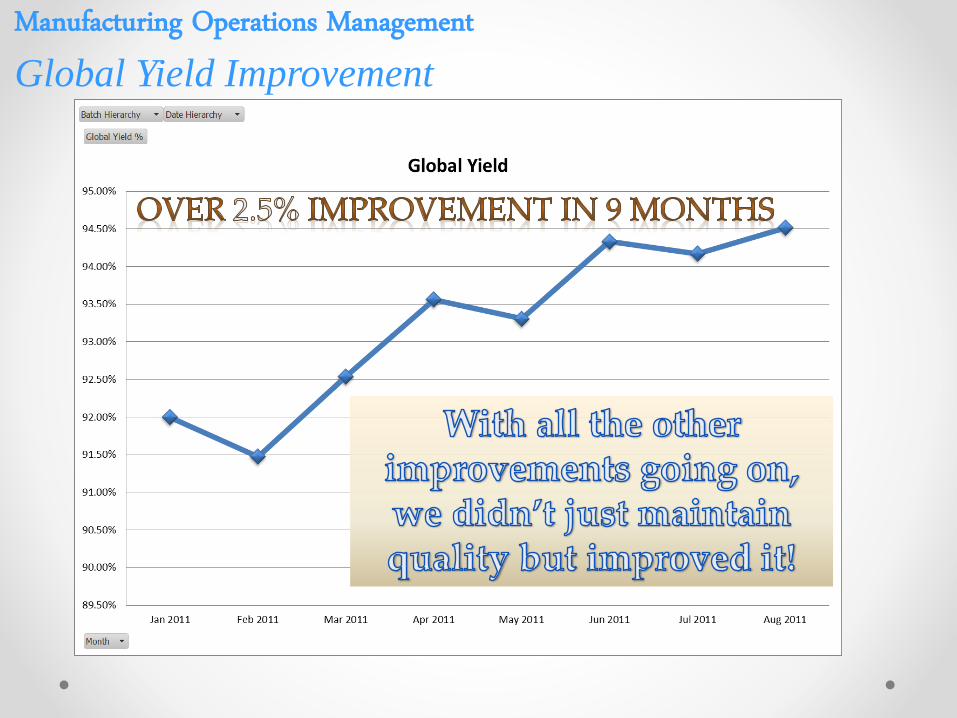
Manufacturing Operations ManagementGlobal Yield Improvement

Manufacturing Operations ManagementGlobal Yield Improvement
Global Yield Improvement: 2.5% improvement in 9 months. This increase is for a
product family that is mature in its lifecycle (6+ years).
Definition: Percentage of product produced (prior to packaging) versus the
quantity issued at start of process (LA).
Enabled by MOM system by:
Monitor machine performance to drive action before process is out of
control.
Reject analysis to understand failure modes, aid countermeasures priority
setting, and highlight outlier events.
Benefits of improvement:
Significant cost reduction – 1% yield improvement over life of the product
is greater than $11M USD.
Reduce non-value-added investigation, disposition, and reporting activities
associated with non conforming material events.
Reduction in reject events drives more repeatable process performance and
efficiencies.
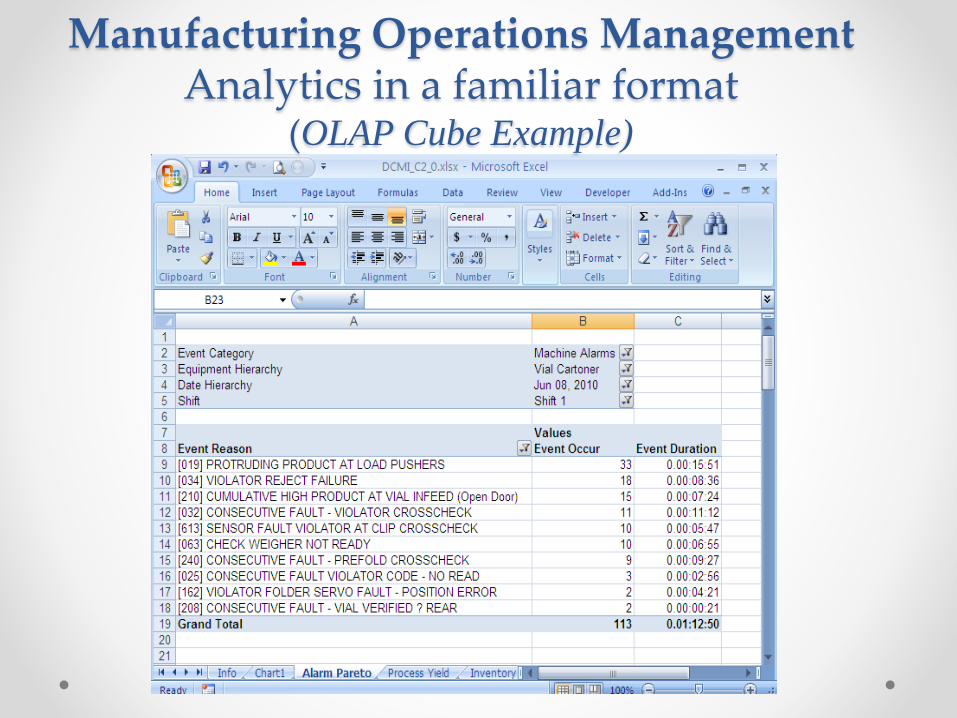
Manufacturing Operations ManagementAnalytics in a familiar format
(OLAP Cube Example)

Thank You
John Dzelme, Regional Director, North America