leveraging an erroneous treatment - data science for · pdf file ·...
TRANSCRIPT

Leveraging an Erroneous Treatment
Did We Wake Sleeping Dogs, Reactivate
Engagement, or Do Nothing At All?
4/6/2016 1
Predictive Analytics WorldSan FranciscoApril 4th, 2016
V1.1 is as presented but with typo’s corrected.
Ming Ng, LinkedIn
Jim Porzak, DS4CI.org

4/6/2016 40/ 2
Outline
1. Uplift modeling background, we skip this!
– See talks earlier today and Eric Siegel’s book –
Chapter 7
2. Lynda.com – What they do. What happened.
3. Analysis – Data, Engagement, & Uplift
4. Conclusions
Appendix has references, tech deep dives, and links to learn more.

Lynda.com
1. Lynda founded in 1995, bought by Linkedin in 2015.
2. A subscription based e-learning company.
3. Access to 8000+ online courses.
4. Members start with a free trial.
5. At end of the trial, customers can cancel or be billed
$24.99 or $34.99 monthly for a subscription.
6. Members are automatically billed unless they cancel.
7. Cancelled members can reactivated their account.
4/6/2016 39/ 3

Lynda.com Hompage
4/6/2016 38/ 4

4/6/2016 37/ 5
Trial Signup Page

4/6/2016 36/ 6
Videos on
Lynda.com

Typical Customer Behavior
4/6/2016 35/ 7
Paid Subscription Start
1st auto renewal
2nd auto renewal
Cancel request, this will stop auto next renewal
User Reactivation
Access end, subscription not renewed

Site Error
● When user signs up, they can opt-in to receive a payment receipt via email.
The default is to opt-out. Very few opt-in.
● A site error caused users that are opted-out to get an email receipt thanking
them for their payment. This error lasted for 8 days in mid August 2015.
4/6/2016 34/ 8
“Thanks for your payment”
email sent.

The erroneous “Thanks” Email
In the Gmail inbox, it looks like this:
4/6/2016 33/ 9

Which raises the business question:
What did the erroneous “Thanks” email do?
● Did We Wake Sleeping Dogs?
– Cause a cancel which would not have happened.
● Reactivate Engagement?
– Cause an increase in video viewing.
● Do Nothing At All?
4/6/2016 32/ 10

The Analysis Workflow
1. Build our “Sleeping Dogs” data set
2. Exploratory data analysis & data profiling
3. Did erroneous “Thanks” email increase engagement?
1. Look for increase in user video viewing activity.
4. Did they cause cancels?
1. Use information value (IV), weight of evidence (WOE), and
variable clustering to screen & select predictors.
2. Build the uplift model.
5. Evaluate models & report results.
4/6/2016 31/ 11

Building Data Sets – 1 of 4
We need two data sets for the two questions:
1. Did erroneous “Thanks” email increase
engagement?
● For non-cancelers, get video engagement metrics for 30
days before and 30 days after email.
2. Can we find an uplift churn effect?
● Data about subscriber, subscription, video metrics, and if
they canceled.
● Include metrics up to time of email only – no future
looking metrics!
● Do 70/30 split into training and validation sub-sets
4/6/2016 30/ 12

Building Data Sets – 2 of 4
Secret weapon: Redshift subscriber data mart.
4/6/2016 29/ 13
Design:• Models subscriber behavior• Wide tables – easy to understand• High data quality• Very fast to access
Three levels of abstraction:1. “Everything” about our subscribers.2. “Everything” about their subscription chain(s).3. “Everything” about their content usage stints.
To get details, just Google: “site:ds4ci.org structuring data”

Building Data Sets – 3 of 4
For engagement question:
● Select monthly subscribers with a renewal in August, 2015 who
did renew.
● Record if they got the erroneous “Thanks” email.
● Gather metrics over 30 days prior & 30 days after:
4/6/2016 28/ 14
• Top primary topic in period• % stints w/ top primary topic• Number of topics in period• % stints w/ top 3 primary topics
• Days since last stint; until next stint• Number of days active in period• Number of stints in period• Total minutes in period
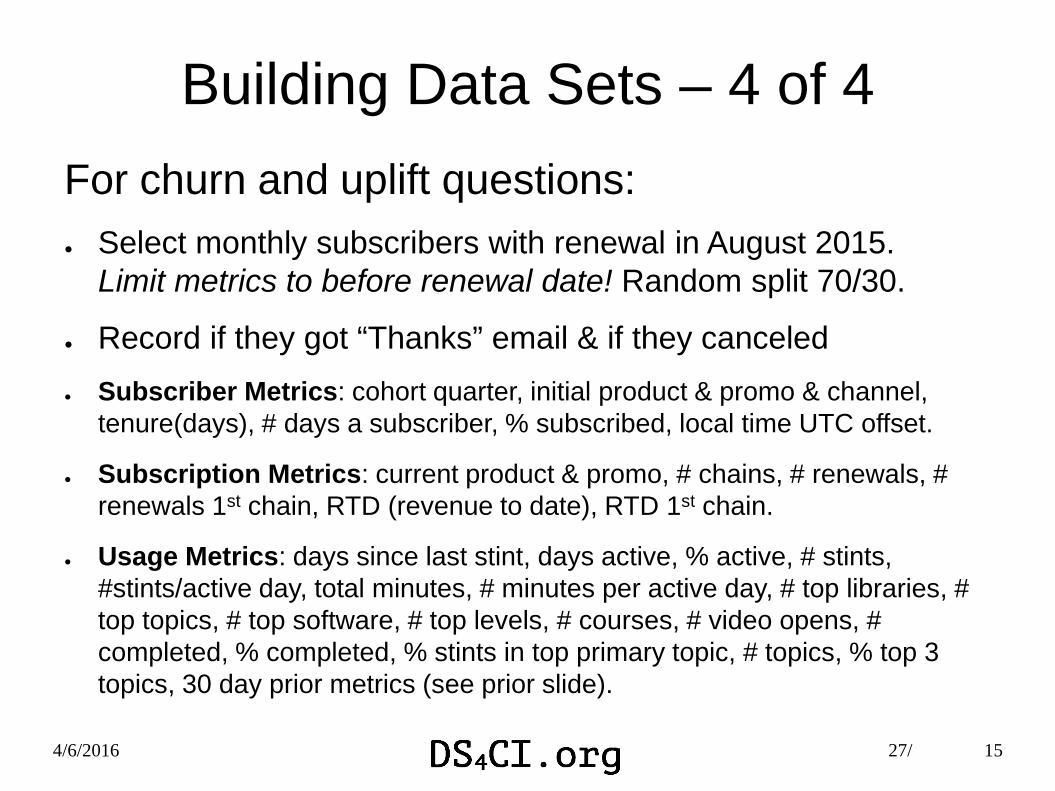
Building Data Sets – 4 of 4
For churn and uplift questions:
● Select monthly subscribers with renewal in August 2015.
Limit metrics to before renewal date! Random split 70/30.
● Record if they got “Thanks” email & if they canceled
● Subscriber Metrics: cohort quarter, initial product & promo & channel,
tenure(days), # days a subscriber, % subscribed, local time UTC offset.
● Subscription Metrics: current product & promo, # chains, # renewals, #
renewals 1st chain, RTD (revenue to date), RTD 1st chain.
● Usage Metrics: days since last stint, days active, % active, # stints,
#stints/active day, total minutes, # minutes per active day, # top libraries, #
top topics, # top software, # top levels, # courses, # video opens, #
completed, % completed, % stints in top primary topic, # topics, % top 3
topics, 30 day prior metrics (see prior slide).
4/6/2016 27/ 15

Full data set down sampled to 180k Monthly Subscribers
with a renewal date in Aug, 2015
Products:
1001 is “Standard
Monthly” subscription.
1008 is “Premium”
with a price point
about 40% above the
standard subscription.
4/6/2016 26/ 16

Engagement Increase? – 1 of 4Where we compare video consumption metrics in the 30 days after renewal
with the same metric 30 days prior to renewal.
Issue is a large number of subscribers have no usage stints in one or both
periods.
Solution: Define “before to after” acceleration levels as a factor these levels:
4/6/2016 25/ 17
Acceleration Level Before After Beforeis NA
Afteris NA
After / Before Ratio
None at All Yes Yes
All Before Yes
Big Down < 0.25
Down >= 0.25 & < 0.75
Same >= 0.75 & < 1.3333
Up >= 1.3333 & < 4
Big Up > =4
All After Yes

Engagement Increase? – 2 of 4
The other Before/After metrics tell the same story.
4/6/2016 24/ 18

Engagement Increase? – 3 of 4
Check the increase in proportion of “All After”
counts to total counts for Total Minutes
> prop.test(All_After, N)
2-sample test for equality of proportions with continuity correction
data: All_After out of N
X-squared = 95.4, df = 1, p-value < 2.2e-16
alternative hypothesis: two.sided
95 percent confidence interval:
0.01408414 0.02135104
sample estimates:
In Error Normal
0.1450992 0.1273817
A 1.77 % point increase in subscribers who were inactive
before the email and watched videos after the email.
4/6/2016 23/ 19
Engagement Increase? – 4 of 4
Business implications
● Even this “frank” reminder that one is
subscribed to Lynda.com can reactivate some
inactive subscribers!
● Opportunity to test in future:
1. Positive engagement messaging to inactive
subscribers
2. Uplift modeling to sort out persuadable inactive
subscribers
4/6/2016 22/ 20

Moving on to Churn Data Set
Three steps in this initial analysis:
1. Look at information value (IV) and weight of evidence (WOE)
for binary classification problem. Initial paring down of
candidate predictors.
2. Look at net information value (NIV) and net weight of evidence
(NWOE) for uplift problem. Exploratory look at reasonableness
of uplift effort.
3. Do variable clustering and selection based on NIV. To get final
set of candidate predictors for uplift.
Basically, we are following the example in Kim Larsen’s
Information Package Vignette
4/6/2016 21/ 21

Churn – Info Value & WOE – 1 of 3
Using Kim Larsen’s information package in R for IV, WOE, and Variable Selection.
4/6/2016 20/ 22
Initially we look at the binary classifier problem – did subscribers cancel?
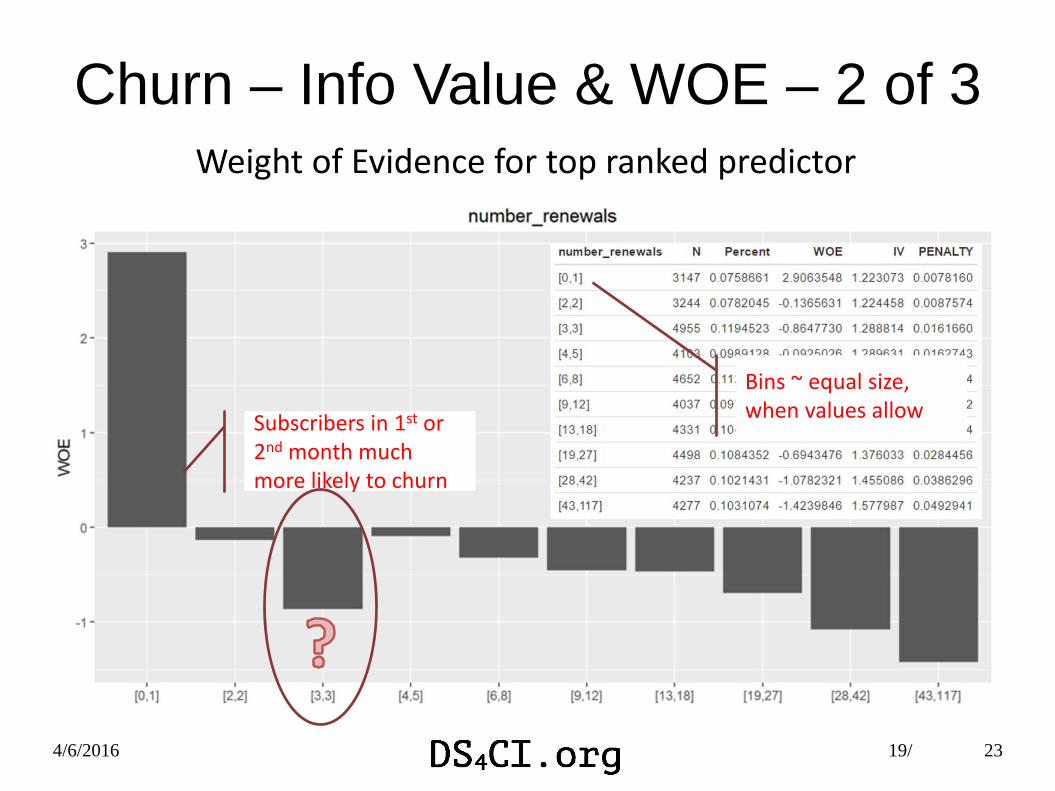
Churn – Info Value & WOE – 2 of 3
4/6/2016 19/ 23
Weight of Evidence for top ranked predictor
Subscribers in 1st or 2nd month much more likely to churn
Bins ~ equal size, when values allow

Churn – Info Value & WOE – 3 of 3
4/6/2016 18/ 24
WOE for Predictors ranked 2nd through 5th

Uplift – Net Info Value & NWOE – 1 of 3
4/6/2016 17/ 25
Now we look at influence of the treatment – “Thanks” email.

Uplift – Net Info Value & NWOE – 2 of 3
4/6/2016 16/ 26
Net WOE for top ranked predictor

Uplift – Net Info Value & NWOE – 3 of 3
4/6/2016 15/ 27
Net WOE for 2nd through 5th ranked predictors

Net IV Variable Clustering – 1 of 3
4/6/2016 14/ 28
From each cluster, pick variable with highest Net IV

Net IV Variable Clustering – 2 of 3
4/6/2016 13/ 29
From each cluster, pick variable with highest Net IV. Here are first six clusters:

Net IV Variable Clustering – 3 of 3
4/6/2016 12/ 30
The final 17 predictors to be passed to uplift modeling.

Now we are ready for uplift
Analysis steps:
1. Check train/validate split did not introduce bias
2. Run both upliftRF & ccif methods – pick best for deep dive
3. Get NIV via uplift. Compare with what we got from Information.
4. Plot relative importance of candidate predictors.
5. Profile resulting model: Predicted uplift & predictors
6. Business implications. What did we learn? Next steps?
Basically, following Chapters 10 & 11 in Leo Guelman’s PhD
Thesis: Optimal personalized treatment learning models with
insurance applications.
4/6/2016 11/ 31
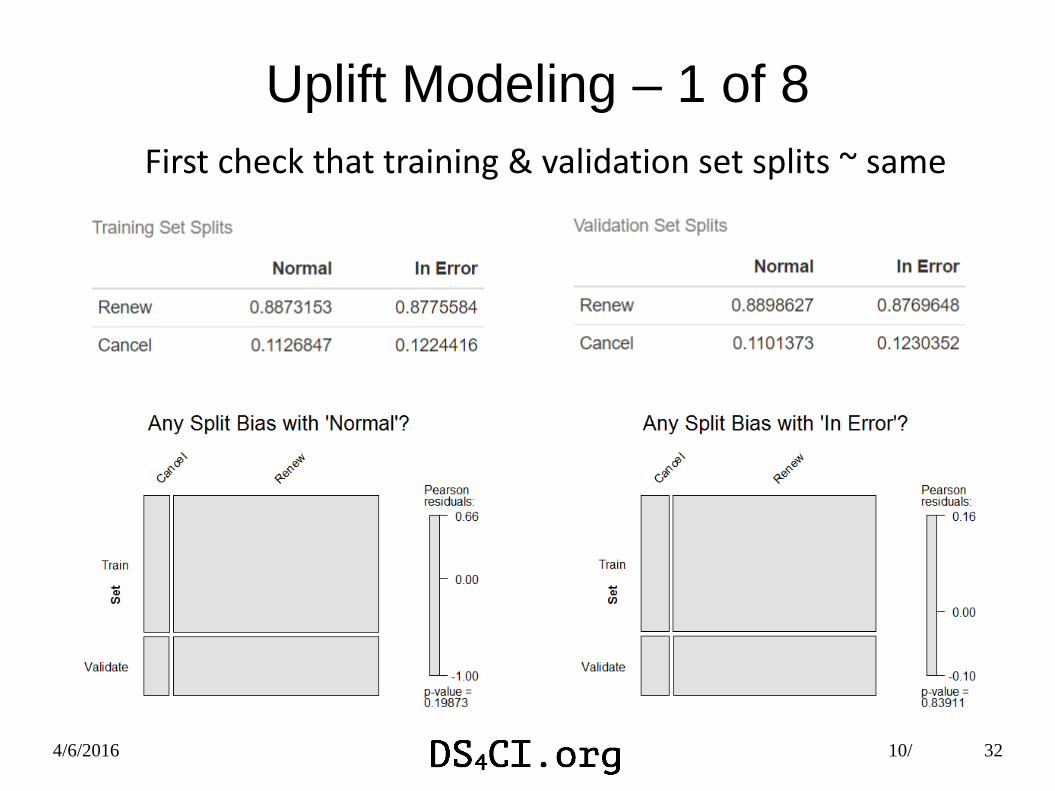
Uplift Modeling – 1 of 8
4/6/2016 10/ 32
First check that training & validation set splits ~ same

Uplift Modeling – 2 of 8
Uplift Random Forest
(aka upliftRF)
● A variation of the classic Leo
Breiman method.
● Well known
● Pretty fast
● Issues – see ccif
Causal Conditional Inference
Forests (aka ccif)
● Fixes issues with upliftRF
1. Overfitting
2. Selection bias toward covariates
with many possible splits
● Slow (but Leo working on update)
● Better lift & better story
4/6/2016 9/ 33
The two modeling methods we looked at.
We are using the R package “uplift” by Leo Guelman. See Appendix for pseudo code of each method & references.
Used This

Uplift Modeling – 3 of 8
4/6/2016 8/ 34
Qini Curves & Coefficient for Each Method

Uplift Modeling – 4 of 8
4/6/2016 7/ 35
Net IV from uplift Net IV from information
1
2
2
1
4
7
8
1
1
3
11
7
7
4

Uplift Modeling – 5 of 8
4/6/2016 6/ 36
ccif Relative Importance (in separating positive & negative outcomes)

Predicted Uplift
Subscriber Tenure (days)
Uplift Modeling – 6 of 8
4/6/2016 5/ 37
ccif Predicted Uplift & Top Predictor – Subscriber Tenure (days)Grouped in vigintiles by predicted uplift ranking.
170 -110 days

Uplift Modeling – 7 of 8
4/6/2016 4/ 38
Four interesting predictors: A) # Videos Completed, B) # Stints / Active Day, C) # Top Libraries, D) % Stints w/ Top Primary Topic
A
B
C
D

Uplift Modeling – 8 of 8
4/6/2016 3/ 39
Groups with positive uplift
6% more likely to churn when reminded they are paying
Lynda.com

Next Steps
Experiments to:
1. Determine best uplift groups to increase engagement
of inactive subscribers.
2. Try a positive “You are a member” message rather
than a negative “Thanks for you payment” message.
Data deep dive:
1. Figure out who are the Group 17-20 subscribers
(those with negative uplift) who’s first subscription
was 110 – 170 days before August, 2015 billing.
4/6/2016 2/ 40
Remember the business question?
What did the erroneous “Thanks” email do?
● Did We Wake Sleeping Dogs?
– Cause a cancel which would not have happened.
● Reactivate Engagement?
– Cause an increase in video viewing.
● Do Nothing At All?
4/6/2016 32/ 41
Subscribers, being people, responded differently to the “Thanks” email. Some negatively, some positively and, for most, it had no effect. Isn’t marketing fun!

What We Covered
● Lynda.com – What they do & what happened
● Building data sets
● Apply Information package for IV & WOE
● Variable selection for uplift model
● Apply uplift package
● Business conclusions
4/6/2016 1/ 42
Questions? Comments?Now is the time!
Contacts:[email protected]

APPENDIX
1. Uplift algorithm pseudo code for upliftRF & ccit.
2. R environment used in this analysis.
3. Learning More – Where to Start?
4/6/2016 43

upliftRF Uplift Pseudocode
4/6/2016 44
From: Guelman, L., Guillen, M. and Perez-Marin, A.M. (2014) “Optimal personalized treatment rules for marketing interventions: A review of methods, a new
proposal, and an insurance case study.”, UB Riskcenter Working Papers Series 2014-06
Where,B is # trees to grow,
KL is Kulback-Leiberdistance

ccif Uplift Pseudocode
4/6/2016 45
From: Guelman, L., Guillen, M. and Perez-Marin, A.M. (2014) “Optimal personalized treatment rules for marketing interventions: A review of methods, a new
proposal, and an insurance case study.”, UB Riskcenter Working Papers Series 2014-06
Where,B is # trees to grow,A is treatment flag,
𝐺2 is split criteria proposed by Su et al. See Guelman et al, equation (19)

R Environment Used
● R download https://cran.rstudio.com/index.html
● RStudio download https://www.rstudio.com/
● R Packages (https://cran.rstudio.com/web/packages/) :
● Hadley Wickham: ggplot2, dplyr, tidyr, readr, stringr
● Yihui Xie: knitr
● David Meyer, et al: vcd
● Michael Friendly: vcdExtra
● Kim Larsen: Information
● Marie Chavent, et al: ClustOfVar
● Leo Guelman: uplift
4/6/2016 46

4/6/2016 47
Learning More – Where to Start?
● Jim’s Archives www.ds4ci.org/archives
– Structuring Data for Customer Insights for more about the Redshift CI datamart.
● Uplift Modeling
– Eric Siegel, Predictive Analytics: The Power to Predict Who Will Click, Buy, Lie, or Die – Revised and
Updated. (2016) Chapter 7.
– PAW SF 2016 Sessions:
● Eric Sigel, Case Study: U.S. Bank; Uplift Modeling: Optimize for Influence and Persuade by the Numbers
● Patrick Surry, Case Study: Telenor; Applying Next Generation Uplift Modeling to Optimize Customer Retention Programs
– Leo Guelman, et al (the author of the R package uplift):
● Optimal personalized treatment rules for marketing interventions: A review of methods, a new proposal, and an
insurance case study
● Optimal personalized treatment learning models with insurance applications. (PhD Thesis)
– Michal Soltys et al, Ensemble methods for uplift modeling
● Information Value & Weight of Evidence
– Kim Larsen – stichfix blog post or Information package vignette
● Visualizing categorical data
– Vignettes in vcd and vcdextra packages
– Discrete Data Analysis with R, Friendly & Meyer, CRC Press (2015)