leveraging big data for intelligent water utility management · leveraging big data for intelligent...
TRANSCRIPT
© Copyright 2017 OSIsoft, LLCAUSTIN REGIONAL SEMINAR 2017© Copyright 2017 OSIsoft, LLC
Gary Wong
Principal, Global Water IndustryOSIsoft
Leveraging Big Data for Intelligent
Water Utility Management

© Copyright 2017 OSIsoft, LLCAUSTIN REGIONAL SEMINAR 2017
Barrick Gold
Digital mine $700
gold
Improving water
quality
IBM
Reduced water and
power costs by $10
million in
semiconductor fab
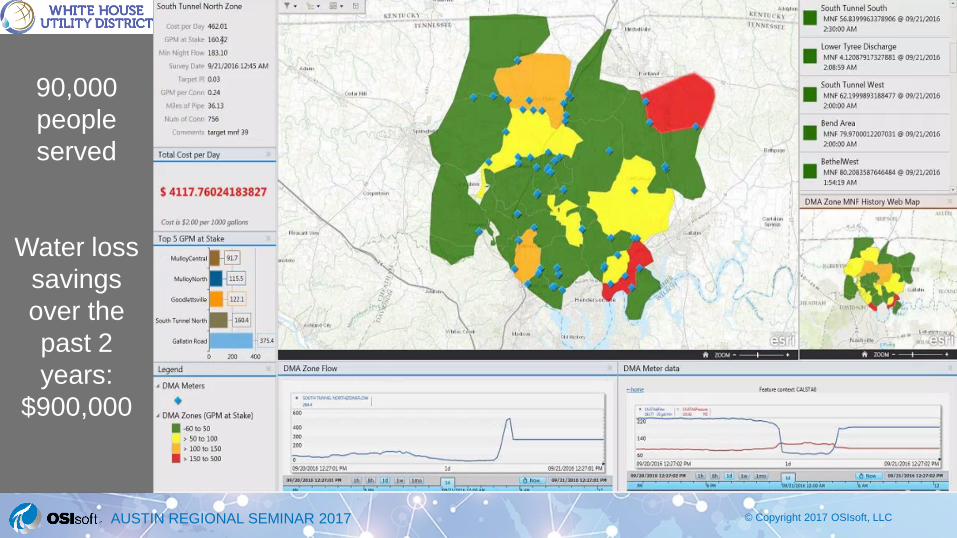
White House UD
Saved $900,000
reducing leaks
Thames Water
Reduced energy
usage by 10% and
saved millions in fines
Data Is Your Most Important Resource
© Copyright 2017 OSIsoft, LLCAUSTIN REGIONAL SEMINAR 2017
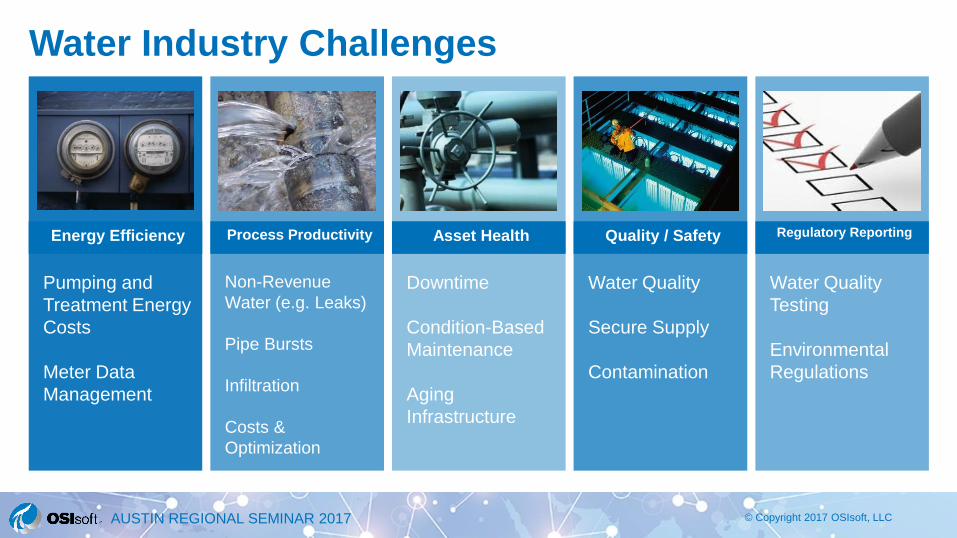
Pumping and
Treatment Energy
Costs
Meter Data
Management
Non-Revenue
Water (e.g. Leaks)
Pipe Bursts
Infiltration
Costs &
Optimization
Downtime
Condition-Based
Maintenance
Aging
Infrastructure
Water Quality
Secure Supply
Contamination
Water Quality
Testing
Environmental
Regulations
Energy Efficiency Process Productivity Asset Health Quality / Safety Regulatory Reporting
Water Industry Challenges
© Copyright 2017 OSIsoft, LLCAUSTIN REGIONAL SEMINAR 2017
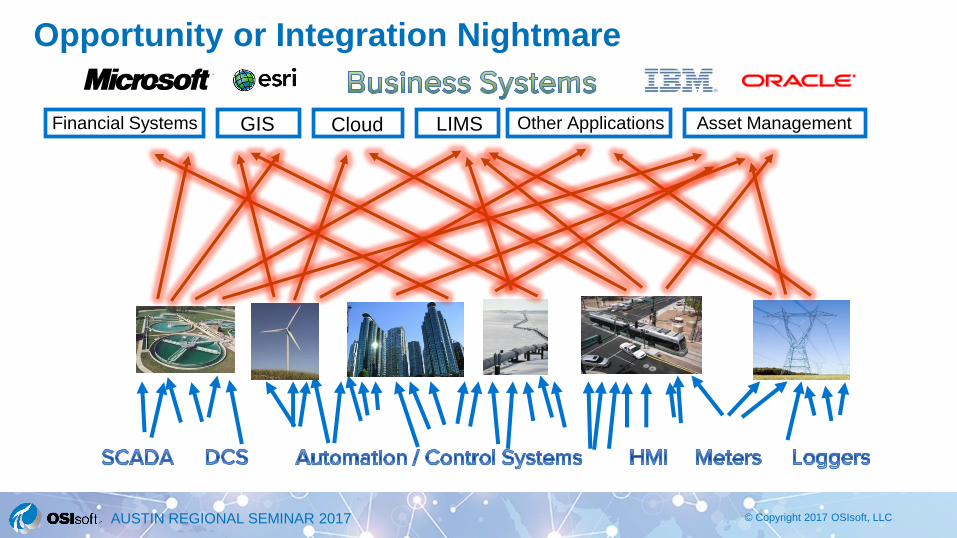
Opportunity or Integration Nightmare
Financial Systems GIS Cloud Other ApplicationsLIMS Asset Management
Operations Data Management Infrastructure

© Copyright 2017 OSIsoft, LLCAUSTIN REGIONAL SEMINAR 2017
A Data Infrastructure Strategy
Operations Data Management Infrastructure
Financial Systems GIS Cloud Other ApplicationsLIMS Asset Management
Operations Data Management Infrastructure
© Copyright 2017 OSIsoft, LLCAUSTIN REGIONAL SEMINAR 2017
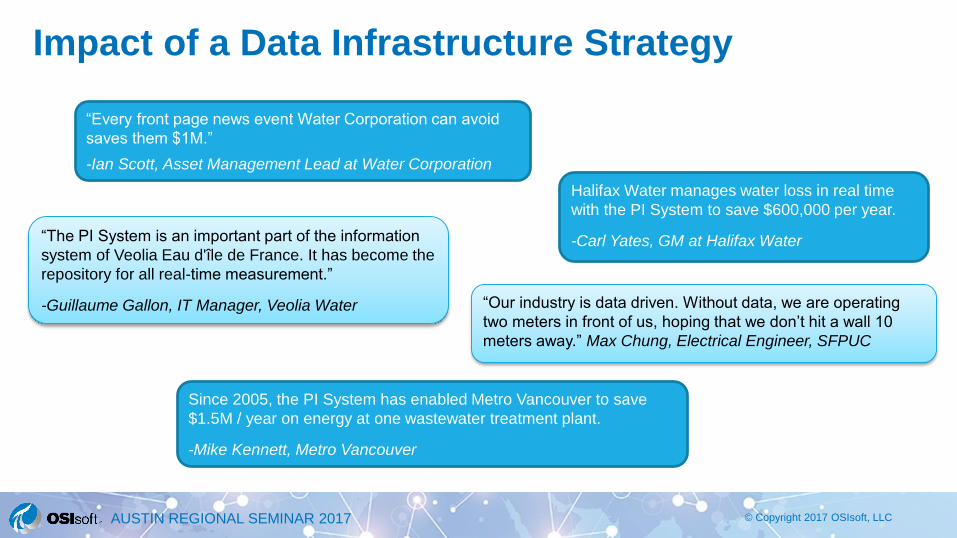
Impact of a Data Infrastructure Strategy
“Every front page news event Water Corporation can avoid
saves them $1M.”
-Ian Scott, Asset Management Lead at Water Corporation
“The PI System is an important part of the information
system of Veolia Eau d'île de France. It has become the
repository for all real-time measurement.”
-Guillaume Gallon, IT Manager, Veolia Water “Our industry is data driven. Without data, we are operating
two meters in front of us, hoping that we don’t hit a wall 10
meters away.” Max Chung, Electrical Engineer, SFPUC
Since 2005, the PI System has enabled Metro Vancouver to save
$1.5M / year on energy at one wastewater treatment plant.
-Mike Kennett, Metro Vancouver
Halifax Water manages water loss in real time
with the PI System to save $600,000 per year.
-Carl Yates, GM at Halifax Water
© Copyright 2017 OSIsoft, LLCAUSTIN REGIONAL SEMINAR 2017
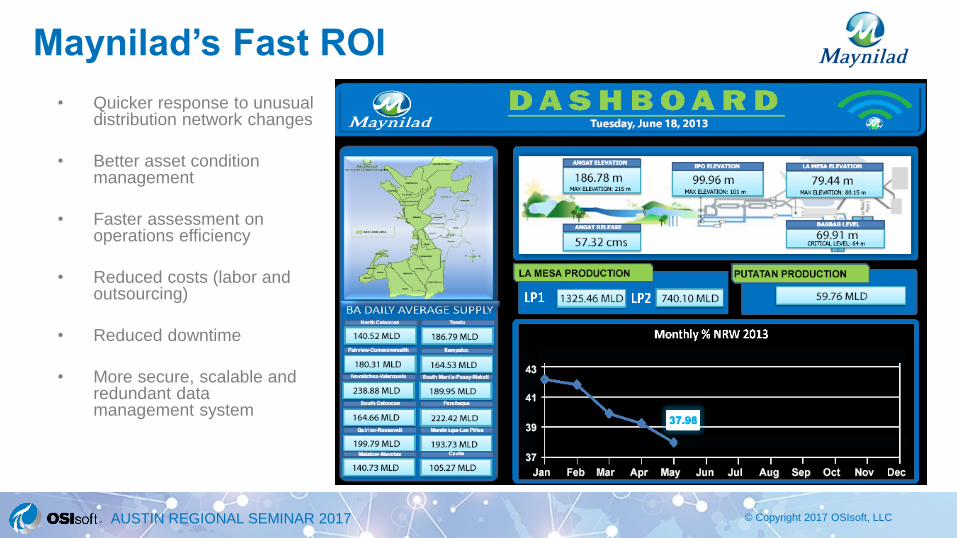
Maynilad’s Fast ROI
• Quicker response to unusual distribution network changes
• Better asset condition management
• Faster assessment on operations efficiency
• Reduced costs (labor and outsourcing)
• Reduced downtime
• More secure, scalable and redundant data management system
© Copyright 2017 OSIsoft, LLCAUSTIN REGIONAL SEMINAR 2017
Video: CIO @ Maynilad Water
© Copyright 2017 OSIsoft, LLCAUSTIN REGIONAL SEMINAR 2017
90,000
people
served
Water loss
savings
over the
past 2
years:
$900,000
© Copyright 2017 OSIsoft, LLCAUSTIN REGIONAL SEMINAR 2017
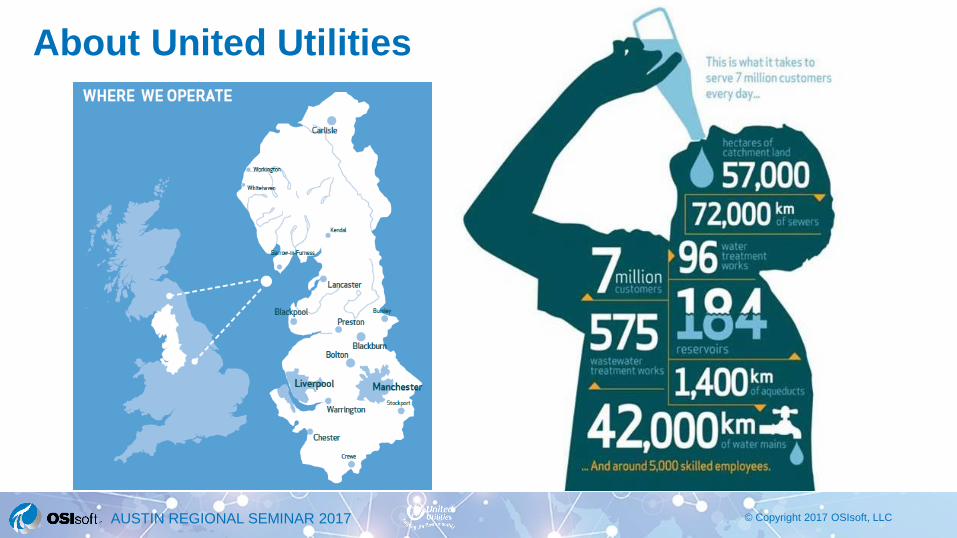
About United Utilities

© Copyright 2017 OSIsoft, LLCAUSTIN REGIONAL SEMINAR 2017
• Regulatory and customer commitments
• Improve key performance metrics
– Outcomes, blockages, spills
• Increase efficiency
– Reduce tot.ex: cap.ex and op.ex
• Leverage technology disruptors
• Apply innovation
Challenges at United Utilities
© Copyright 2017 OSIsoft, LLCAUSTIN REGIONAL SEMINAR 2017
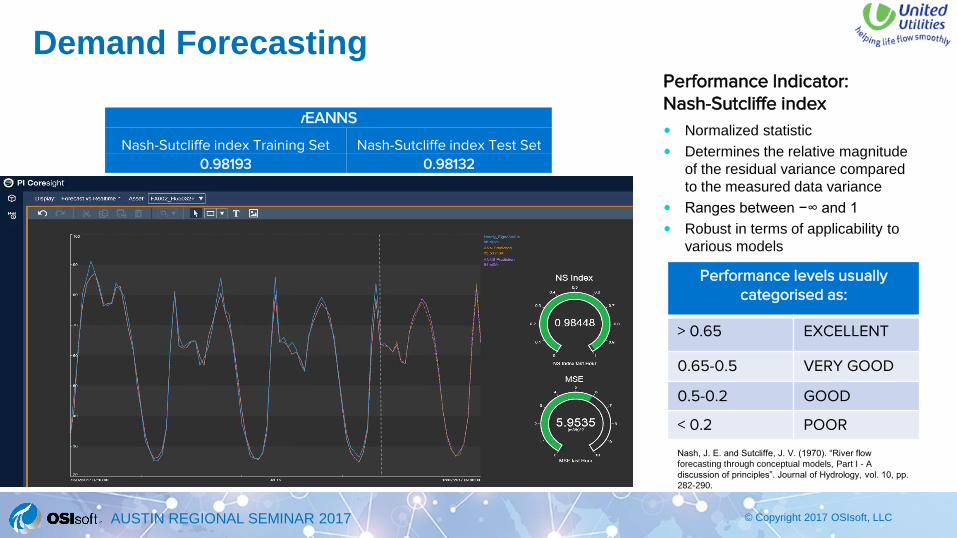
Demand Forecasting
rEANNS
Nash-Sutcliffe index Training Set Nash-Sutcliffe index Test Set
0.98193 0.98132
Forecast horizons
Performance Indicator:Nash-Sutcliffe index
Normalized statistic
Determines the relative magnitude
of the residual variance compared
to the measured data variance
Ranges between −∞ and 1
Robust in terms of applicability to
various models
Performance levels usually categorised as:
> 0.65 EXCELLENT
0.65-0.5 VERY GOOD
0.5-0.2 GOOD
< 0.2 POOR
Nash, J. E. and Sutcliffe, J. V. (1970). “River flow
forecasting through conceptual models, Part I - A
discussion of principles”. Journal of Hydrology, vol. 10, pp.
282-290.
© Copyright 2017 OSIsoft, LLCAUSTIN REGIONAL SEMINAR 2017
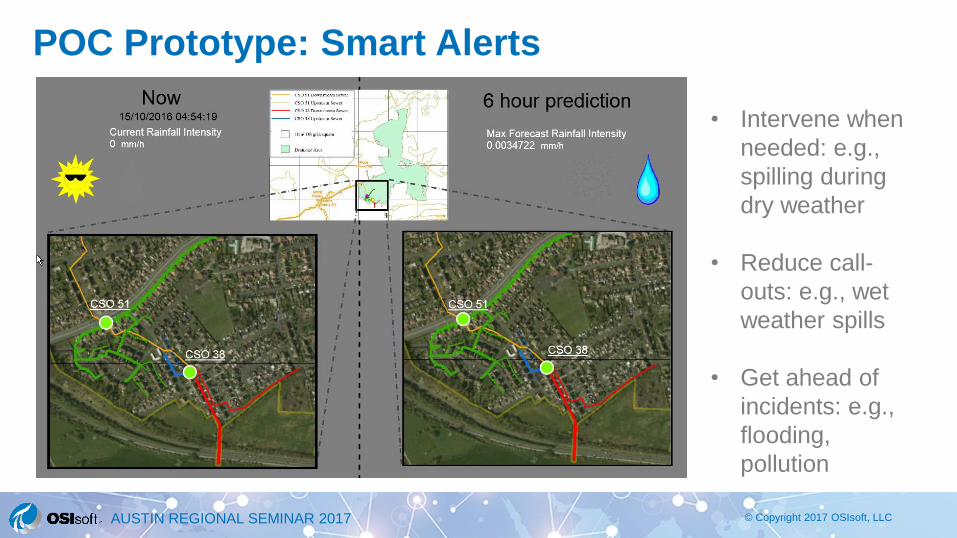
POC Prototype: Smart Alerts
• Intervene when
needed: e.g.,
spilling during
dry weather
• Reduce call-
outs: e.g., wet
weather spills
• Get ahead of
incidents: e.g.,
flooding,
pollution
© Copyright 2017 OSIsoft, LLCAUSTIN REGIONAL SEMINAR 2017
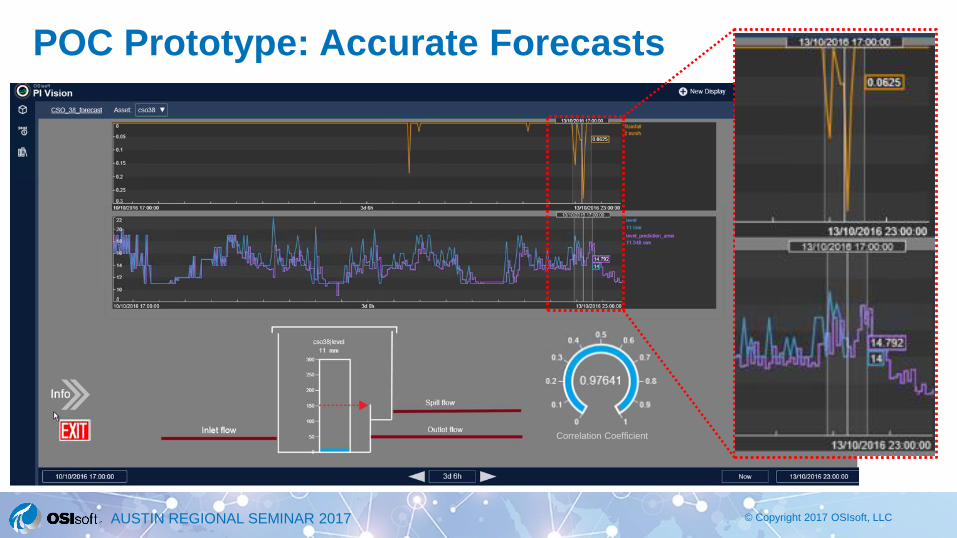
Correlation Coefficient
POC Prototype: Accurate Forecasts
© Copyright 2017 OSIsoft, LLCAUSTIN REGIONAL SEMINAR 2017
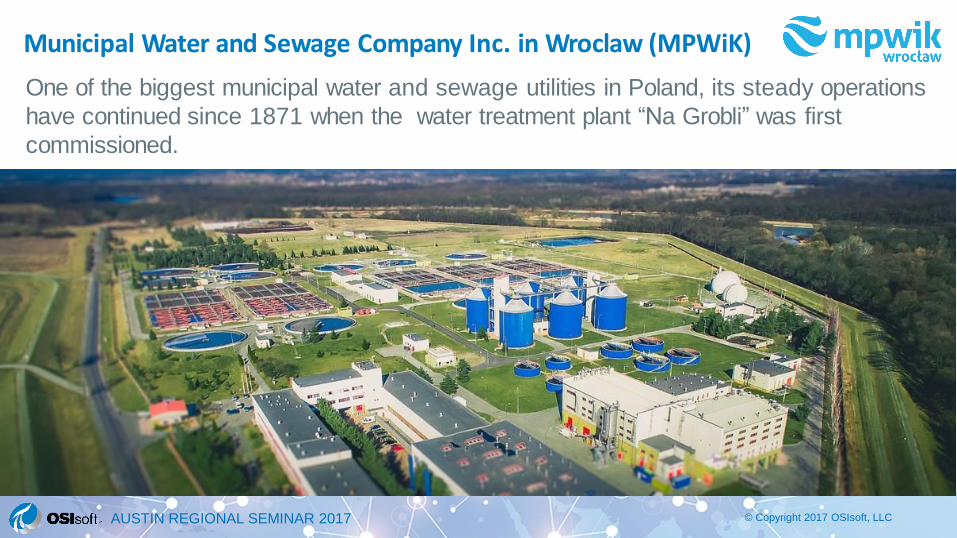
One of the biggest municipal water and sewage utilities in Poland, its steady operations
have continued since 1871 when the water treatment plant “Na Grobli” was first
commissioned.
Municipal Water and Sewage Company Inc. in Wroclaw (MPWiK)
© Copyright 2017 OSIsoft, LLCAUSTIN REGIONAL SEMINAR 2017
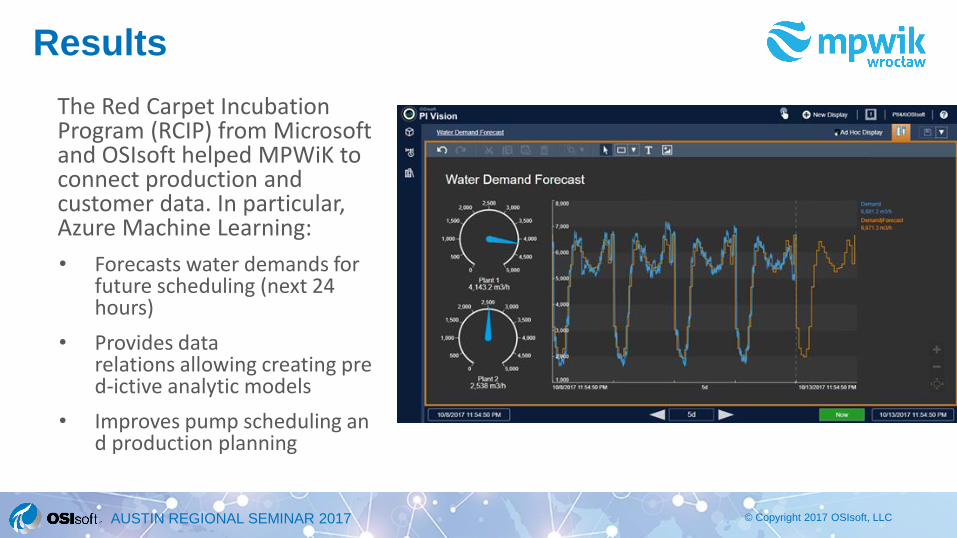
Results
The Red Carpet Incubation Program (RCIP) from Microsoft and OSIsoft helped MPWiK toconnect production and customer data. In particular, Azure Machine Learning:
• Forecasts water demands for future scheduling (next 24 hours)
• Provides data relations allowing creating pred-ictive analytic models
• Improves pump scheduling and production planning
© Copyright 2017 OSIsoft, LLCAUSTIN REGIONAL SEMINAR 2017
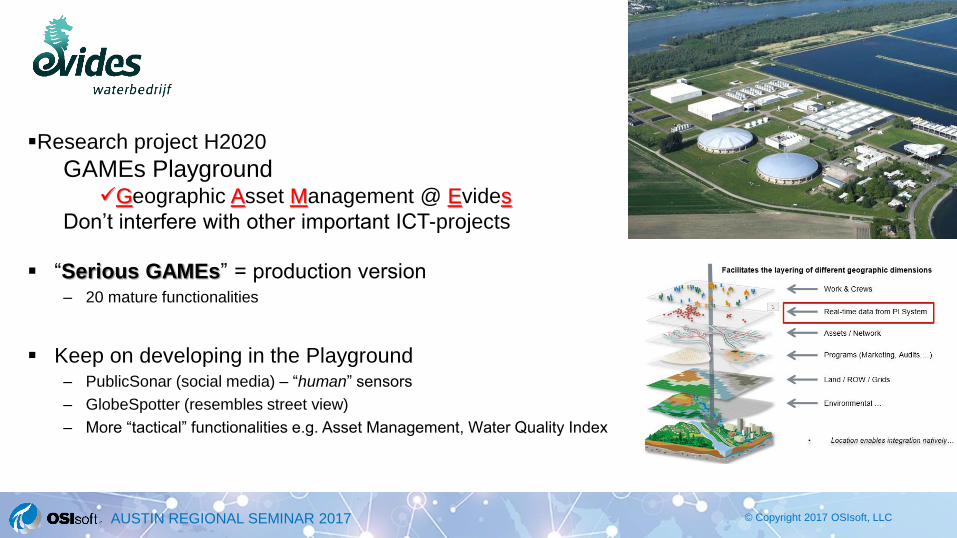
“Serious GAMEs” = production version– 20 mature functionalities
Keep on developing in the Playground– PublicSonar (social media) – “human” sensors
– GlobeSpotter (resembles street view)
– More “tactical” functionalities e.g. Asset Management, Water Quality Index
Research project H2020
GAMEs PlaygroundGeographic Asset Management @ Evides
Don’t interfere with other important ICT-projects
© Copyright 2017 OSIsoft, LLCAUSTIN REGIONAL SEMINAR 2017 18
© Copyright 2017 OSIsoft, LLCAUSTIN REGIONAL SEMINAR 2017
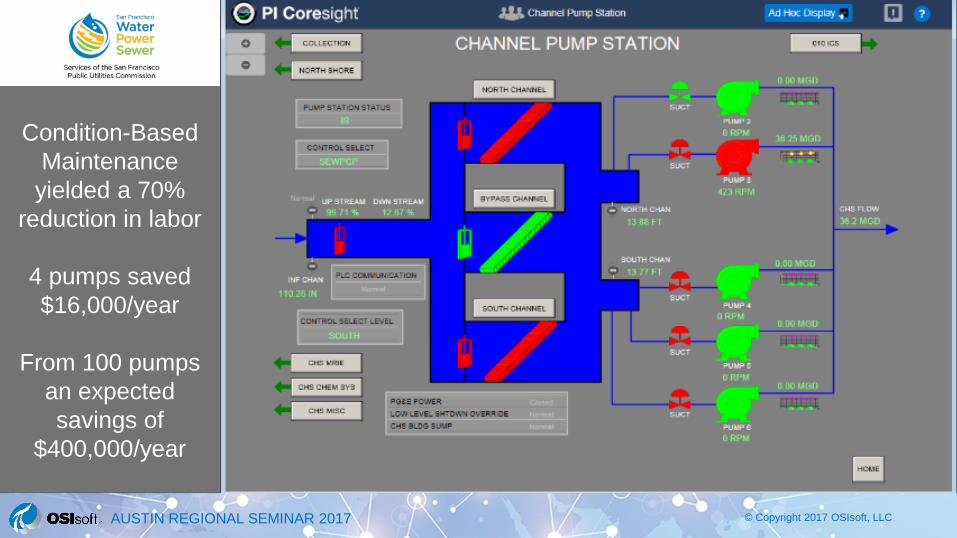
Condition-Based
Maintenance
yielded a 70%
reduction in labor
4 pumps saved
$16,000/year
From 100 pumps
an expected
savings of
$400,000/year
© Copyright 2017 OSIsoft, LLCAUSTIN REGIONAL SEMINAR 2017
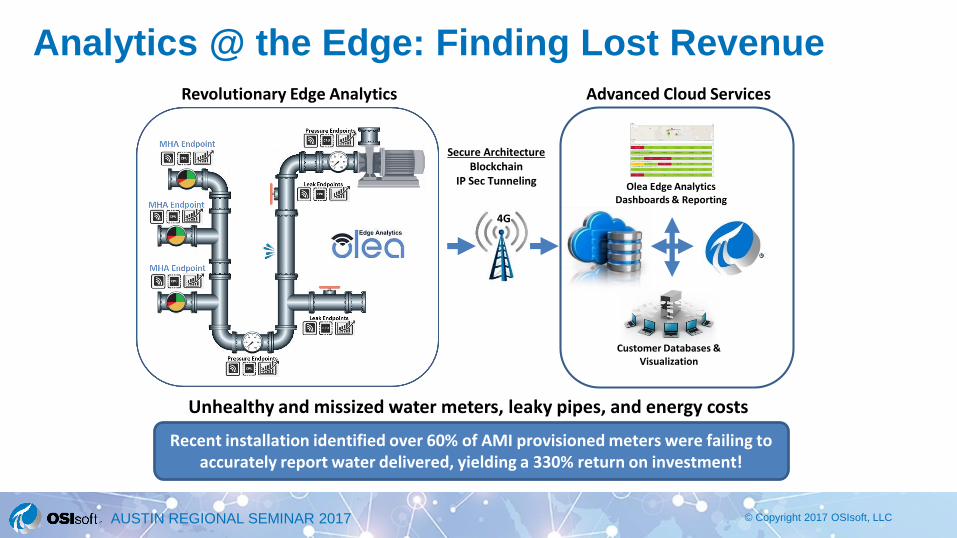
Analytics @ the Edge: Finding Lost Revenue
Customer Databases &Visualization
Unhealthy and missized water meters, leaky pipes, and energy costs
Revolutionary Edge Analytics Advanced Cloud Services
Secure ArchitectureBlockchain
IP Sec Tunneling Olea Edge AnalyticsDashboards & Reporting
4G
Recent installation identified over 60% of AMI provisioned meters were failing to accurately report water delivered, yielding a 330% return on investment!
© Copyright 2017 OSIsoft, LLCAUSTIN REGIONAL SEMINAR 2017

© Copyright 2017 OSIsoft, LLCAUSTIN REGIONAL SEMINAR 2017

© Copyright 2017 OSIsoft, LLCAUSTIN REGIONAL SEMINAR 2017
© Copyright 2017 OSIsoft, LLCAUSTIN REGIONAL SEMINAR 2017
© Copyright 2017 OSIsoft, LLCAUSTIN REGIONAL SEMINAR 2017
© Copyright 2017 OSIsoft, LLCAUSTIN REGIONAL SEMINAR 2017
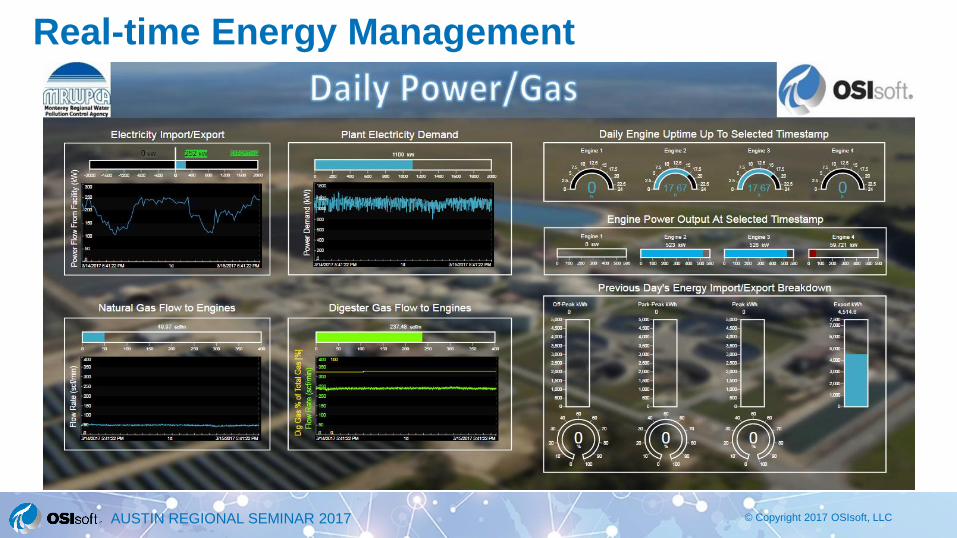
Real-time Energy Management
© Copyright 2017 OSIsoft, LLCAUSTIN REGIONAL SEMINAR 2017
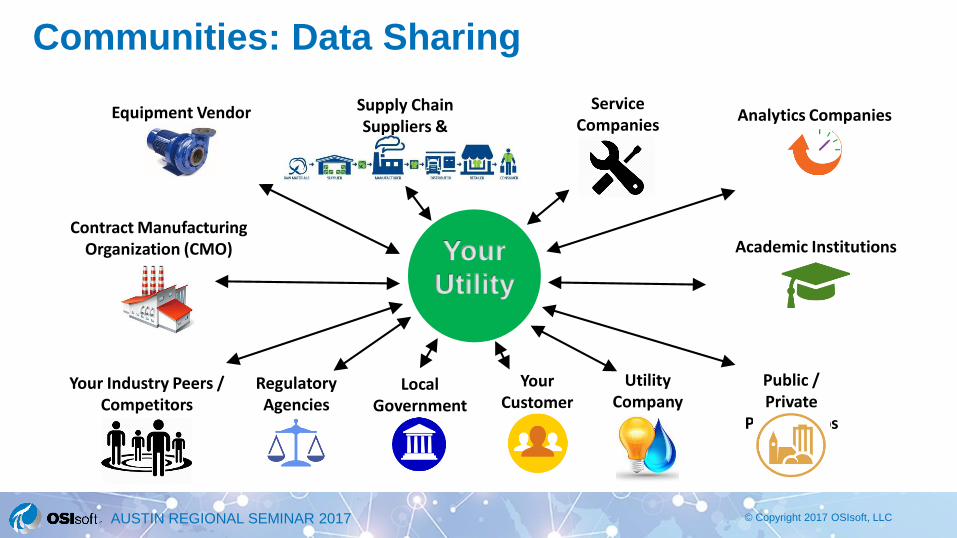
Your
Utility
Analytics CompaniesEquipment Vendor Supply Chain Suppliers &
Partners
Service Companies
Academic Institutions
Regulatory Agencies
Contract Manufacturing Organization (CMO)
Your Industry Peers / Competitors
Utility Company
Local Government
Your Customer
s
Public / Private
Partnerships
Communities: Data Sharing
© Copyright 2017 OSIsoft, LLCAUSTIN REGIONAL SEMINAR 2017
Contact Information
Gary Wong
Principal, Global Water Industry
OSIsoft
© Copyright 2017 OSIsoft, LLCAUSTIN REGIONAL SEMINAR 2017
Questions
Please wait for the
microphone before asking
your questions
Please don’t forget to…
complete the Post
Event Survey
State your
name & company
© Copyright 2017 OSIsoft, LLCAUSTIN REGIONAL SEMINAR 2017
Thank You