leveraging china’s industrial upgrading - hkimr.org · leveraging china’s industrial upgrading...
TRANSCRIPT

Leveraging China’s industrial upgrading and renminbi internationalization
Chin-Yoong Wong
Yoke-Kee Eng Universiti Tunku Abdul Rahman (UTAR), Malaysia
1

What motivates us?
• The Chinese yuan has appreciated by nearly 1 percent per quarter on average for eight years consecutively since exchange rate regime reform in July 2005
• Hsu et al. (2014), for instance, find that China’s export structure became more similar to that of the developed countries after the currency appreciation
2

Yuan appreciation facilitates China’s industrial upgrading…
• Li et al. (2014) evidence that yuan appreciation significantly increases the probability of firm entry and products adding, more in ordinary than processing trade
• China is leveraging appreciation, whether being a deliberate strategy or not, to move up the value chains.
3

…and the renminbi to go global
• Orderly appreciation which upholds the renminbi as a stable and even increasingly-yielding currency has greased the wheel to make the renminbi goes global.
• Ito and Chinn (2015) predict that the share of renminbi invoicing in China’s exports will rise to above 25% in 2015 and above 30% in 2018.
4

Questions of interest are…
• How exactly China’s industrial upgrading and renminbi internationalization associated with yuan appreciation would have impacted on neighboring developing economies?
• What’re the underlying mechanisms?
• Any stabilization role for monetary authority?
5

Previewing what we find
• Developing economies’ industrial upgrading can be favorably coupled to China’s one.
• Three spillover channels: global input-output linkage, dollar pricing channel, and quality competition channel
• Yuan appreciation strategy in the face of a liberalized capital account would instigate drastic capital flows that disrupt industrial upgrading in both regions.
6

Central bank’s role in upgrading promotion
• Anchoring exchange rates against either yuan or U.S dollar is of little help for developing economies.
• By stabilizing downstream export price inflation, favorable spillovers from China’s industrial upgrading to developing economies can be recouped even in the face of China’s liberalized capital account.
• Even better: entry in developing economies’ skill-based sector expands much stronger, and skill-biased technical progress become more persistent
7

Our approach: A two-country New Keynesian model
• Expanded with – Global upstream-downstream linkage with feedback
loop
– Skill-based vs. non-skill-based sectors in upstream industry
– Firm entry into upstream sectors are endogenous
– Path-dependent technical change
– Currency choice of trade invoicing is endogenous
– Portfolio balance approach to international capital flows
– Crawling peg with sterilized intervention
8

Entry function and business formation function
• Entry into skill-based sector depends on the sector’s expected profit relative to overall industry’s profit
𝑁𝑒,𝑡 = 𝑉𝑡 𝑉𝑡 + 𝑉𝑡
• Entry leads to expanding business formation (Ghironi and Melitz, 2005)
𝑁𝑡 = 1 − 𝛿 𝑁𝑡−1 + 𝑁𝑒,𝑡−1
9

Facing firm entry is Sutton’s (2012) sunk cost
• Business formation contributes to path-dependent technical progress a-la Acemoglou et al. (2015)
𝐴𝑡 = 1 + 𝛾prop𝑁𝑡 𝐴𝑡−1
• Facing firm entry is Sutton’s (2012) sunk cost
𝑓𝑒,𝑡
= 𝜁 𝐴𝑡−1
𝜇
• A low value of 𝜇 means that fixed cost outlays, which we may think of as R&D outlays, is effective in raising quality.
10

• A successful entry in a particular upstream sector induced by stronger expected profitability contributes to increasing density that favorably directs quality frontier toward the sector.
• Greater firm density lifts entry barriers for subsequent entrants, allowing only participation of more productive firms subsequently.
• Industrial upgrading is path dependent.
Defining industrial upgrading
11

Expected profitability for an entry in skill-based sector can be derived as
𝑉𝑡 𝒾 = 𝔼0 1− 𝛿 𝑖𝜚𝑡+𝑖
Π𝑡+𝑖 𝒾
∞
𝑖=0
= 𝔼0 1− 𝛿 𝑖𝜚𝑡+𝑖
ℝ𝑈,𝑡 𝒾 − 𝑌𝑡 𝒾 𝑈,𝑡 𝒾
∞
𝑖=0
− 𝑓𝑒,𝑡
which can be rearranged as
𝑉𝑡 𝒾 =1
1 − 1 − 𝛿 𝜚𝑡
1 −1 − 𝜃 1 − 𝛿 1 + 𝜋𝒽𝒽,𝑡
𝜔𝑡𝜚𝑡ℝ𝒽𝒽,𝑡 𝒾
+ 1 −1 − 𝜃 1 − 𝛿 1 + 𝜋𝒽𝒻,𝑡
𝜔 𝑡∗𝜚
𝑡
ℝ𝒽𝒻,𝑡 𝒾 − 𝜁 𝐴𝑡−1
𝜇
where ℝ𝒽𝒽,𝑡refers to domestic sales revenue and ℝ𝒽𝒻,𝑡 refers to export revenue from home (Developing economies) to foreign (China).
12

Transmission channels
𝑉𝑡 𝒾
= 𝔼0 1− 𝛿 𝑖𝜚𝑡+𝑖
𝒬𝒽𝒽,𝑡𝑋 𝒽𝒽,𝑡 𝒾
∞
𝑖=0
+ 𝒬𝒽𝒻,𝑡𝑋 𝒽𝒻,𝑡 𝒾 − 𝑌𝑡 𝒾 𝑈,𝑡 𝒾
− 𝜁 𝐴𝑡−1
𝜇
13
Pricing channel
Quality competition
channel
Global input-output linkage
Pricing channel
Capital flow channel
Quality competition
channel

Export pricing strategy: dollar pricing…
• Dollar pricing strategy solves the following dynamic pricing problem for developing economies (identical for Chinese exporters)
maxℚ 𝒽𝒻,𝑡𝑢𝑠𝑑 𝒾
𝔼𝑡 𝜃𝑖 1 − 𝛿 𝑖𝜚𝑡+𝑖 𝑆𝒽𝒹,𝑡+𝑖ℚ 𝒽𝒻,𝑡
𝑢𝑠𝑑 𝒾
𝒬 𝒽𝒻,𝑡+𝑖𝑢𝑠𝑑 − 𝓇 𝑈,𝑡+𝑖 𝒾
∞
𝑖=0
ℚ 𝒽𝒻,𝑡𝑢𝑠𝑑 𝒾
𝒬 𝒽𝒻,𝑡+𝑖𝑢𝑠𝑑
−𝜖
𝑋 𝒽𝒻,𝑡+𝑖 𝒾
14

…or yuan pricing?
• Yuan pricing is asymmetric
• It is local currency pricing from developing economies exporters’ point of view
maxℚ 𝒽𝒻,𝑡𝑟𝑚𝑏 𝒾
𝔼𝑡 𝜃𝑖 1 − 𝛿 𝑖𝜚𝑡+𝑖 𝑆𝒽𝒻,𝑡+𝑖ℚ 𝒽𝒻,𝑡
𝑟𝑚𝑏 𝒾
𝒬 𝒽𝒻,𝑡+𝑖𝑟𝑚𝑏 −𝓇 𝑈,𝑡+𝑖 𝒾
∞
𝑖=0
ℚ 𝒽𝒻,𝑡𝑟𝑚𝑏 𝒾
𝒬 𝒽𝒻,𝑡+𝑖𝑟𝑚𝑏
−𝜖
𝑋 𝒽𝒻,𝑡+𝑖 𝒾
• But producer currency pricing from Chinese exporters’ perspective
maxℚ 𝒻𝒽,𝑡∗ 𝒾∗
𝔼𝑡 𝜃∗,𝑖 1 − 𝛿 𝑖𝜚𝑡+𝑖ℚ 𝒻𝒽,𝑡
∗ 𝒾∗
𝒬 𝒻𝒽,𝑡+𝑖∗ − 𝓇 𝑈,𝑡+𝑖
∗ 𝒾∗∞
𝑖=0
ℚ 𝒻𝒽,𝑡∗ 𝒾∗
𝒬 𝒻𝒽,𝑡+𝑖∗
−𝜖
𝑋 𝒻𝒽,𝑡+𝑖∗ 𝒾
15

Average export price is weighted by different pricing strategies
• Average export price of high-quality intermediates and downstream output in local currency are, respectively, given by
𝒬 𝒽𝒻,𝑡 = 1 − 𝜙𝑡 𝑆𝒽𝒹,𝑡𝒬𝒽𝒻,𝑡
𝑢𝑠𝑑+ 𝜙𝑡𝑆𝒽𝒻,𝑡𝒬𝒽𝒻,𝑡
𝑟𝑚𝑏
𝒫𝒽𝒻,𝑡 = 1 − 𝜙𝑡 𝑆𝒽𝒹,𝑡𝑃𝒽𝒻,𝑡𝑢𝑠𝑑 + 𝜙𝑡𝑆𝒽𝒻,𝑡𝑃𝒽𝒻,𝑡
𝑟𝑚𝑏
16

Defining renminbi internationalization
• Upstream exporters can choose to quote either in U.S dollar or Chinese yuan, as far as the quoted price minimizes loss due to deviation from the optimal frictionless price.
• Speaking differently, exporters will be self-sorting into yuan pricing strategy if it is profit maximizing.
17

RMBI as increasing use of renminbi as invoicing currency
𝜙𝑡 = 𝜍
exp 𝒬 𝒽𝒻,𝑡−1
𝑟𝑚𝑏
−ℚ 𝒽𝒻,𝑡−1
𝑟𝑚𝑏
exp 𝒬 𝒽𝒻,𝑡−1
𝑟𝑚𝑏
−ℚ 𝒽𝒻,𝑡−1
𝑟𝑚𝑏
+ exp 𝒬 𝒽𝒻,𝑡−1
𝑢𝑠𝑑
−ℚ 𝒽𝒻,𝑡−1
𝑢𝑠𝑑
• As the past-period profitability of yuan-invoiced trade improves relative to that of the dollar-invoiced trade, exporters are more likely to adopt yuan-invoiced trade.
18

RMBI also involves capital account liberalization
• Using portfolio balance approach, capital flows into China is
𝕂𝒽𝒻,𝑡𝐵 =
𝑆𝒽𝒻,𝑡𝐵𝑝,𝒻𝒽,𝑡−1∗
𝑃𝑡
1
Φ𝕂𝑞𝒽𝒻,𝑡𝐵 − 1 +𝜛𝕂,𝒽𝒻
𝐵
• Where 𝑞𝒽𝒻,𝑡𝐵 is “Tobin’s marginal q” in portfolio investment
𝑞𝒽𝒻,𝑡𝐵 = 𝔼𝑡
𝑆𝒽𝒻,𝑡+1
𝑆𝒽𝒻,𝑡
1
1 + 𝑟𝑡𝑞𝒽𝒻,𝑡+1𝐵 1 + 𝑟𝑡
∗ +Φ𝕂,𝑡+1𝐵
𝑃𝑡𝕂𝒽𝒻,𝑡+1𝐵
𝑆𝒽𝒻,𝑡+1𝐵𝑝,𝒻𝒽,𝑡∗ −𝜛𝕂,𝒽𝒻
𝐵
• Φ𝕂 measures degree of capital account convertibility, where
Φ𝕂 → 0 indicates free capital account and Φ𝕂 → ∞ indicates inconvertible capital account
19

External balance
• Let PBoC’s foreign exchange intervention FXI* be defined as
𝐹𝑋𝐼𝑡∗ ≡ 𝐵𝑔,𝒹𝒻,𝑡
𝒹 − 𝐵𝑔,𝒹𝒻,𝑡−1𝒹
• External balance takes the form
𝑆𝒻𝒹,𝑡 𝑃𝑡∗ 𝐹𝑋𝐼𝑡
∗
= 𝑟𝑡−1𝒹 𝑆𝒻𝒹,𝑡 𝑃𝑡
∗ 𝐵𝑔,𝒹𝒻,𝑡−1𝒹 + 𝐸𝑋𝑡
∗ − 𝐼𝑀𝑡∗
+ 𝑆𝒽𝒻,𝑡−1 𝑃𝑡 𝑃𝑡
∗ 𝐺𝐾𝐼𝑡∗ − 𝐺𝐾𝑂𝑡
∗
20
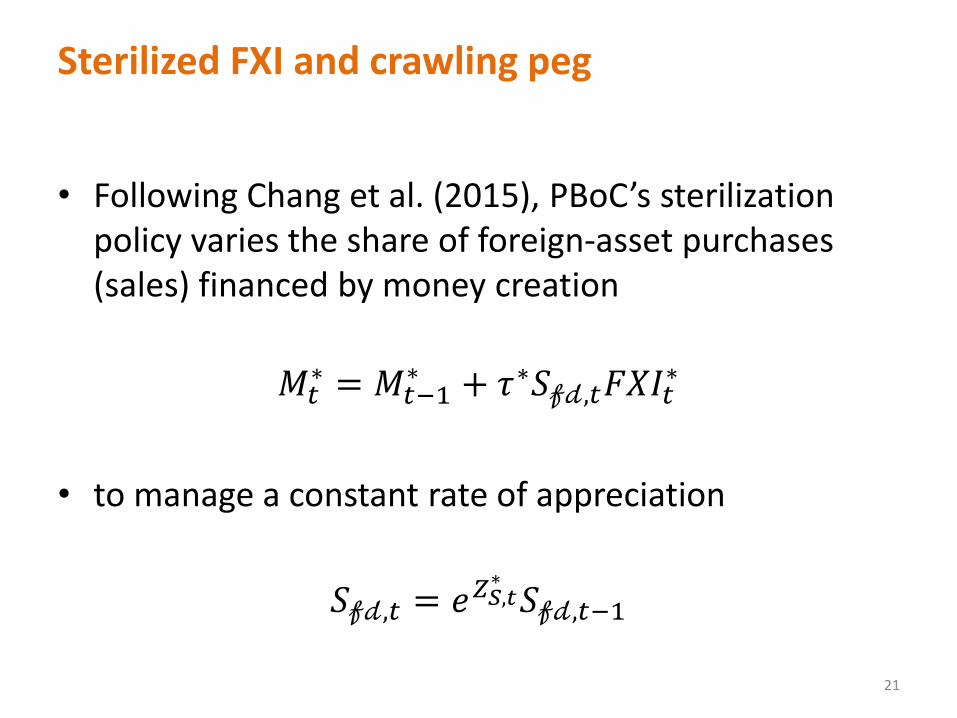
Sterilized FXI and crawling peg
• Following Chang et al. (2015), PBoC’s sterilization policy varies the share of foreign-asset purchases (sales) financed by money creation
𝑀𝑡
∗ = 𝑀𝑡−1∗ + 𝜏∗𝑆𝒻𝒹,𝑡𝐹𝑋𝐼𝑡
∗
• to manage a constant rate of appreciation
𝑆𝒻𝒹,𝑡 = 𝑒𝑍𝑆,𝑡∗𝑆𝒻𝒹,𝑡−1
21

• China’s industrial upgrading associated with yuan appreciation benefits DE through global input-output linkage and pricing effect
22
0 5 10 15 20-50
0
50
Fraction of high-quality firm
0 5 10 15 20-5
0
5
Skilled-biased innovation
0 5 10 15 200
10
20
Export
0 5 10 15 200
10
20
Import
0 5 10 15 20-5
0
5
Intermediate export price inflation
0 5 10 15 20-5
0
5
Final export price inflation
0 5 10 15 20-10
0
10
RGDP
0 5 10 15 20-2
0
2
LCU per USD
0 5 10 15 20-0.5
0
0.5
Interest rate
0 5 10 15 20-0.05
0
0.05
RMB-invoiced trade
China Developing economies DE

• Even when DE faces higher sunk entry cost, DE firms can still be benefited through quality competition channel
• Condition is the quality gap between Chinese and DE firms are not too wide
0 5 10 15 20-10
0
10
Fraction of high-quality firm
0 5 10 15 20-50
0
50
Fraction of low-quality firm
0 5 10 15 20-1
0
1
Skilled-biased innovation
0 5 10 15 20-2
0
2
Unskilled-biased innovation
0 5 10 15 200
10
20
Export
0 5 10 15 200
10
20
Import
0 5 10 15 20-20
0
20
RGDP
0 5 10 15 20-2
0
2
LCU per USD
0 5 10 15 20-0.5
0
0.5
Interest rate
0 5 10 15 20-0.1
0
0.1
RMB-invoiced trade
Baseline DE DE with higher sunk entry cost 23

• Capital account liberalization overturns China’s responses to yuan appreciation
24
0 5 10 15 20-50
0
50
Fraction of high-quality firm
0 5 10 15 200
10
20
Real GDP
0 5 10 15 20-20
0
20
Export
0 5 10 15 20-50
0
50
Import
0 5 10 15 200
5
10
Intermediate export price inflation
0 5 10 15 20-5
0
5
Final export price inflation
0 5 10 15 20-100
0
100
Share price of high-quality firm
0 5 10 15 20-5
0
5
Interest rate
0 5 10 15 20-5
0
5x 10
4
Equity capital inflows
0 5 10 15 20-2
0
2x 10
4
Equity capital outflows
0 5 10 15 20-1
0
1x 10
4
Bond capital inflows
0 5 10 15 20-1
0
1x 10
4
Bond capital outflows
Convertible Nonsterilized fxi

• DE also responds adversely to yuan appreciation under liberalized China’s capital account as well as unsterilized FXI by PBoC
25
0 5 10 15 20-20
-10
0
10
Fraction of high-quality firm
0 5 10 15 20-2
-1
0
1
Skill-biased innovation
0 5 10 15 20-20
0
20
Export
0 5 10 15 20-10
0
10
Import
0 5 10 15 20-10
-5
0
5
Intermediate export price inflation
0 5 10 15 20-10
-5
0
5
Final export price inflation
0 5 10 15 20-20
-10
0
10
RGDP
0 5 10 15 20-10
-5
0
5
CPI inflation
Baseline Convertible Nonsterilized fxi

• Stabilizing exchange rates is of little help to shield DE from adverse effects of persistent yuan appreciation under China’s liberalized capital account
26
0 5 10 15 20-20
-10
0
10
Fraction of high-quality firm
0 5 10 15 20-2
-1
0
1
Skill-biased innovation
0 5 10 15 20-15
-10
-5
0
Export
0 5 10 15 20-10
-5
0
5
Import
0 5 10 15 20-10
-5
0
5
Intermediate export price inflation
0 5 10 15 20-10
-5
0
5
Final export price inflation
0 5 10 15 20-20
-10
0
10
RGDP
0 5 10 15 20-10
-5
0
5
CPI inflation
Convertible rmb in Taylor rule dollar in Taylor rule
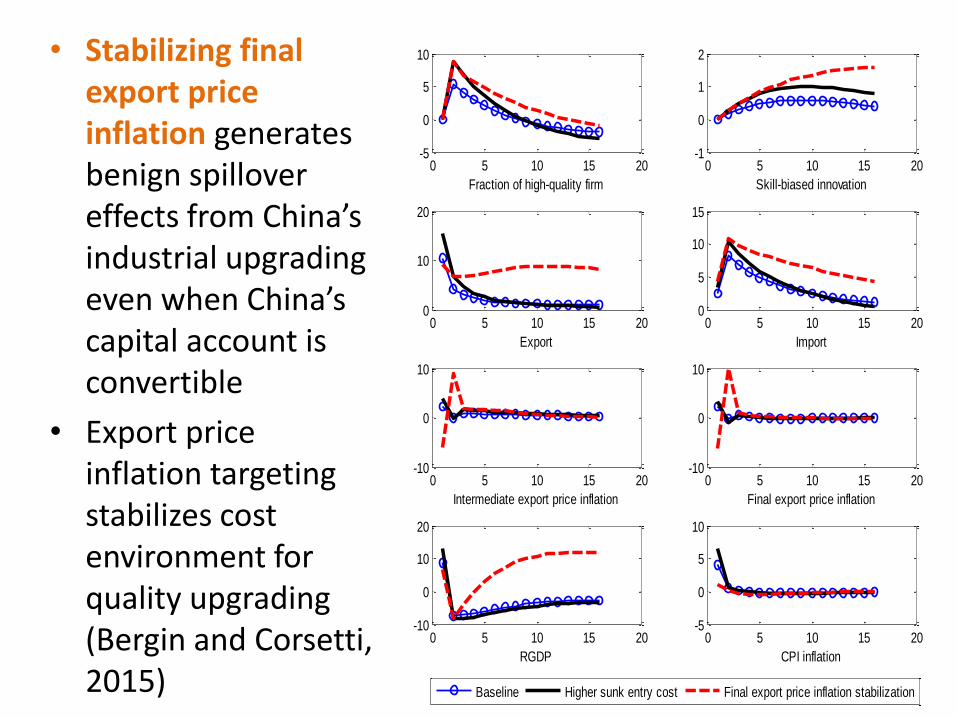
• Stabilizing final export price inflation generates benign spillover effects from China’s industrial upgrading even when China’s capital account is convertible
• Export price inflation targeting stabilizes cost environment for quality upgrading (Bergin and Corsetti, 2015) 27
0 5 10 15 20-5
0
5
10
Fraction of high-quality firm
0 5 10 15 20-1
0
1
2
Skill-biased innovation
0 5 10 15 200
10
20
Export
0 5 10 15 200
5
10
15
Import
0 5 10 15 20-10
0
10
Intermediate export price inflation
0 5 10 15 20-10
0
10
Final export price inflation
0 5 10 15 20-10
0
10
20
RGDP
0 5 10 15 20-5
0
5
10
CPI inflation
Baseline Higher sunk entry cost Final export price inflation stabilization

Extension for future work
• To incorporate vertical FDI into the model for a more realistic trade-FDI-capital nexus, as trade and MNCs are closely linked
• To incorporate credit friction, as credit policy is important for Chinese industrial development
• Welfare assessment for optimal monetary policy
• Condition for Pareto-improving international policy coordination
28