leveraging cityworks to implement visual management
TRANSCRIPT
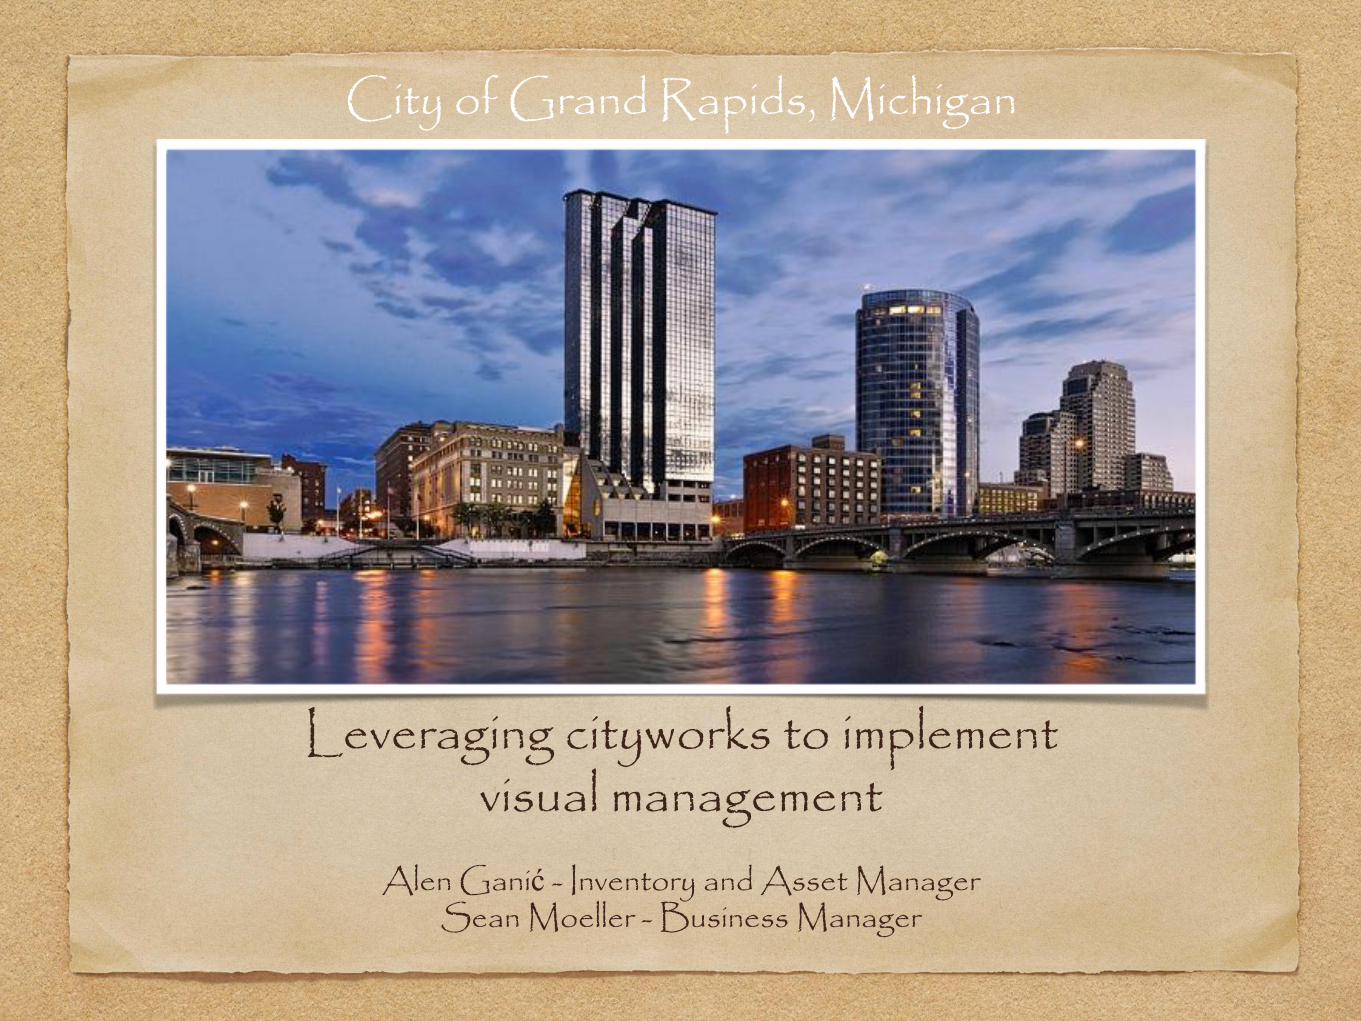
Leveraging cityworks to implement visual management
Alen Ganić - Inventory and Asset Manager Sean Moeller - Business Manager
City of Grand Rapids, Michigan

City of grand rapids Michigan
Population: 192,294 (2014)
Second largest city in the state of Michigan
Childhood home of President Gerald R. Ford
Host of Art Prize since 2009
It is known today as the center of office furniture manufacturing
The Fifth Third Riverbank Run is America's largest 25K road race, with more than 21,000 participants from around the globe
G.R. is headquarters to many national and multi-national headquarters including Steelcase, Herman Miller, Haworth, Alticor (formerly Amway), Wolverine World Wide, Meijer and Zondervan
Agenda
Which departments are using Cityworks?
What is LEAN
What is visual management?
How did we leverage Cityworks to implement visual management?
How dose Cityworks visual management replace traditional management?
Examples
Summary
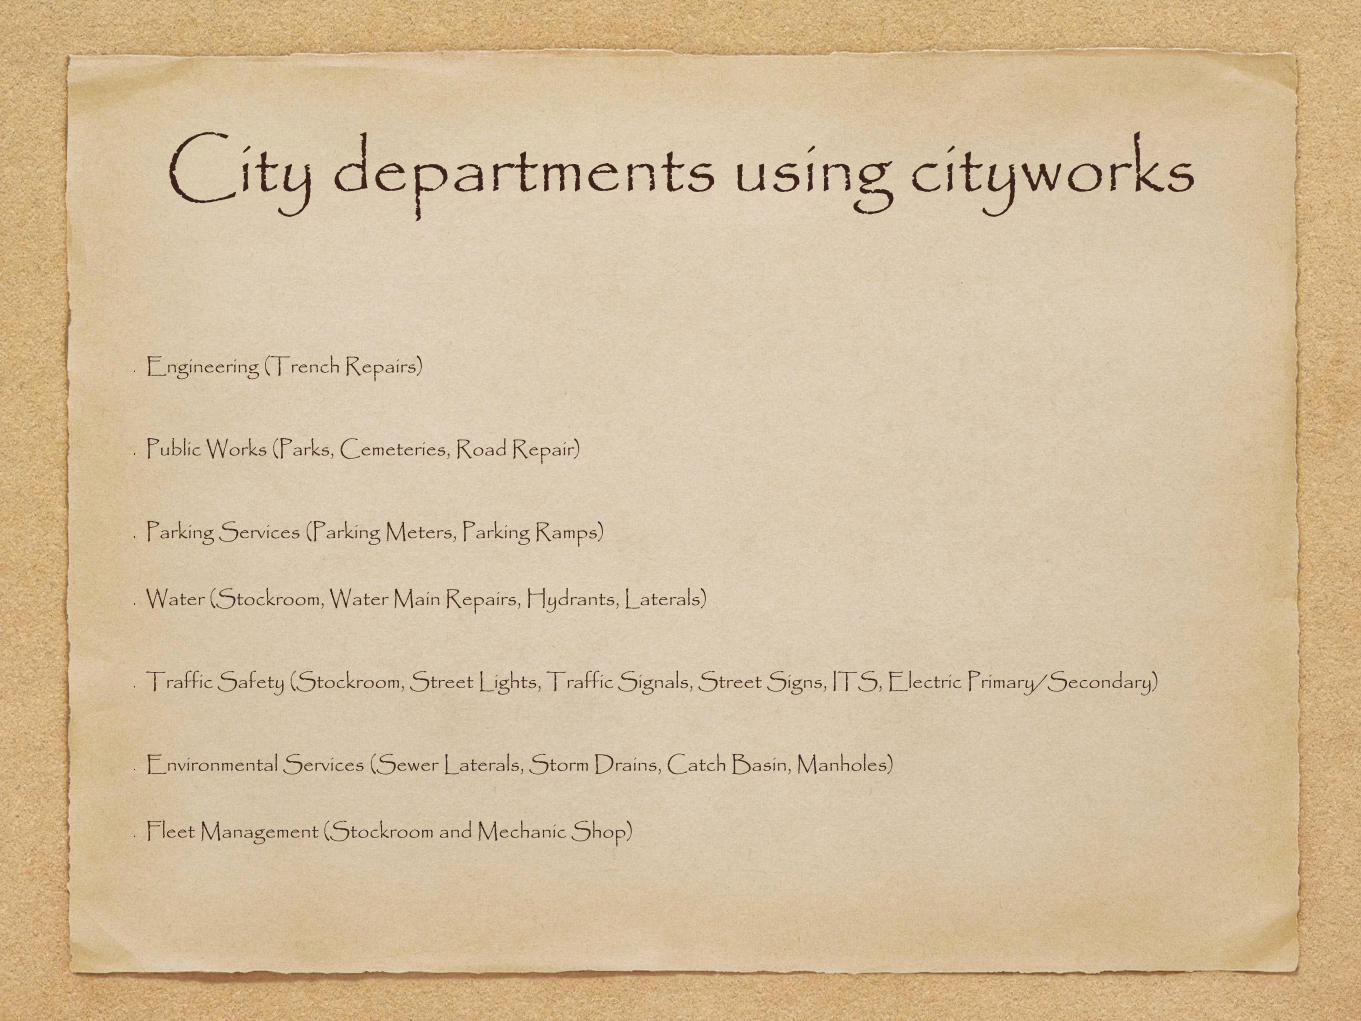
City departments using cityworks
Engineering (Trench Repairs)
Public Works (Parks, Cemeteries, Road Repair)
Parking Services (Parking Meters, Parking Ramps)
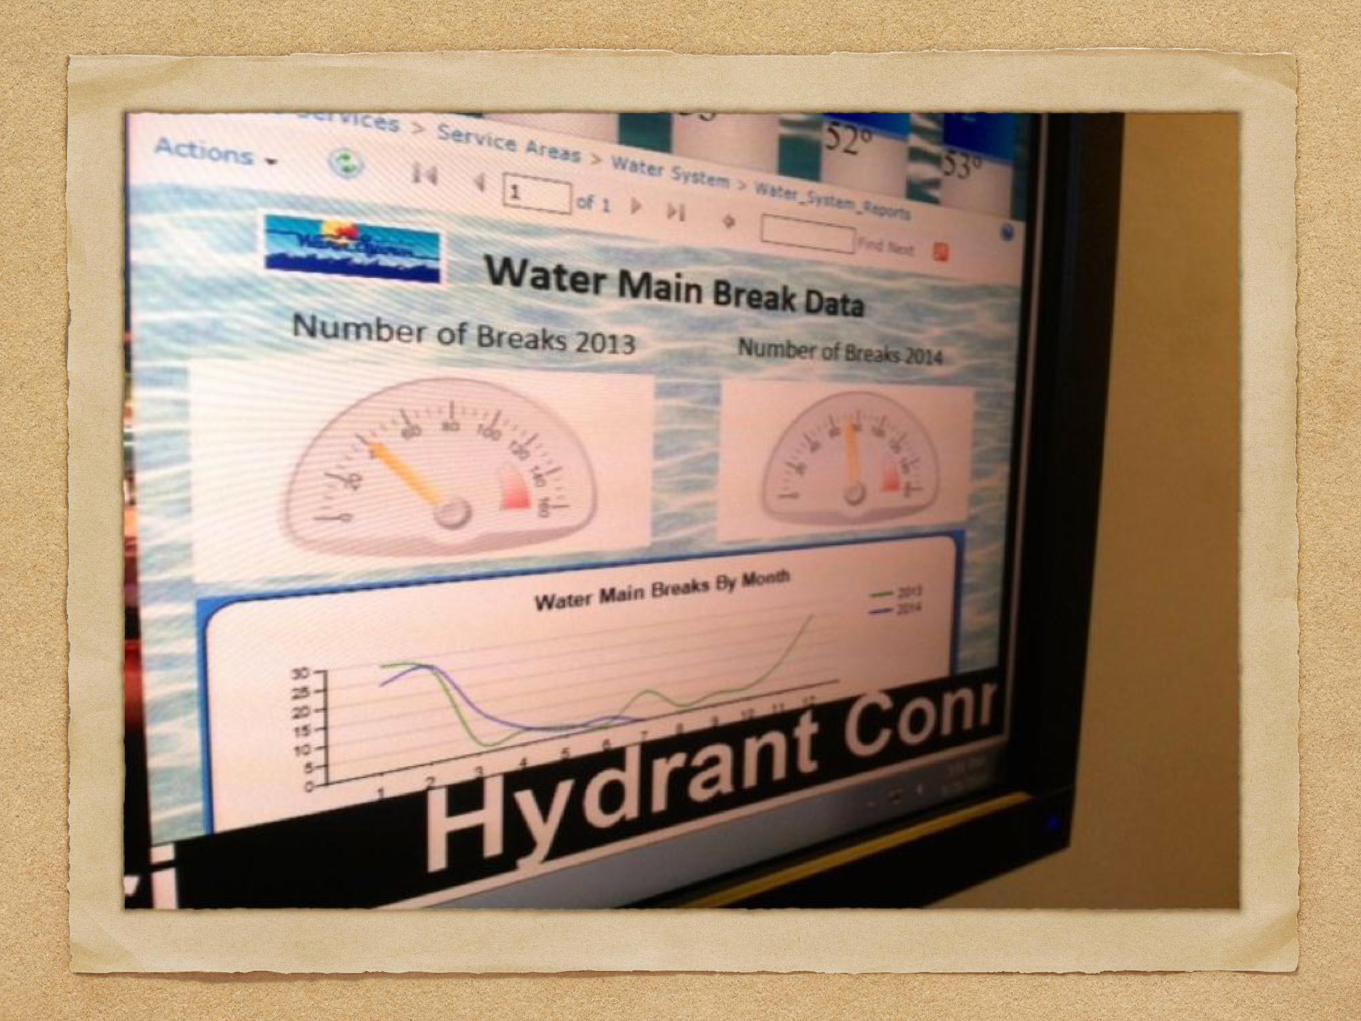
Water (Stockroom, Water Main Repairs, Hydrants, Laterals)
Traffic Safety (Stockroom, Street Lights, Traffic Signals, Street Signs, ITS, Electric Primary/Secondary)
Environmental Services (Sewer Laterals, Storm Drains, Catch Basin, Manholes)
Fleet Management (Stockroom and Mechanic Shop)
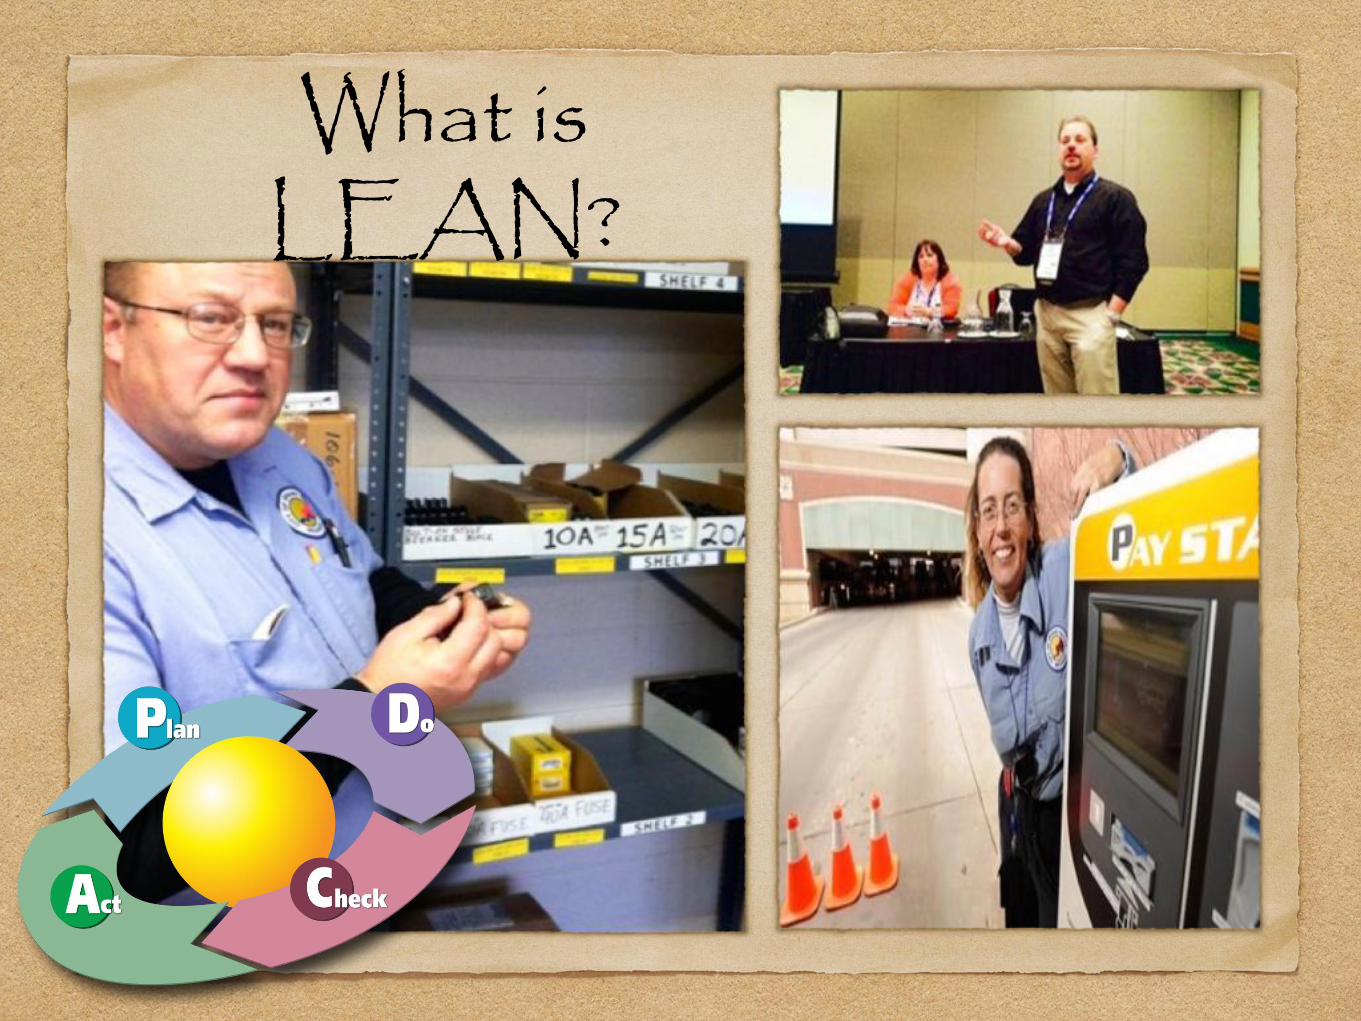
What is LEAN?
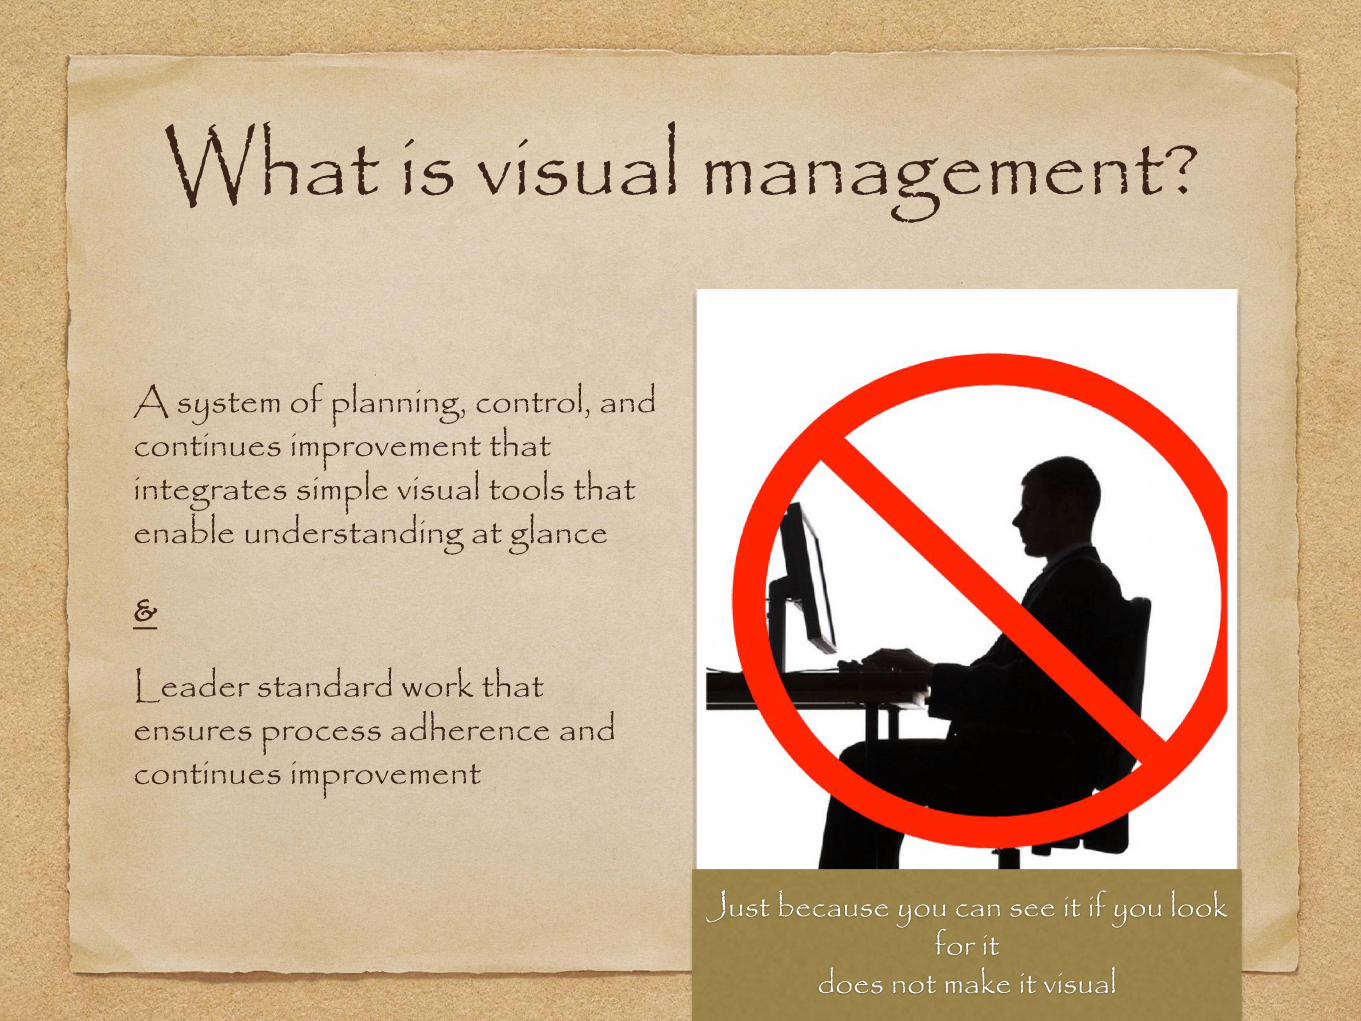
What is visual management?
A system of planning, control, and continues improvement that integrates simple visual tools that enable understanding at glance
&
Leader standard work that ensures process adherence and continues improvement
Just because you can see it if you look for it
does not make it visual
How did we leverage Cityworks to implement visual management?
“What tools and methods have we used?”
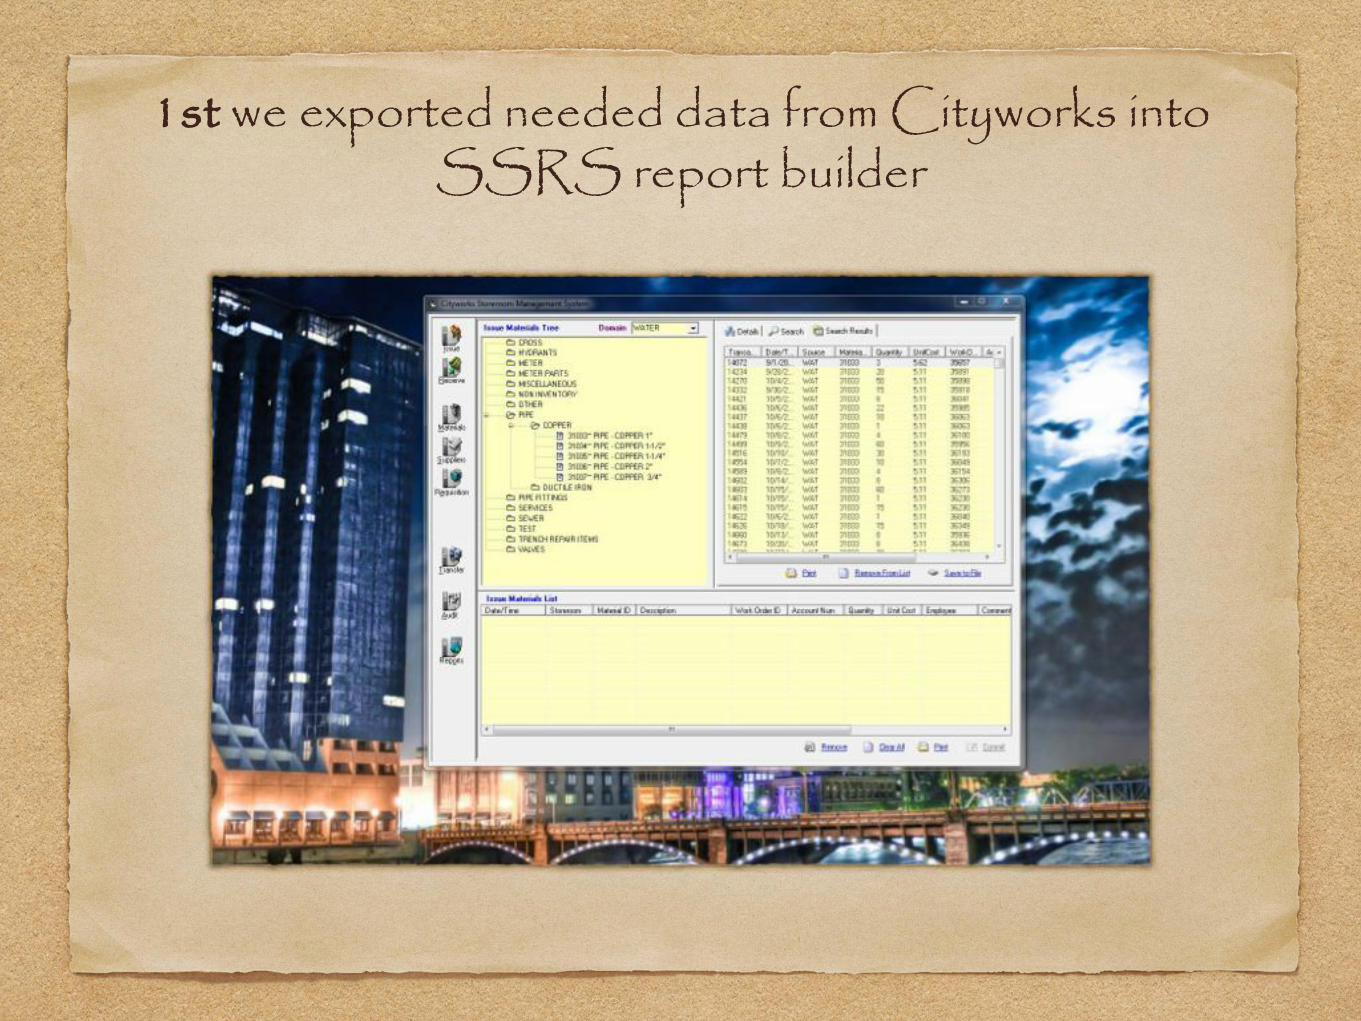
1st we exported needed data from Cityworks into SSRS report builder
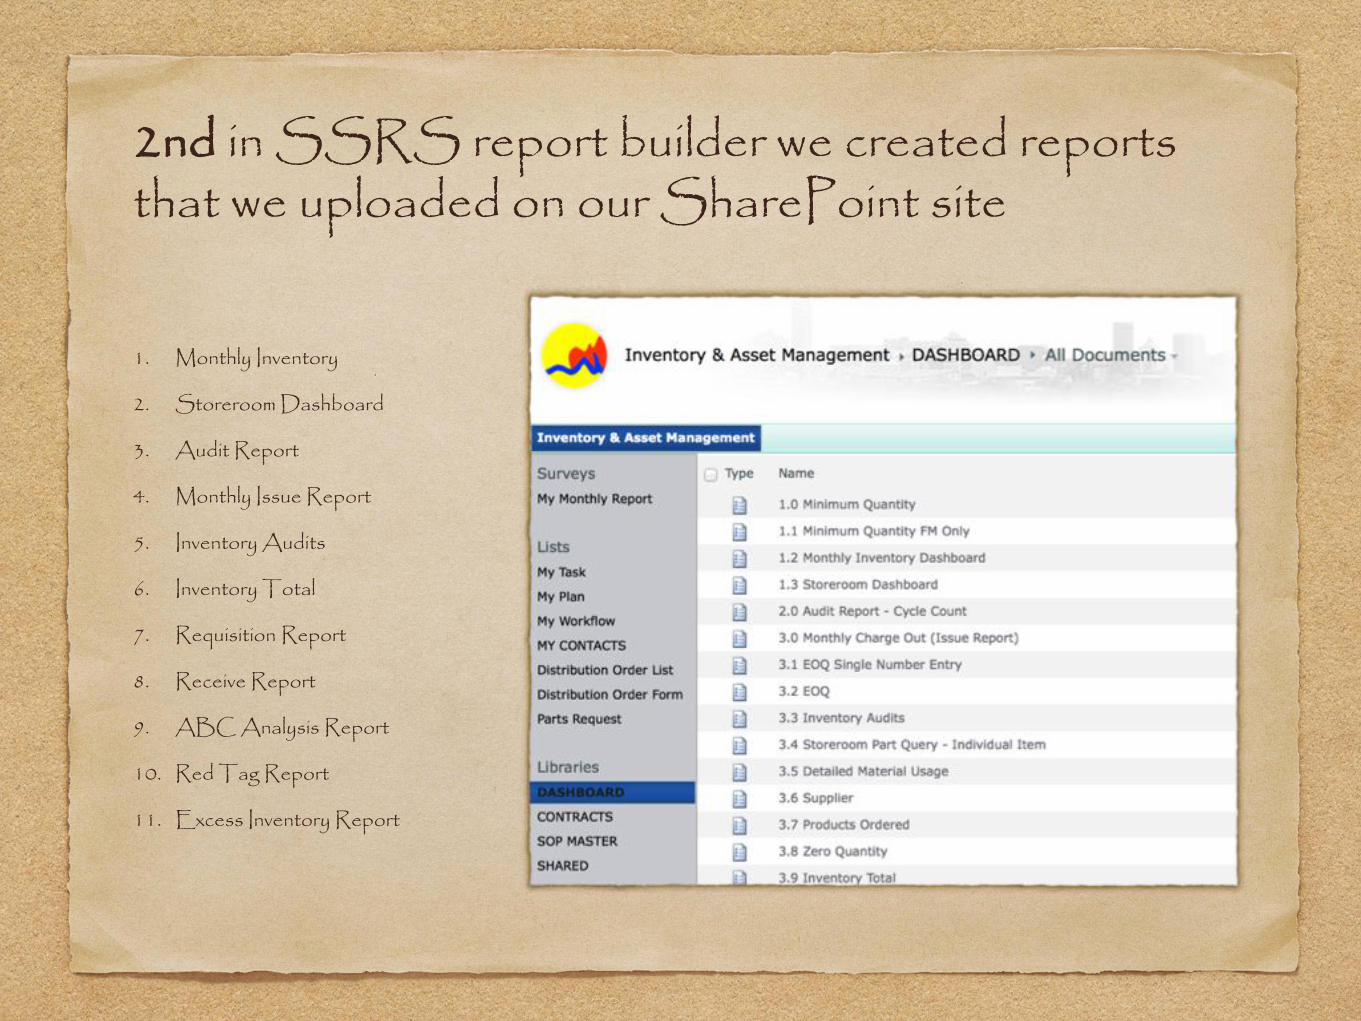
2nd in SSRS report builder we created reports that we uploaded on our SharePoint site
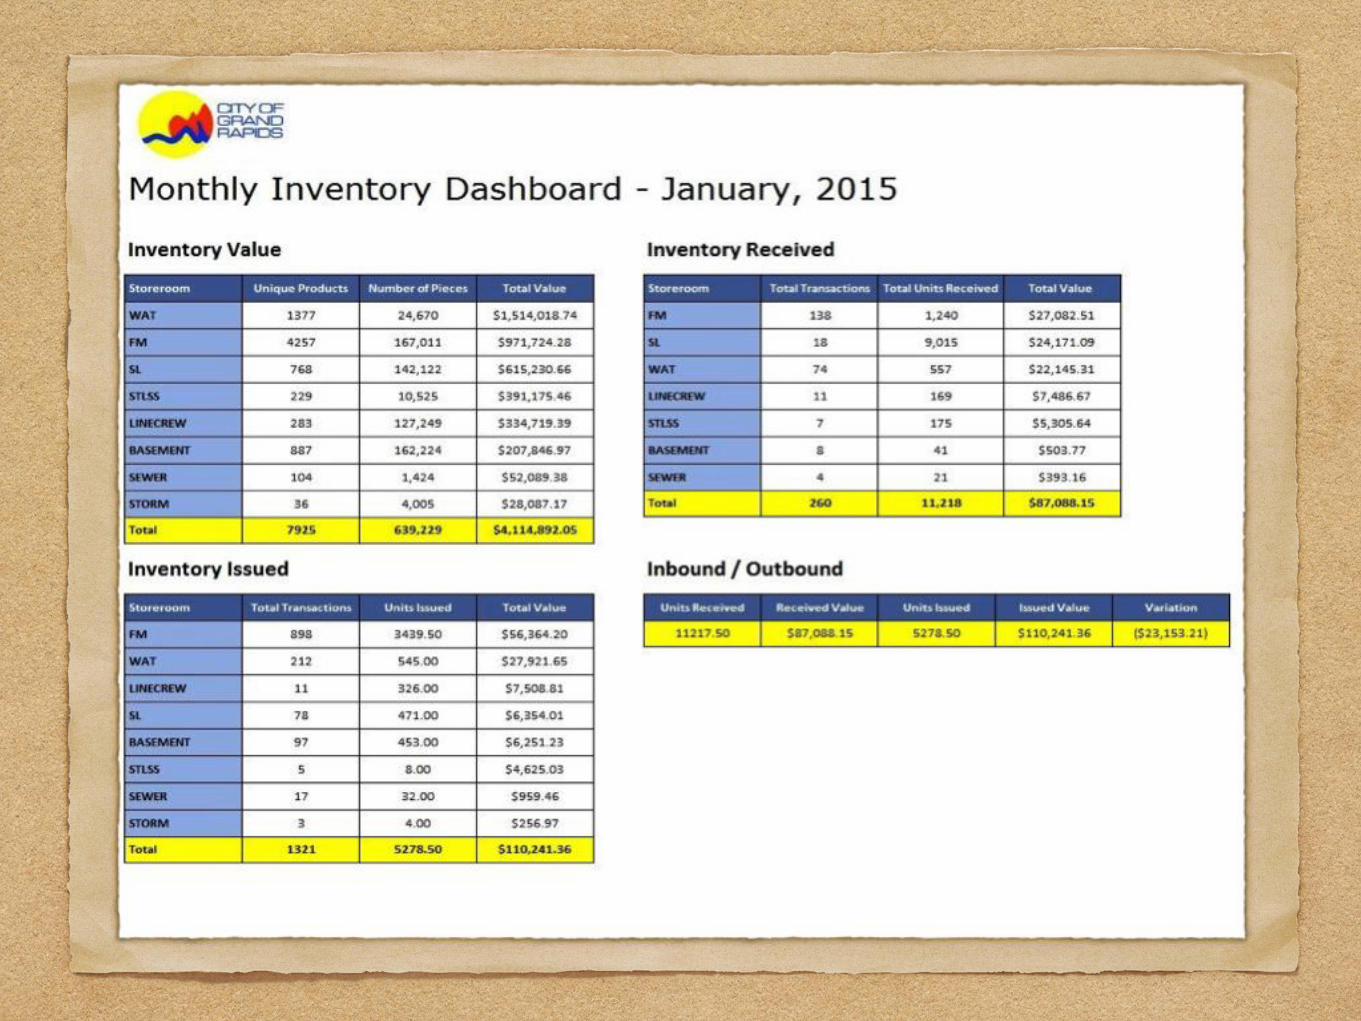
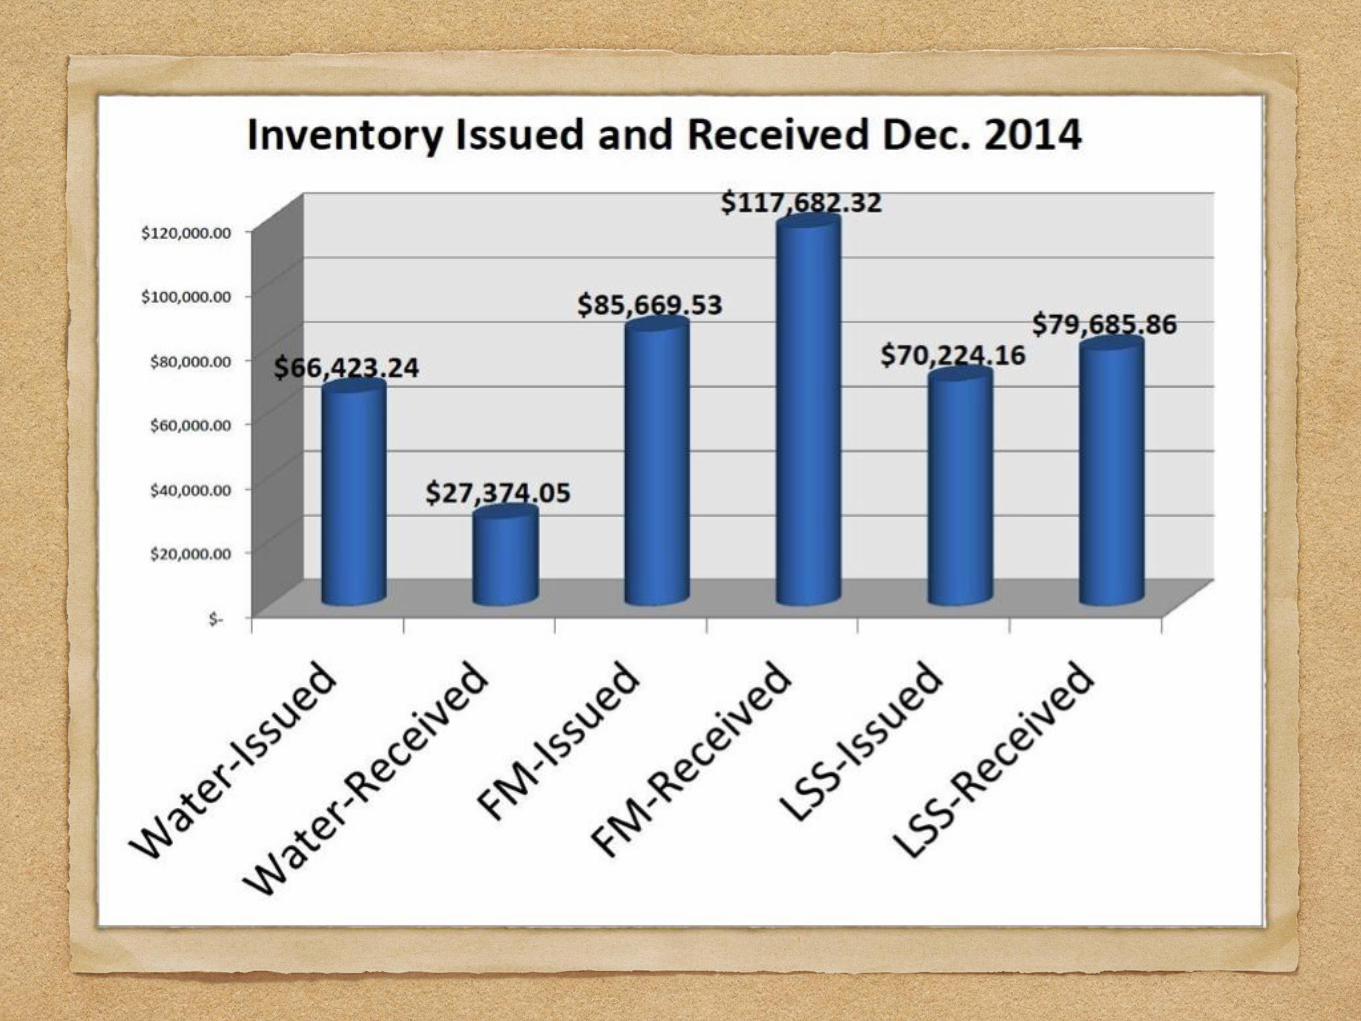
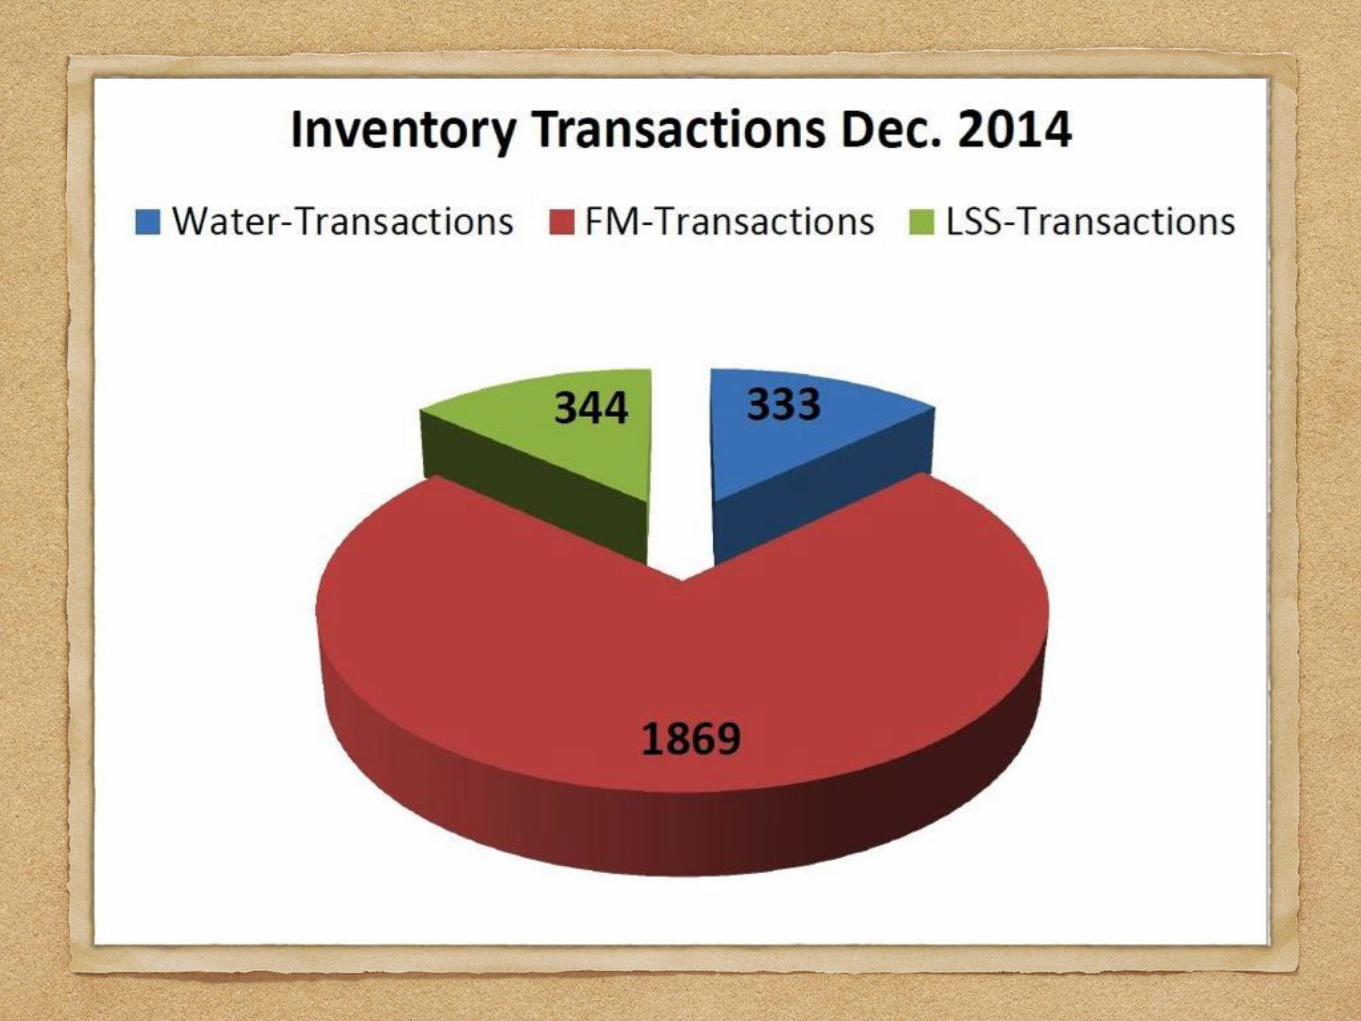
1. Monthly Inventory
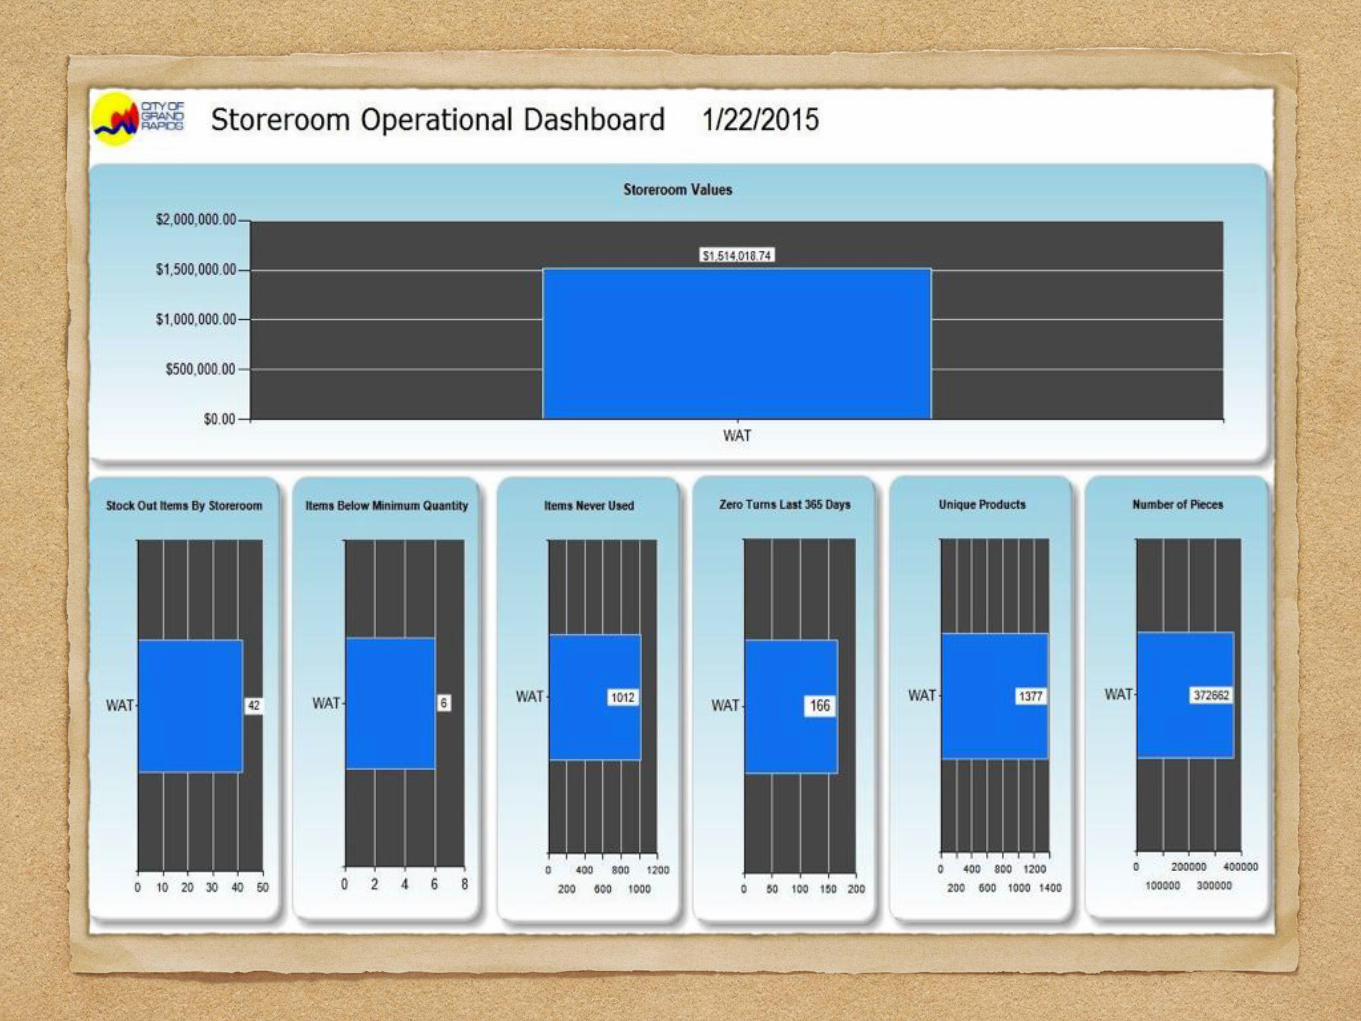
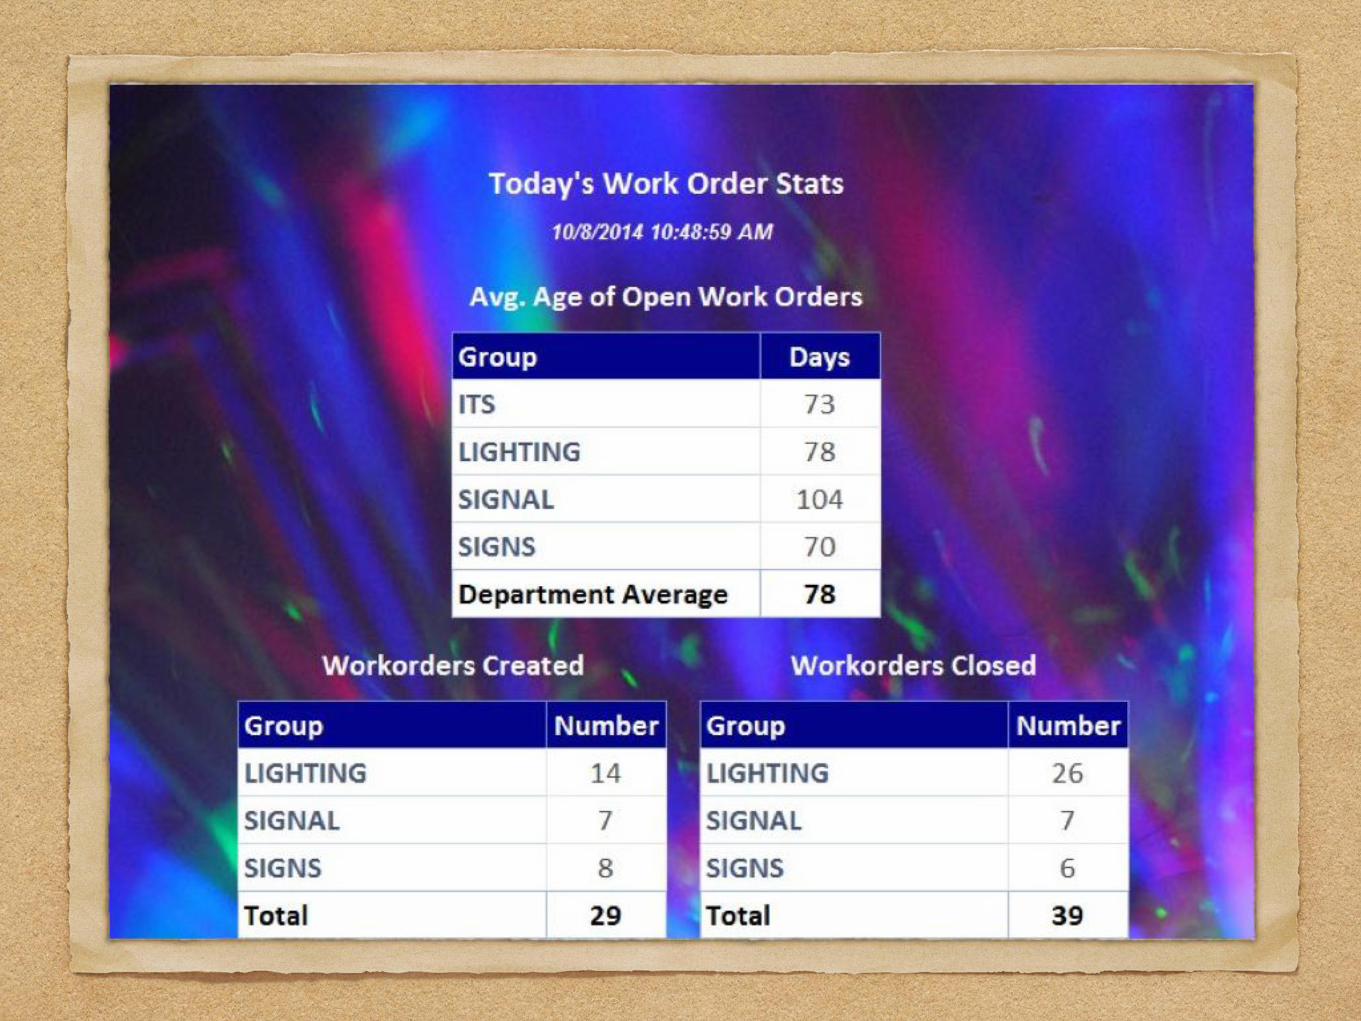
2. Storeroom Dashboard
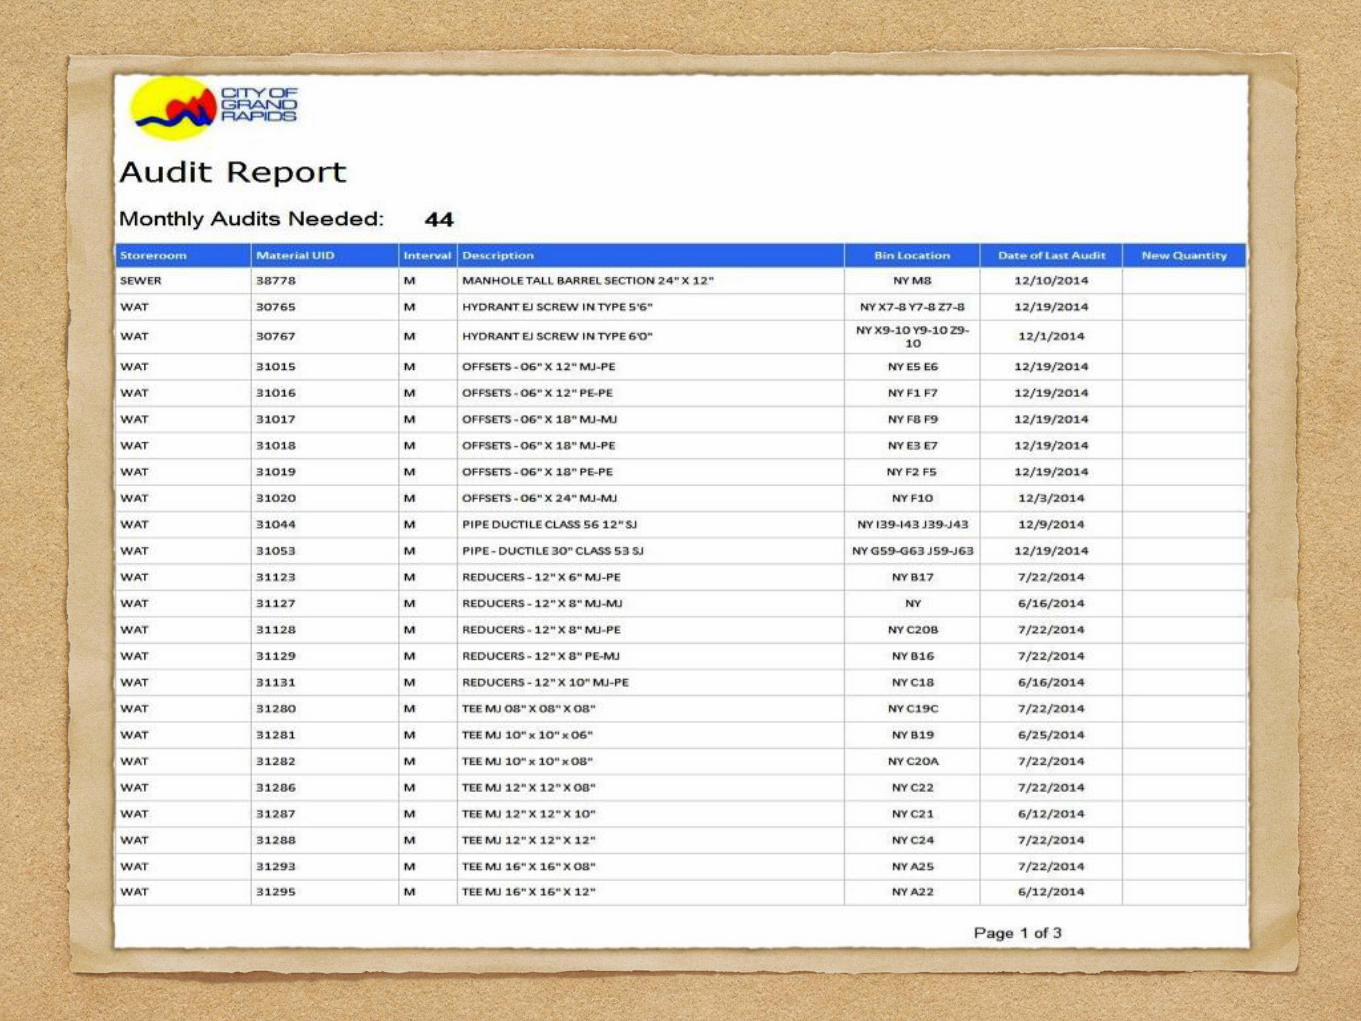
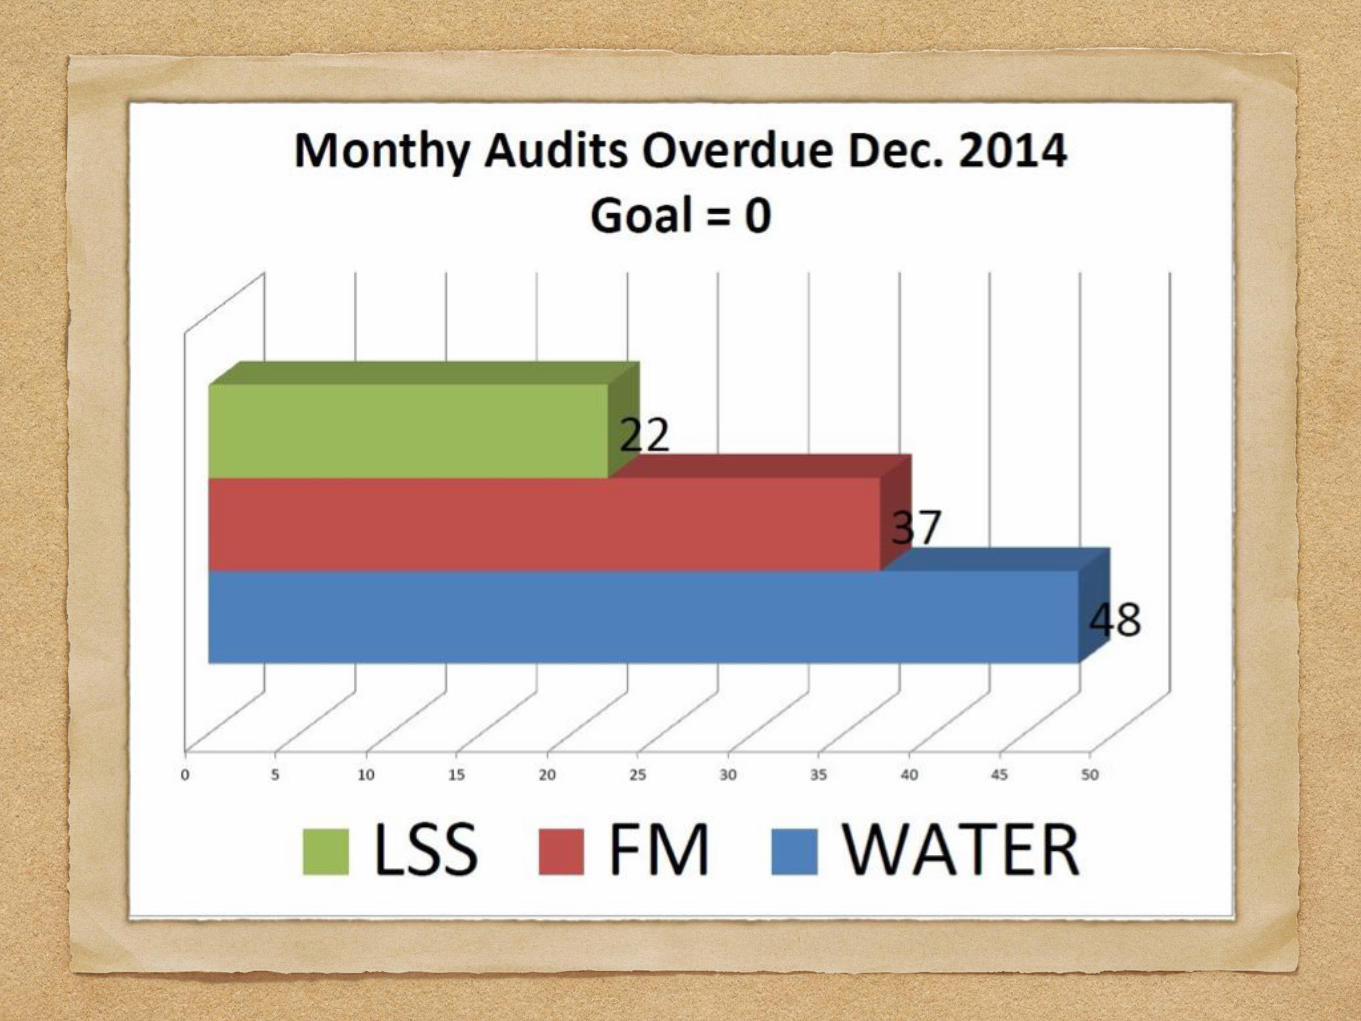
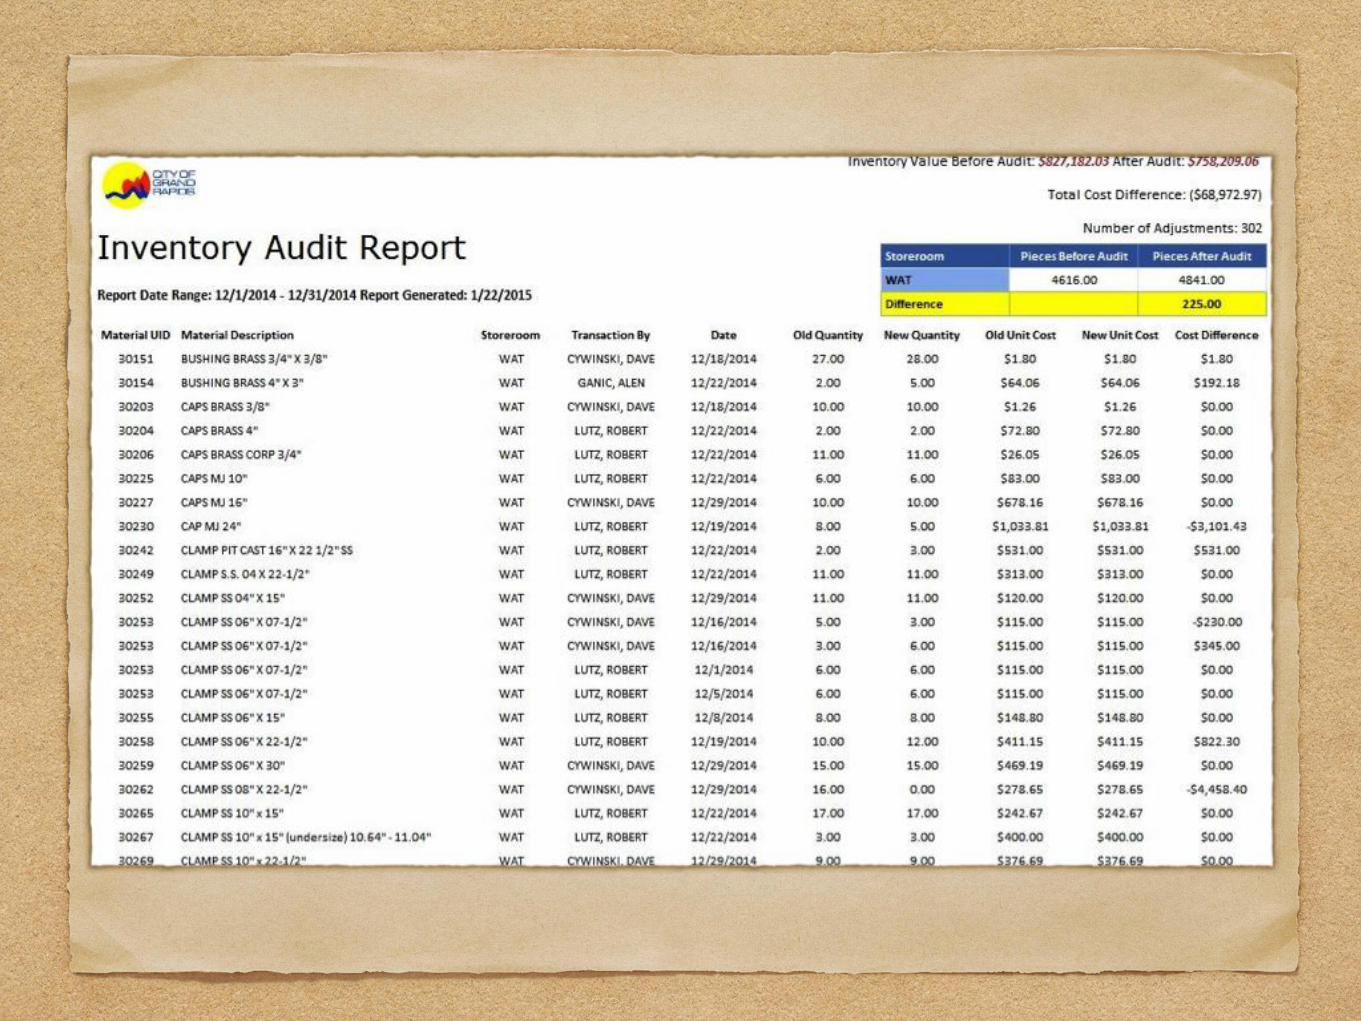
3. Audit Report
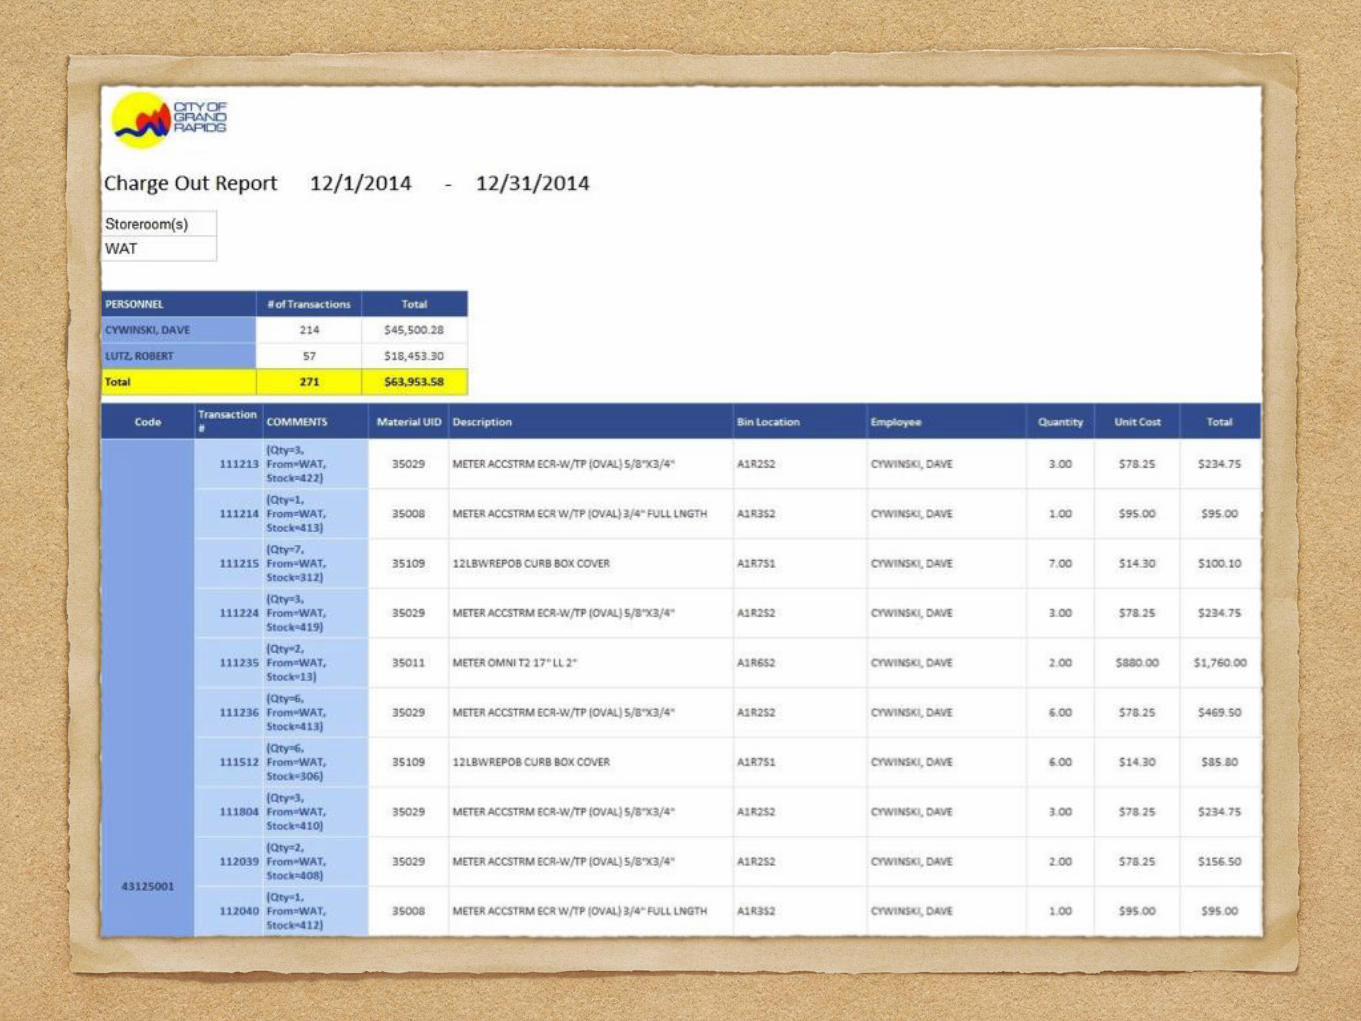
4. Monthly Issue Report
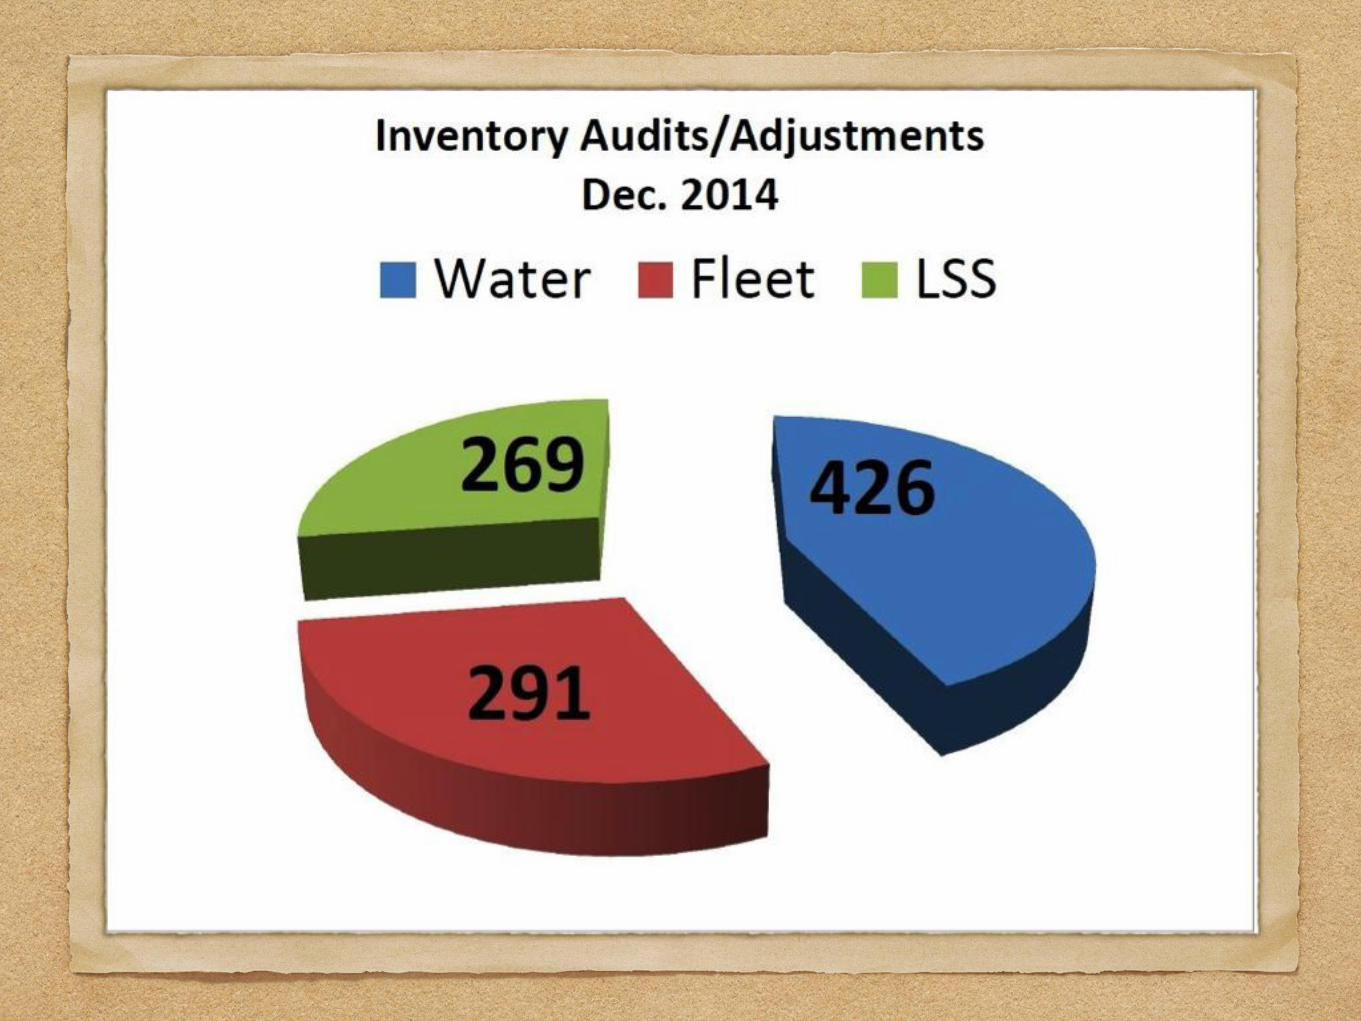
5. Inventory Audits
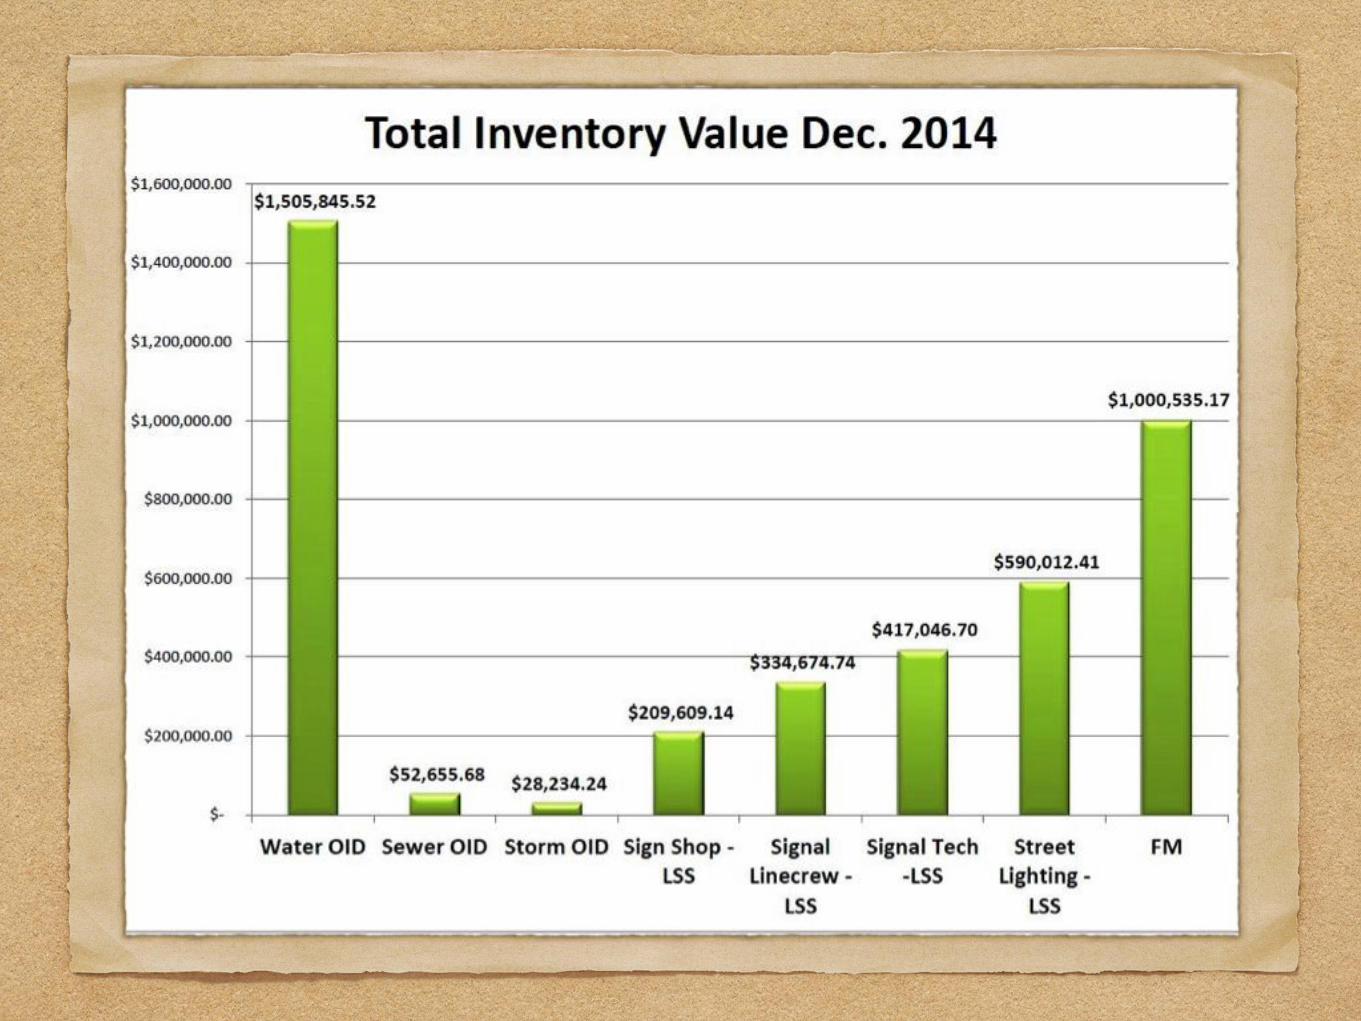
6. Inventory Total
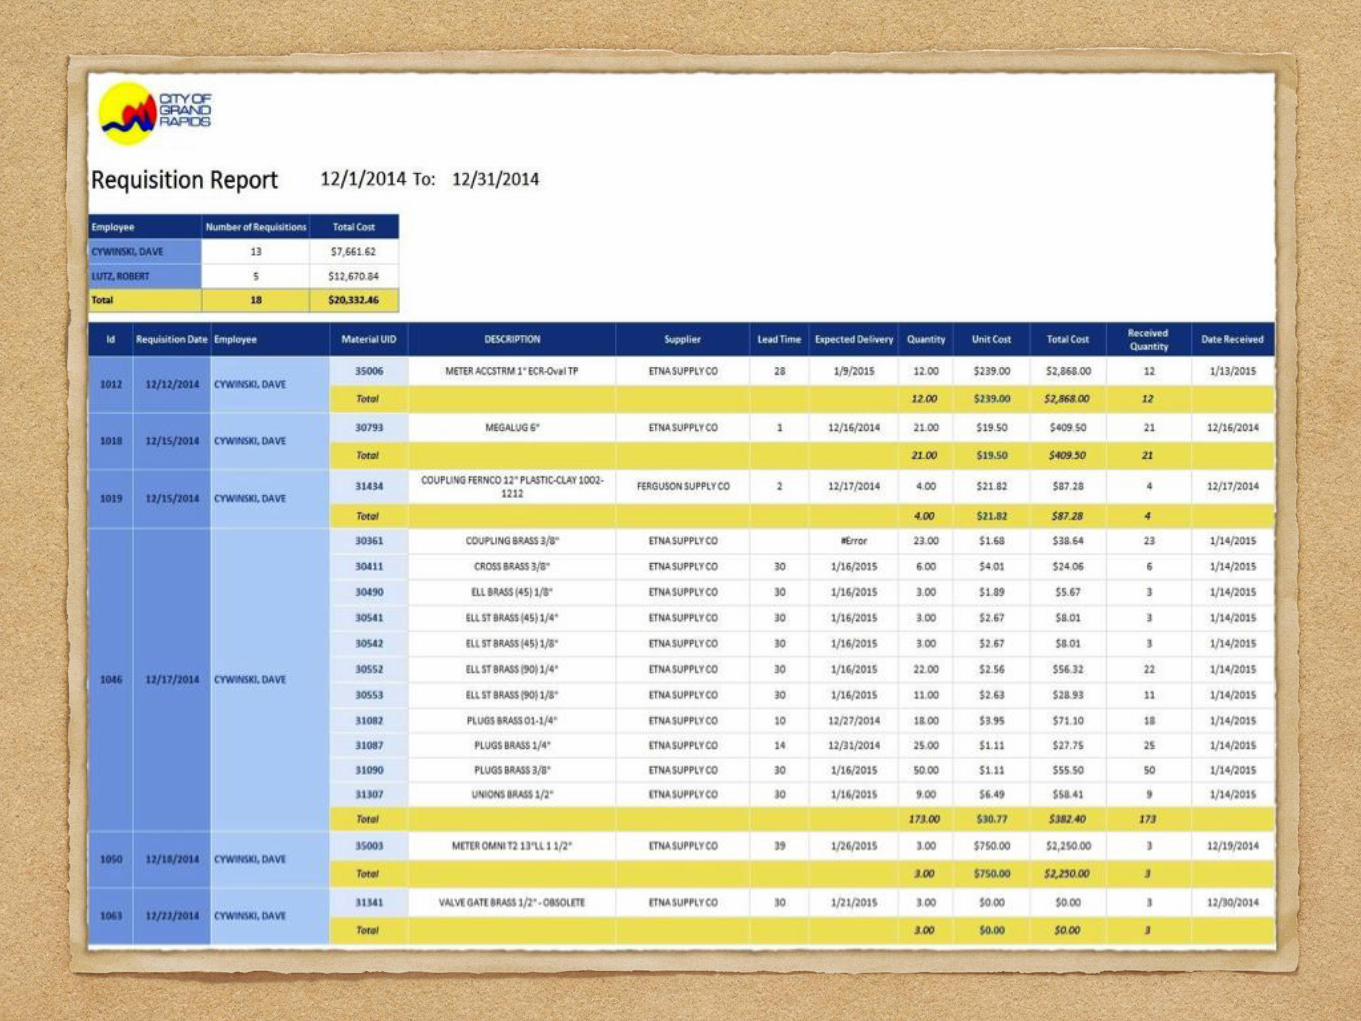
7. Requisition Report
8. Receive Report
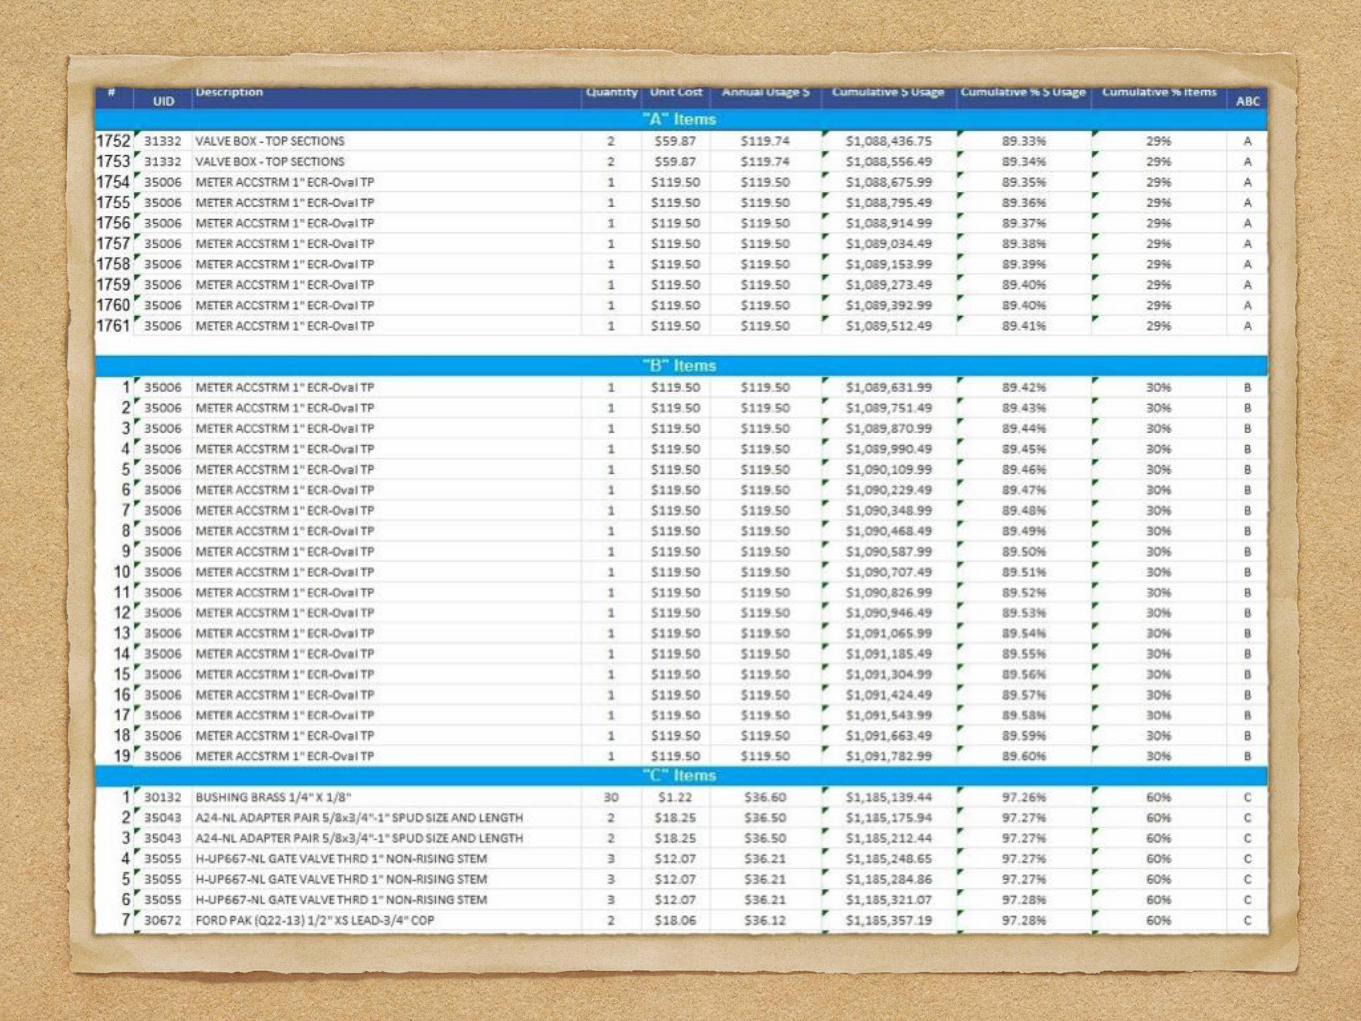
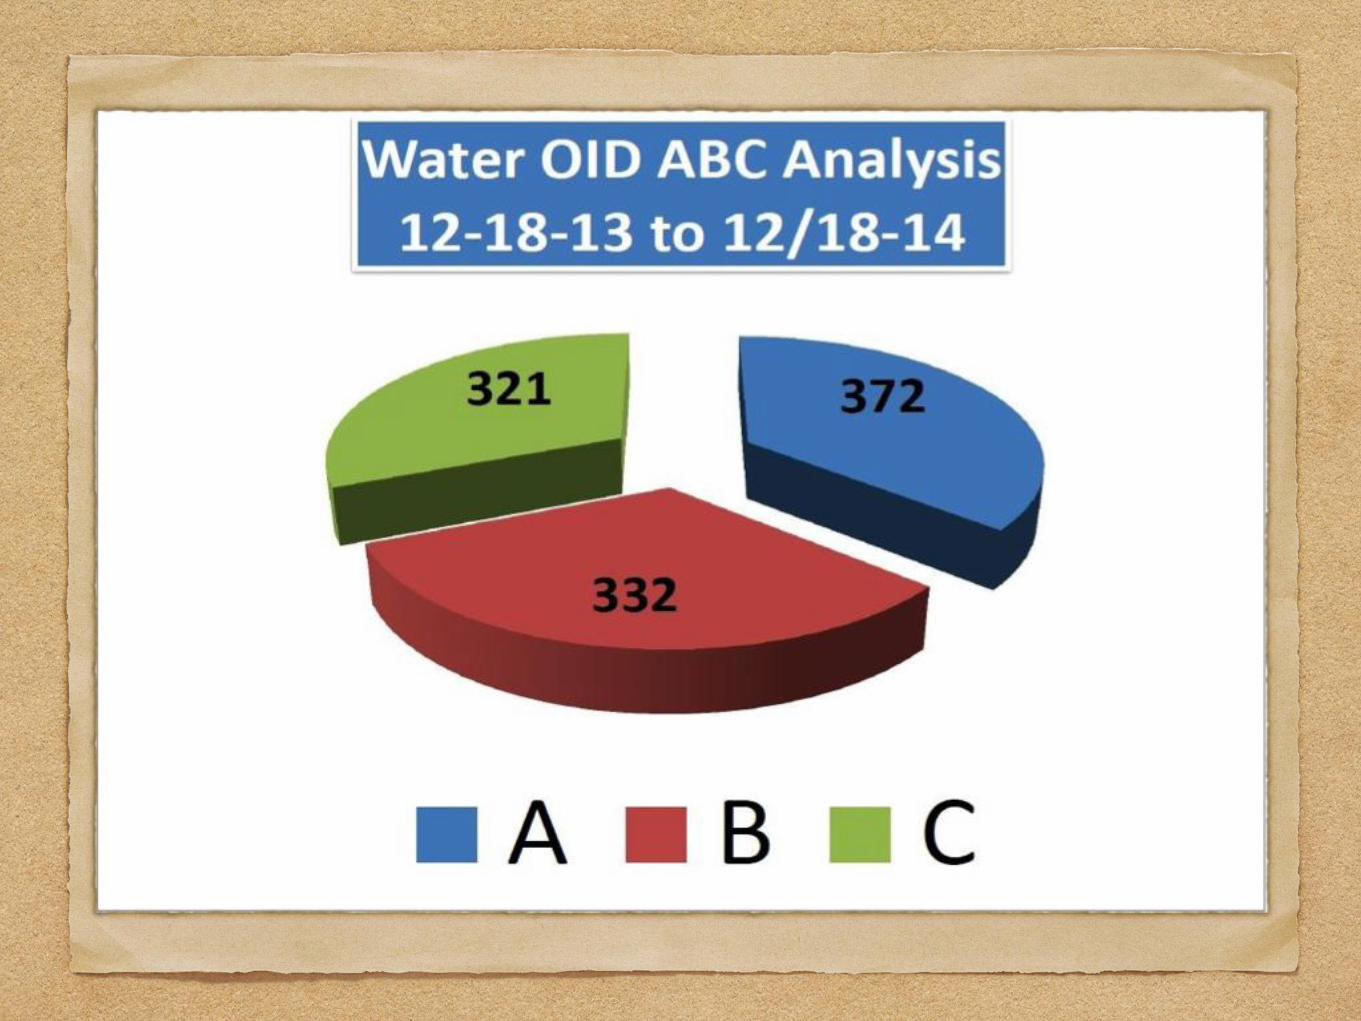
9. ABC Analysis Report
10. Red Tag Report
11. Excess Inventory Report
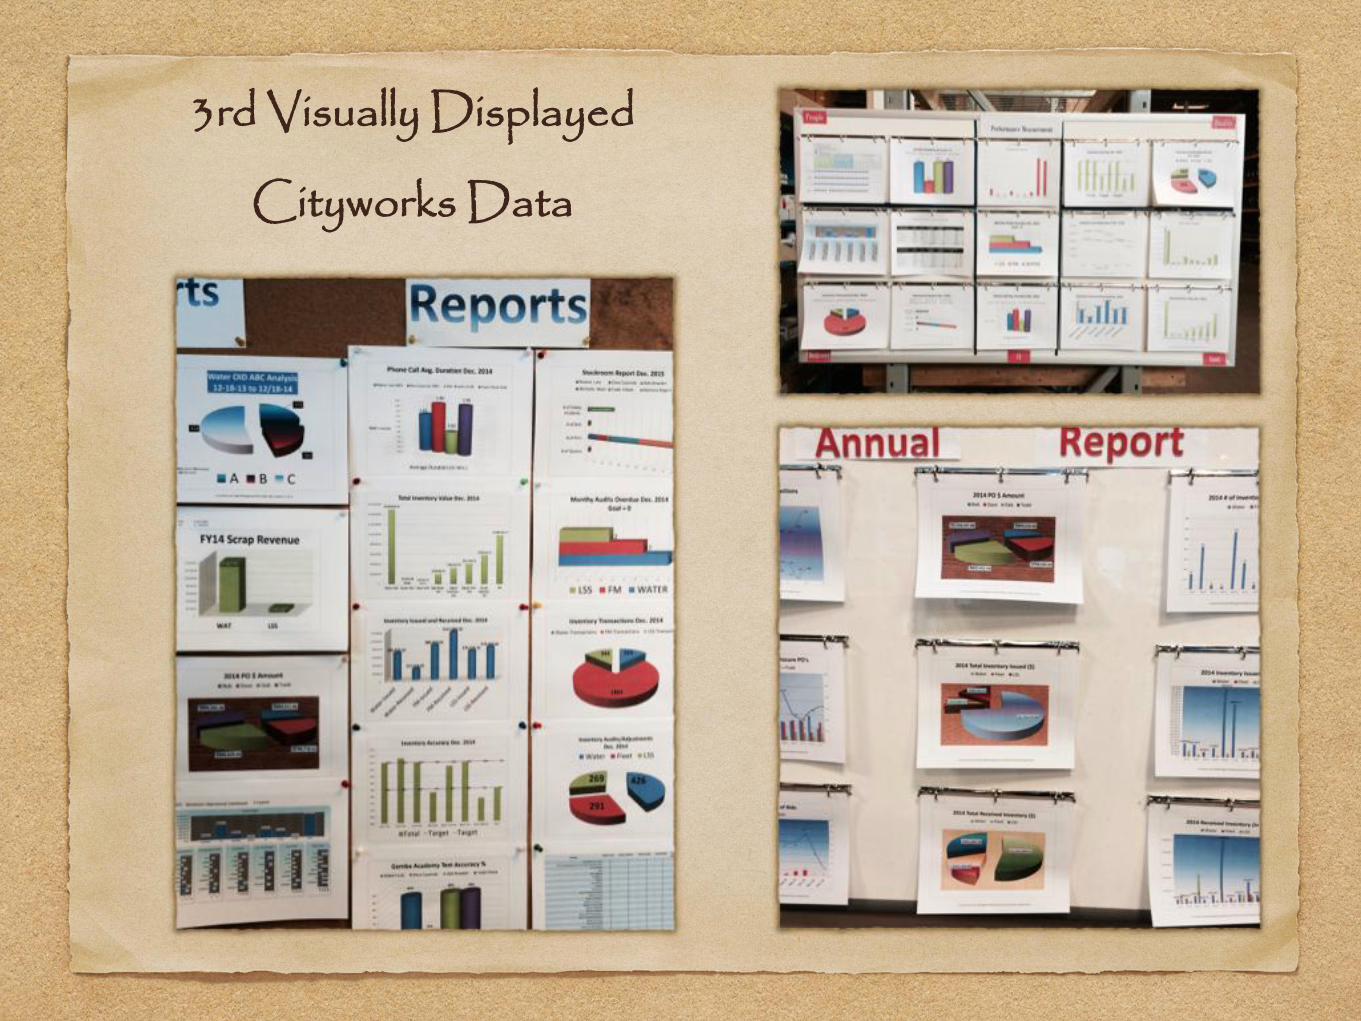
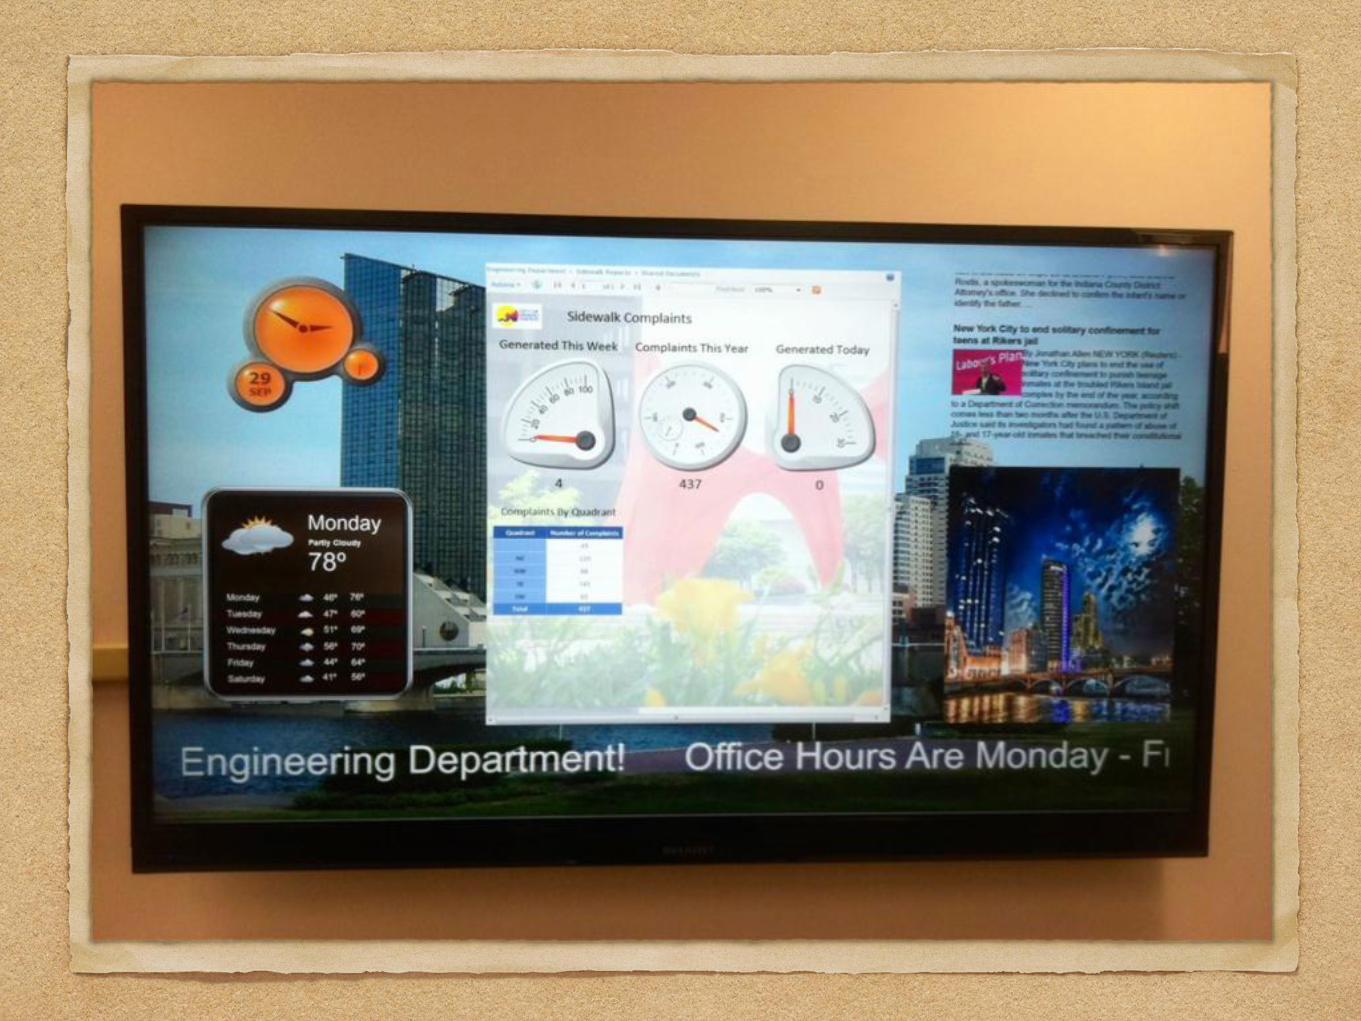
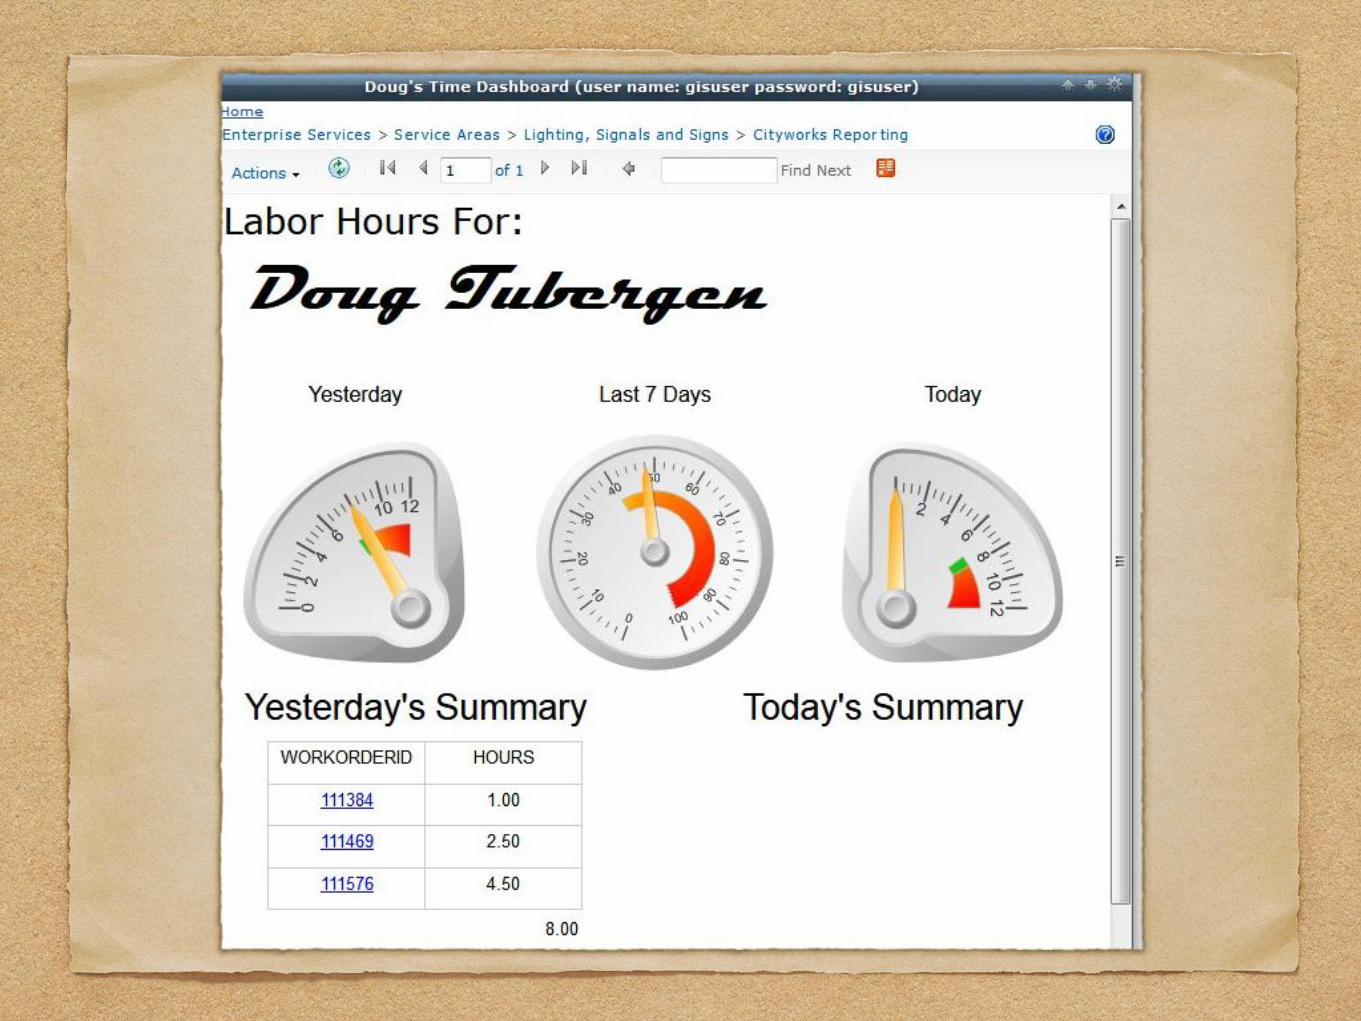
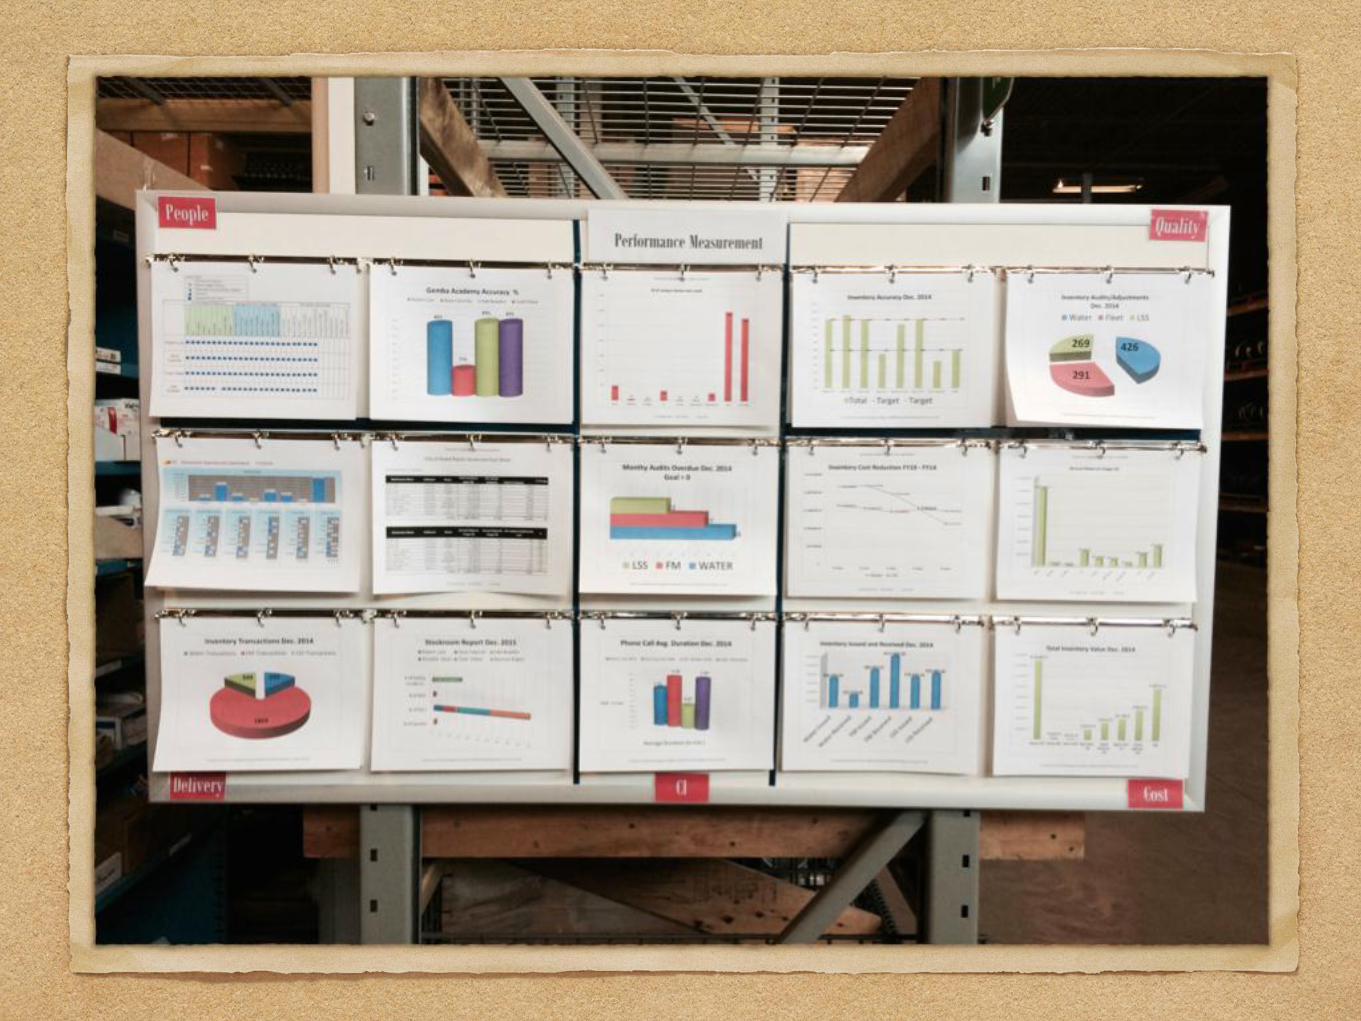
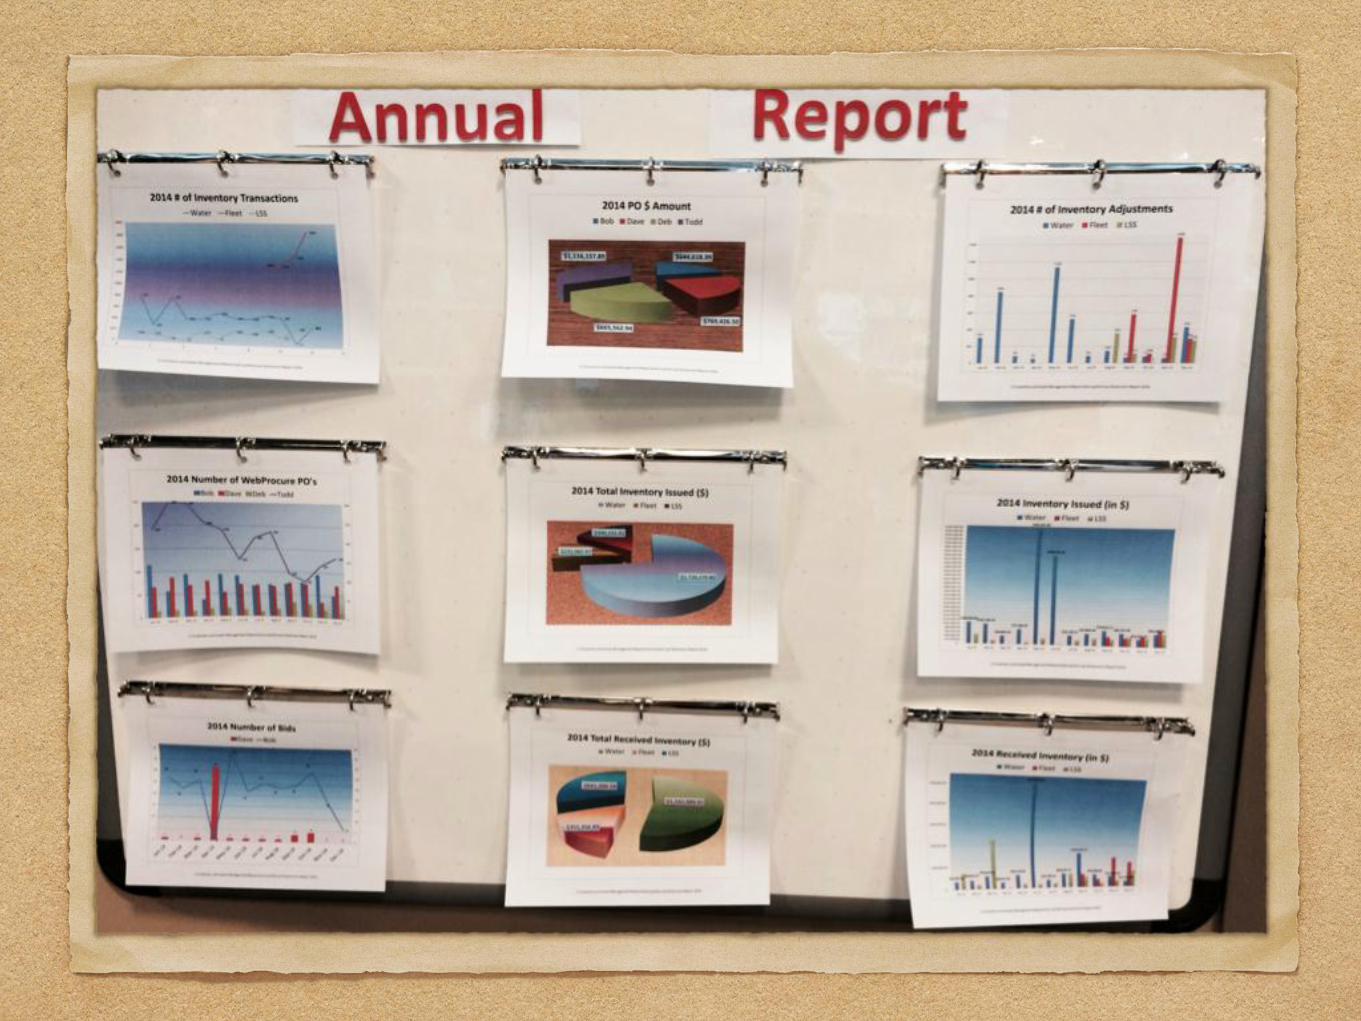
3rd Visually Displayed
Cityworks Data
How does Cityworks visual management replace traditional management?

Cityworks visual management provides understanding at glance
It emphasizes graphics rather than numbers and words
Performance of work is transparent
Those performing work are the first to detect abnormalities
Maintained by those carrying out the work
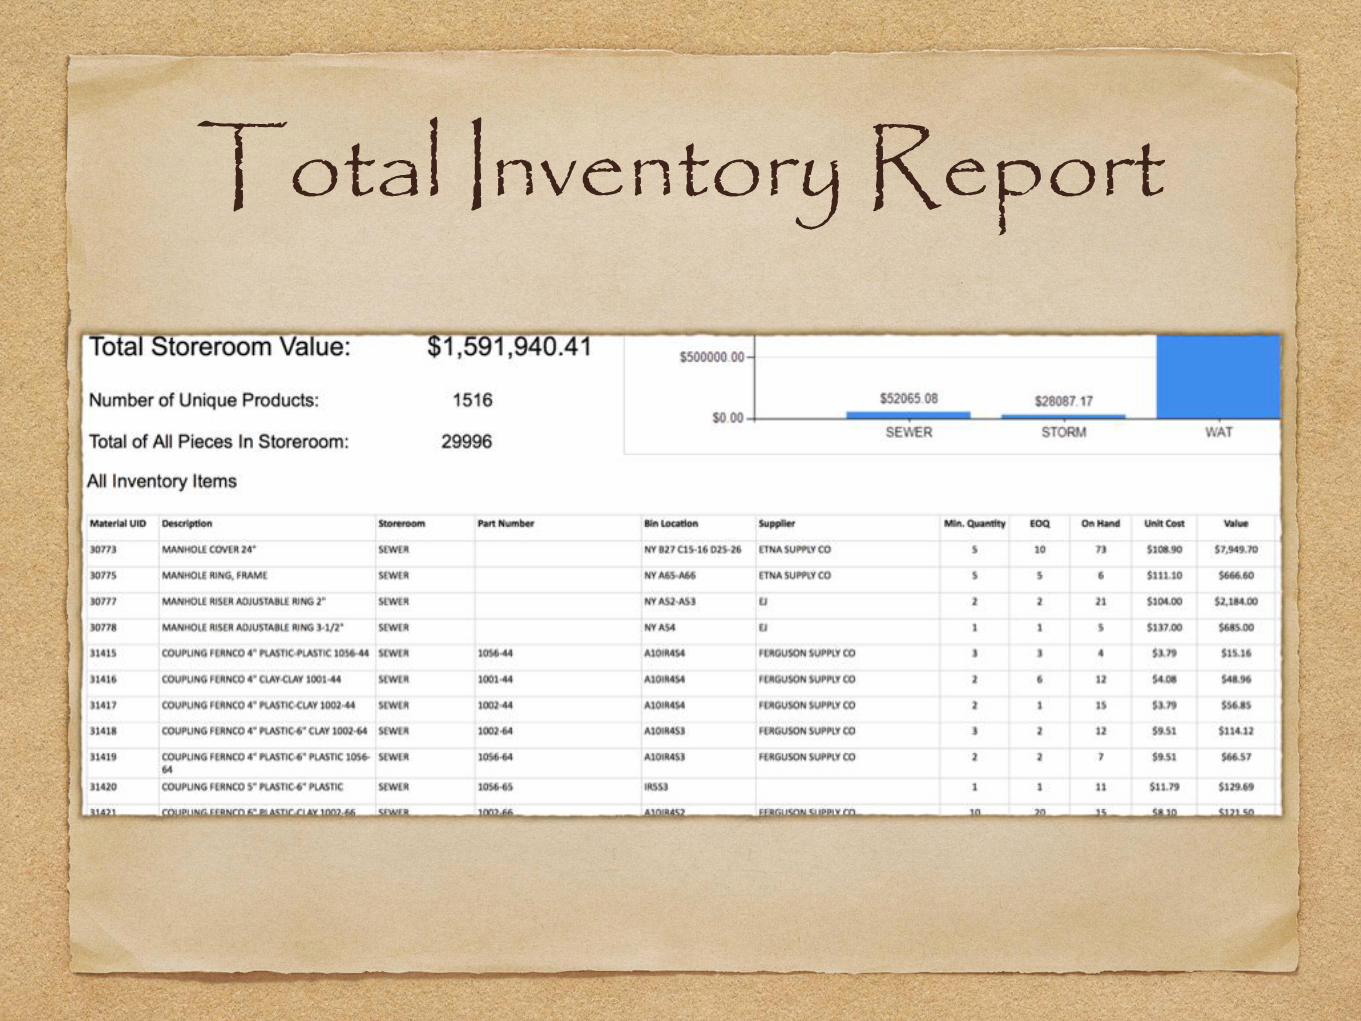
Total Inventory Report
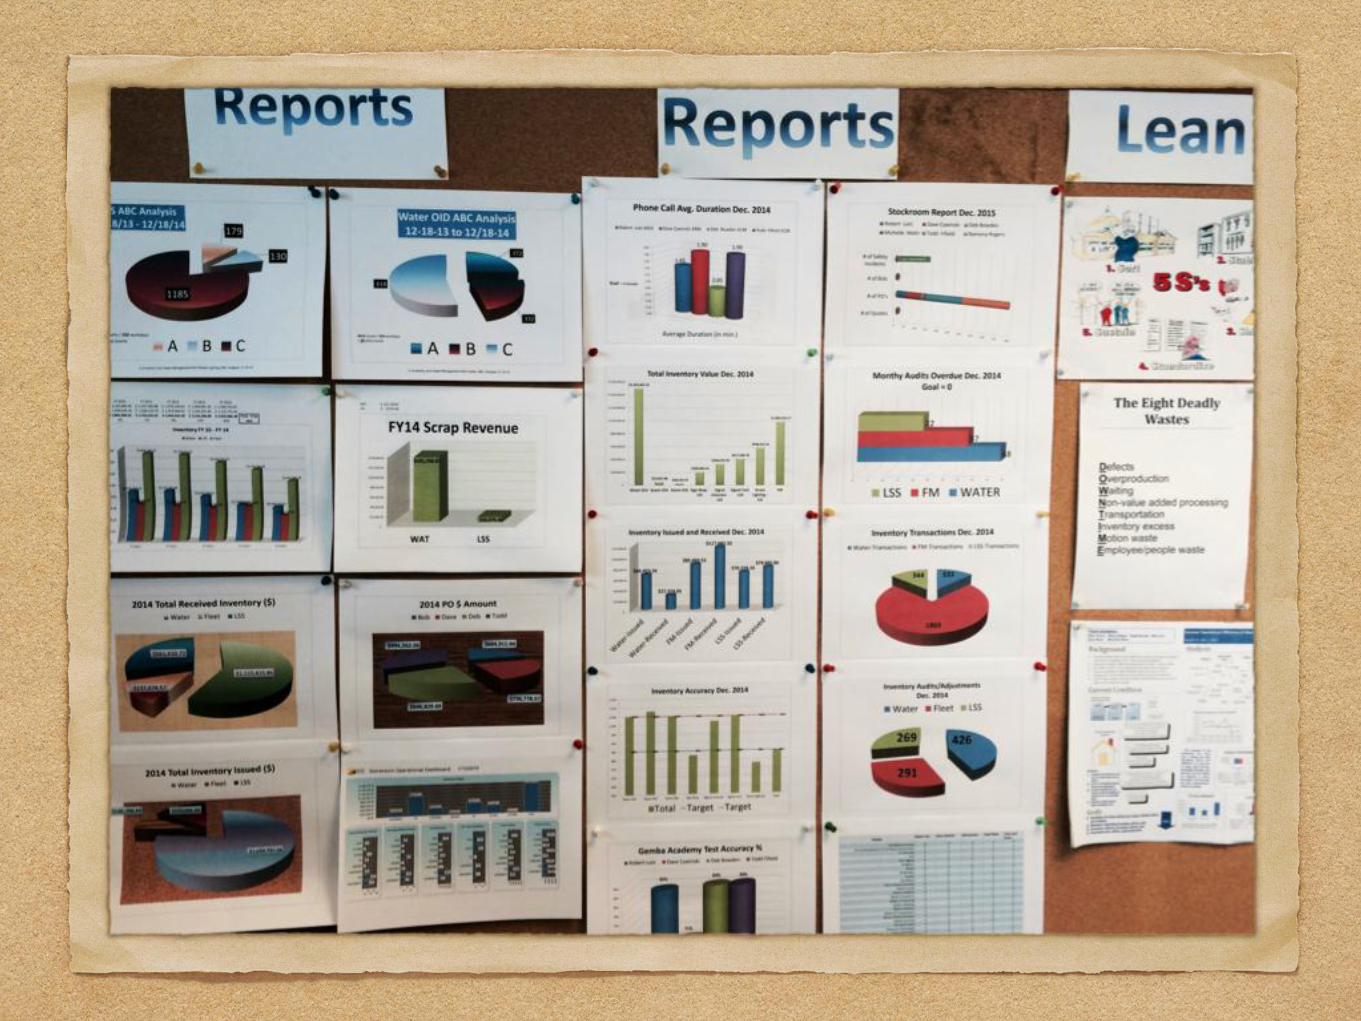
Summery
Use Cityworks visual management to see your operation as a team, to know as a team and to learn as a team
Simplify your Cityworks data so everyone in your organization can understand it at a glance
Let those performing the work be the first one to detect abnormalities
Start displaying your Cityworks visual management tools where all you employees involved in the process can see