leveraging data and strong partnerships to thrive in the land between volume and value
TRANSCRIPT

Leveraging Data And Strong Partnerships To Thrive In The Land Between Volume And Value
Pam Rush, RN, MSDr. William Katsiyiannis

Objectives
• To describe the collaborative partnership between the hospital, health system, and cardiology group.
• To explain the value and rationale for investing in an enterprise data warehouse (EDW).
• To highlight the development of the Minneapolis Heart Institute (MHI) Center for Healthcare Delivery Innovation as a framework to transition from volume to value.
• To demonstrate, through specific case examples, the value of strong partnerships and an EDW in driving meaningful change in cardiovascular (CV) quality and outcomes.
2

Key Points
• Healthcare market forces are driving an increased need for complex data analytics to improve value.
• Allina Health, in collaboration with Health Catalyst, has developed an Enterprise Data Warehouse (EDW) that provides nation leading data analytic capabilities.
• A relentless focus on improving quality drives lower costs.
• Success requires 3 components:
Physician Leadership
Strong care team collaboration (MDs, RNs, Administrators)
An EDW with access to accurate data analytic resources
3

Allina: Region’s Largest Health Care Organization
Allina Health is dedicated to the prevention and treatment of illness and enhancing the greater health of individuals, families and communities throughout Minnesota and western Wisconsin.
Allina Health
• 13 Hospitals
• 82 Clinic sites
• 3 Ambulatory care centers
• Pharmacy, hospice, home care, medical equipment
• 26,000 employees
• 5,000 physicians
• 2.8 million+ clinic visits
• 110,000+ inpatient hospital admissions
• 1,658 staffed beds
• 3.4B in revenue
• 32% Twin Cities market share
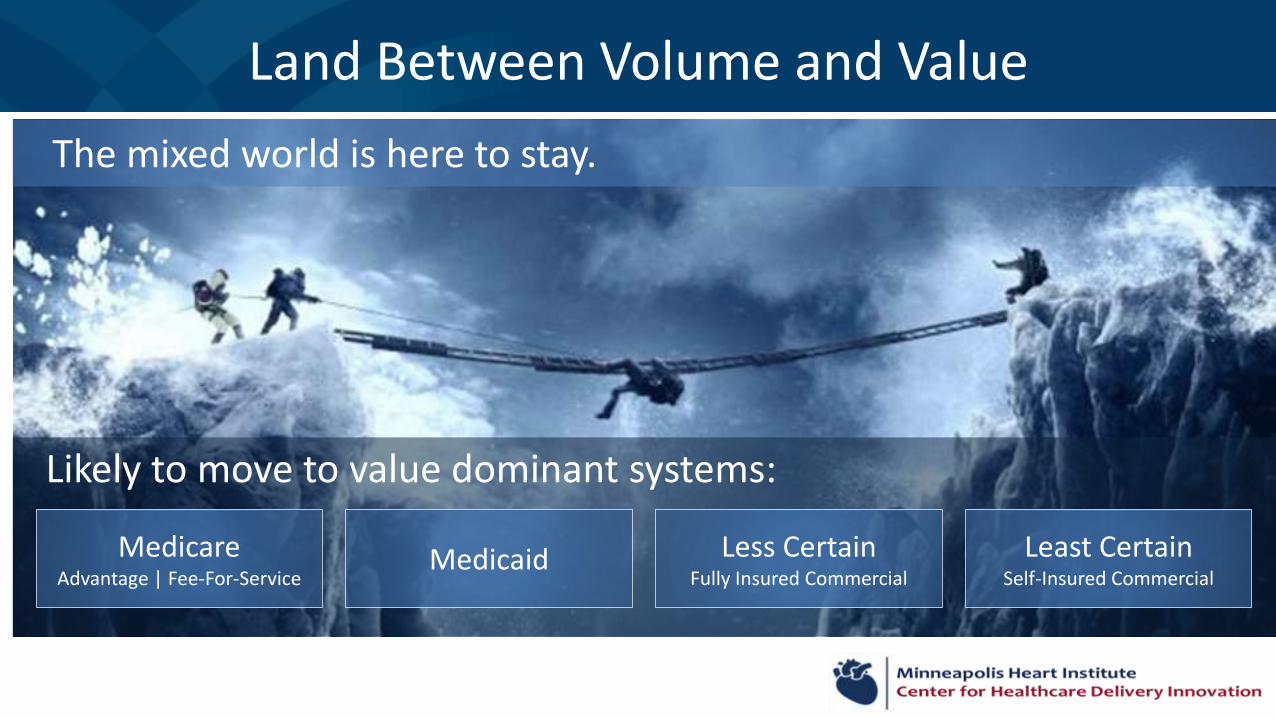
Land Between Volume and Value
The mixed world is here to stay.
Likely to move to value dominant systems:
MedicareAdvantage | Fee-For-Service
Medicaid Less CertainFully Insured Commercial
Least CertainSelf-Insured Commercial

Power of Partnership: Minneapolis Heart Institute (MHI) and Allina
Common vision.
Aligned interests.
Supportive infrastructure.
Platform to allow ongoing investment.
Trust.
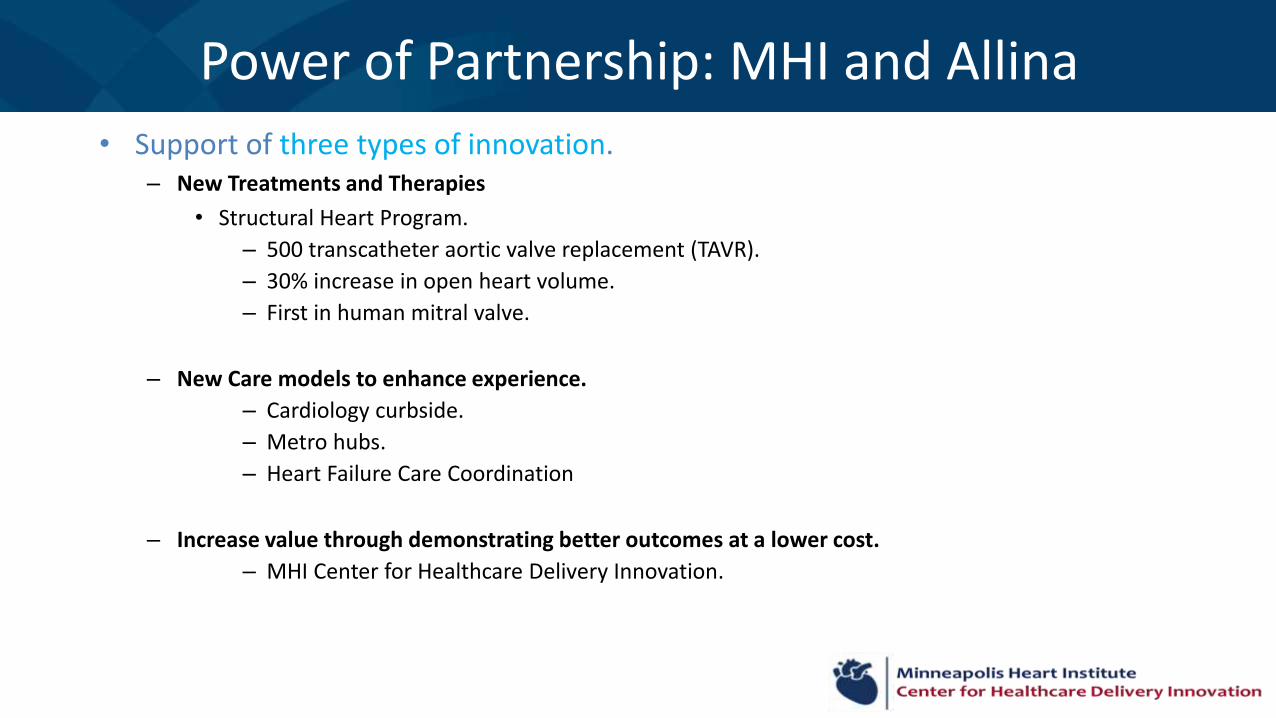
Power of Partnership: MHI and Allina
• Support of three types of innovation.– New Treatments and Therapies
• Structural Heart Program.
– 500 transcatheter aortic valve replacement (TAVR).
– 30% increase in open heart volume.
– First in human mitral valve.
– New Care models to enhance experience.
– Cardiology curbside.
– Metro hubs.
– Heart Failure Care Coordination
– Increase value through demonstrating better outcomes at a lower cost.
– MHI Center for Healthcare Delivery Innovation.

US Healthcare SpendingU.S. Health spending—larger than the gross domestic product (GDP) of most nations
• If all of that activity was separated into its own sovereign nation, it would constitute the fifth largest economy in the world, behind only the United States, China, Japan, and Germany.
$2.7 TRILLIONU.S. HEALTH SPENDING in 2011
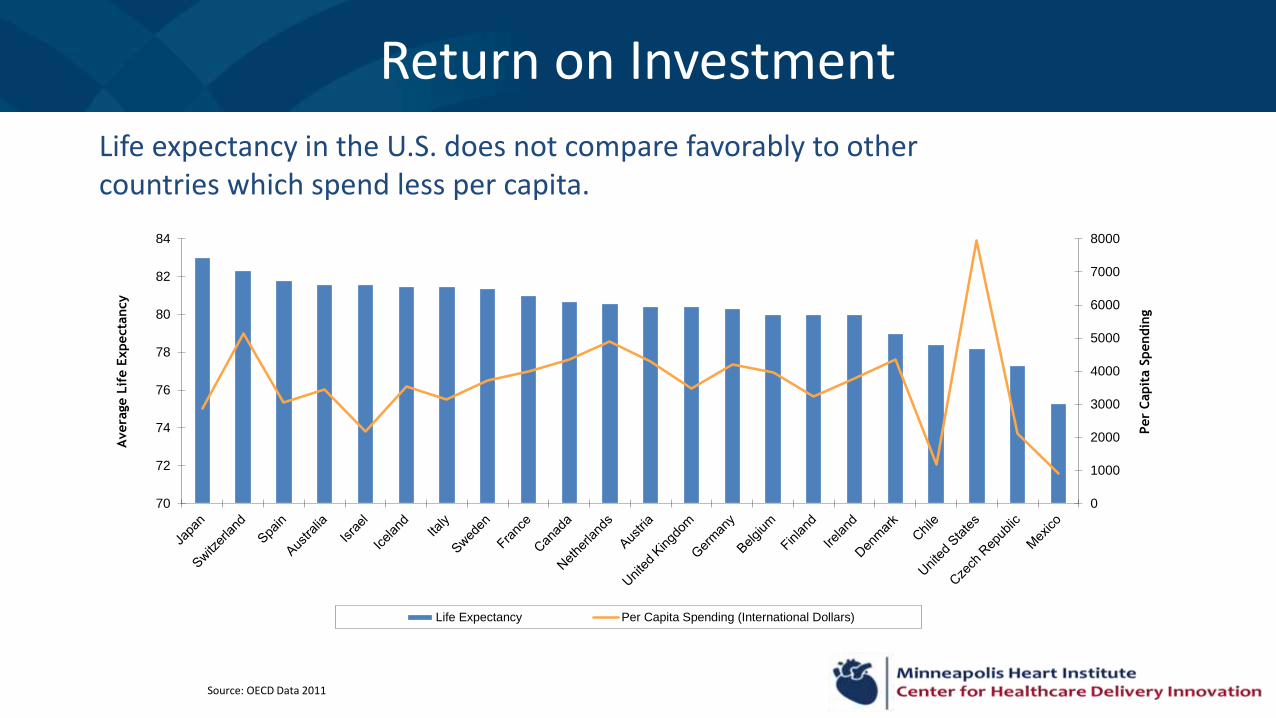
Return on Investment
Source: OECD Data 2011
Life expectancy in the U.S. does not compare favorably to other countries which spend less per capita.
0
1000
2000
3000
4000
5000
6000
7000
8000
70
72
74
76
78
80
82
84
Per
Capit
a S
pendin
g
Avera
ge L
ife E
xpecta
ncy
Life Expectancy Per Capita Spending (International Dollars)

Healthcare Spending in MinnesotaTotal healthcare spending in Minnesota was $40 billion in 2012; expected to grow 6.5% per year.

Forecasting the Future of CV Disease
Source: Heidenreich, P. A., Trogdon, J. G., Khavjou, O. A., Butler, J., Dracup, K. … Woo, Y. J. (2011). Forecasting the future of cardiovascular disease in the United States: A policy statement from the American Heart Association. Circulation, 123, 933-944.
A policy statement from the American Heart Association
CV Costs Reach
$ 818 Billion in 2030

Costs and Variation Among CV Conditions

Payment Reform Pressures
Target percentage of Medicare fee-for-service (FFS) payments linked to quality and alternative payment models in 2016 and 2018.
All Medicare FFS (Categories 1-4)
2016
All Medicare FFS
30%
85%
FFS linked to quality (Categories 2-4) Alternative payment models (Categories 3-4)
2018
All Medicare FFS
50%
90%

CMS Proposes Mandatory Cardiac Bundles
14
1. New mandatory CMS bundles apply to acute MI and CABG patients.
2. Bundles require hospital accountability for cost and quality during inpatient stay and 90 days after discharge.
3. Hospitals chosen from 98 randomly selected metropolitan statistical areas.
4. Bundles would begin July 1, 2017.
5. CMS will pay quality adjusted target payments for each episode of care.

Opportunities For Collaboration
• Relentless pursuit of:
– High quality outcomes.
– Optimized publicly reported measures.
– Reduced cost.
– Increased revenue.
– Improved patient experience.
– Increased affordability.
– Growth.
– Improved health of the community.

Quality of Care Focus
16
“Quality improvement is the most powerful driver of cost containment.”
~ Michael Porter, PhD Harvard Business School

Need for CV Care Innovation
• The development of the MHI Center for Healthcare Delivery Innovation places Allina Health as a national leader in driving necessary change in our healthcare delivery system.
• Focused on reducing variation through:
• Standardized cardiovascular care protocols.
• Advanced risk-stratification tools.
• Real time decision support at the point of care.
• Innovative strategies for care delivery.
The Center leverages the existing infrastructure of Allina’s EDW and cardiology participation in national registries to achieve the Triple Aim goals of improving population health, reducing per capita costs, and improving the patient experience.

Primary Care
• Healthy lifestyle.
• Weight management.
• Smoking cessation.
• Exercise.
• Lipid management.
• Routine treatment protocols.
• Referral protocols.
Outpatient Cardiology
• Timely access to specialists.
• Guideline driven testing and treatment.
• Comprehensive diagnostic testing.
Sub-Specialty Cardiology
• Complex patients requiring further evaluation and treatment.
• Cardiac surgery.
• Arrhythmias.
• Structural heart disease.
• Prevention.
Inpatient and Emergency Services
• Level I program.
• ST-segment elevation myocardial infarction (STEMI).
• Critical limb ischemia.
• Aortic dissection.
• Abdominal aortic aneurysm.
• Specialized inpatient CV
care.
Advanced Therapies
• Extracorporeal membrane oxygenation (ECMO.)
• Left ventricular assist device (LVAD).
• Heart transplant.
• Trans-catheter aortic valve replacement (TAVR).
• MitraClip
• Percutaneous mitral valve repair (MVR).
Developing The Healthcare Delivery Innovation Center
Optimize Care Across the CV Continuum
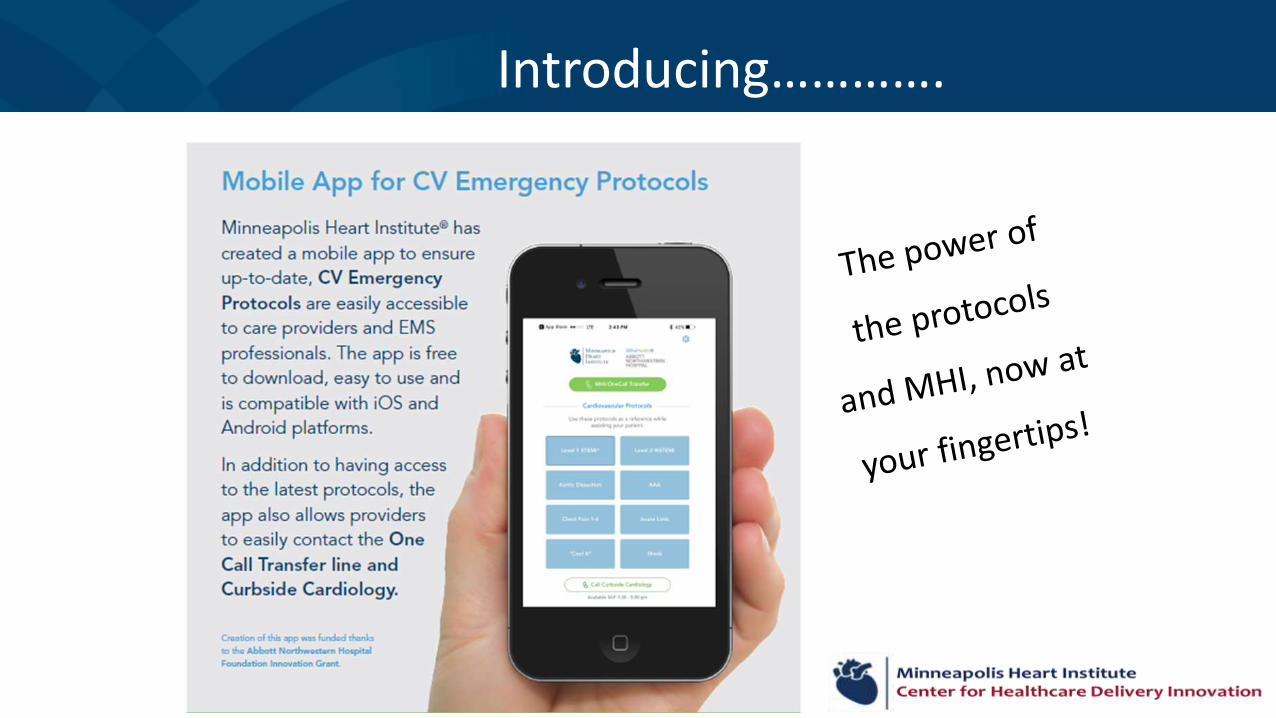
Introducing………….
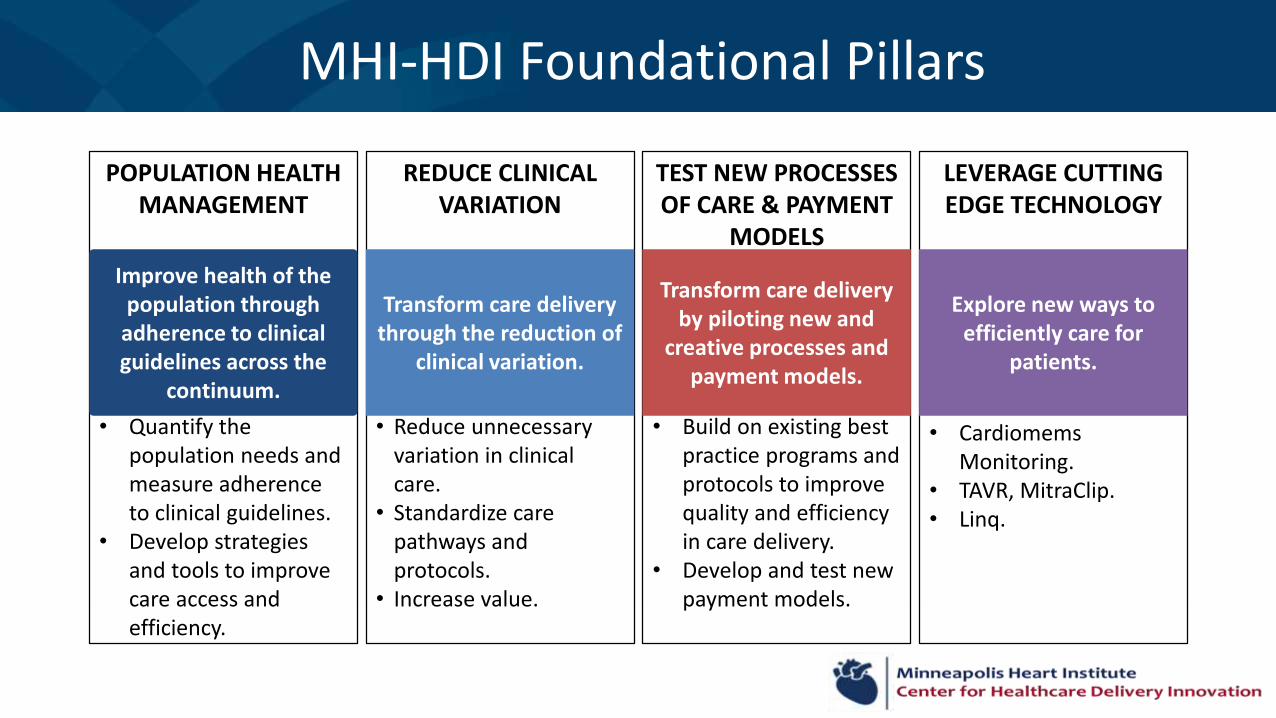
POPULATION HEALTH MANAGEMENT
• Quantify the population needs and measure adherence to clinical guidelines.
• Develop strategies and tools to improve care access and efficiency.
REDUCE CLINICAL VARIATION
• Reduce unnecessary variation in clinical care.
• Standardize care pathways and protocols.
• Increase value.
TEST NEW PROCESSES OF CARE & PAYMENT
MODELS
• Build on existing best practice programs and protocols to improve quality and efficiency in care delivery.
• Develop and test new payment models.
LEVERAGE CUTTING EDGE TECHNOLOGY
• CardiomemsMonitoring.
• TAVR, MitraClip.• Linq.
Improve health of the population through
adherence to clinical guidelines across the
continuum.
Transform care delivery through the reduction of
clinical variation.
Transform care delivery by piloting new and
creative processes and payment models.
Explore new ways to efficiently care for
patients.
MHI-HDI Foundational Pillars
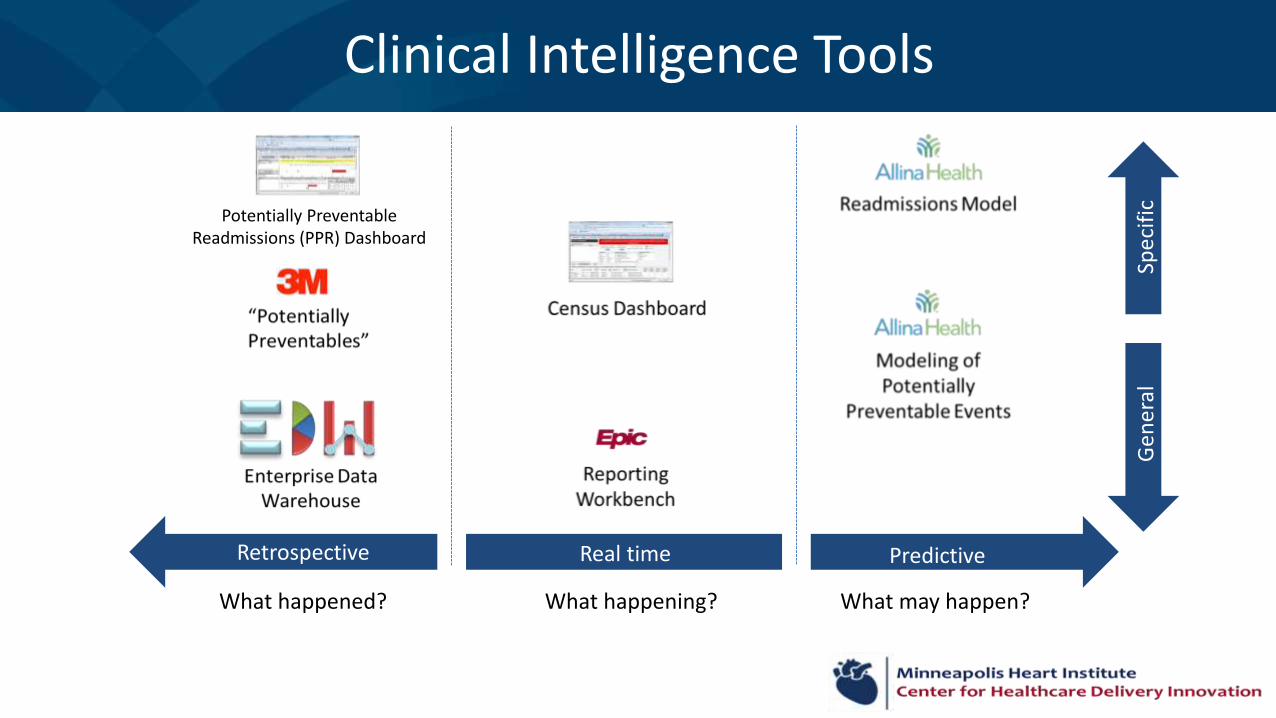
Clinical Intelligence Tools
What happened? What happening? What may happen?
Retrospective Real time Predictive
Ge
ne
ral
Spe
cifi
c
Potentially Preventable Readmissions (PPR) Dashboard

2012: Limited Tracking of Performance Enhancement $
•Acute myocardial infarction (AMI) optimal care.
•Heart failure (HF) optimal care.
•Coronary artery bypass (CAB) surgical care improvement project (SCIP) optimal care.
•Bivalirudin or radial access increased from 25% to 55% in high risk bleeding patients.
•Revised and standardized HF, AMI and percutaneous coronary intervention (PCI) patient education documents.
•United HF readmissions reduced from 19.25% to 14.9%.
•Society of thoracic surgeon (STS) dashboard developed.
•100% of cardiologist trained on the clinical documentation improvement project (clinical documentation).
•Length of stay (LOS) savings $73,000.
•$1.3M in supply cost savings.
2013 Performance Enhancement: $12,074,221
•Bivalirudin use in high risk PCI pts: 69.0% at Abbott Northwestern Hospital (ANW), 68.8% at Mercy Hospital, and 75.0% at United Hospital.
•72% (124/173) patients seen in pre-op clinic.
•Blood utilization.
•Goal: $461,641.
•Actual: $396,000.
•RBC: 2.14 1.98 u/case
•FFP: 1.43 .94 u/case
•Platelets: .72 .59 u/case
•HF dashboard developed.
•Cardiovascular (CV) LOS:
•104% baseline.
•102.6% Actual.
•Savings: $640,221.
•Supply chain savings: $2,670,600.
•Clinical documentation: $8,367,400.
•Willingness to recommend: 94%.
2014 Performance Enhancement: $13,645,000
•160 more PCI patients at high risk for bleeding had a closure device used.
•114 intensive care unit (ICU) days were avoided for low risk ST segment elevation myocardial infarction (STEMI) and transcatheter aortic valve replacement (TAVR) patients.
•481 more HF patients had care coordinated by a HF care coordinator.
•13 more HF patients appropriately evaluated by Advanced HF referrals for ventricular assist device (VAD)/transplant.
•400 days saved through HF LOS efforts.
•886 fewer units of blood given to CV surgery patients.
•22% more patients who developed Afib post CV surgery were treated using the Afib protocol.
•28,029 fewer unnecessary creatine, kinase, muscle, and brain (CKMB) lab test completed.
•$2.9M: over utilization and LOS improvements (8 improvements noted above).
•$7.2M: clinical documentation.
•$3.5M: decreased variation in supply chain contract.
Track Record of Success
2015 Performance Enhancement: $6,374,690
•STEMI LOS $120,600.
•Advanced HF referrals $1,432,000.
•TAVR ICU days $153,500.
•HF care coordination $819,600.
•Troponin testing $29,500.
•CKMB Lab Testing $426,900.
•Closure device $395,100.
•Clinical documentation $2,094,000.
•Vascular supply chain $509,500.
•Afib protocol $393,990 (Jan14-Aug 15 at ANW and United Hospital).

Examples: CV Dashboards• PCI:
– Use of closure devices in high risk patients.
• Structural Heart Disease:
– Population management of severe symptomatic aortic stenosis.
• Up to date on guideline recommended echo surveillance.
• Role of primary care physician (PCP), cardiologist, valve specialist.
• Survival curves with and without definitive procedure.
• Cost implications.
• CV Surgery:
– Real-time physician scorecard.
– Bundled payments.

Example: PCI Bleeding Risk
• Area of Opportunity:
– Peri-procedural bleeding complications are common following PCI (3-6%).
– Transfusion rates across Allina Health were higher than national average for patients undergoing PCI.
• Accurate Data:
– NCDR national PCI registry provides standardized, nationally benchmarked, abstracted data.
– EDW enables linking of multiple data sources to evaluate the impact of novel care processes on clinical quality and costs.

Impact of Closure Devices
4% 6%
23%
3%6%
10%
0%
10%
20%
30%
Low Intermediate High
Any Complication
No Vascular Closure Device Yes Vascular closure Device
1.0% 1.7%
12.6%
0.7%2.3%
5.9%
0%
5%
10%
15%
Low Intermediate High
RBC Transfusion
No Vascular Closure Device Yes Vascular closure Device
1% 1%
8%
0%2%
3%
0%
5%
10%
Low Intermediate High
Bleeding with 72 Hours
No Vascular Closure Device Yes Vascular closure Device
0.3% 0.4%
6.8%
0.2% 0.1%1.4%
0%
2%
4%
6%
8%
Low Intermediate High
Mortality
No Vascular Closure Device Yes Vascular closure Device

26

27

28

29
2011 2015-16

30

Learnings: PCI Bleeding Risk Key Steps
• Accurately calculate a pre-PCI Bleeding Risk Score for all PCIs across the Allina Health System.
• Apply consensus guidelines in clinically appropriate cases.
• Effectively communicate bleeding risk to providers managing the patient’s care.
• Track outcomes and provide timely feedback.
Cumulative Savings of 1.8 MReduction of LOS for high bleeding risk from 3.8 to 2.4 daysReduction in complications from 23% to 18% in high bleeding risk

Examples: CV Dashboards• PCI:
– Use of closure devices in high risk patients.
• Structural Heart Disease:
– Population management of severe symptomatic aortic stenosis.
• Up to date on guideline recommended echo surveillance.
• Role of primary care physician (PCP), cardiologist, valve specialist.
• Survival curves with and without definitive procedure.
• Cost implications.
• CV Surgery:
– Real-time physician scorecard.
– Bundled payments.

33
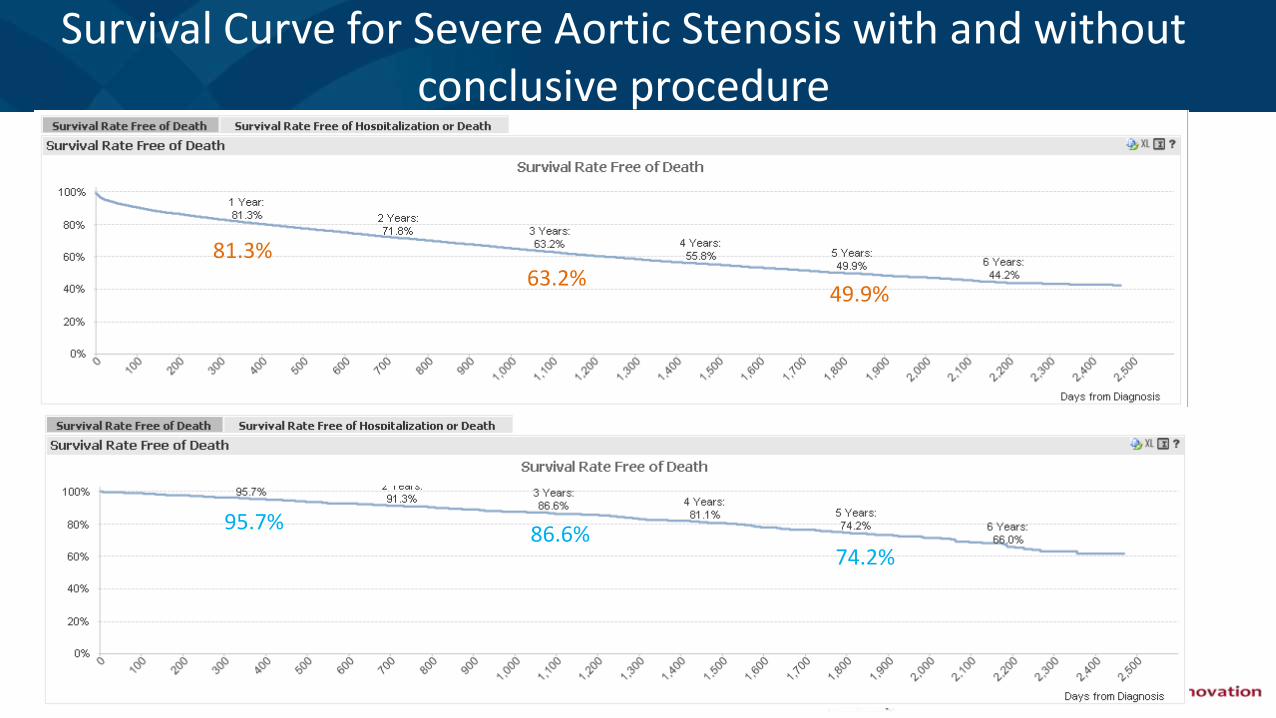
Survival Curve for Severe Aortic Stenosis with and without conclusive procedure
34
95.7%
74.2%86.6%
63.2%81.3%
49.9%

35
What’s the Cost of Waiting?

36
Real-time Example:
90 year old patient wanted to know what her risk of stroke was for transcather aortic valve replacement
Measure Name Numerator Denominator %
% with In-hospital Mortality 2 60 3.3%
% with Stroke 1 60 1.7%
% with Vascular Access Site Complication 1 60 1.7%

Examples: CV Dashboards• PCI:
– Use of closure devices in high risk patients.
• Structural Heart Disease:
– Population management of severe symptomatic aortic stenosis.
• Up to date on guideline recommended echo surveillance.
• Role of primary care physician (PCP), cardiologist, valve specialist.
• Survival curves with and without definitive procedure.
• Cost implications.
• CV Surgery:
– Real-time physician scorecard.
– Bundled payments.

38

39

40

41

Key Points
• Healthcare market forces are driving an increased need for complex data analytics to improve value.
• Allina Health, in collaboration with Health Catalyst, has developed an Enterprise Data Warehouse (EDW) that provides nation leading data analytic capabilities.
• A relentless focus on improving quality drives lower costs.
• Success requires 3 components:
Physician Leadership
Strong care team collaboration (MDs, RNs, Administrators)
An EDW with access to accurate data analytic resources
42

Lessons Learned
43
• Strong, committed leadership is essential for success.
• A focus on innovation is required to navigate present and future challenges.
• Collaborative teamwork is essential in order to realize the Triple Aim
• Robust analytics is a powerful tool to achieve the best quality and cost outcomes.

Thank You
44