leveraging quandl
TRANSCRIPT

Presenters: Tammer Kamel (CEO)
Brian Risk (head of marketing)

Data is everywhere…
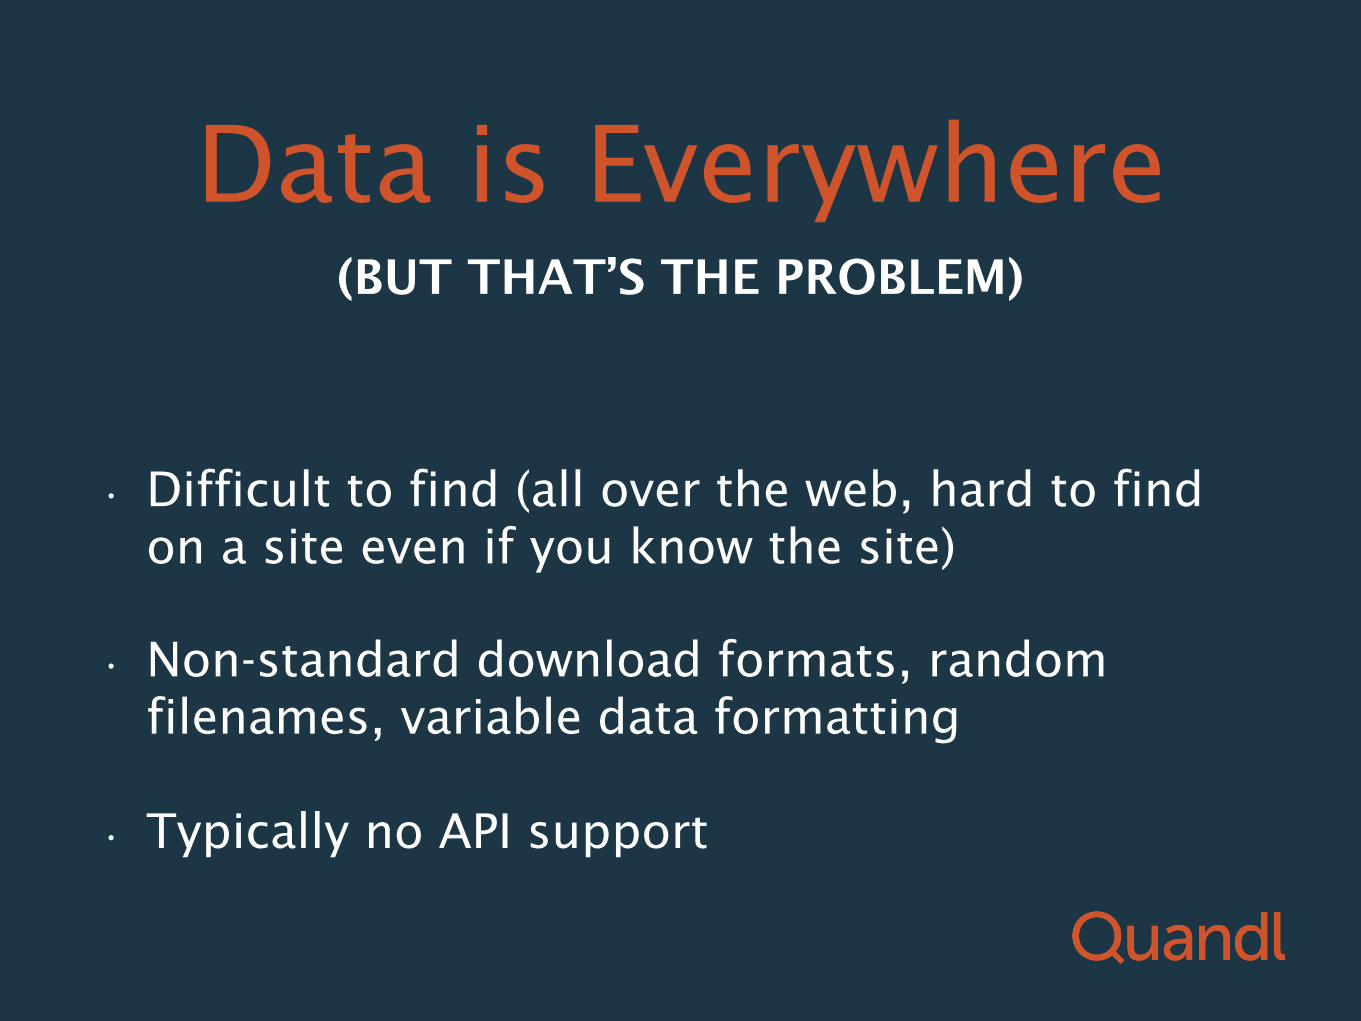
Data is Everywhere
• Difficult to find (all over the web, hard to find on a site even if you know the site)
• Non-standard download formats, random filenames, variable data formatting
• Typically no API support
(BUT THAT’S THE PROBLEM)

One Access Point
12 Million Data Sets
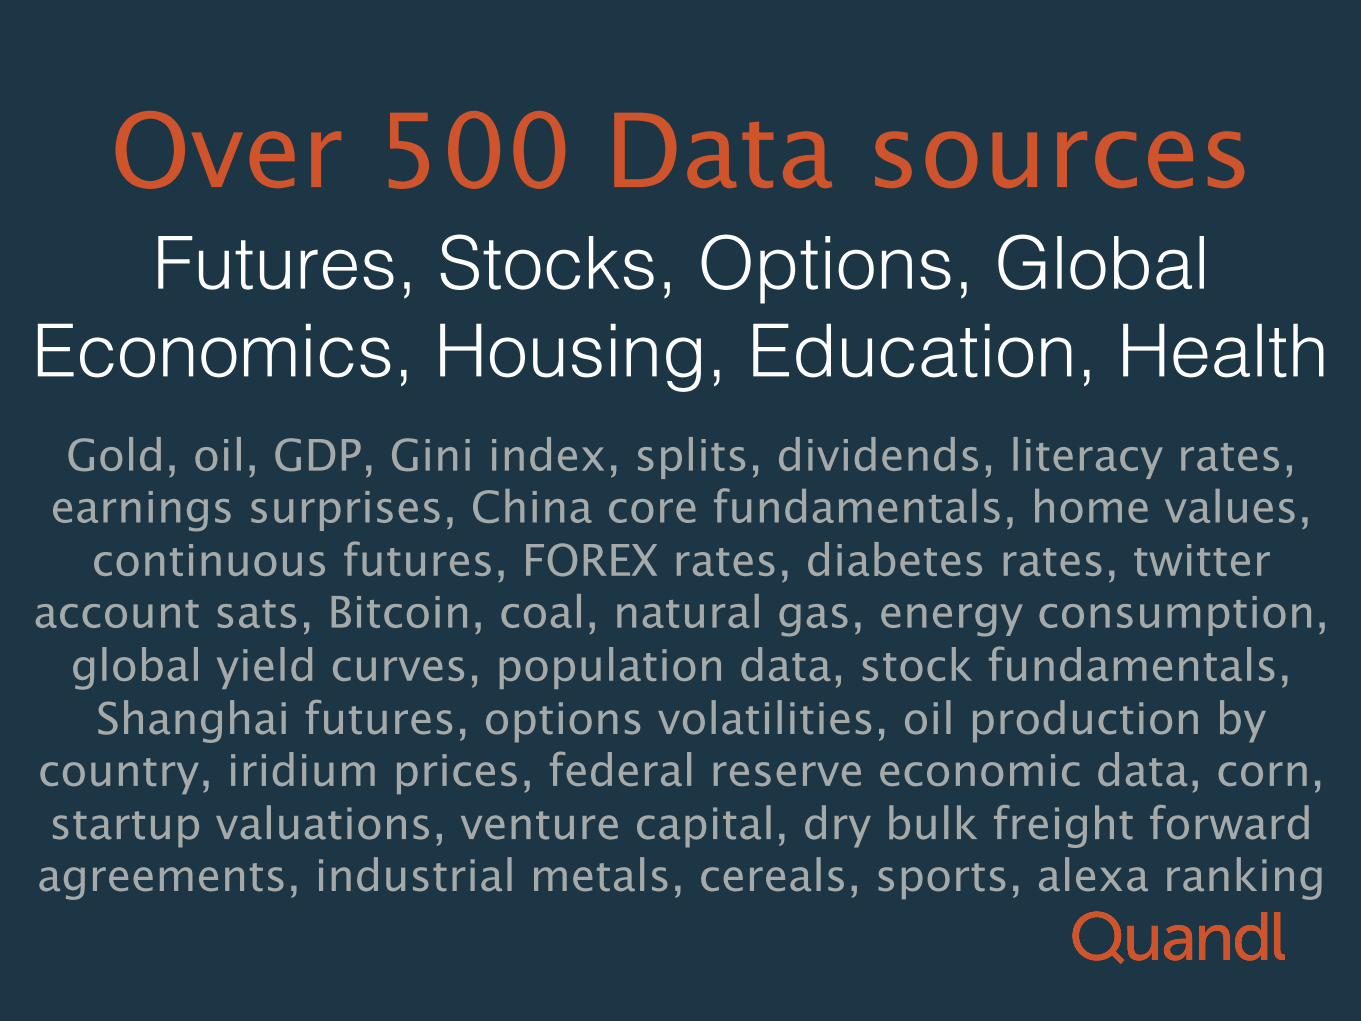
Over 500 Data sources
Gold, oil, GDP, Gini index, splits, dividends, literacy rates, earnings surprises, China core fundamentals, home values,
continuous futures, FOREX rates, diabetes rates, twitter account sats, Bitcoin, coal, natural gas, energy consumption,
global yield curves, population data, stock fundamentals, Shanghai futures, options volatilities, oil production by
country, iridium prices, federal reserve economic data, corn, startup valuations, venture capital, dry bulk freight forward agreements, industrial metals, cereals, sports, alexa ranking
Futures, Stocks, Options, Global !Economics, Housing, Education, Health!
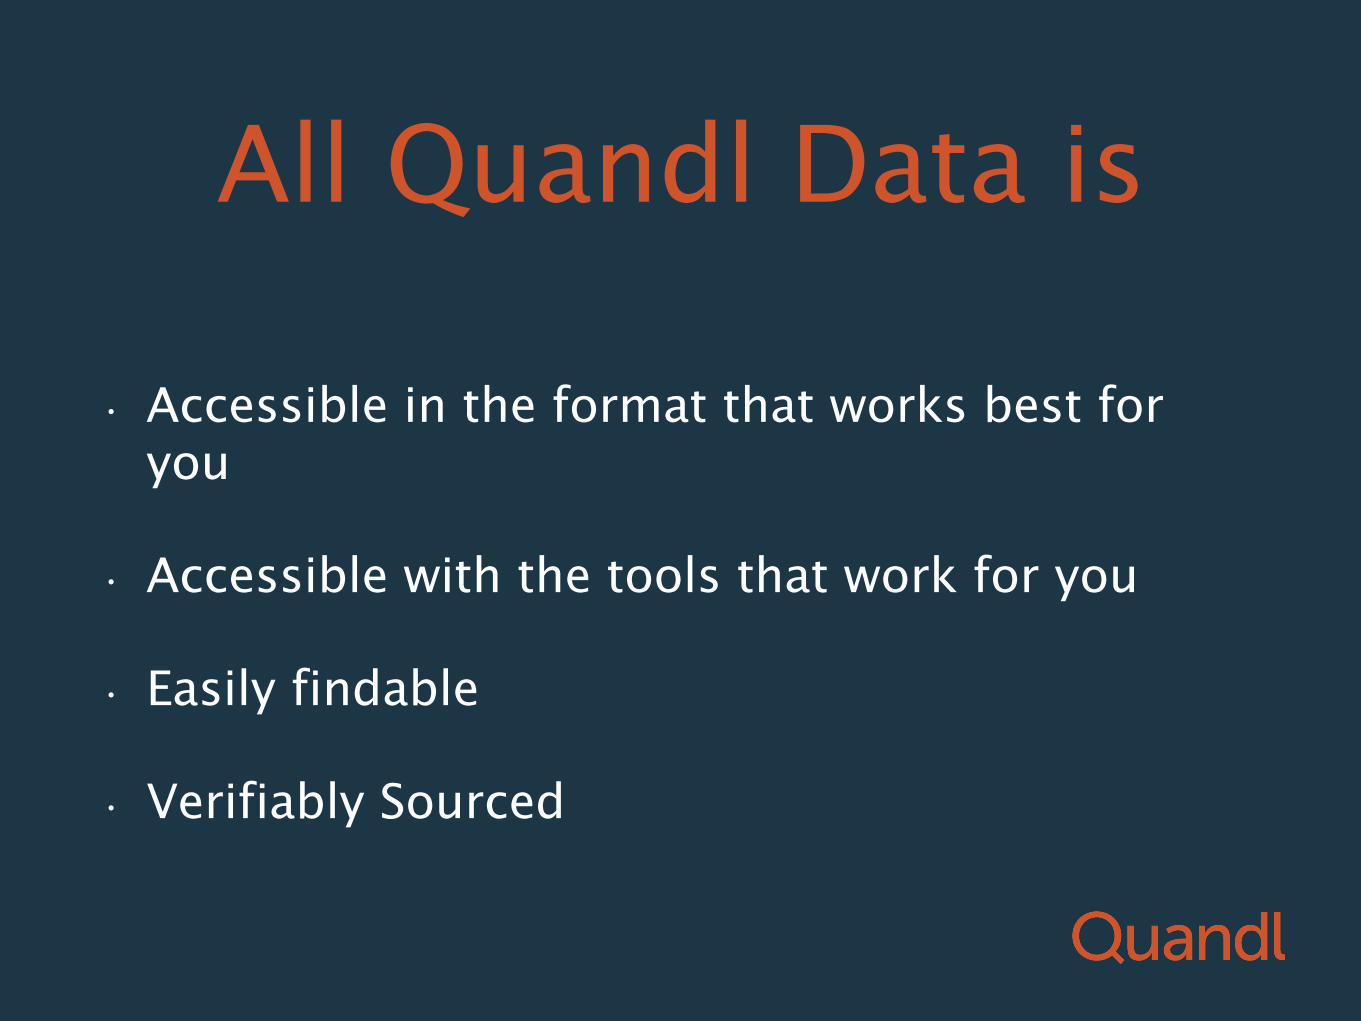
All Quandl Data is
• Accessible in the format that works best for you
• Accessible with the tools that work for you
• Easily findable
• Verifiably Sourced
Getting Data as easily as possible
API

A Host of Libraries
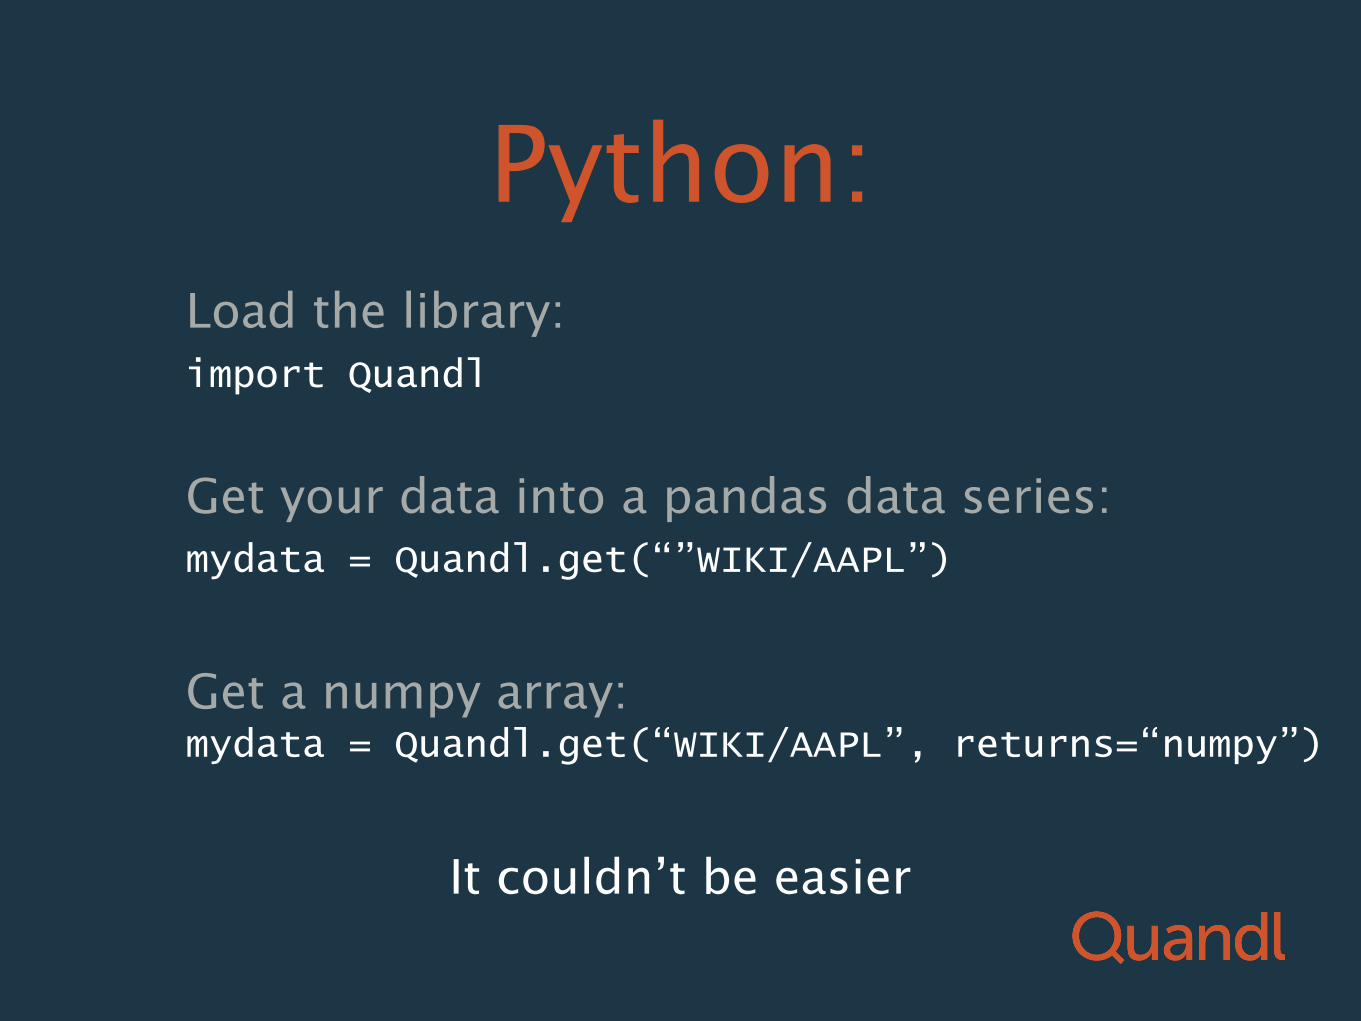
Python:
Get your data into a pandas data series:
Get a numpy array:
Load the library:
It couldn’t be easier
import Quandl
mydata = Quandl.get(“”WIKI/AAPL”)
mydata = Quandl.get(“WIKI/AAPL”, returns=“numpy”)
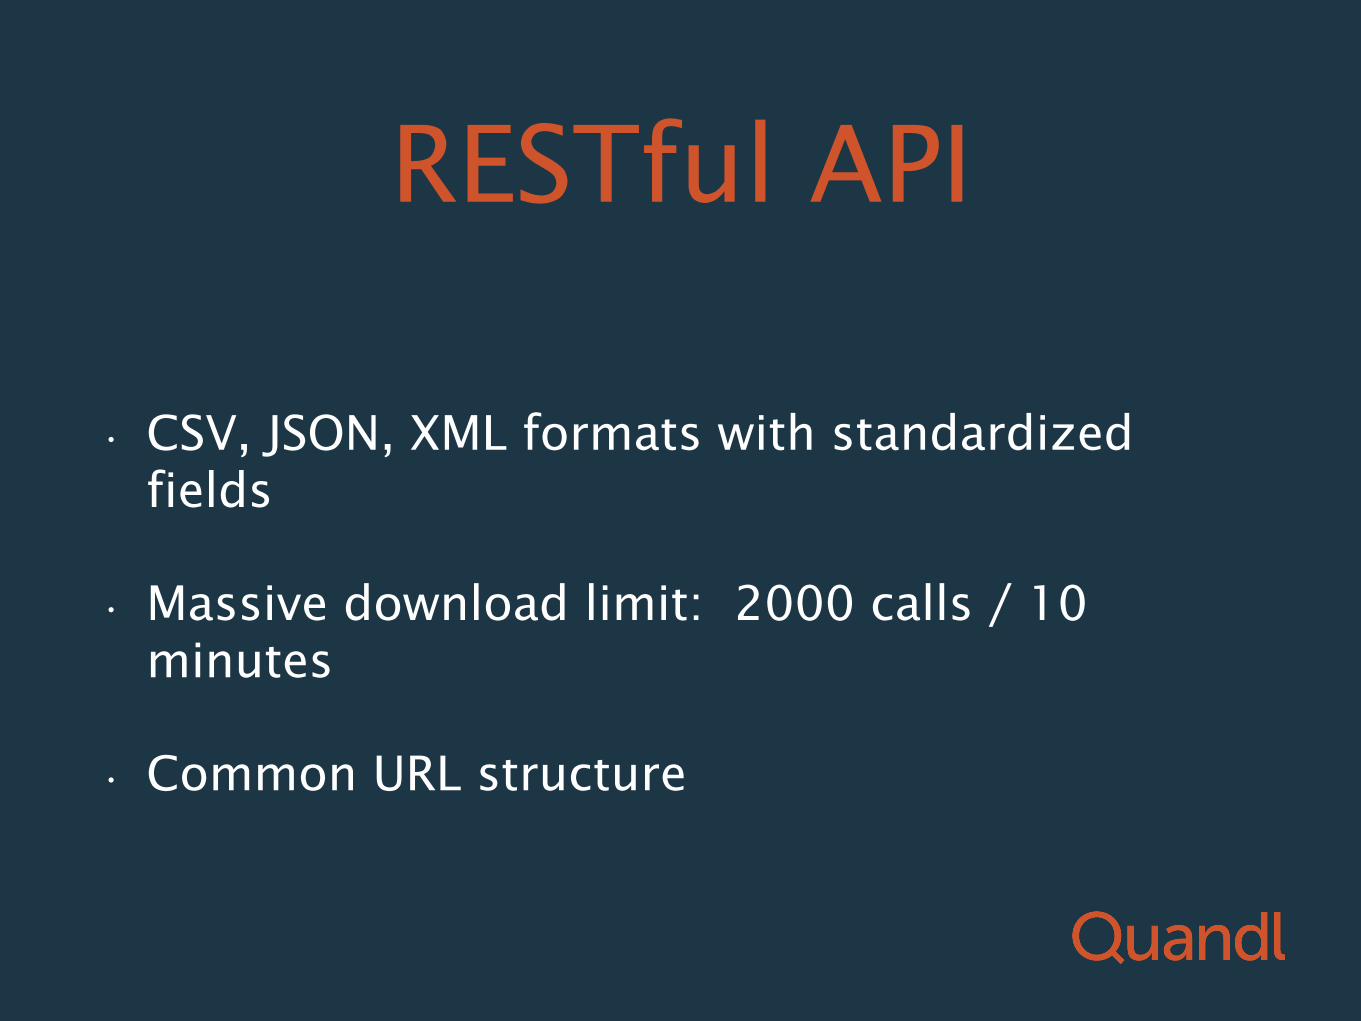
RESTful API
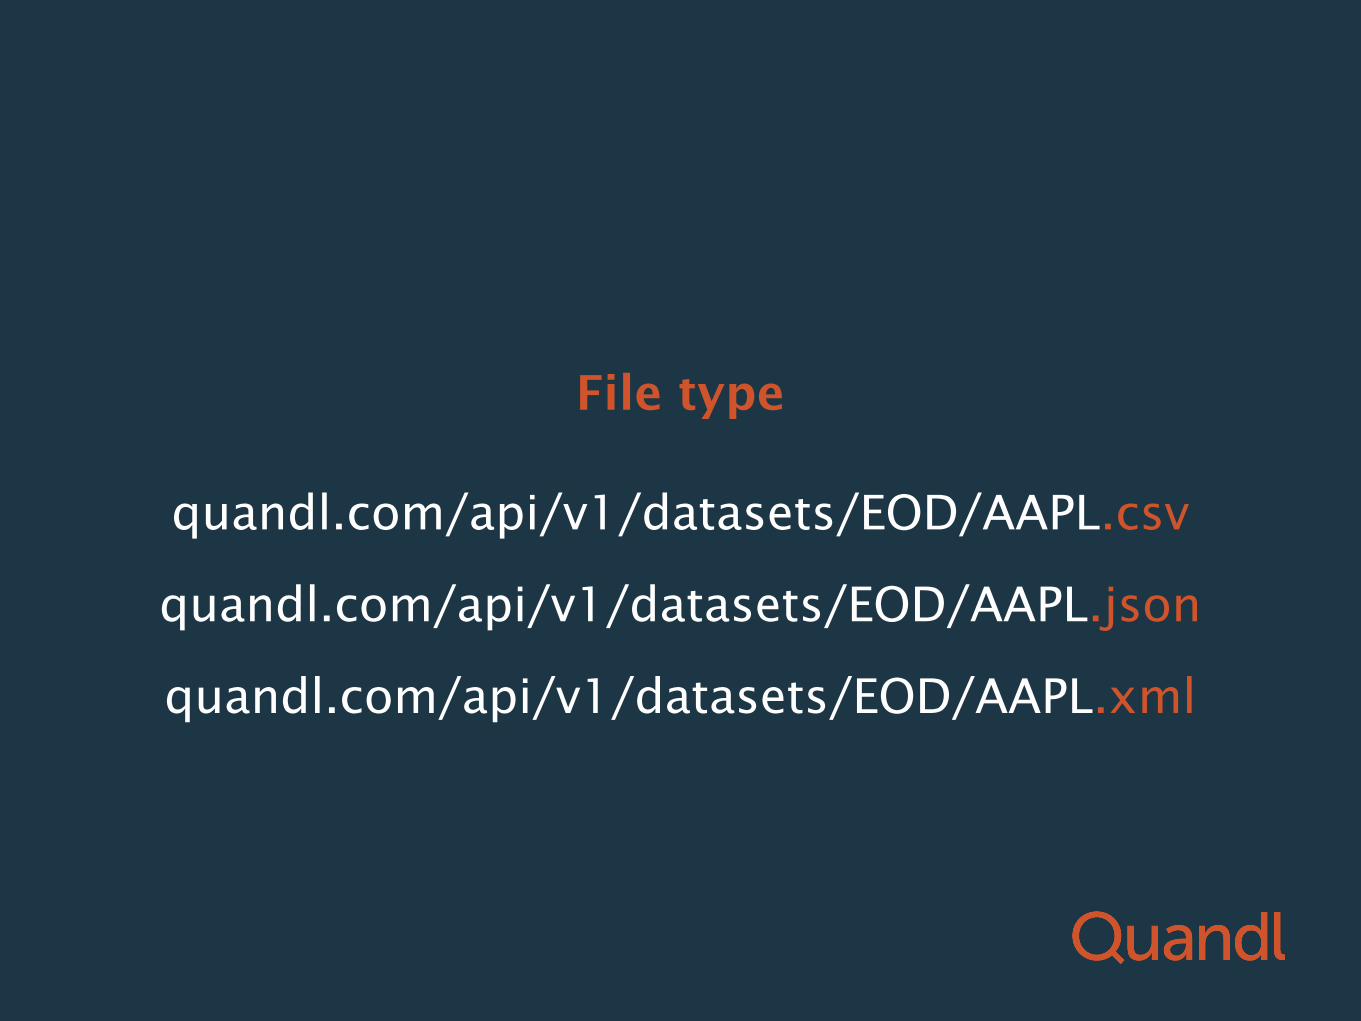
• CSV, JSON, XML formats with standardized fields
• Massive download limit: 2000 calls / 10 minutes
• Common URL structure
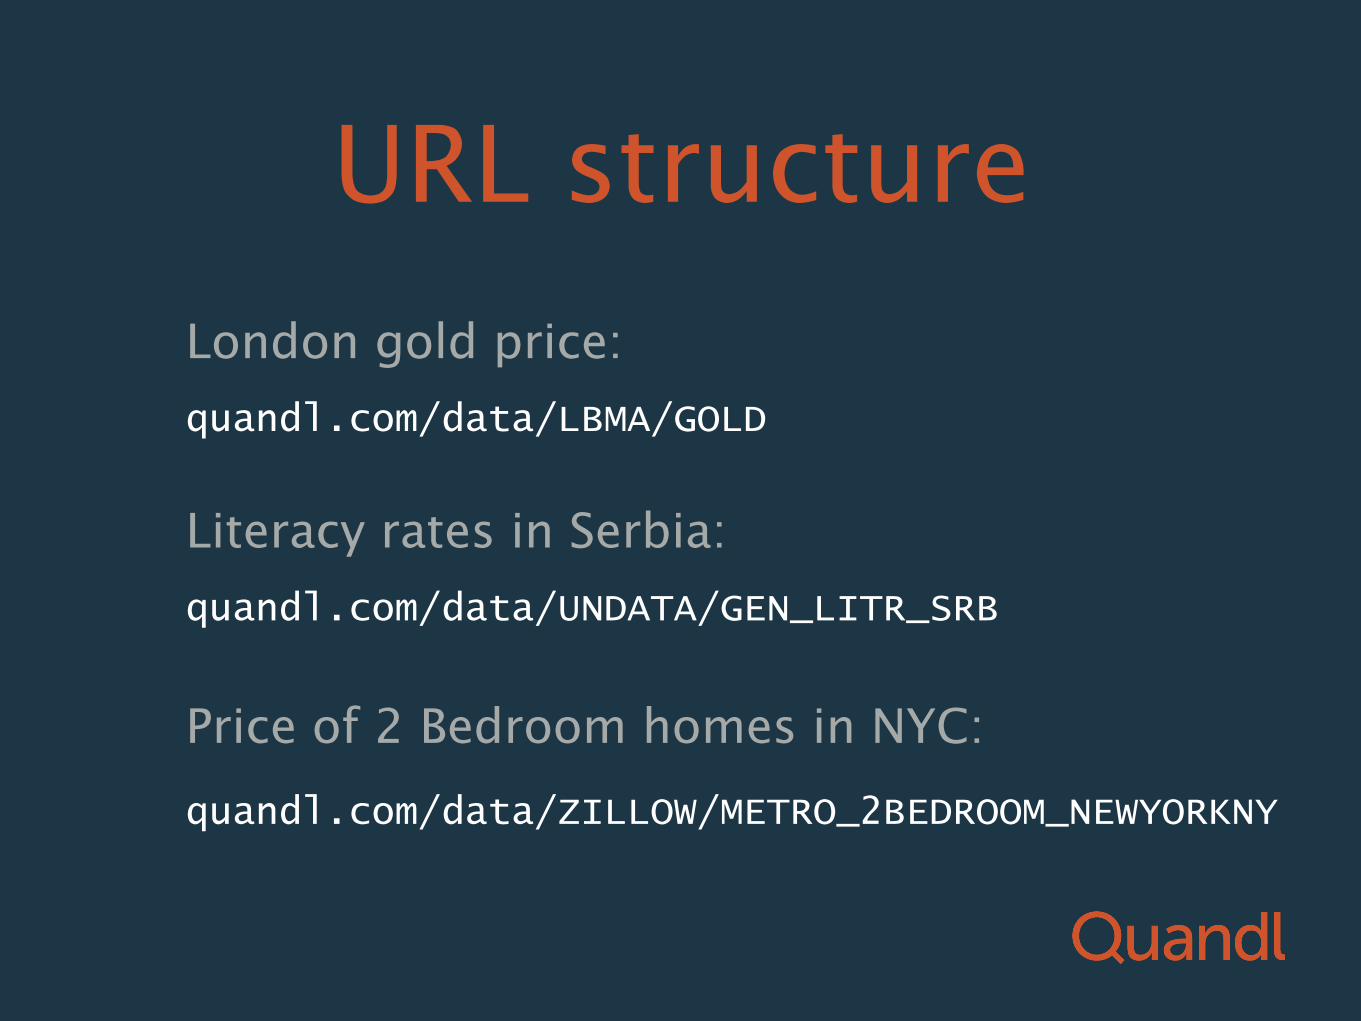
URL structure
quandl.com/data/UNDATA/GEN_LITR_SRB
Literacy rates in Serbia:
quandl.com/data/ZILLOW/METRO_2BEDROOM_NEWYORKNY
Price of 2 Bedroom homes in NYC:
quandl.com/data/LBMA/GOLD
London gold price:
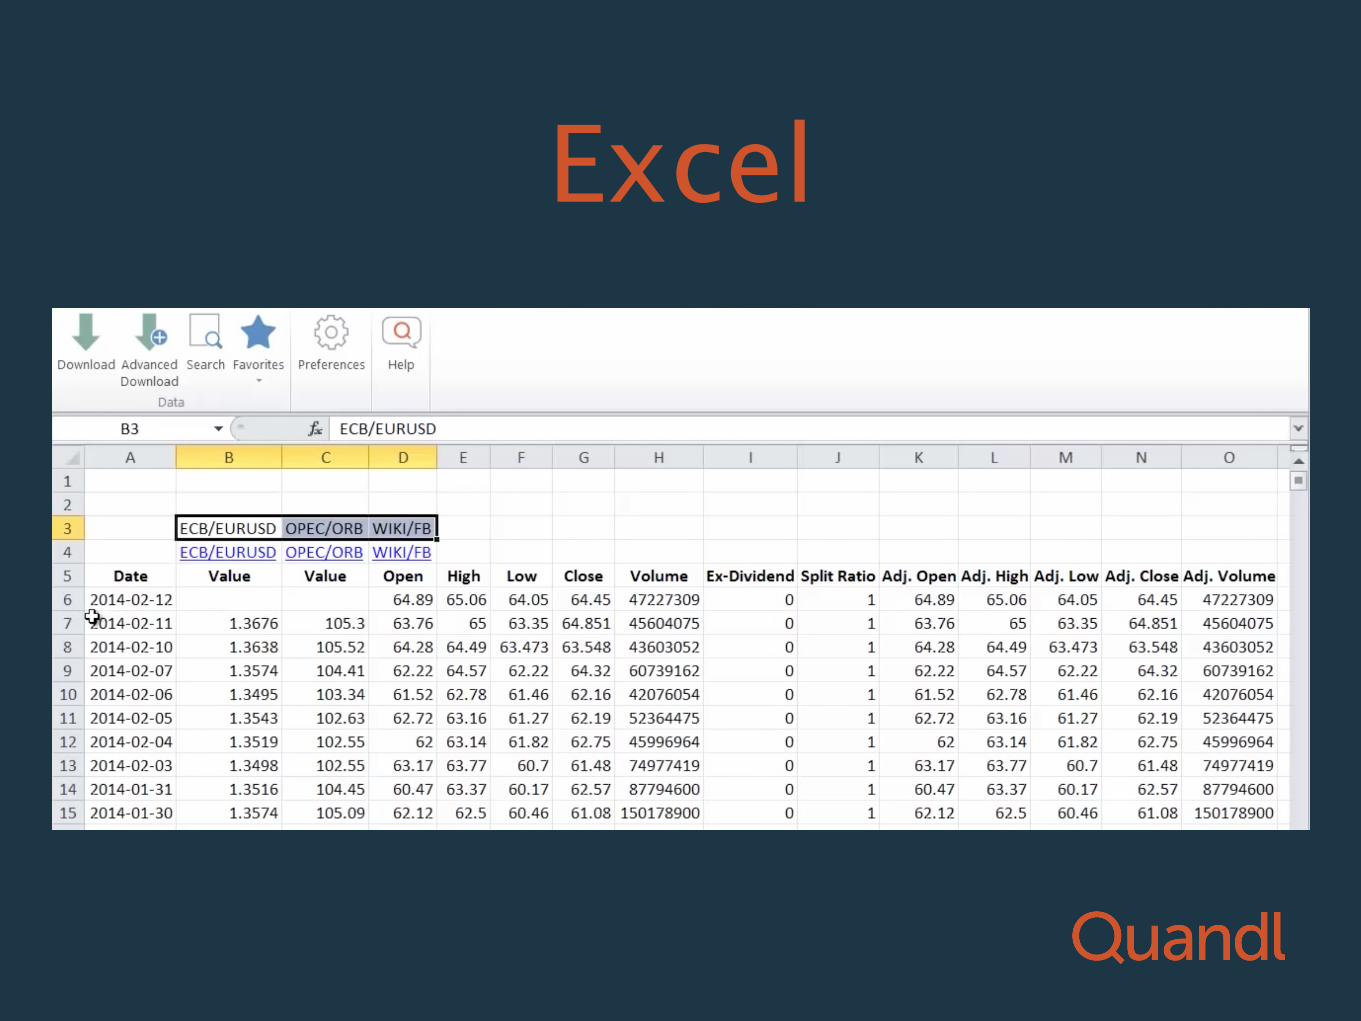
Excel
Bulk Downloads
• Full database all at once.
• Accessible via API or download link
• Available for all premium data sets

Premium Data
Premium Data
• 5 million professional grade financial data sets
• valuable, high-alpha data
• Free previews for logged in users
Zacks Financial Data
• Earnings: consensus estimates, surprises, street estimates, more
• Sales estimates and surprises
• 200 fundamental indicators for 6000 equities
• Analyst recommendations
• Ratings histories, Growth histories, more

Using Quandl
with Quantopian
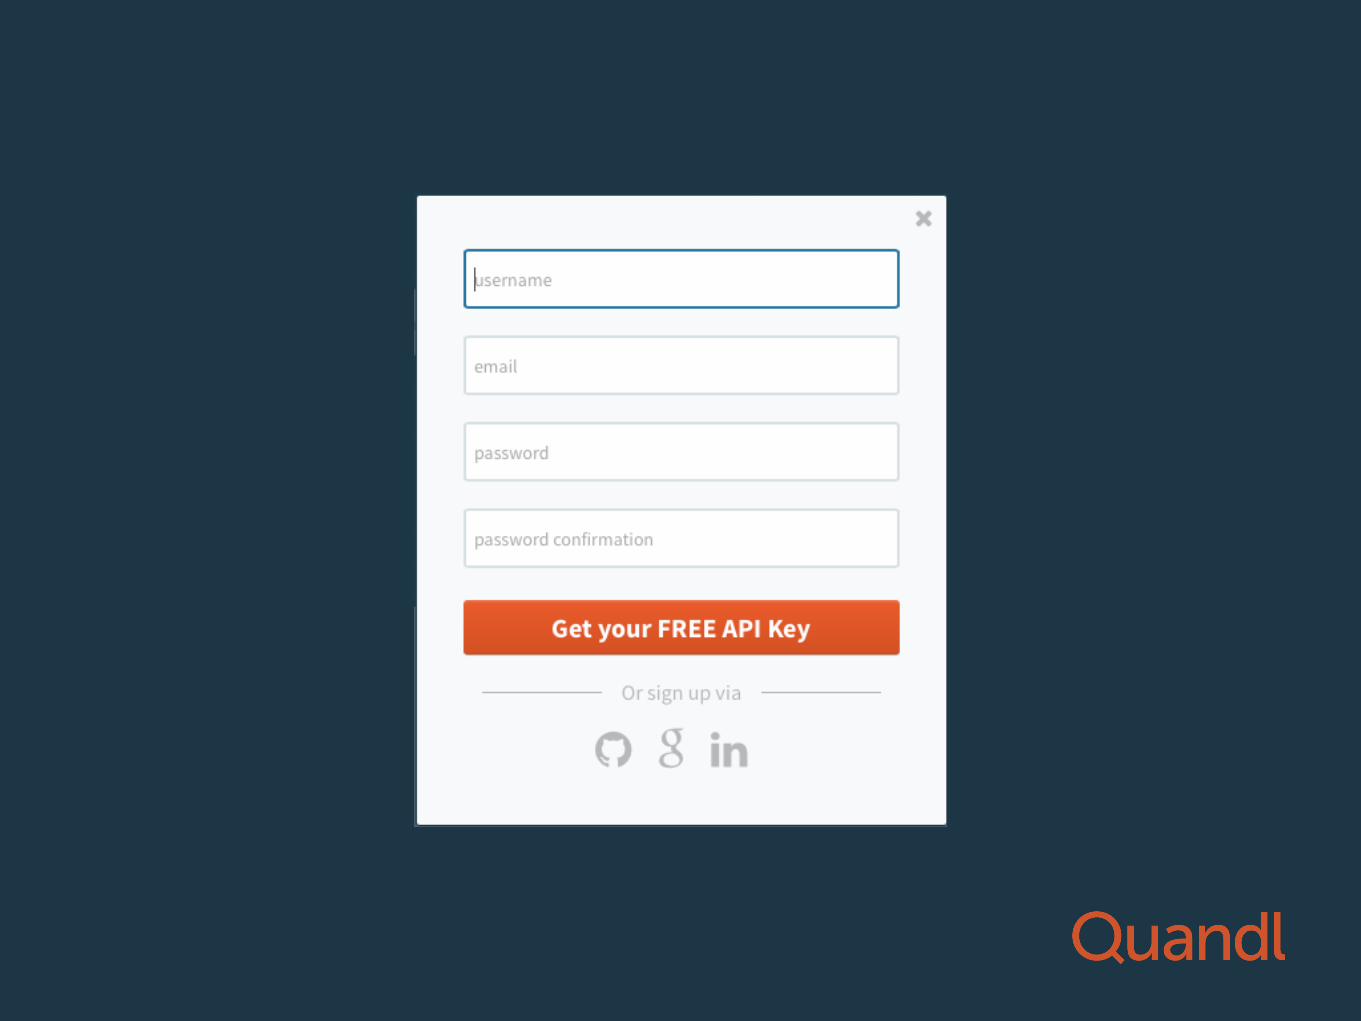
STEP #1 GET YOUR API KEY
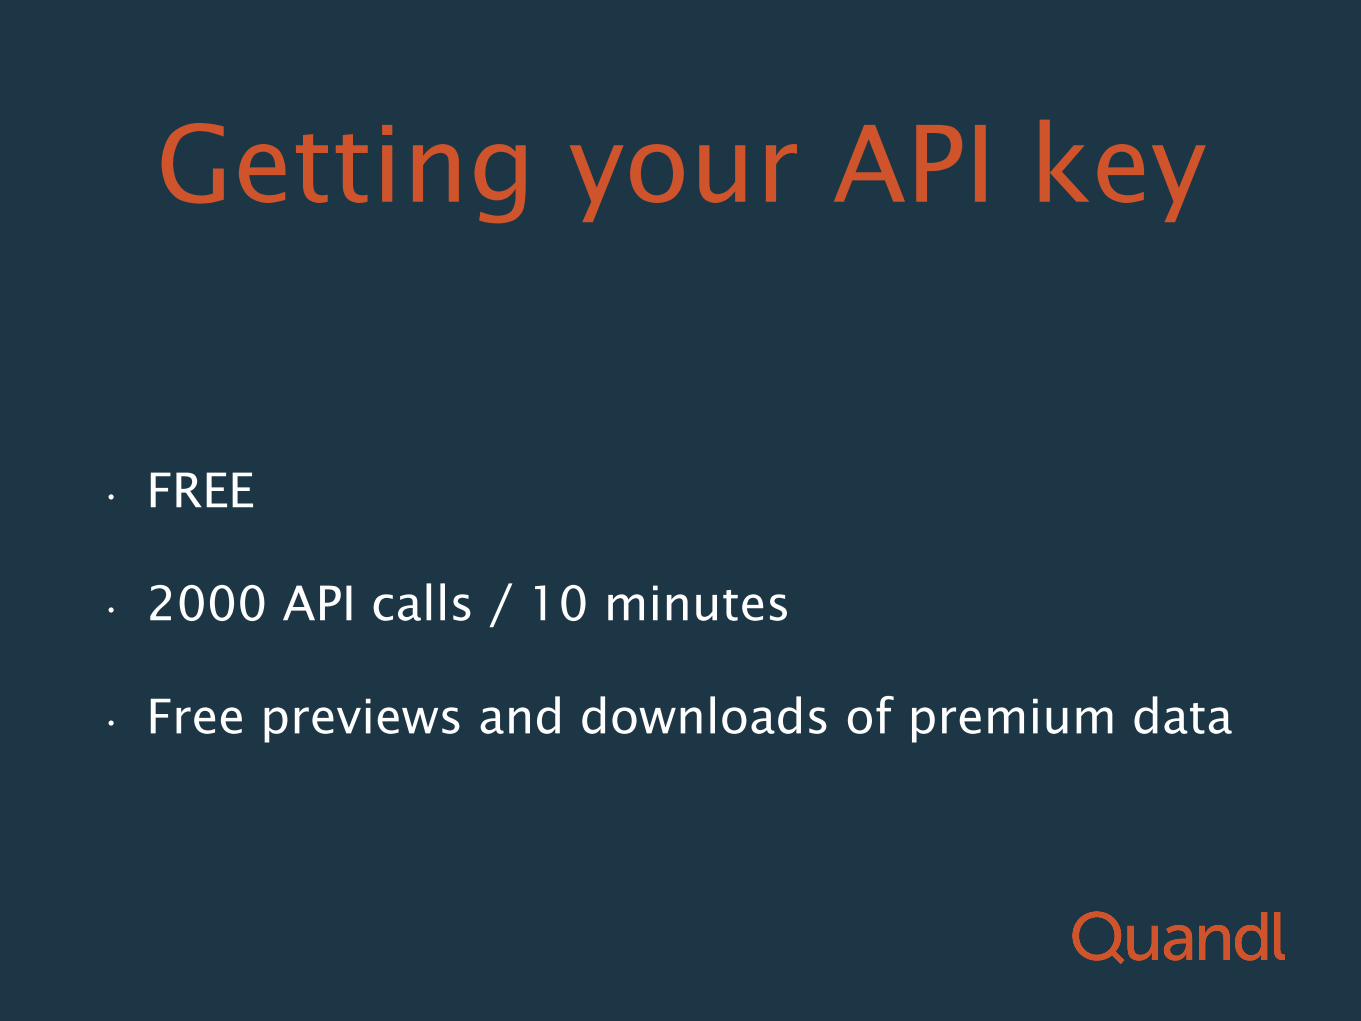
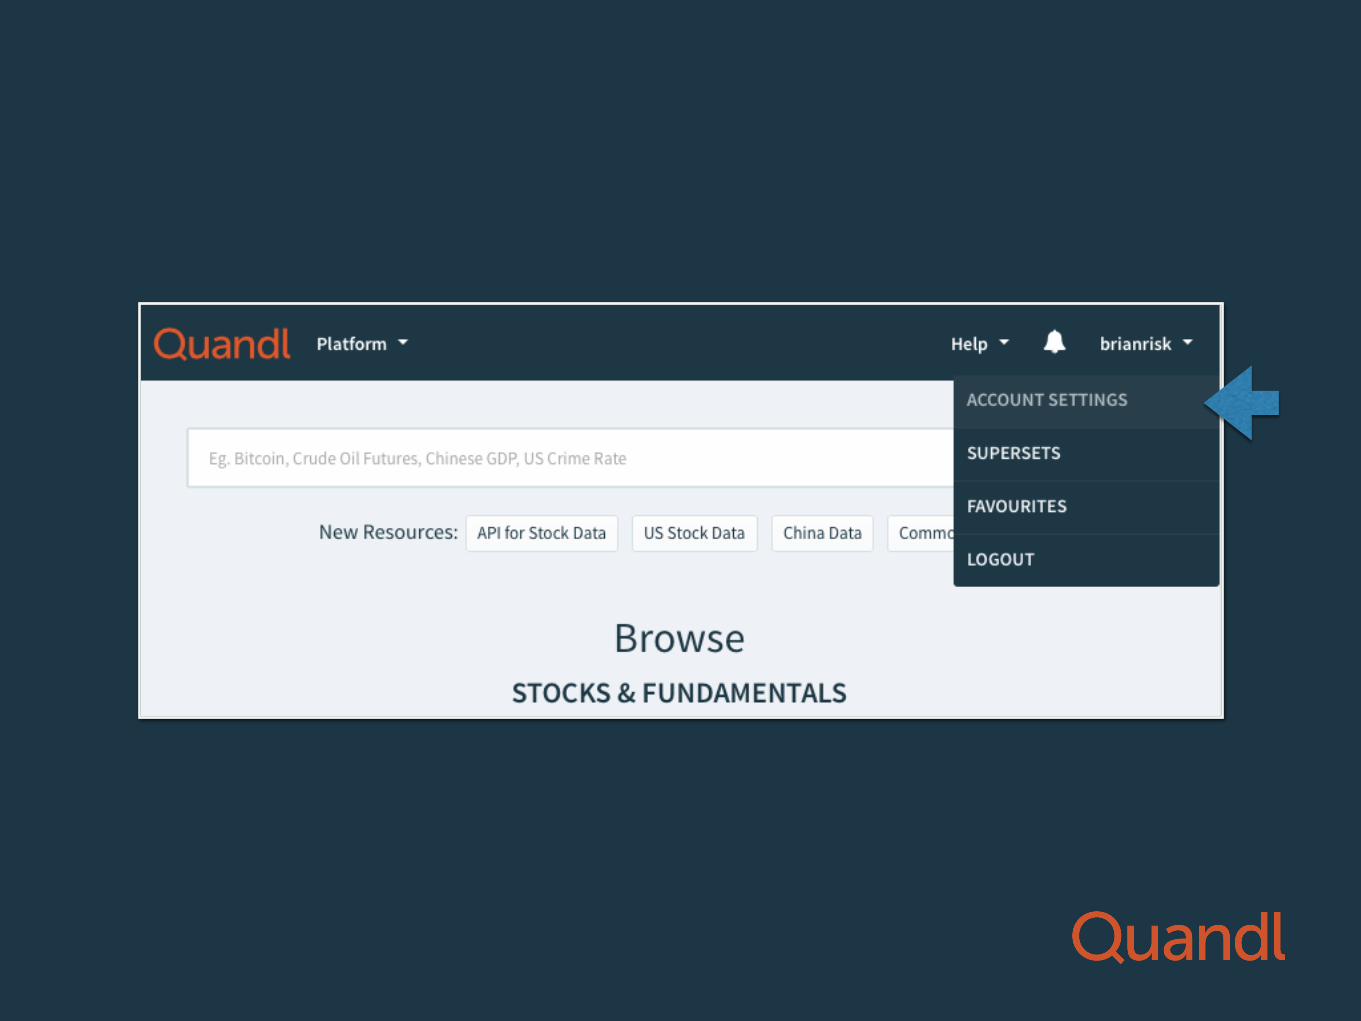
Getting your API key
• FREE
• 2000 API calls / 10 minutes
• Free previews and downloads of premium data
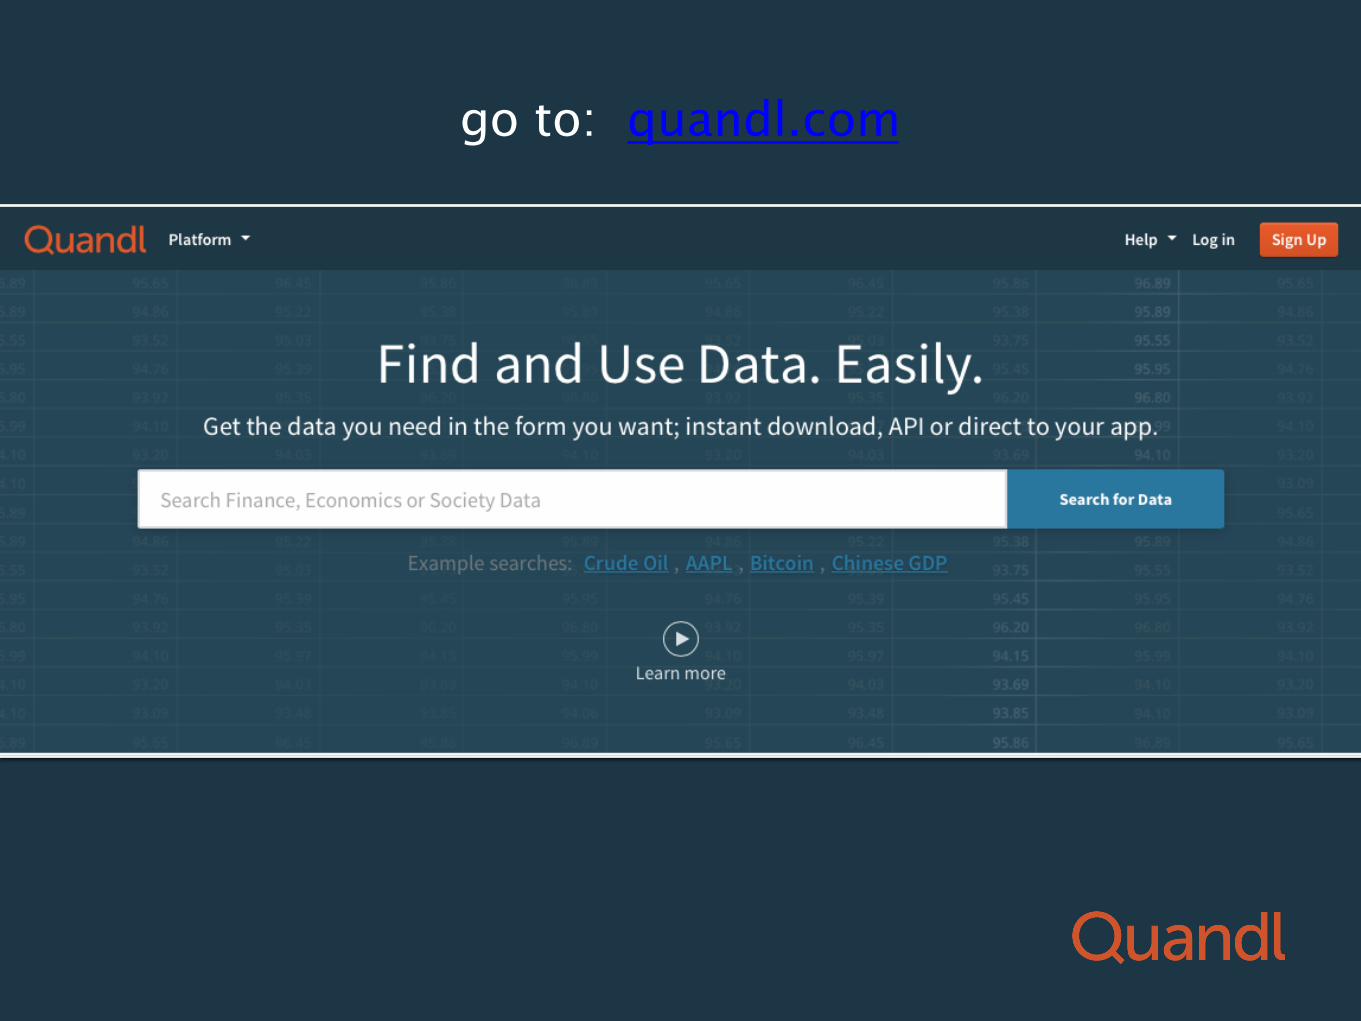
go to: quandl.com
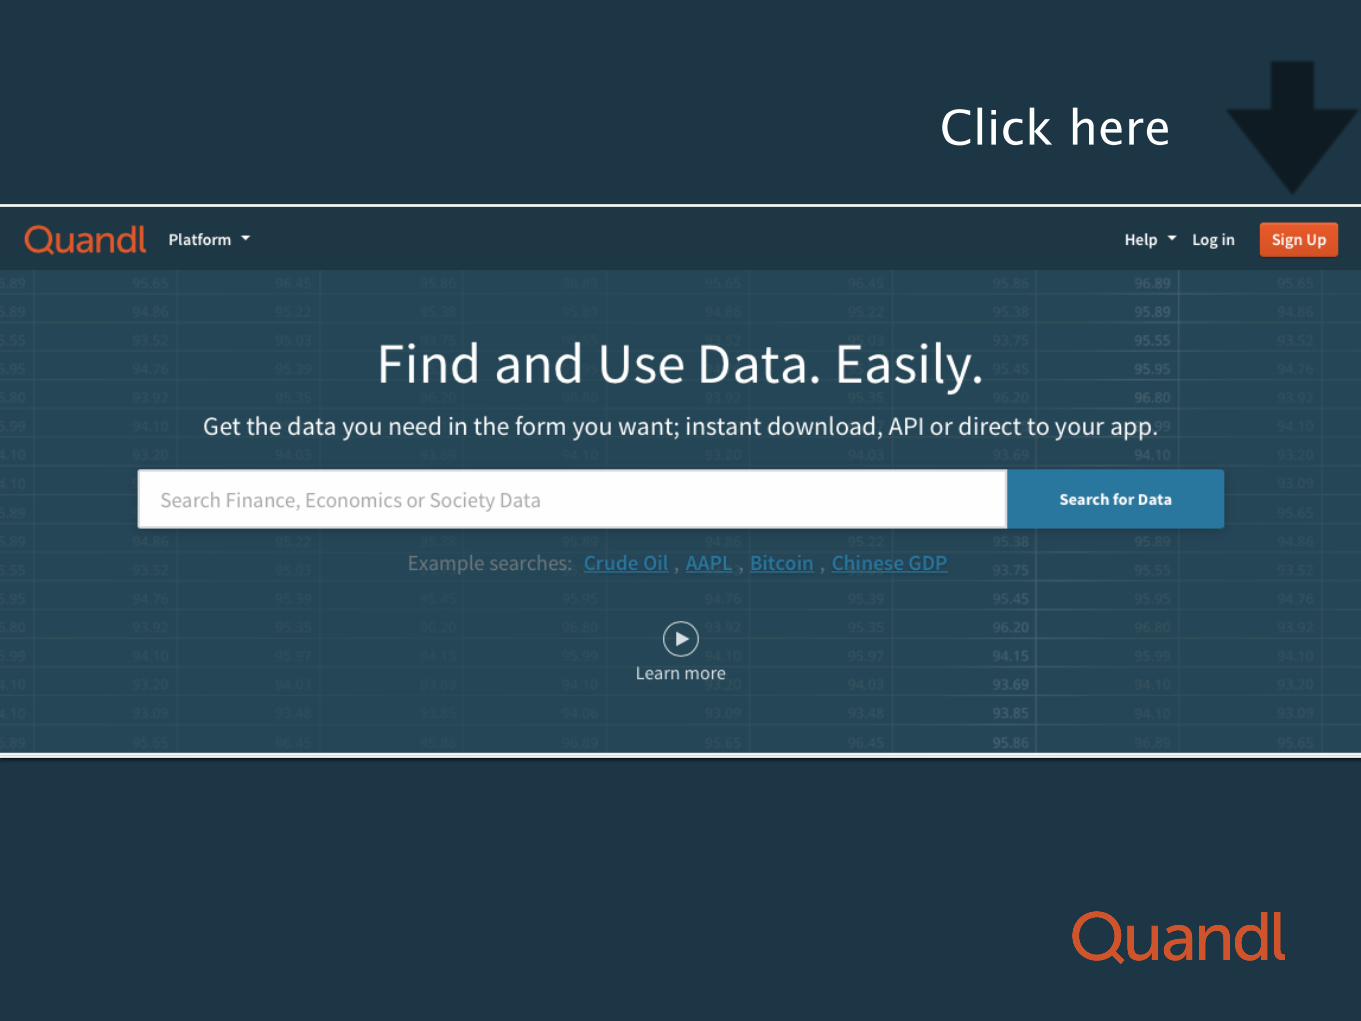
Click here


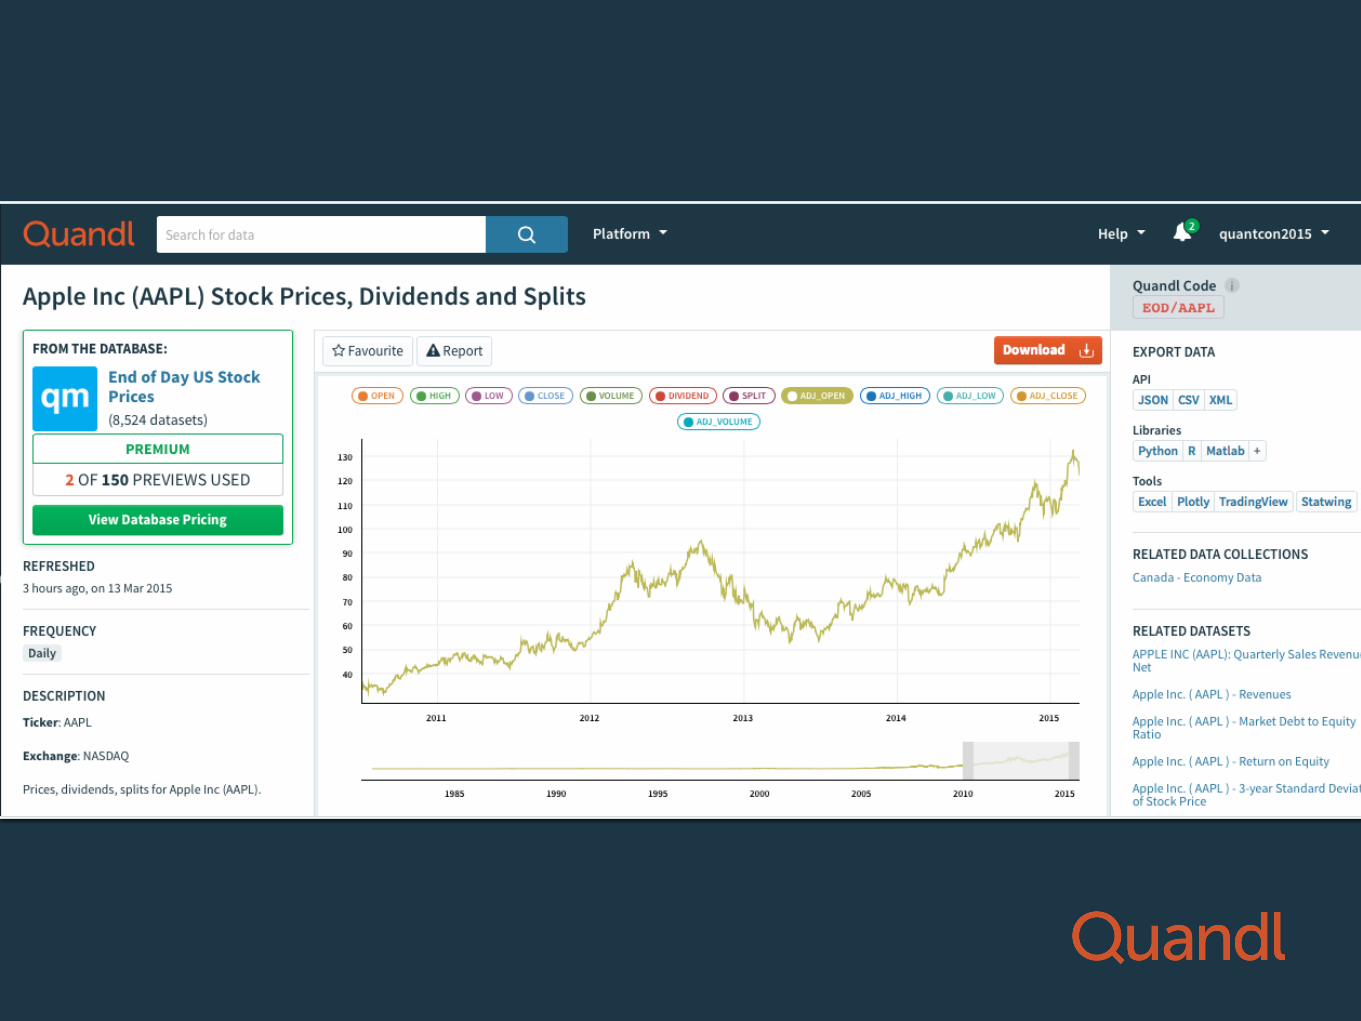
Getting the data

Downloading by URL
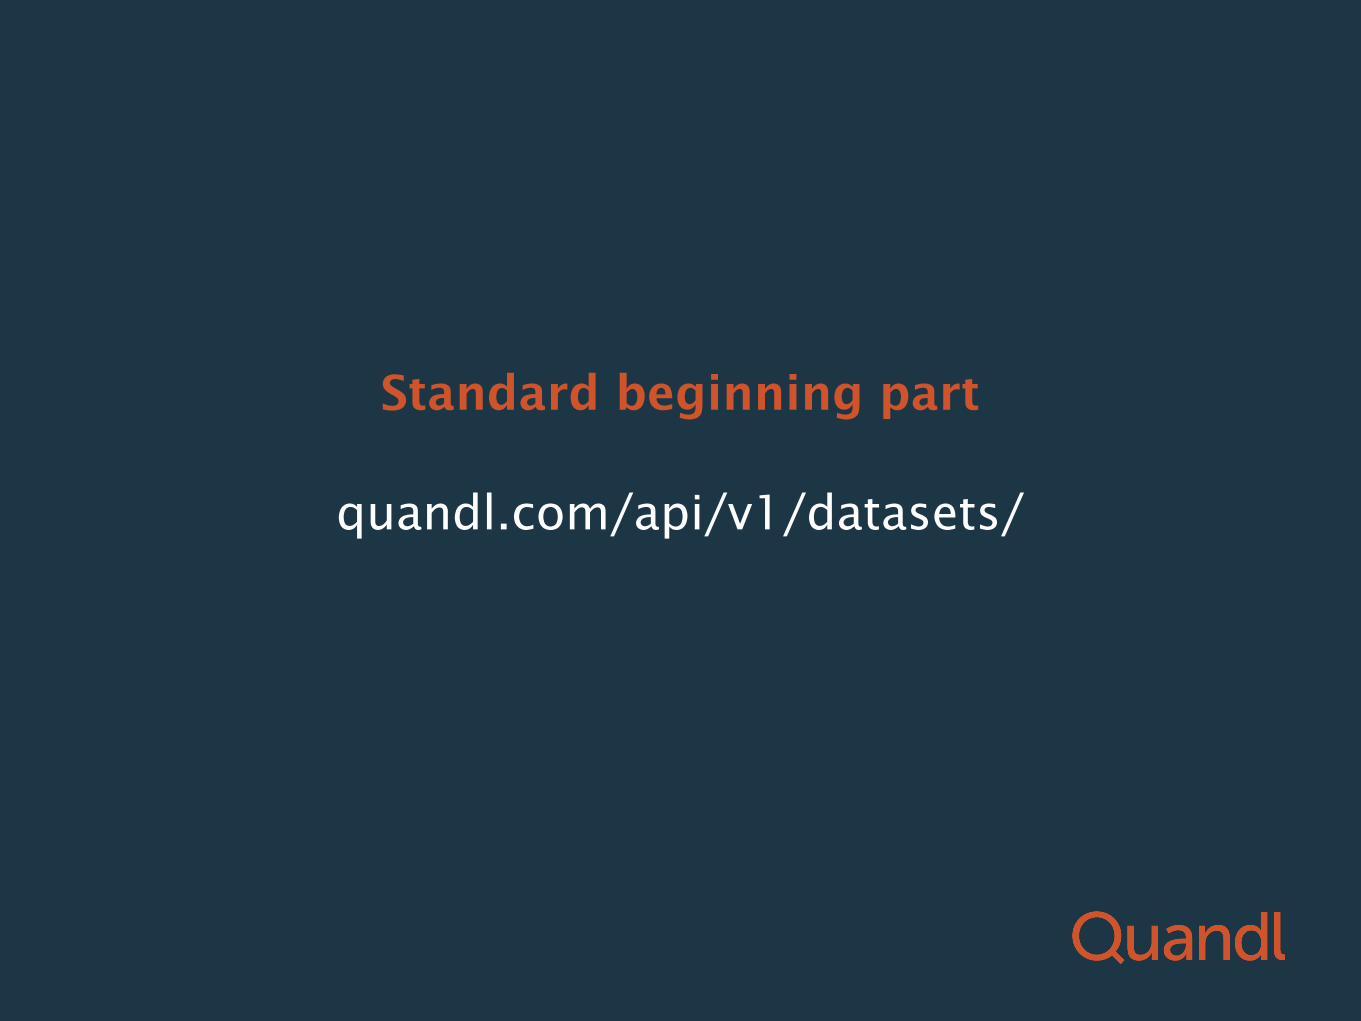
quandl.com/api/v1/datasets/
Standard beginning part
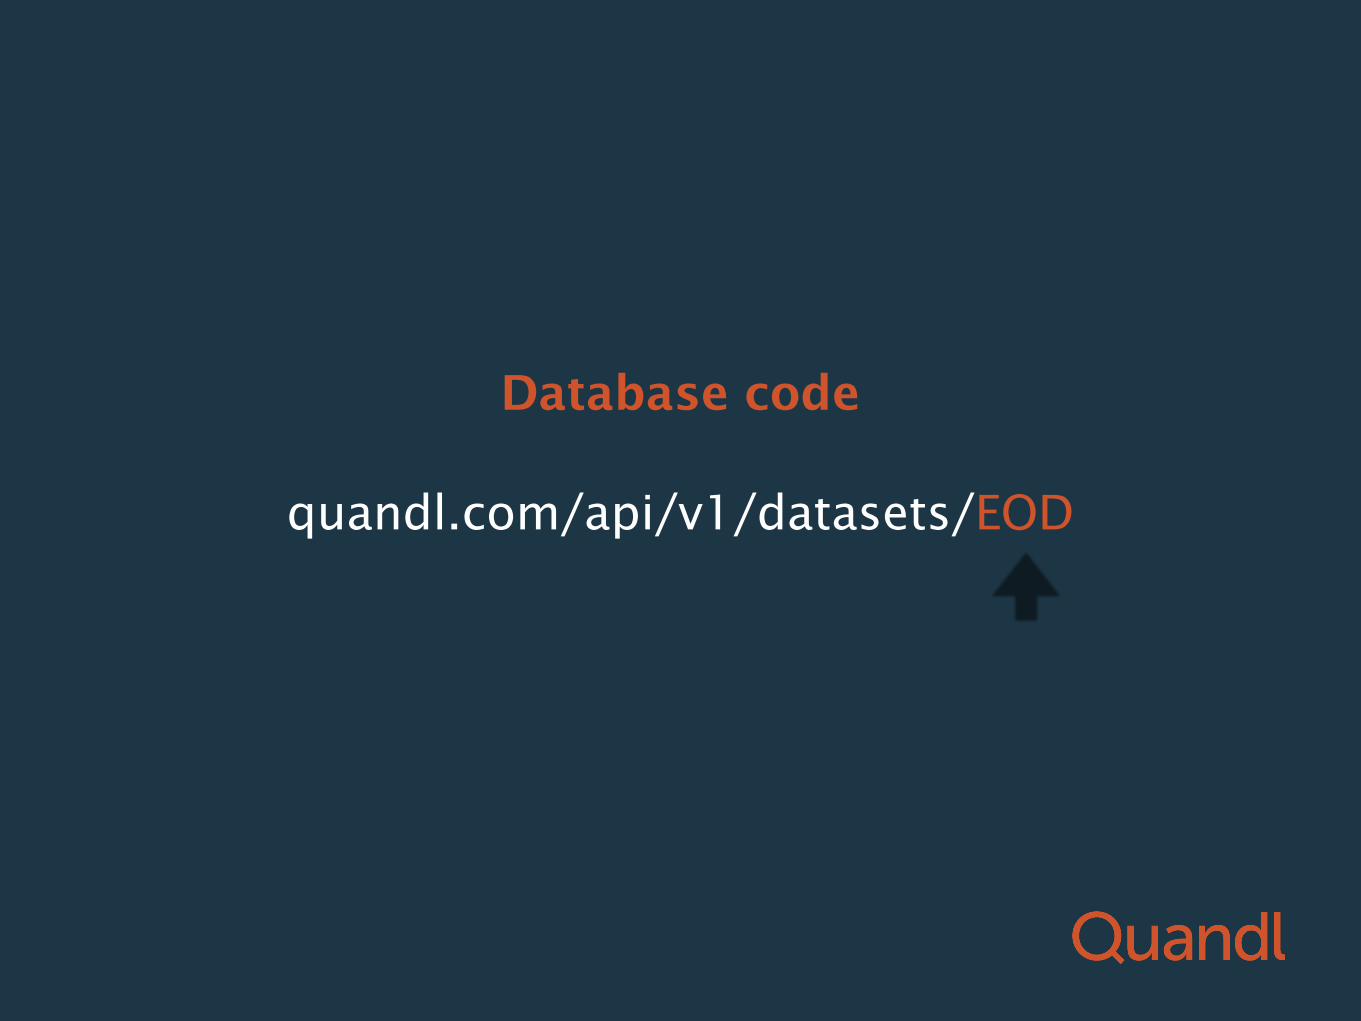
quandl.com/api/v1/datasets/EOD
Database code
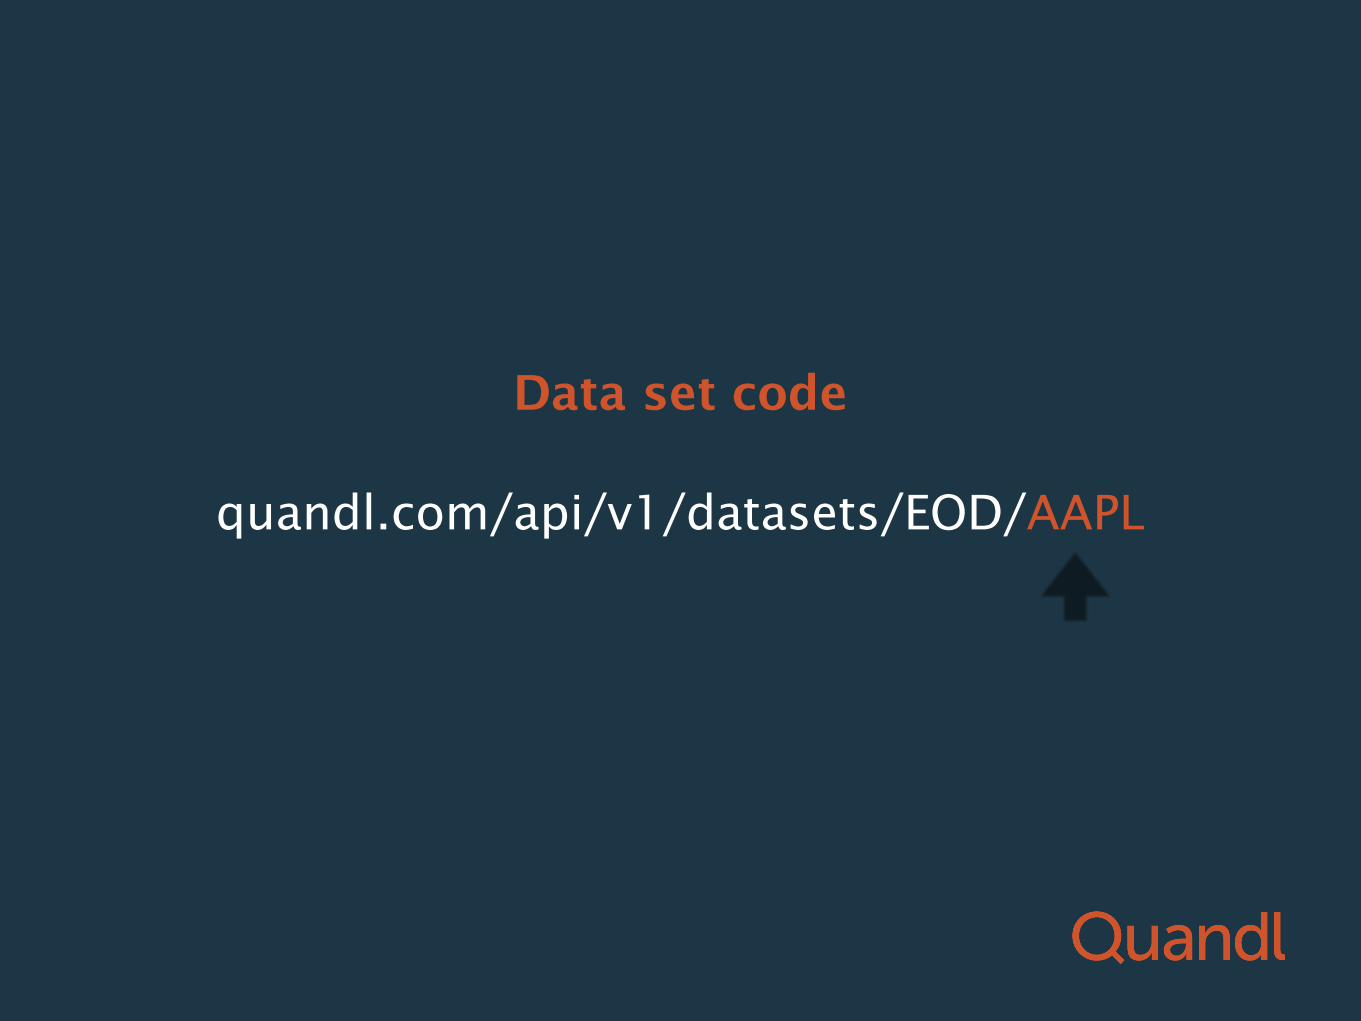
quandl.com/api/v1/datasets/EOD/AAPL
Data set code
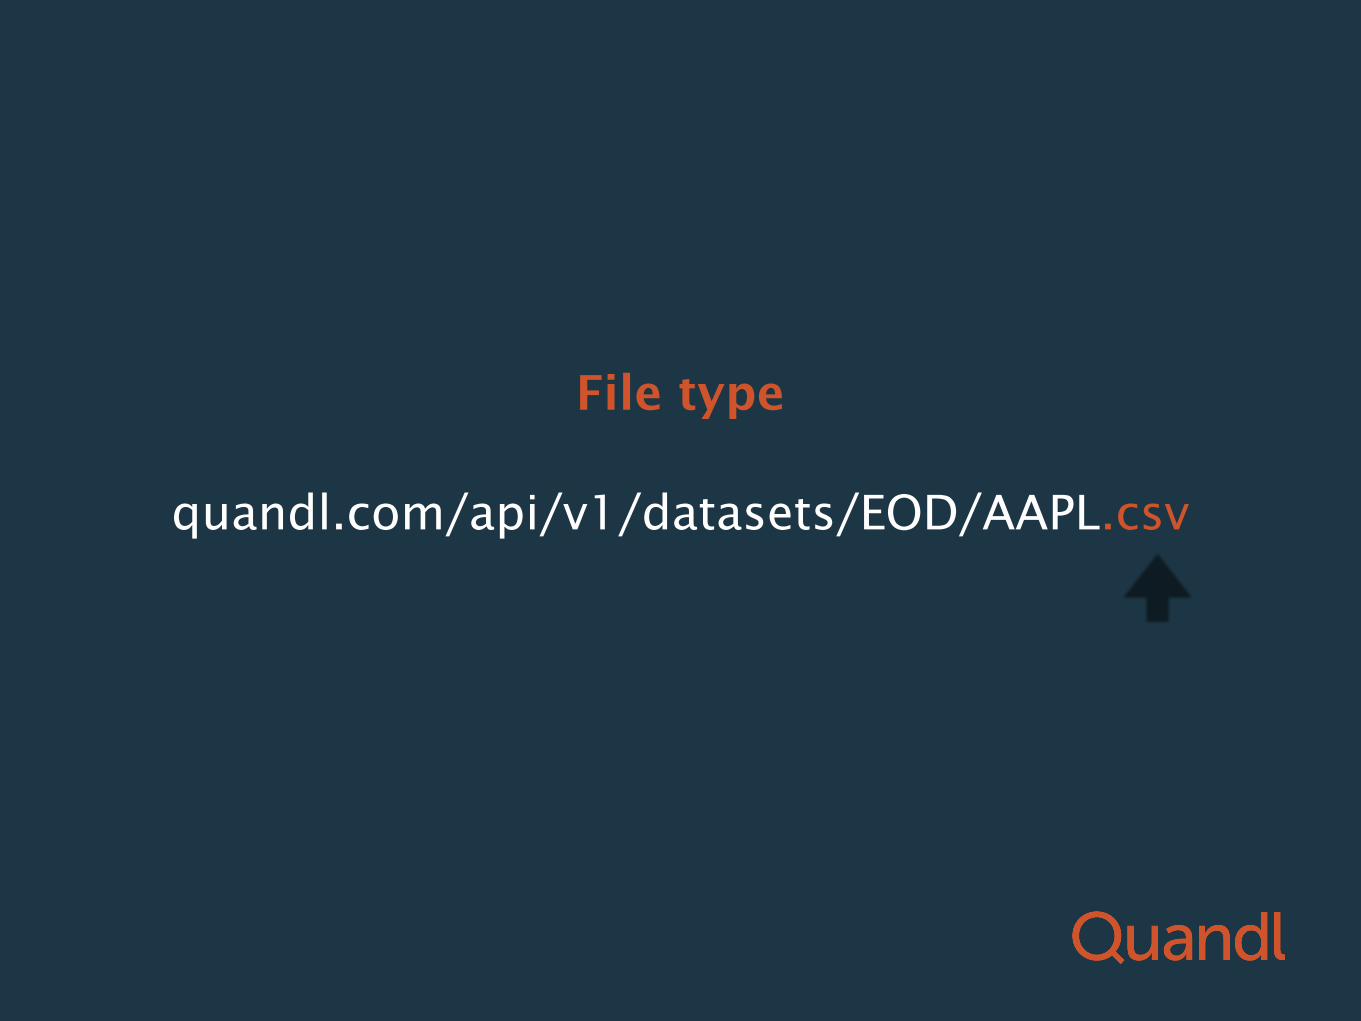
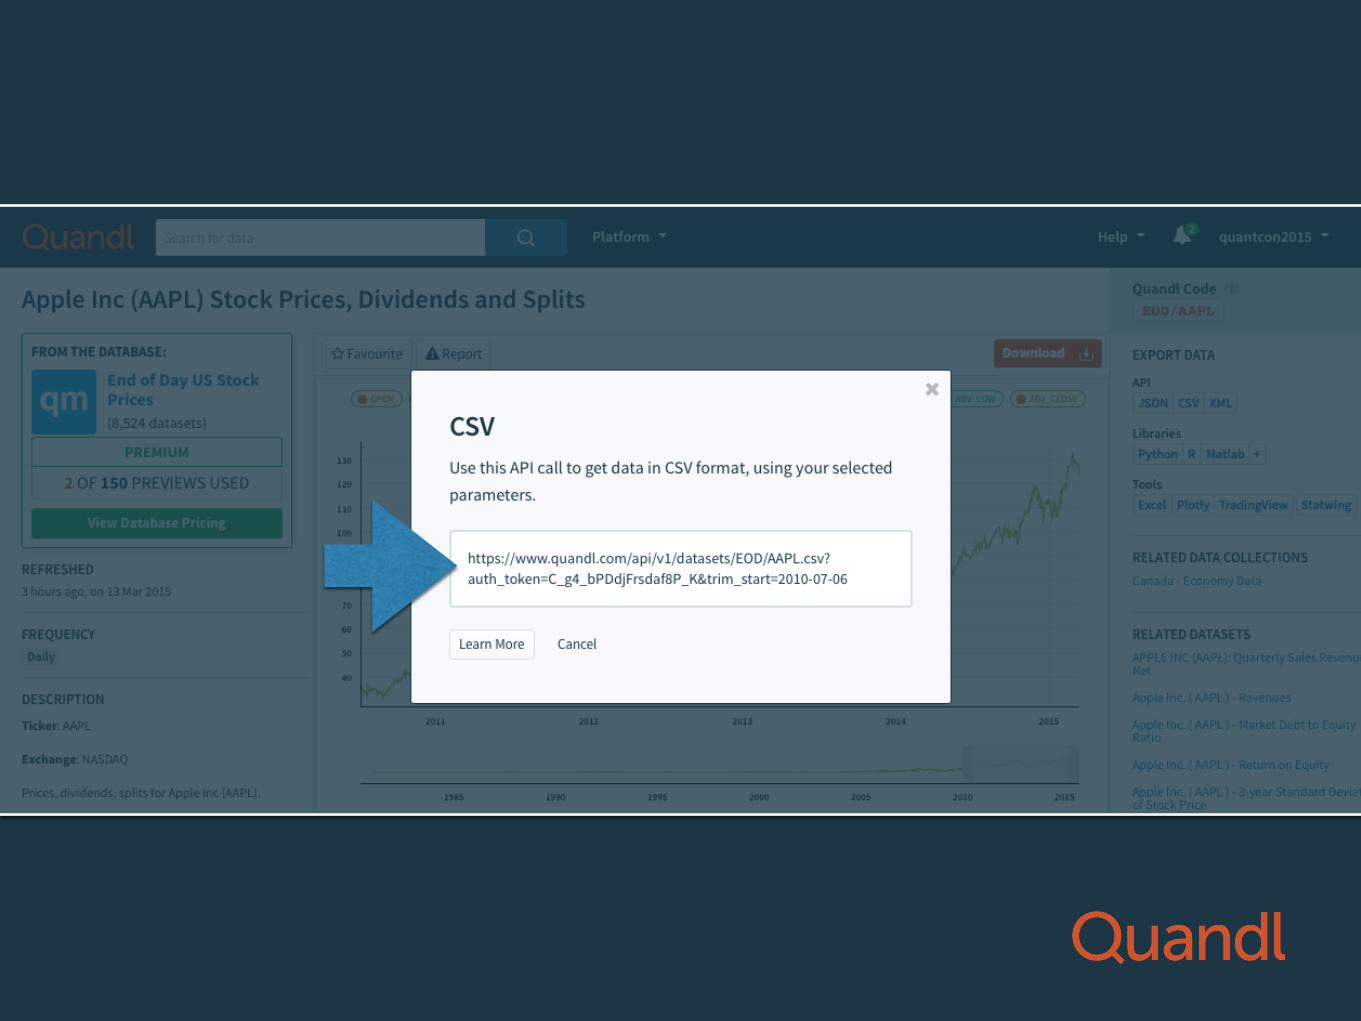
quandl.com/api/v1/datasets/EOD/AAPL.csv
File type
quandl.com/api/v1/datasets/EOD/AAPL.csv
File type
quandl.com/api/v1/datasets/EOD/AAPL.json
quandl.com/api/v1/datasets/EOD/AAPL.xml
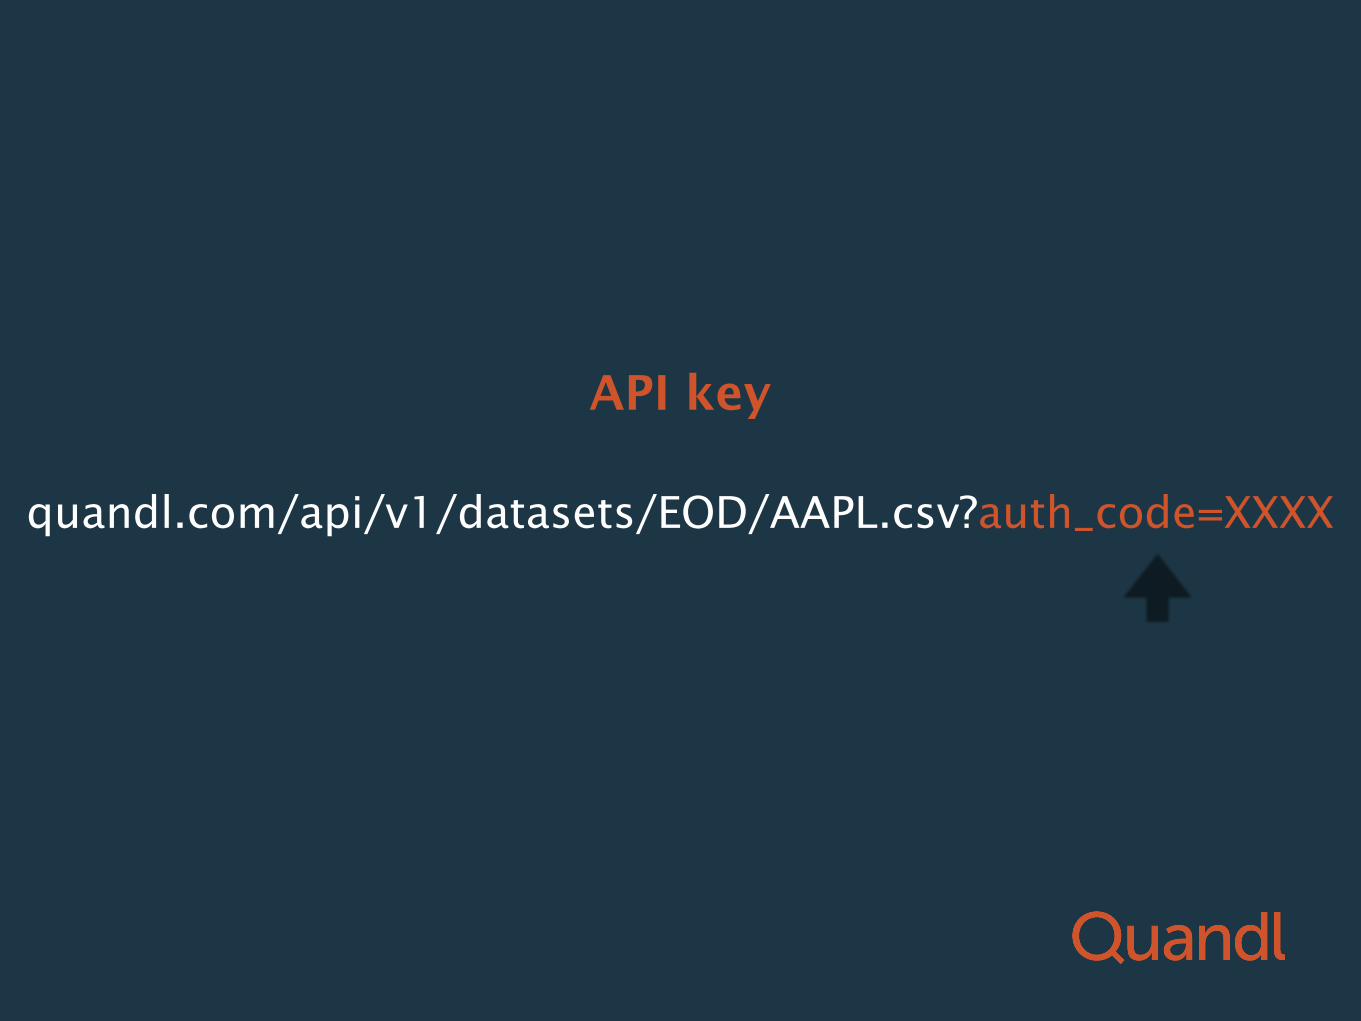
quandl.com/api/v1/datasets/EOD/AAPL.csv?auth_code=XXXX
API key

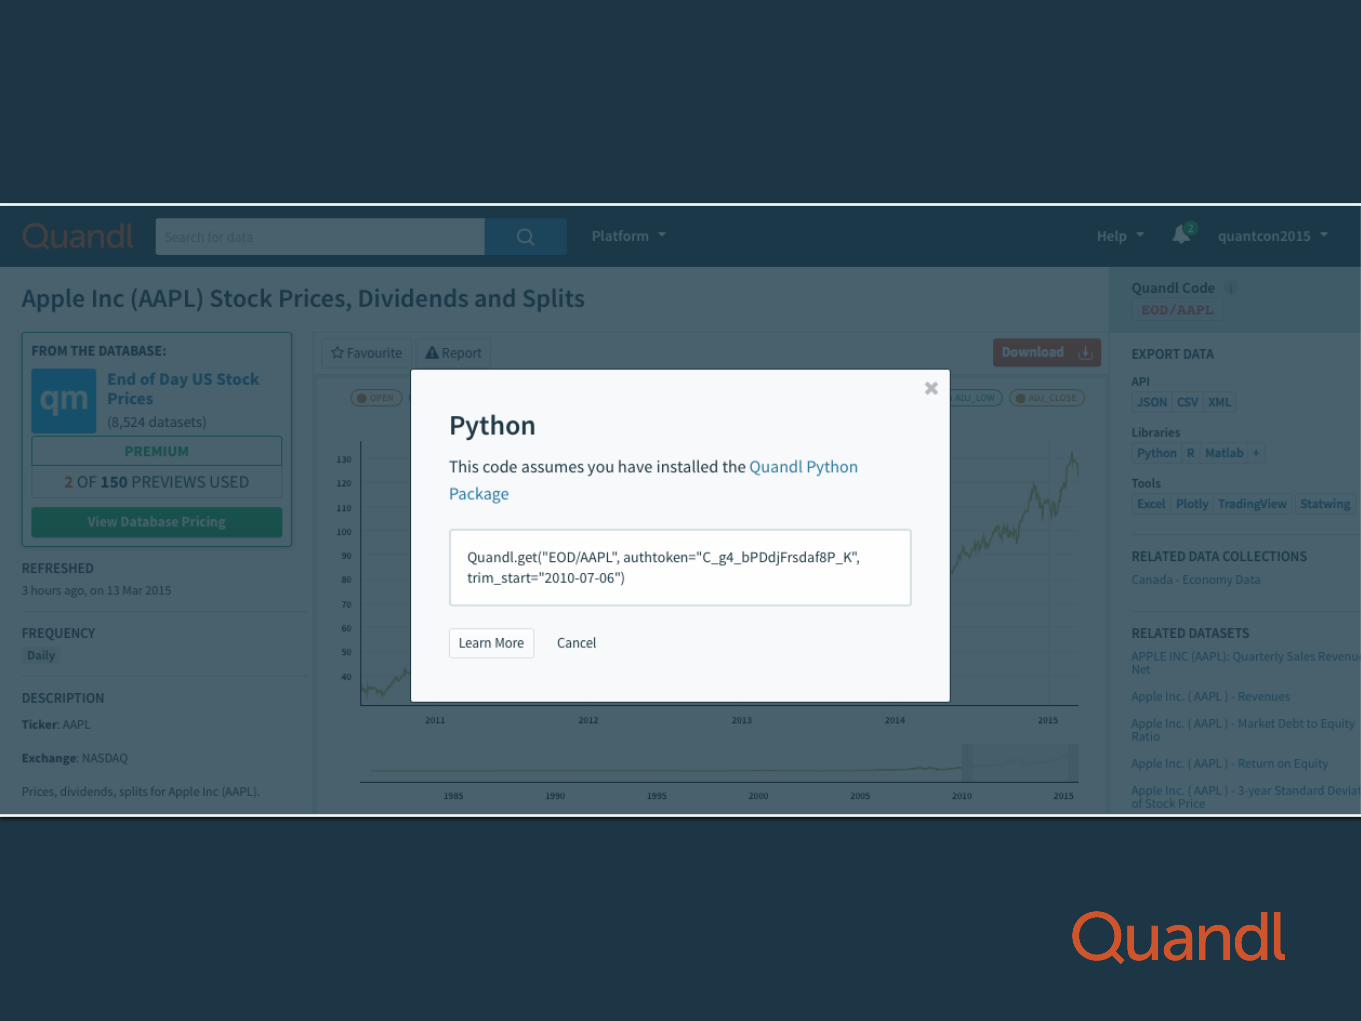
Too hard?
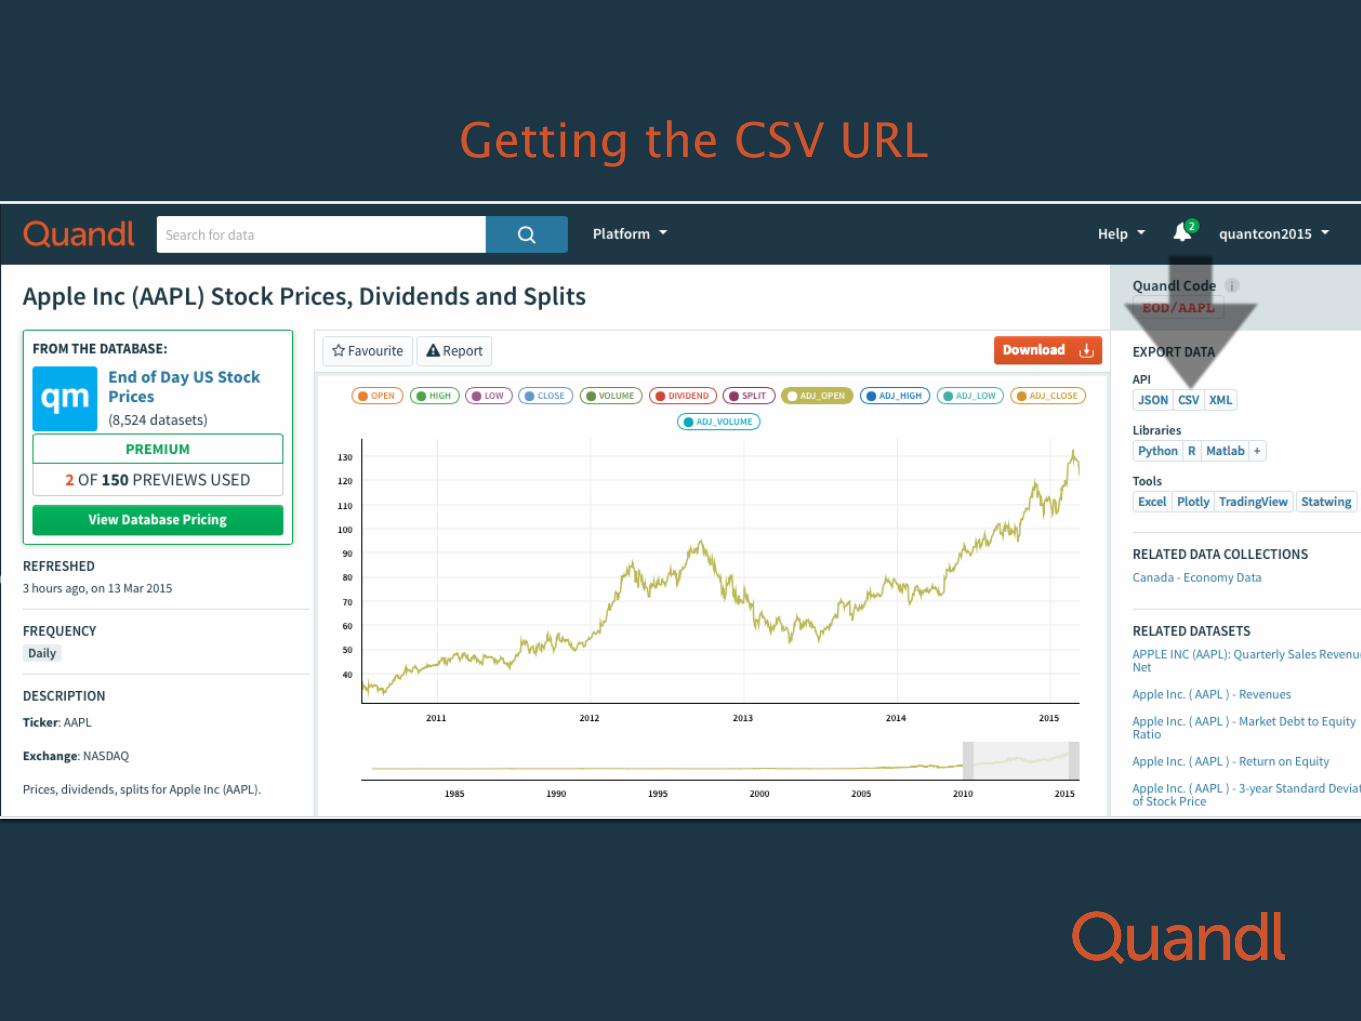
Getting the CSV URL
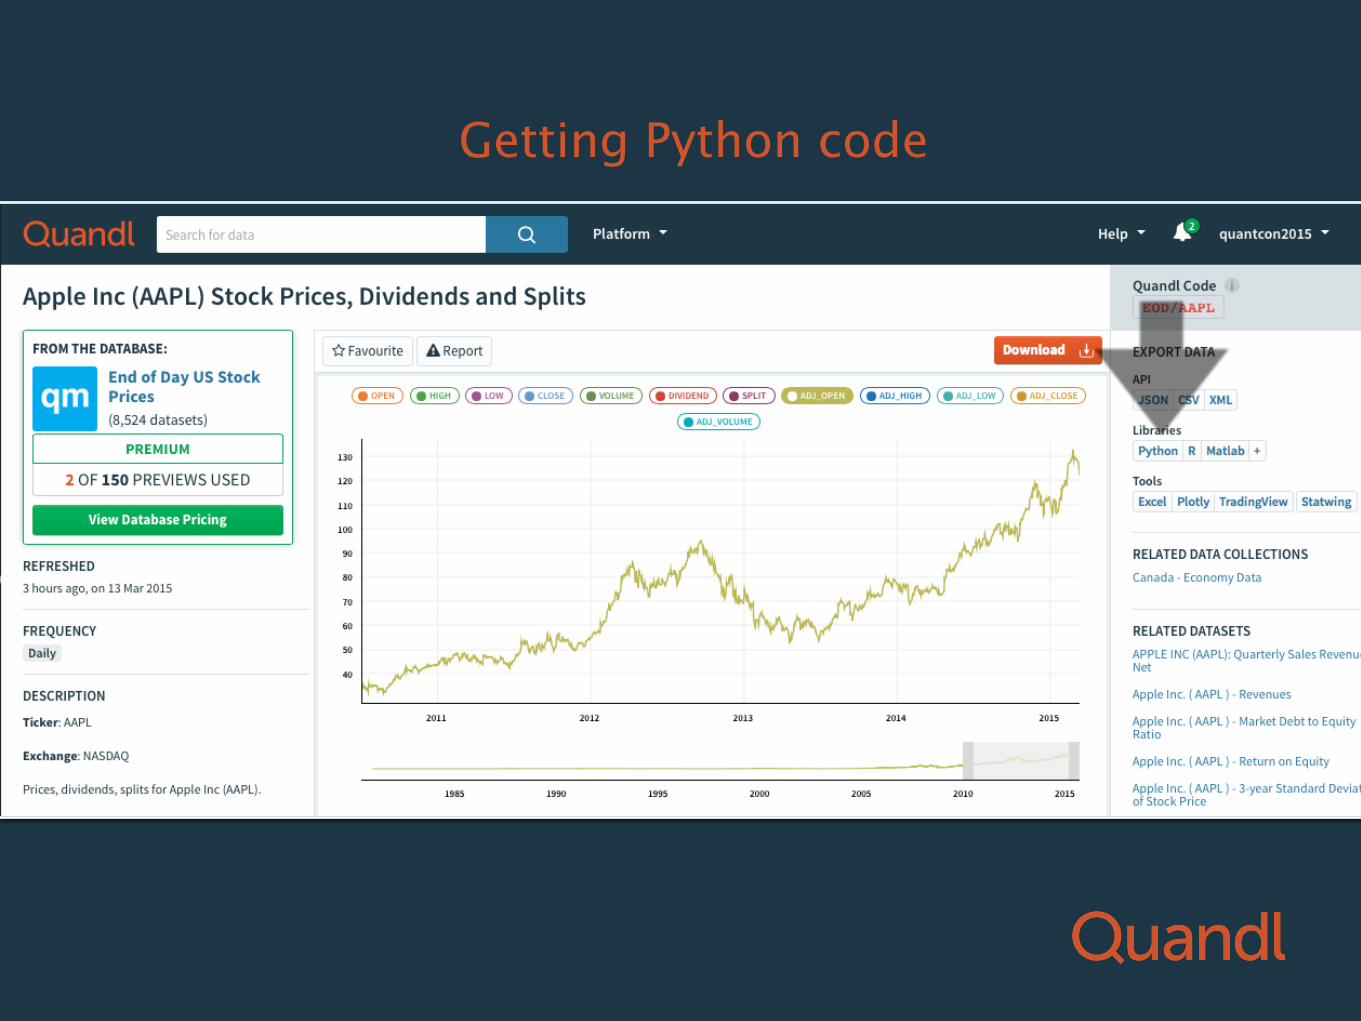
Getting Python code
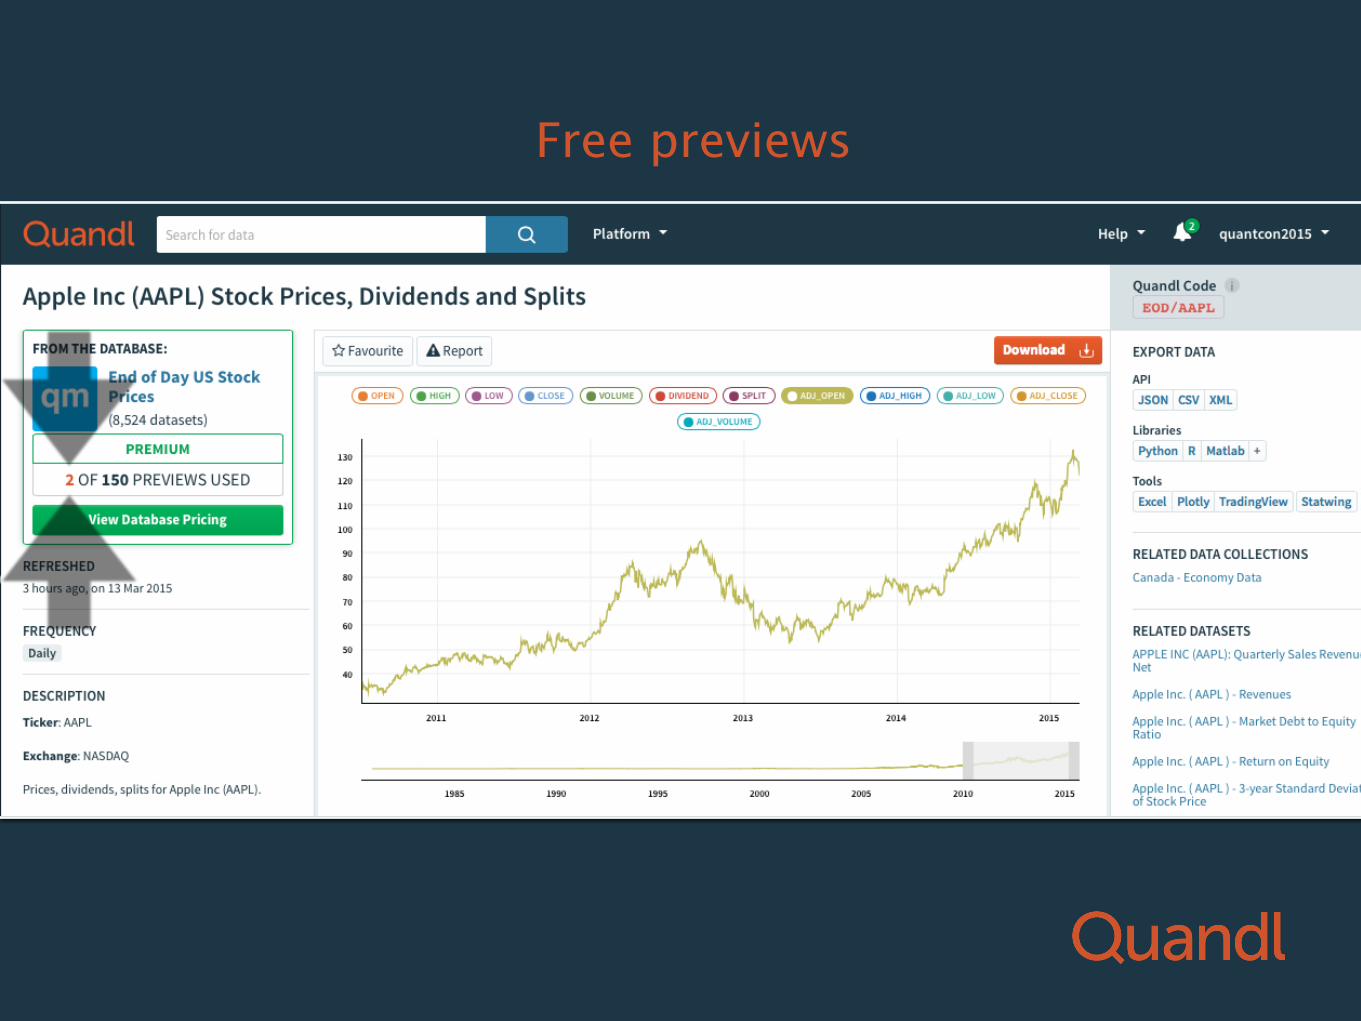
Free previews
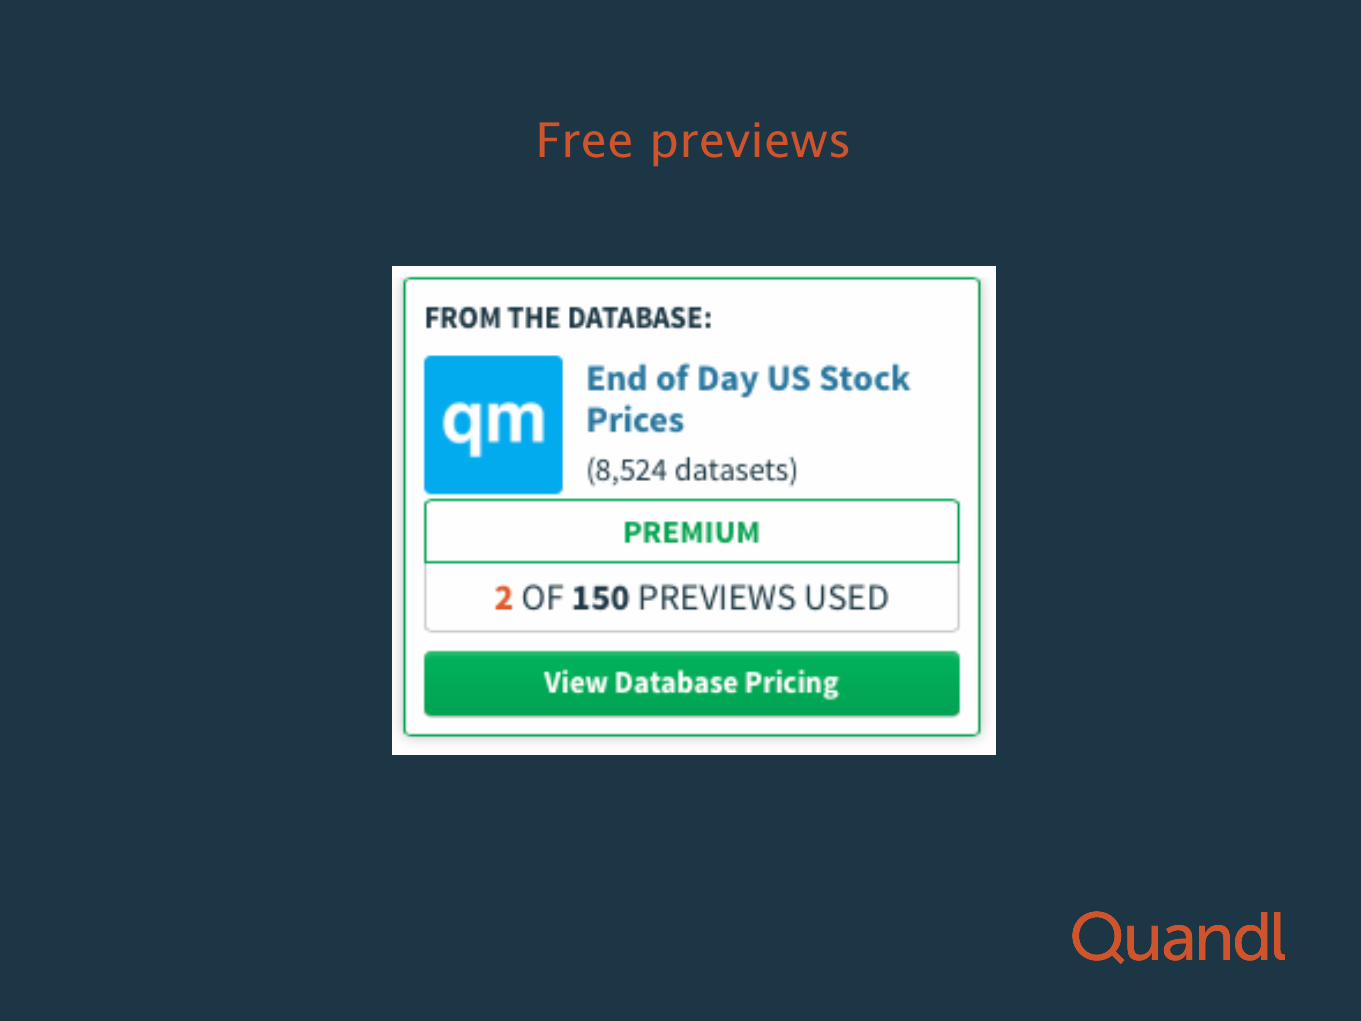
Free previews

Hackathon

Zacks Data quandl.com/vendors/zacks
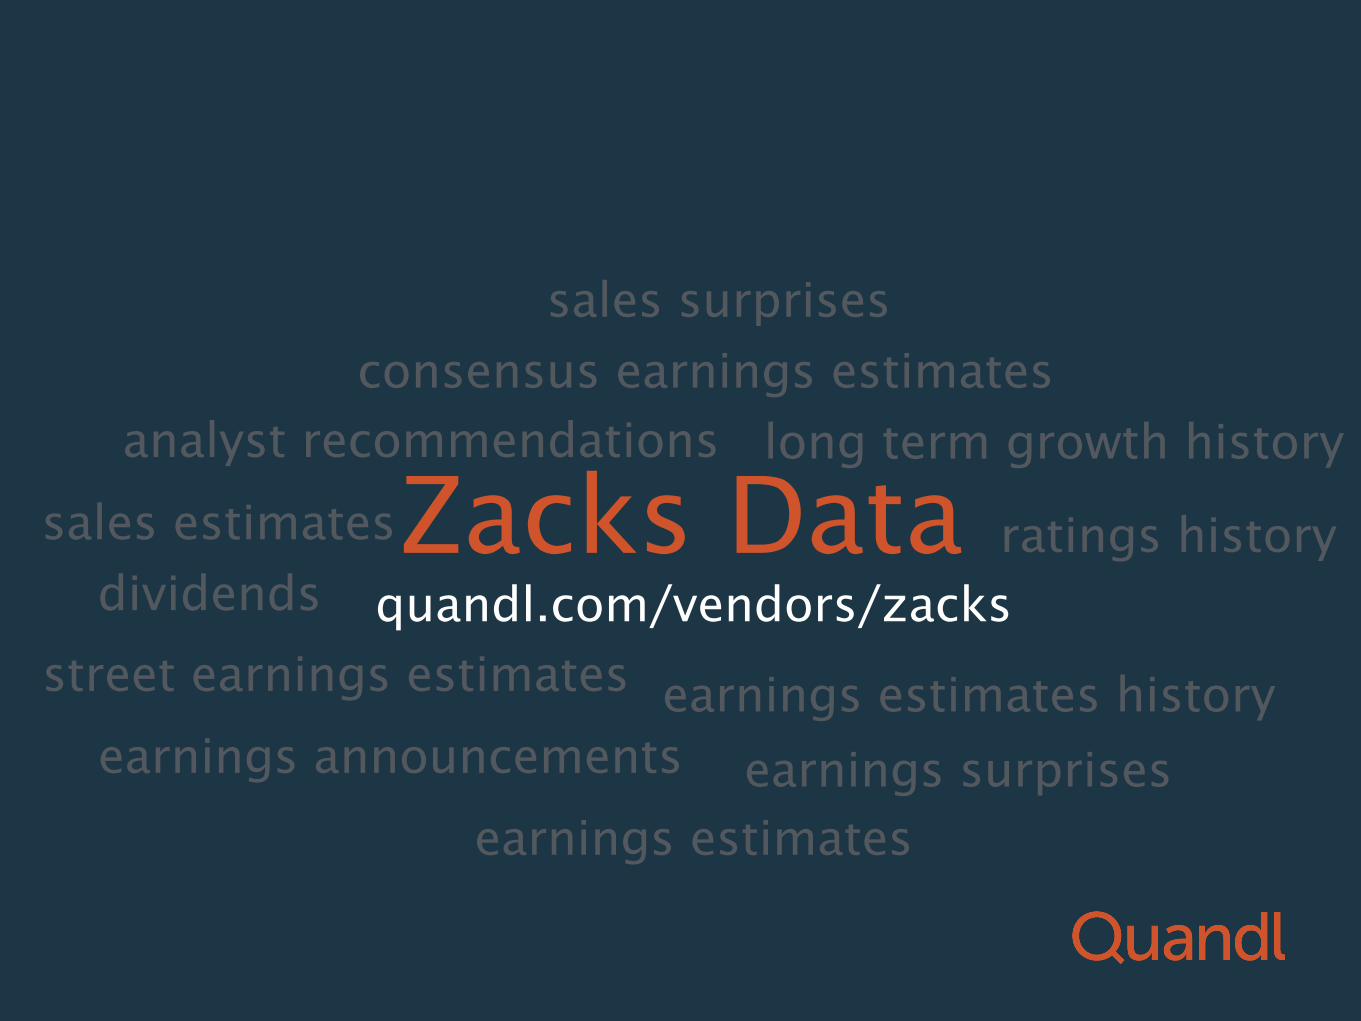
Zacks Data quandl.com/vendors/zacks
consensus earnings estimates
ratings history
long term growth history
earnings estimates history
analyst recommendations
street earnings estimates
sales surprises
earnings estimates
sales estimates
earnings announcements earnings surprises
dividends
Zacks Data quandl.com/vendors/zacks
consensus earnings estimates
ratings history
long term growth history
earnings estimates history
analyst recommendations
street earnings estimates
sales surprises
earnings estimates
sales estimates
earnings announcements earnings surprises
dividends
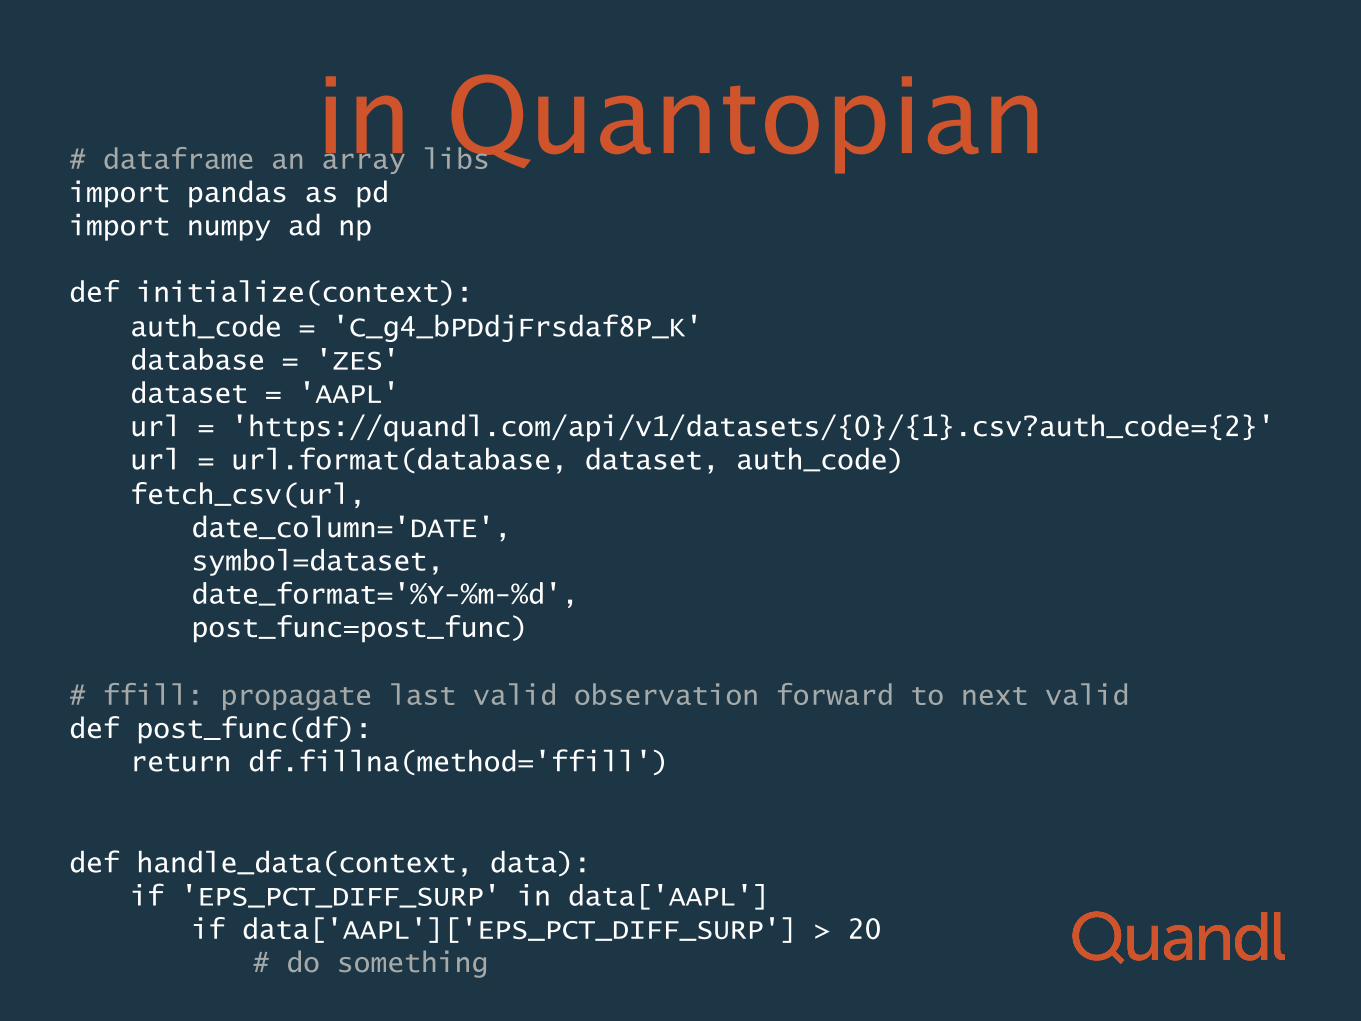
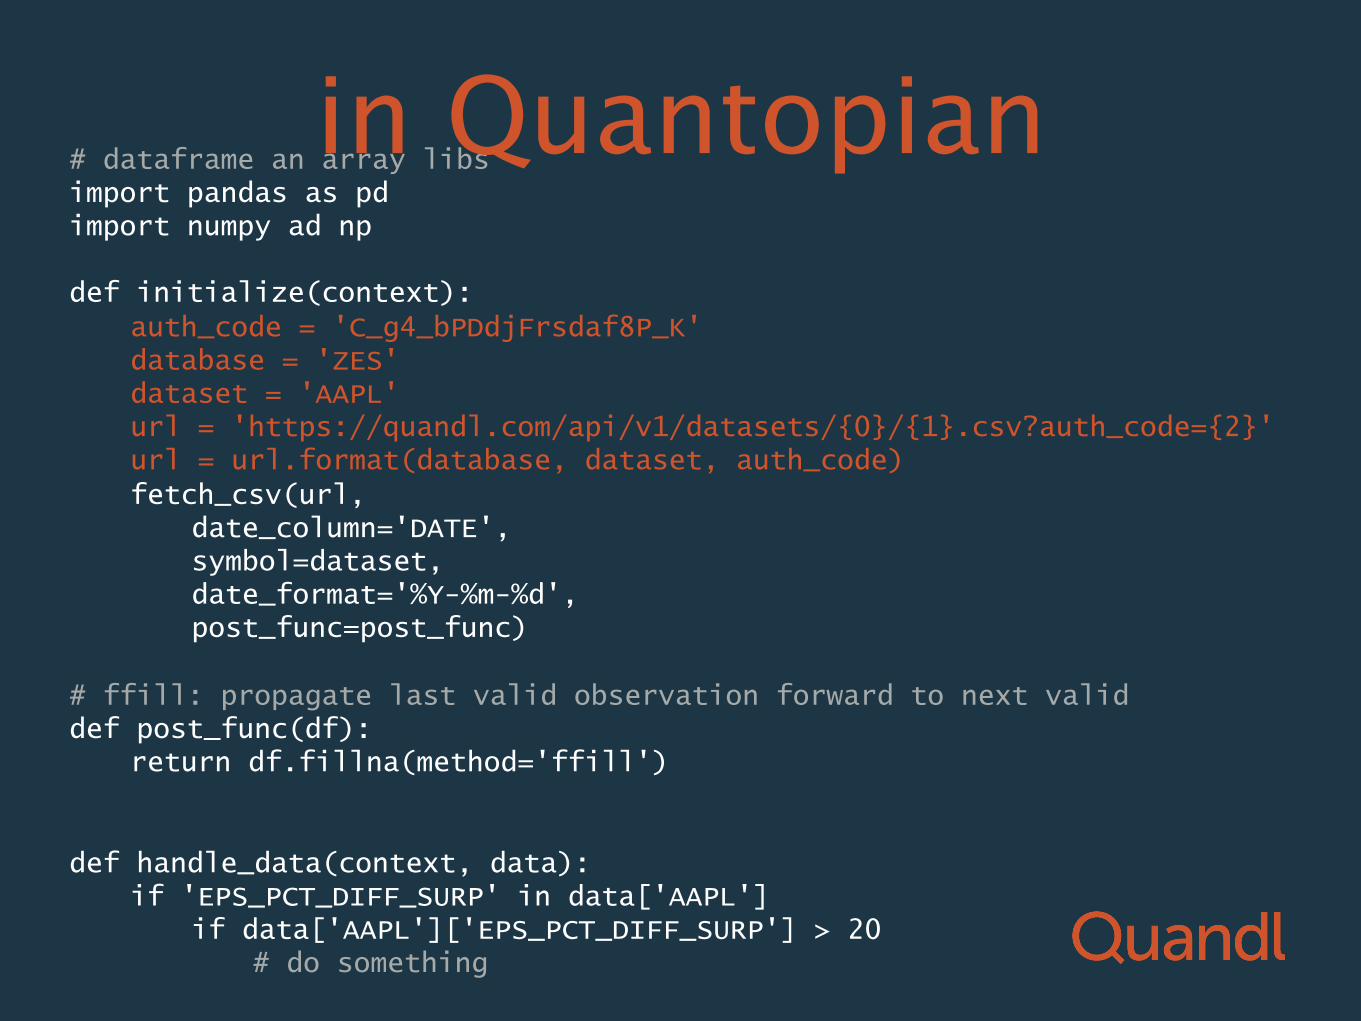
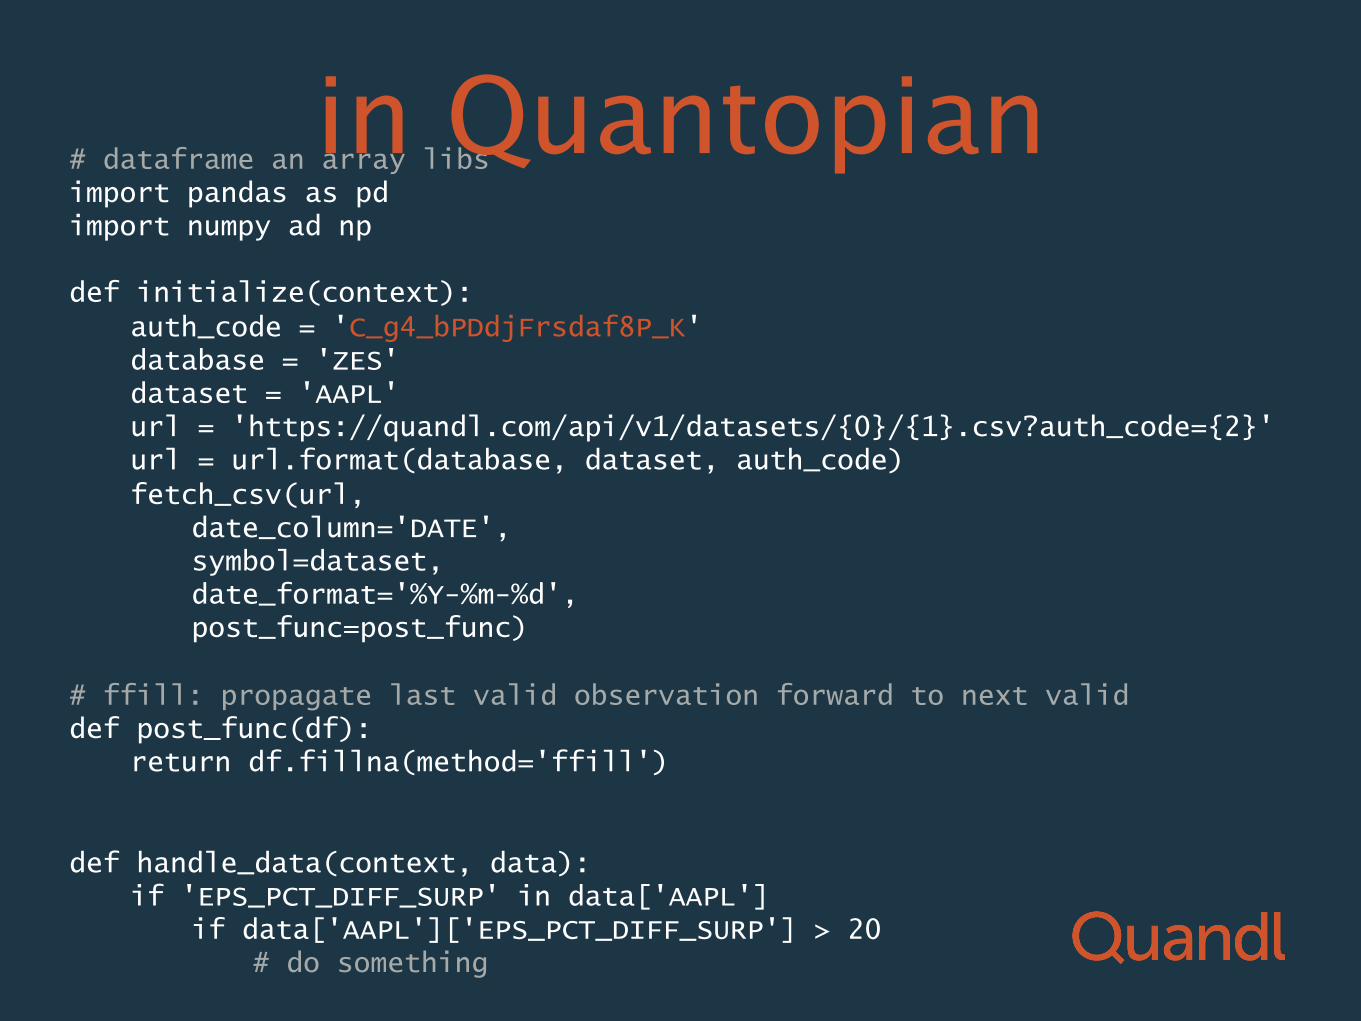
in Quantopian # dataframe an array libs import pandas as pd import numpy ad np def initialize(context):
auth_code = 'C_g4_bPDdjFrsdaf8P_K' database = 'ZES' dataset = 'AAPL' url = 'https://quandl.com/api/v1/datasets/{0}/{1}.csv?auth_code={2}' url = url.format(database, dataset, auth_code) fetch_csv(url, date_column='DATE', symbol=dataset, date_format='%Y-%m-%d', post_func=post_func)
# ffill: propagate last valid observation forward to next valid def post_func(df):
return df.fillna(method='ffill')
def handle_data(context, data): if 'EPS_PCT_DIFF_SURP' in data['AAPL'] if data['AAPL']['EPS_PCT_DIFF_SURP'] > 20 # do something
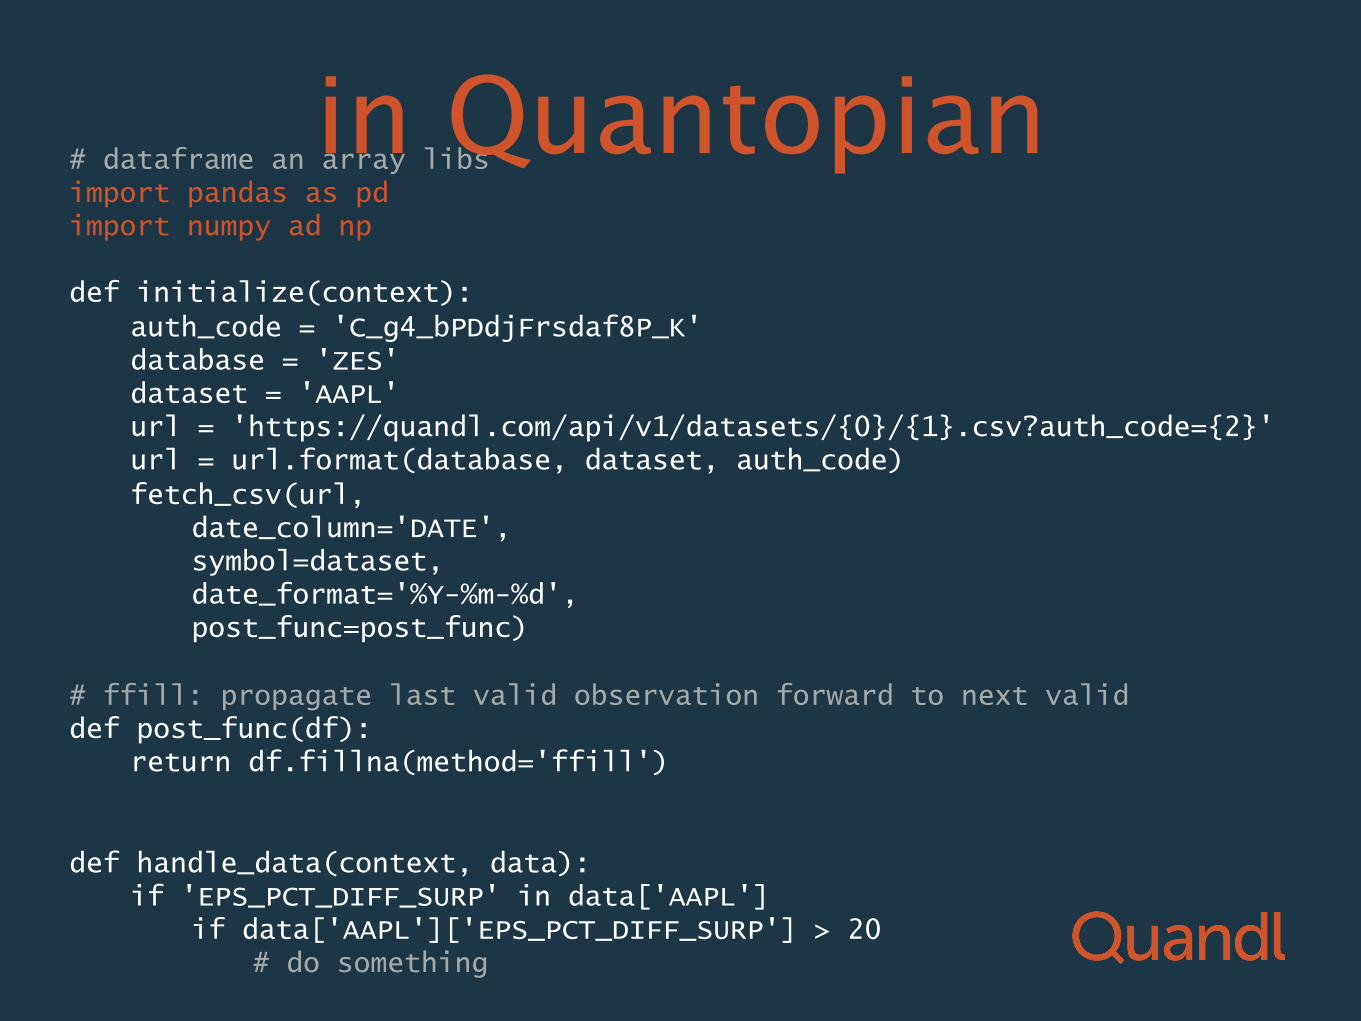
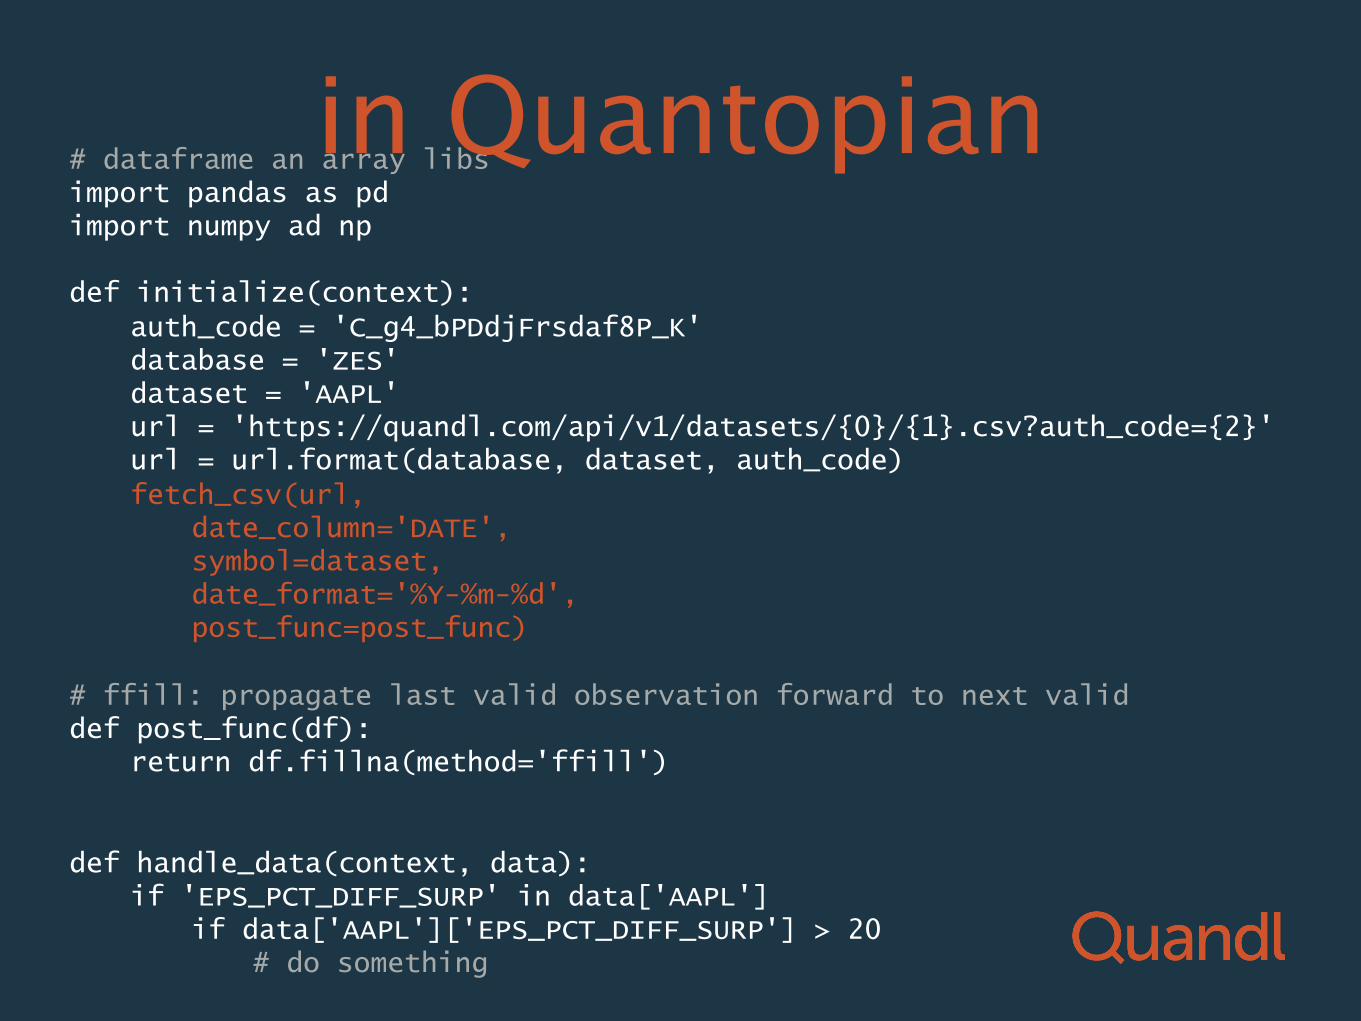
# dataframe an array libs import pandas as pd import numpy ad np def initialize(context):
auth_code = 'C_g4_bPDdjFrsdaf8P_K' database = 'ZES' dataset = 'AAPL' url = 'https://quandl.com/api/v1/datasets/{0}/{1}.csv?auth_code={2}' url = url.format(database, dataset, auth_code) fetch_csv(url, date_column='DATE', symbol=dataset, date_format='%Y-%m-%d', post_func=post_func)
# ffill: propagate last valid observation forward to next valid def post_func(df):
return df.fillna(method='ffill')
def handle_data(context, data): if 'EPS_PCT_DIFF_SURP' in data['AAPL'] if data['AAPL']['EPS_PCT_DIFF_SURP'] > 20 # do something
in Quantopian
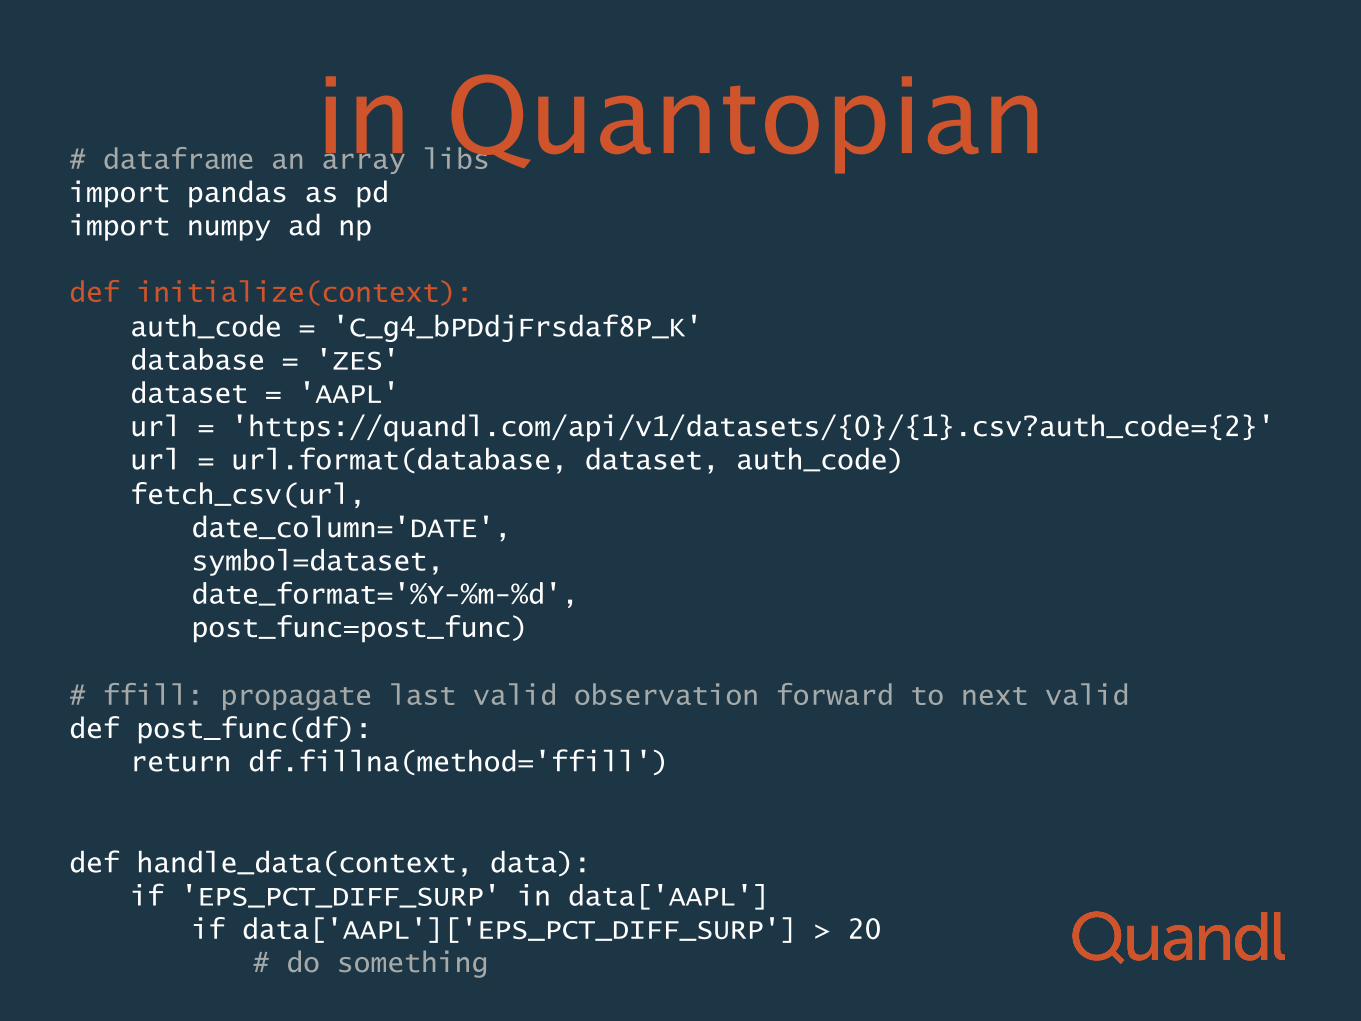
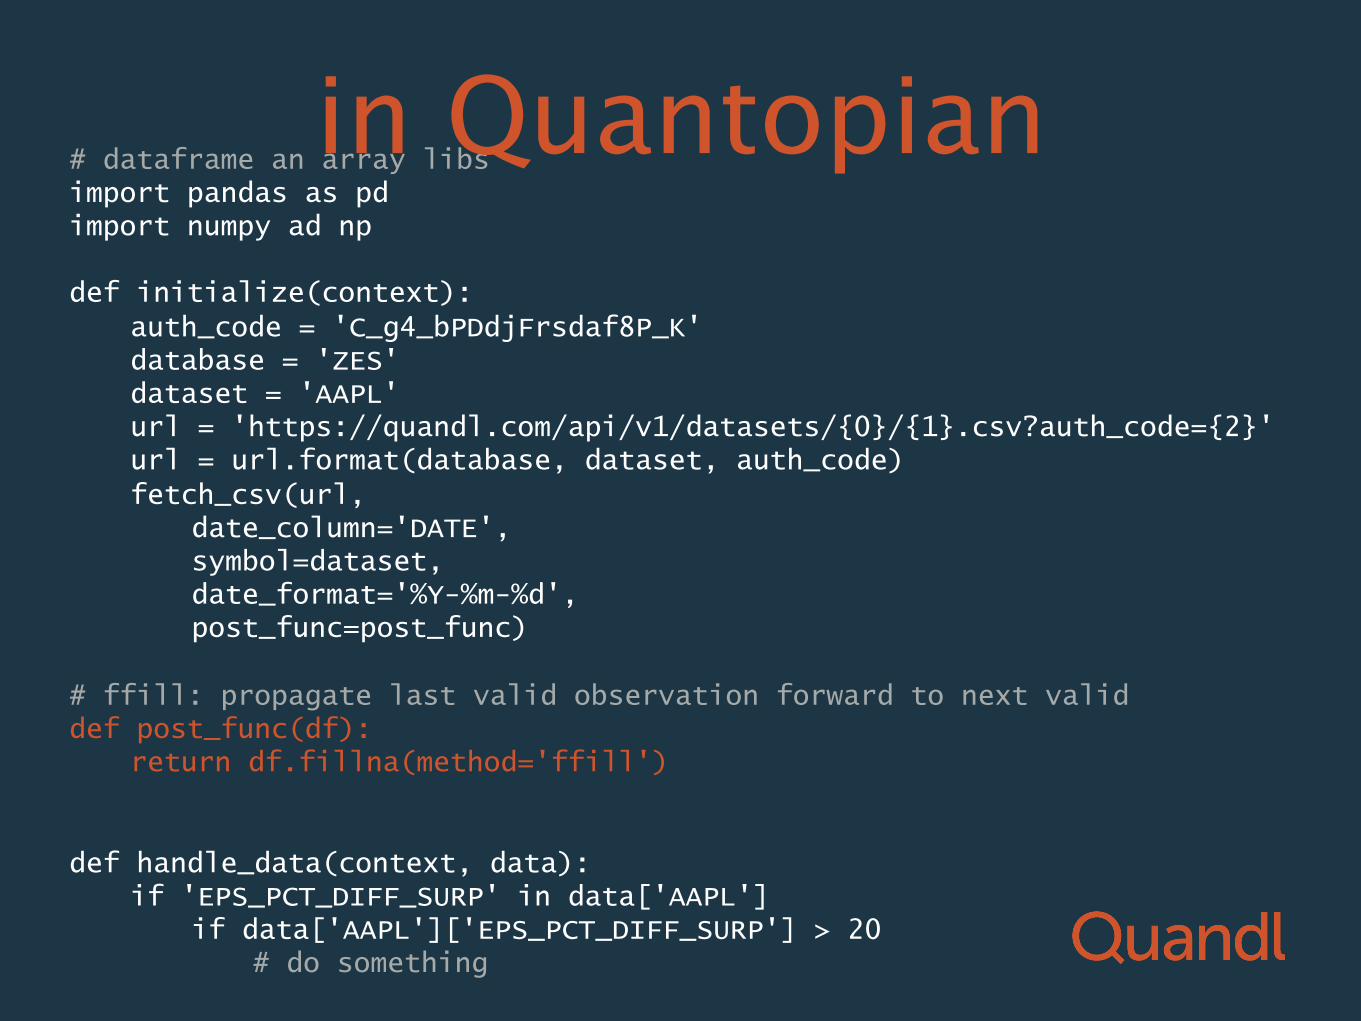
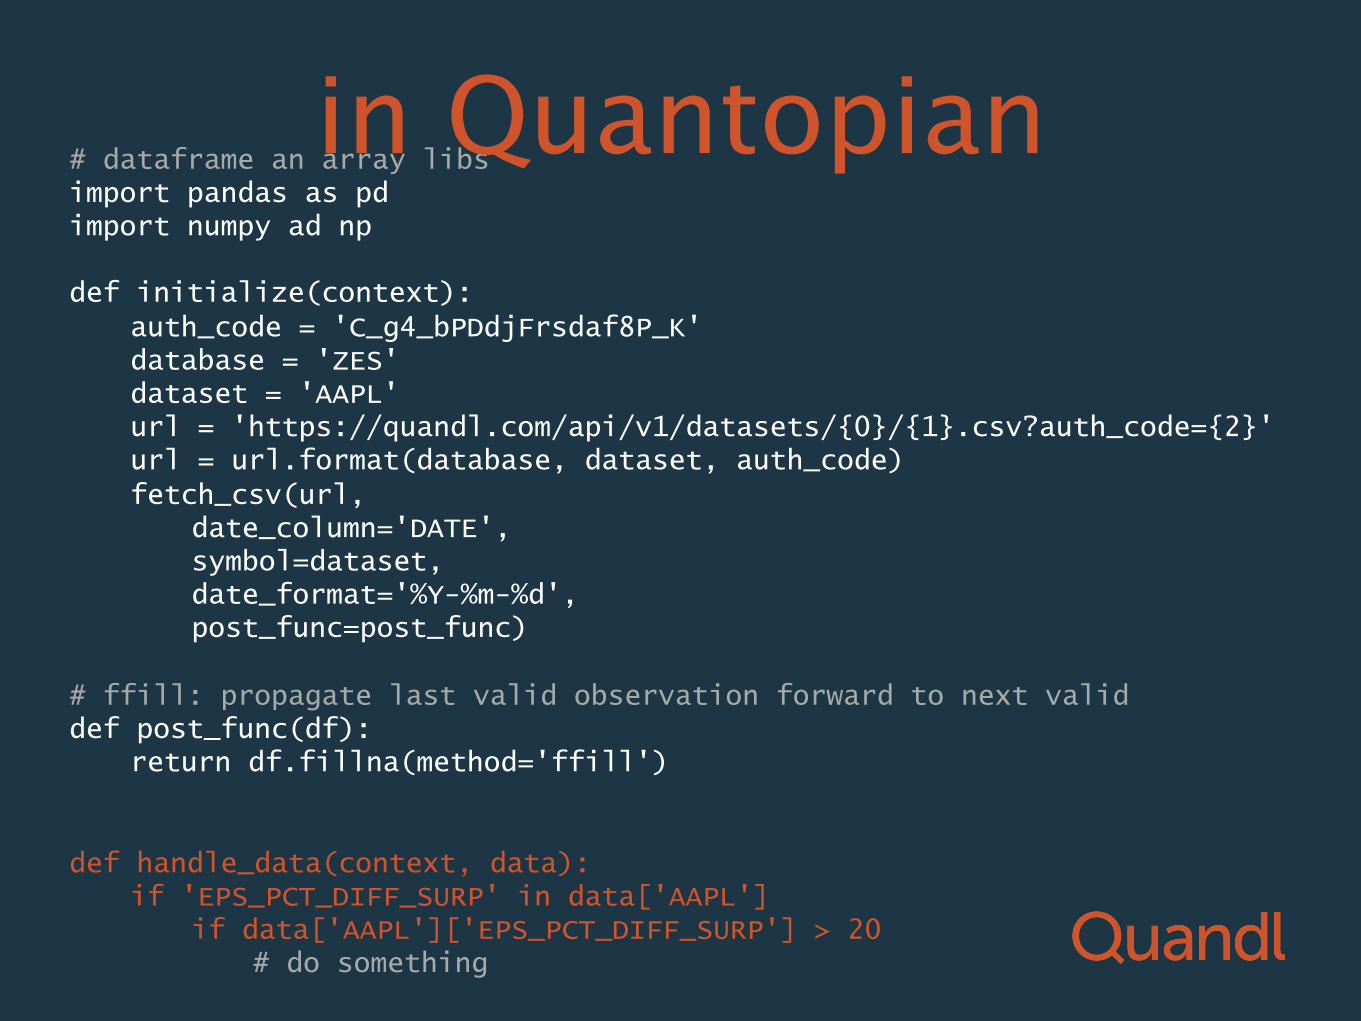
user: QuantCon2015 pass: bbbbbbbb
Useful Docs: quandl.com/help/python
quandl.com/help/quantopian

Example Application
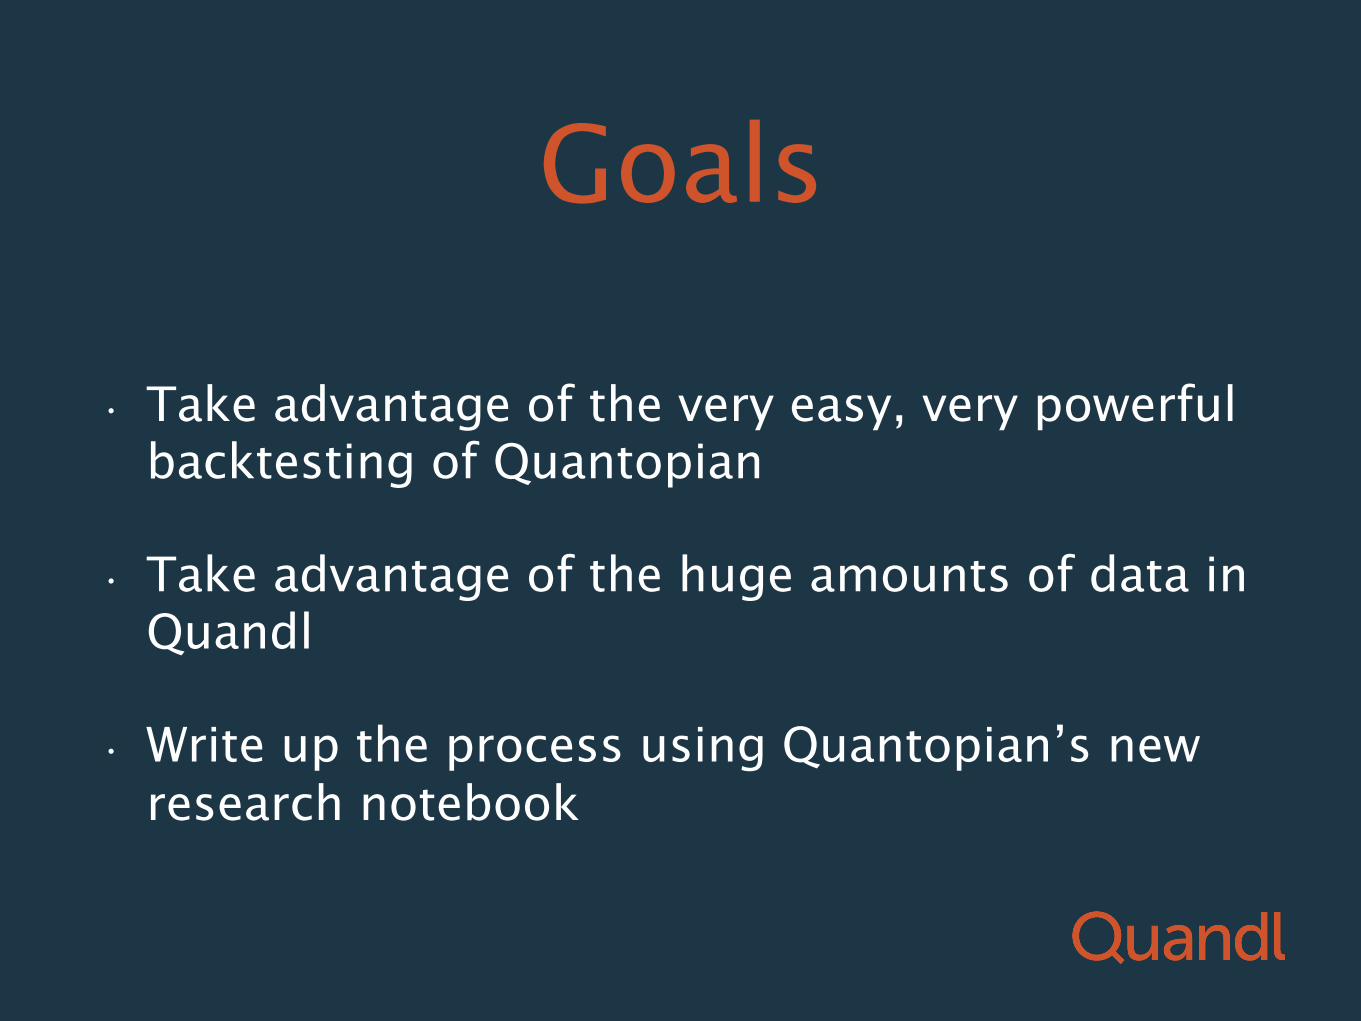
Goals
• Take advantage of the very easy, very powerful backtesting of Quantopian
• Take advantage of the huge amounts of data in Quandl
• Write up the process using Quantopian’s new research notebook
Zacks Fundamentals B
• 200+ indicators
• over 7000 US equities
• How to take advantage of all 200 indicators?

Benford’s Law Example algorithm:
The most common first number is 1
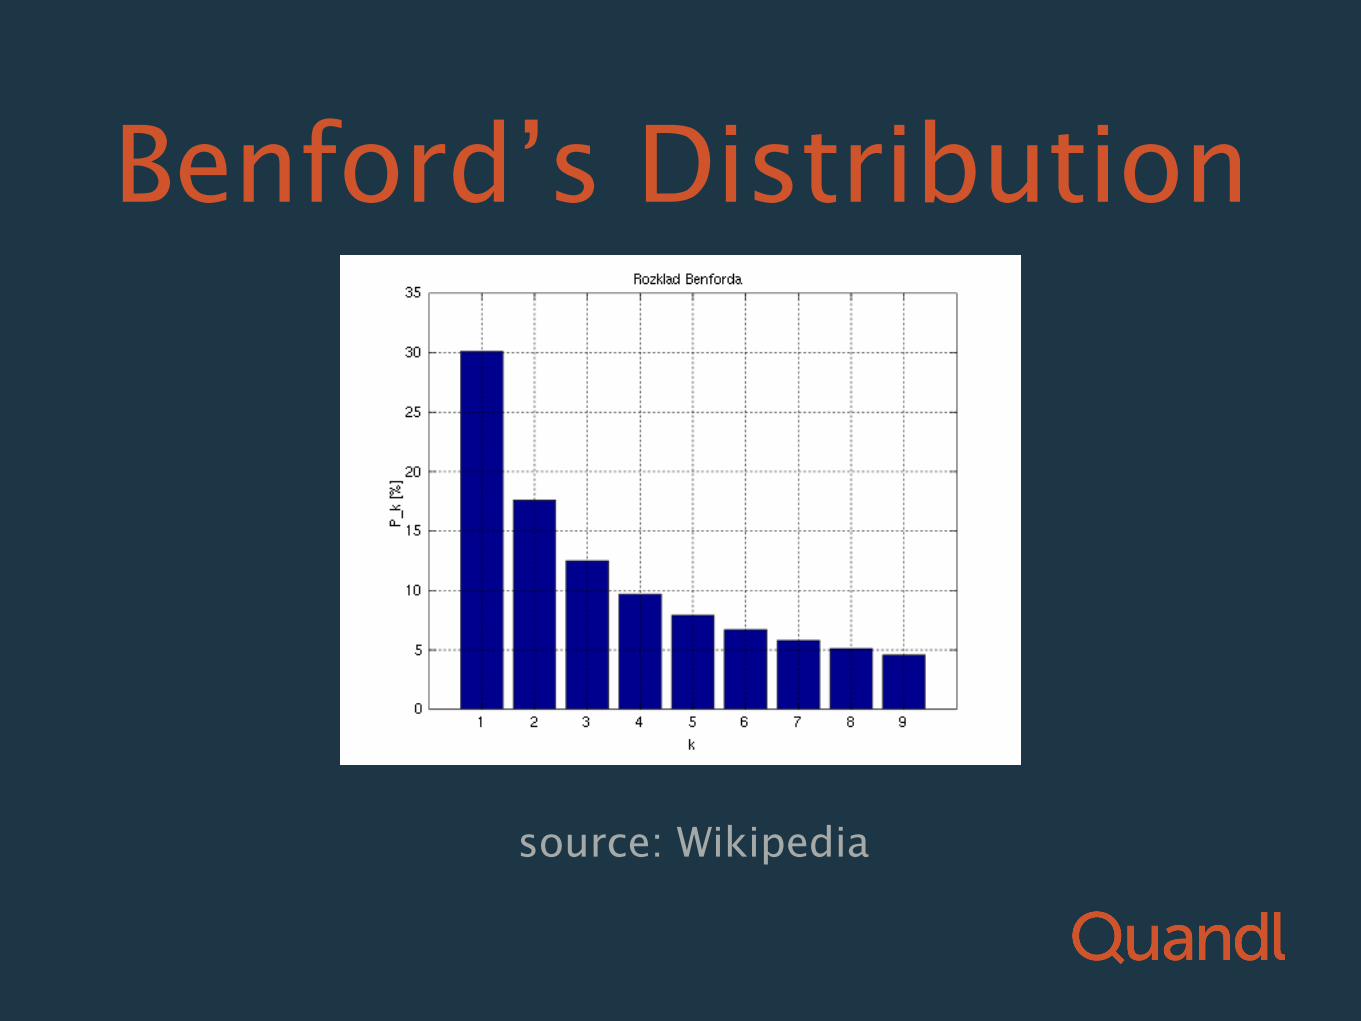
source: Wikipedia
Benford’s Distribution
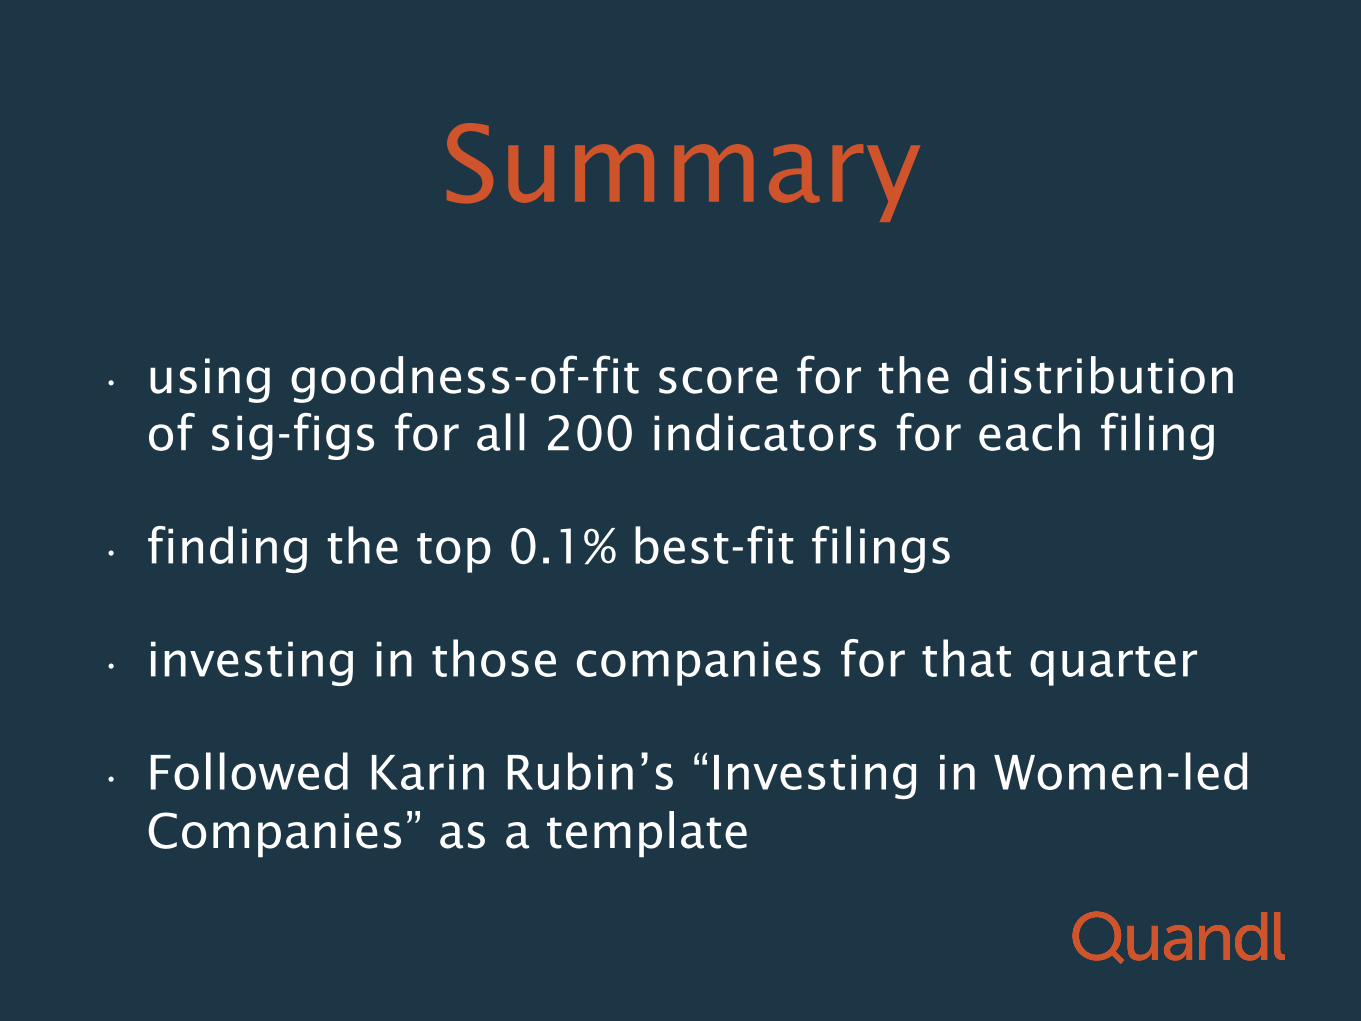
Summary
• using goodness-of-fit score for the distribution of sig-figs for all 200 indicators for each filing
• finding the top 0.1% best-fit filings
• investing in those companies for that quarter
• Followed Karin Rubin’s “Investing in Women-led Companies” as a template
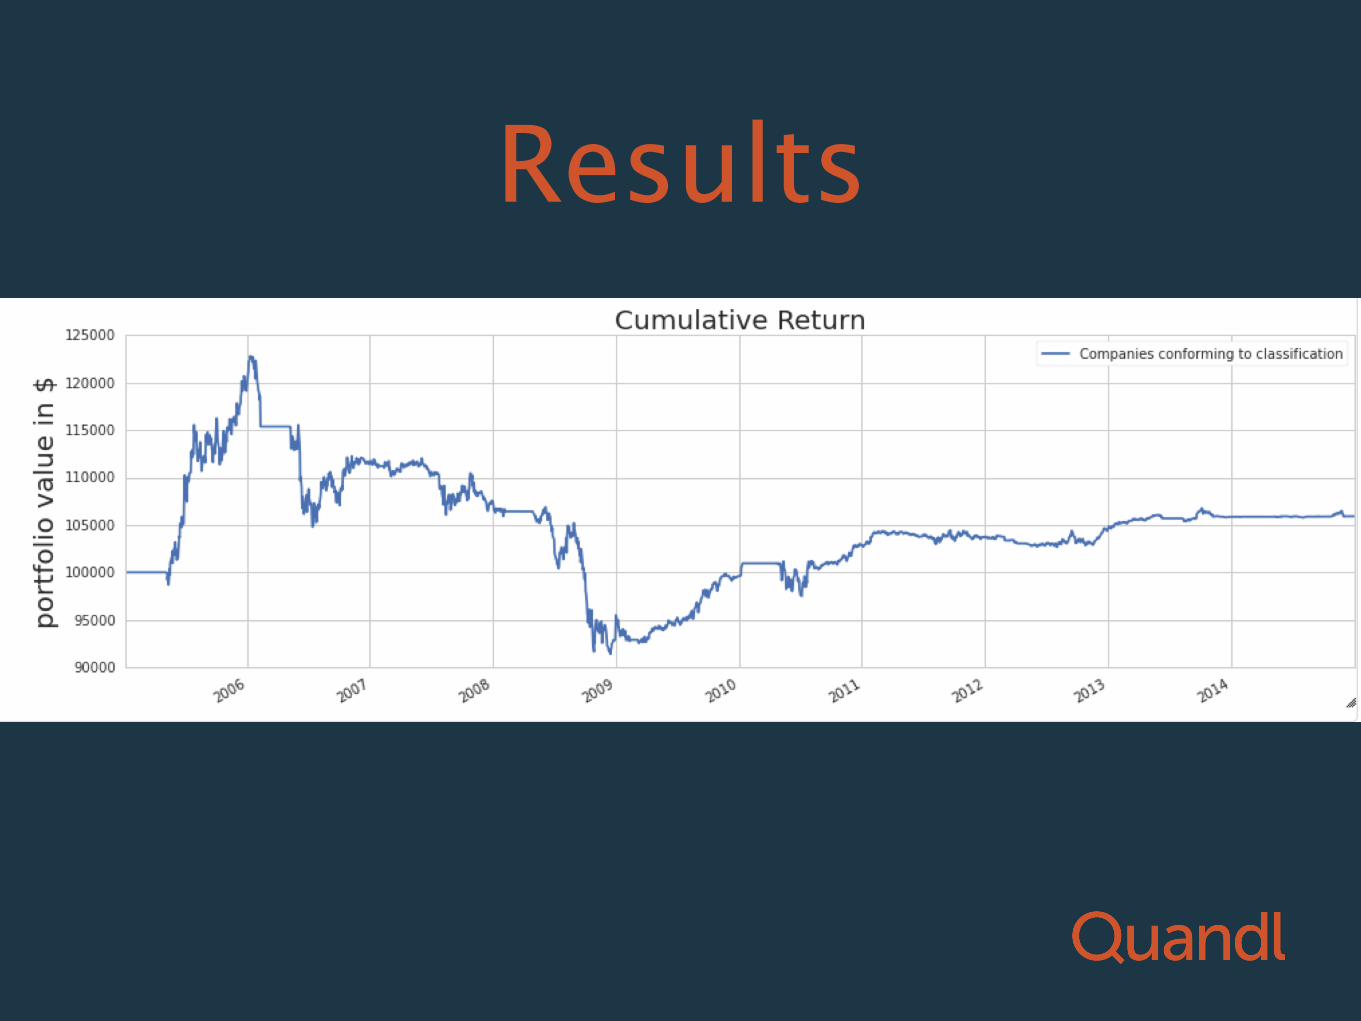
Results
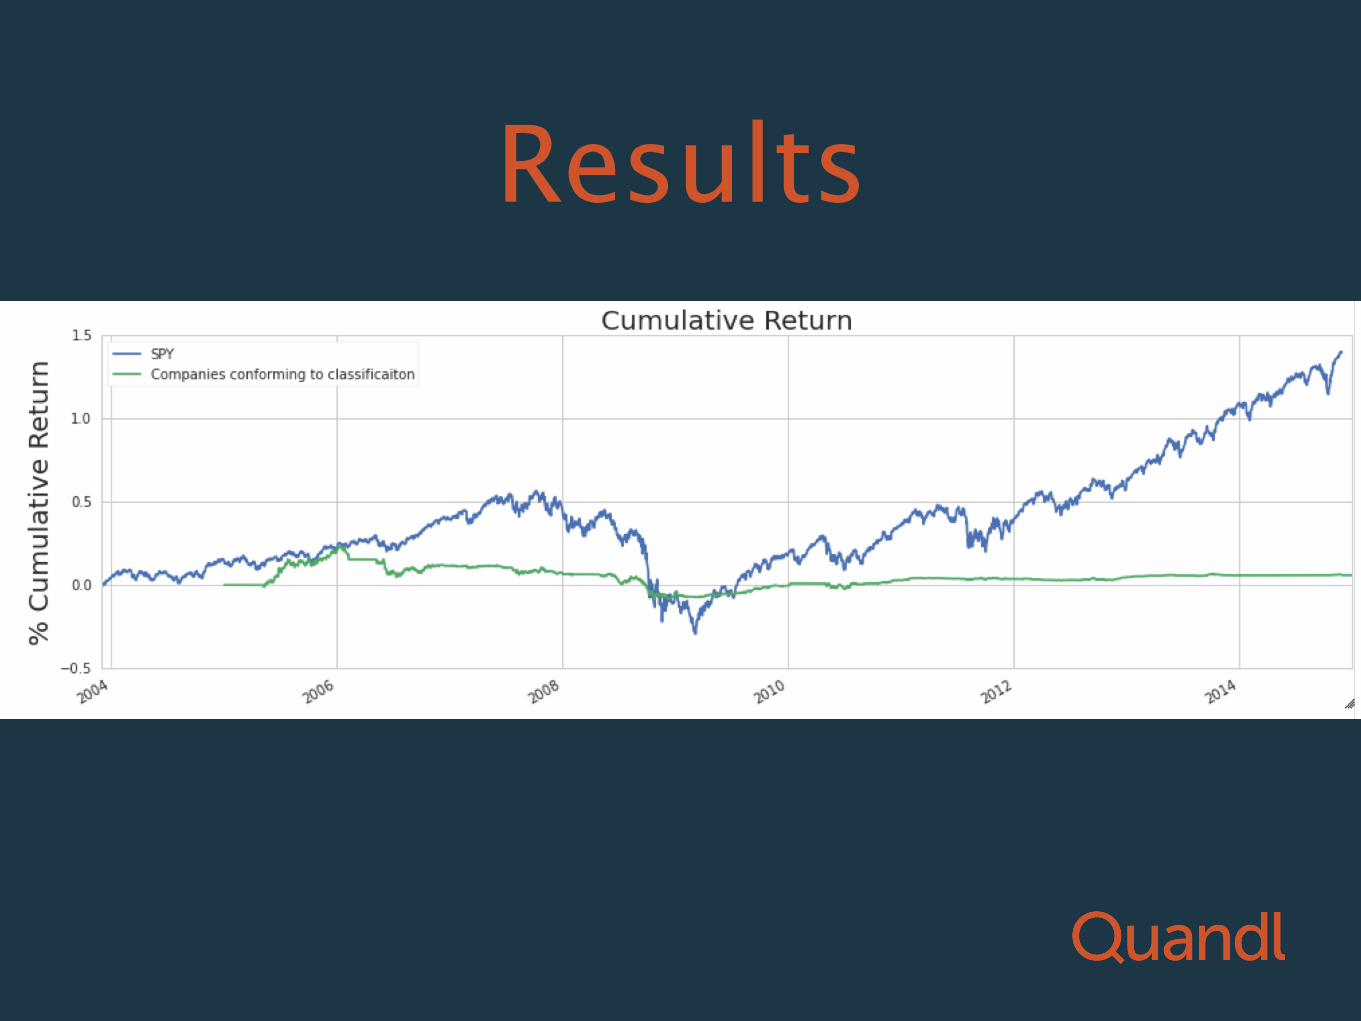
Results

#QuandlApps

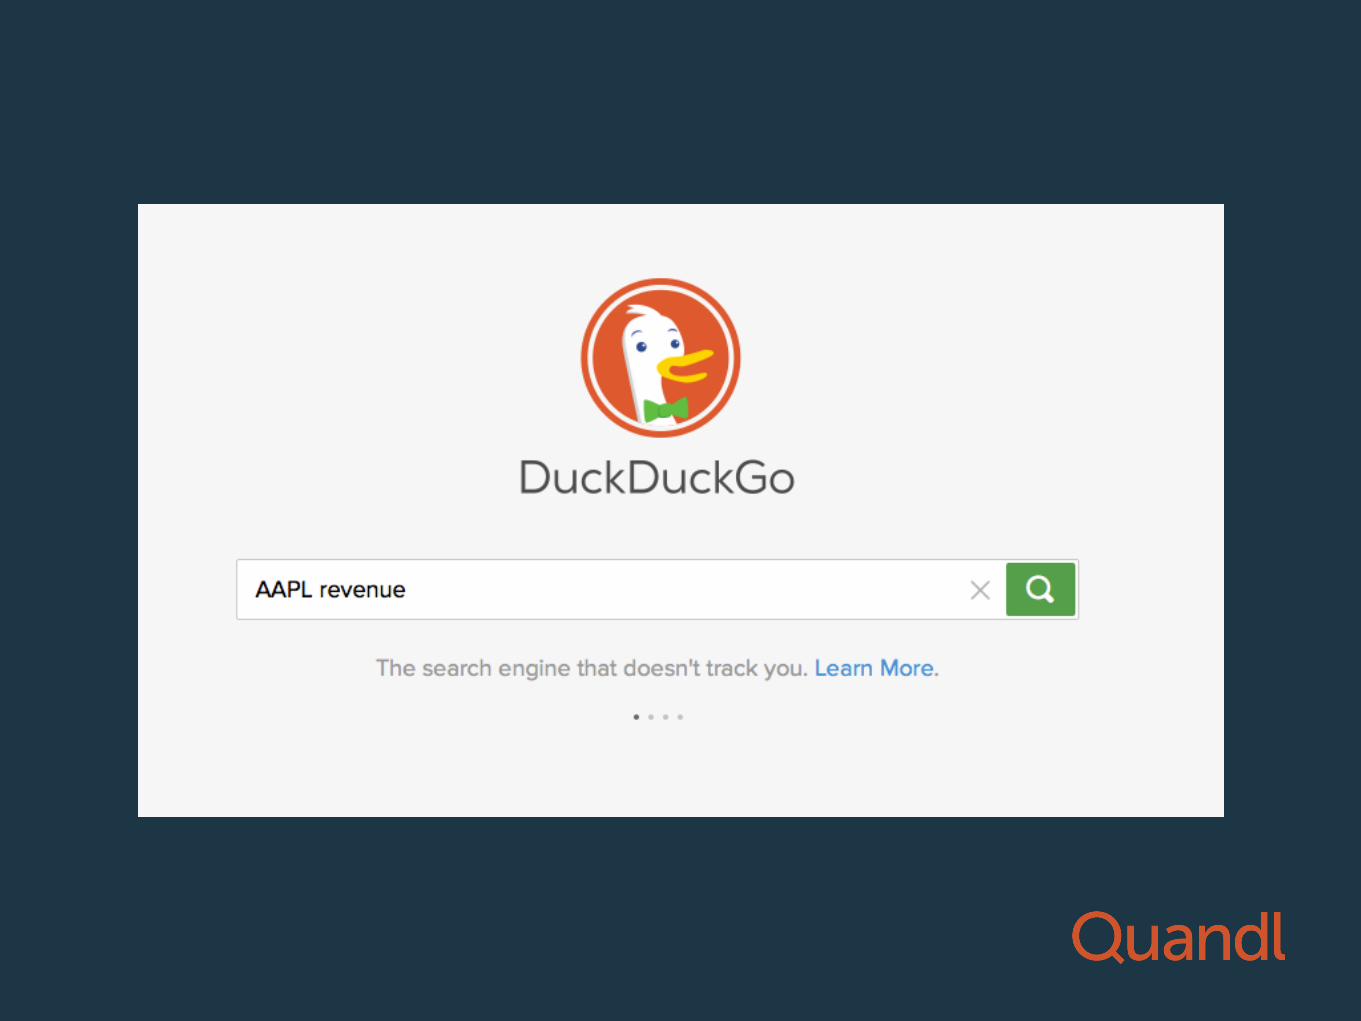
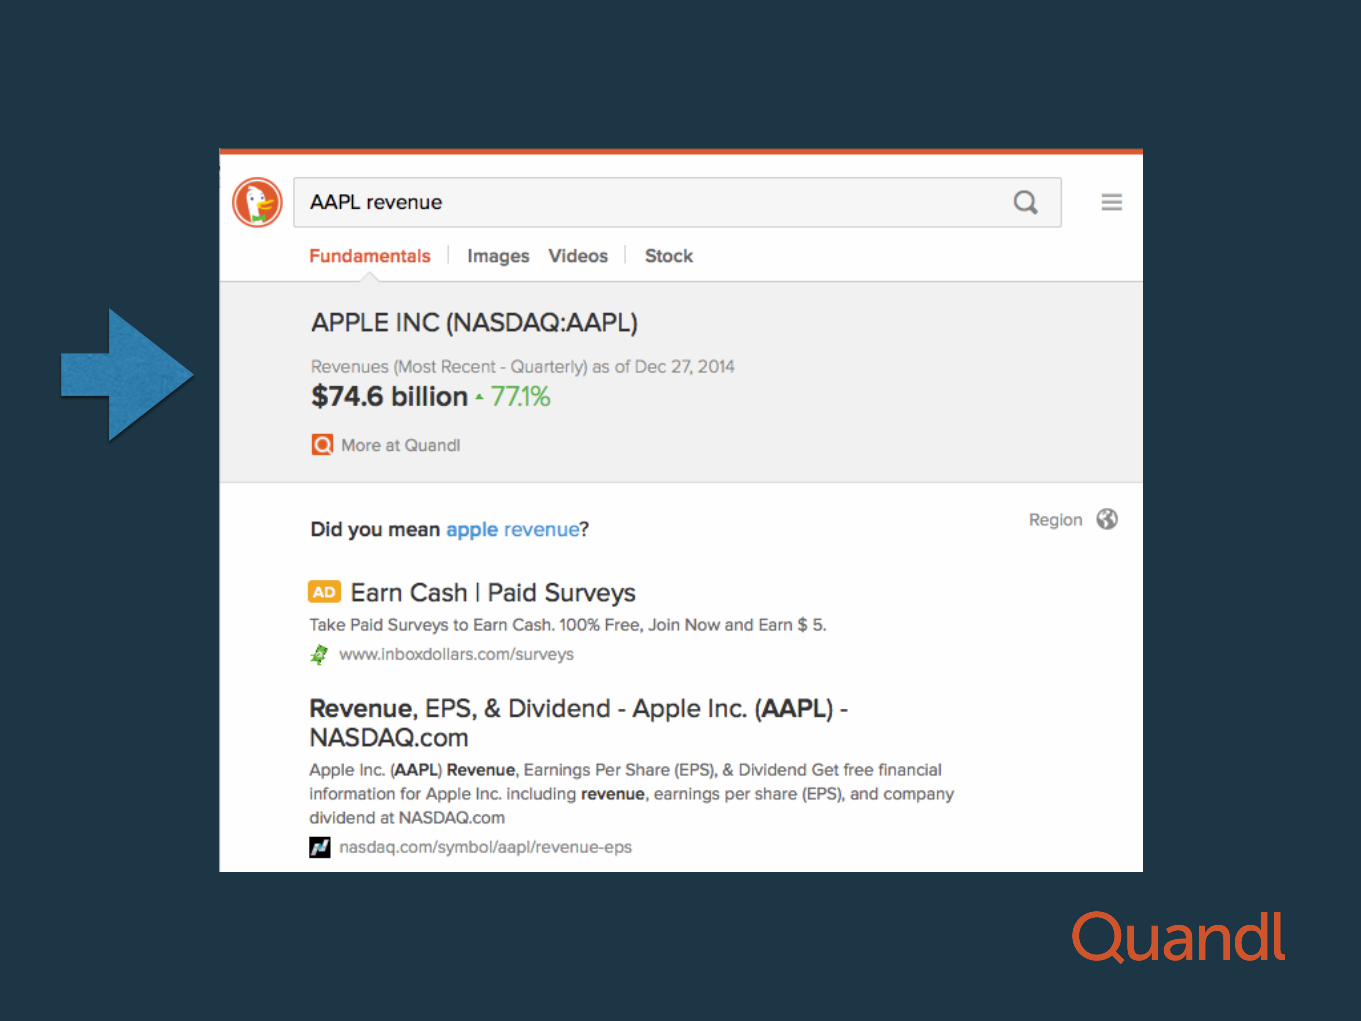
DuckDuckGo
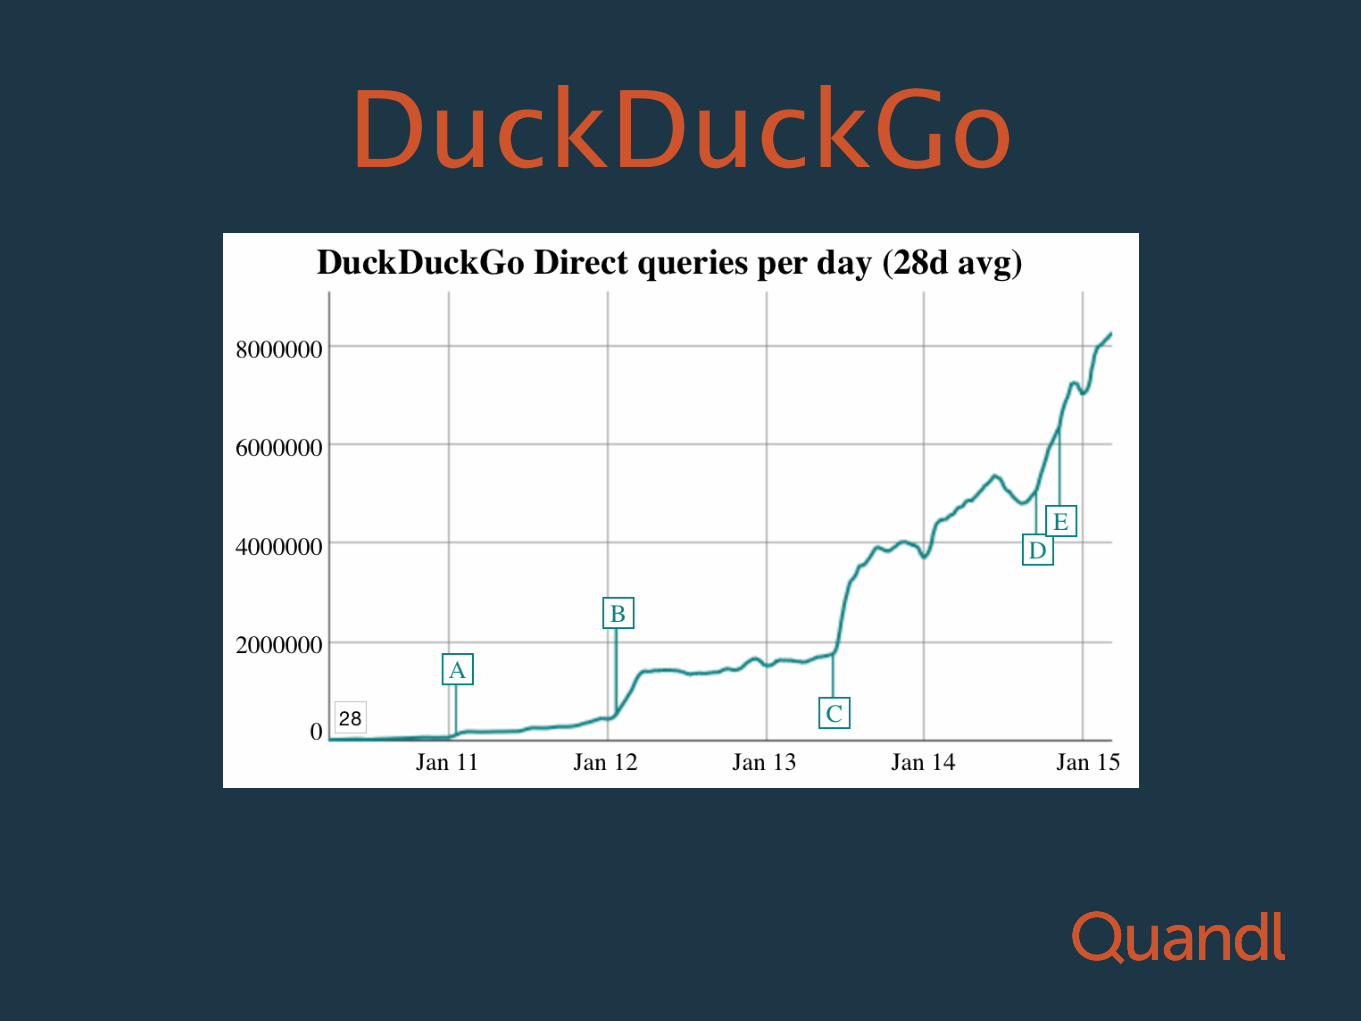
DuckDuckGo
DuckDuckGo
• Does not track your history
• Allows open-source development of “instant answer” modules
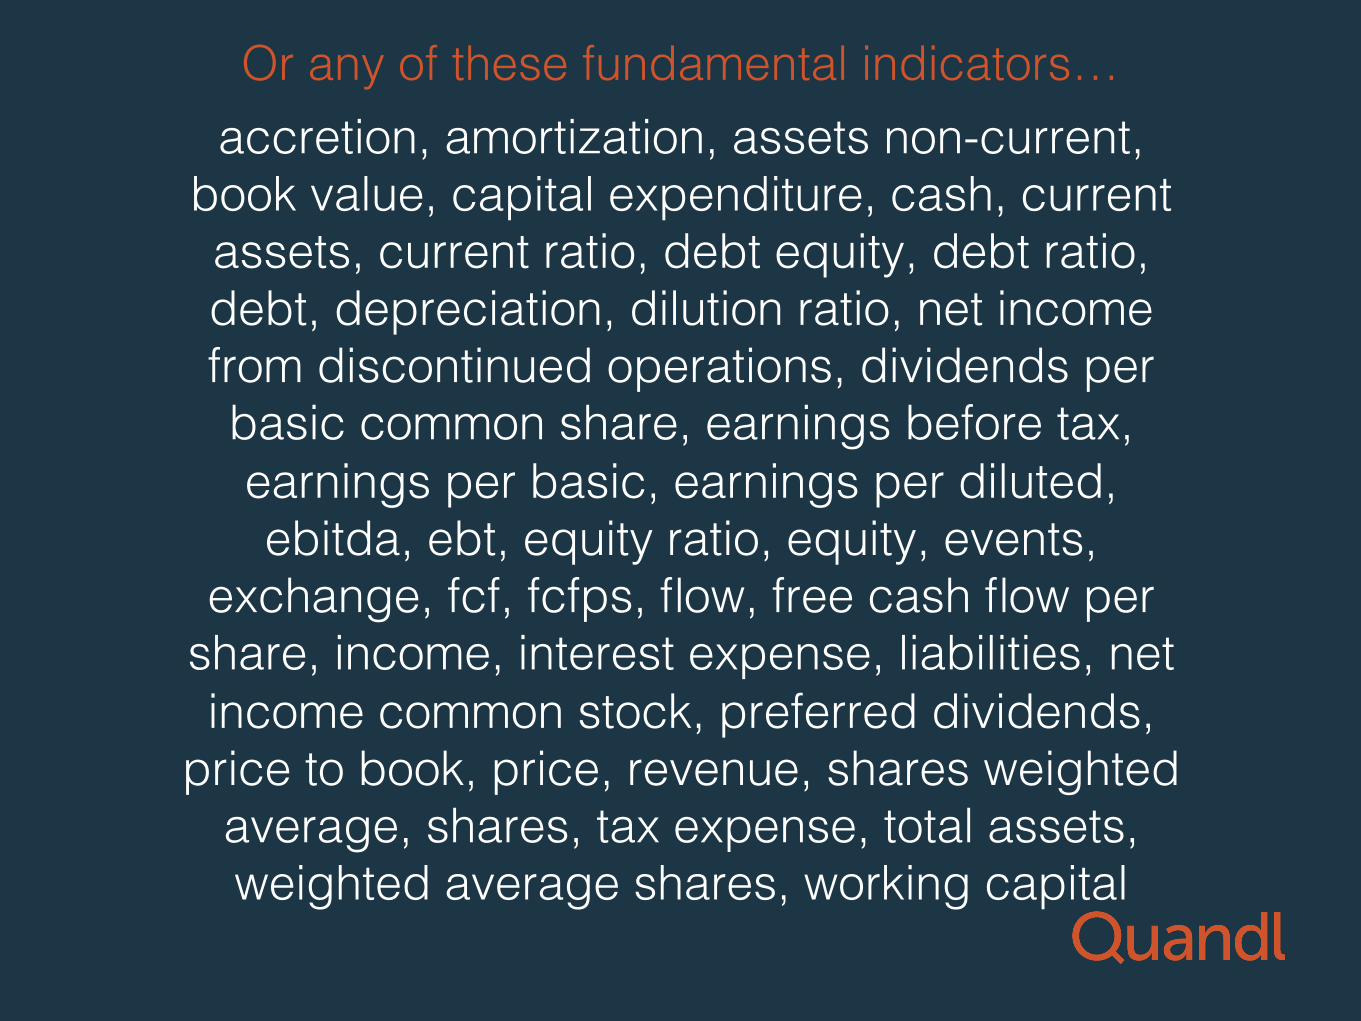
accretion, amortization, assets non-current, book value, capital expenditure, cash, current assets, current ratio, debt equity, debt ratio, debt, depreciation, dilution ratio, net income from discontinued operations, dividends per basic common share, earnings before tax, earnings per basic, earnings per diluted, ebitda, ebt, equity ratio, equity, events,
exchange, fcf, fcfps, flow, free cash flow per share, income, interest expense, liabilities, net income common stock, preferred dividends,
price to book, price, revenue, shares weighted average, shares, tax expense, total assets, weighted average shares, working capital!
Or any of these fundamental indicators…!
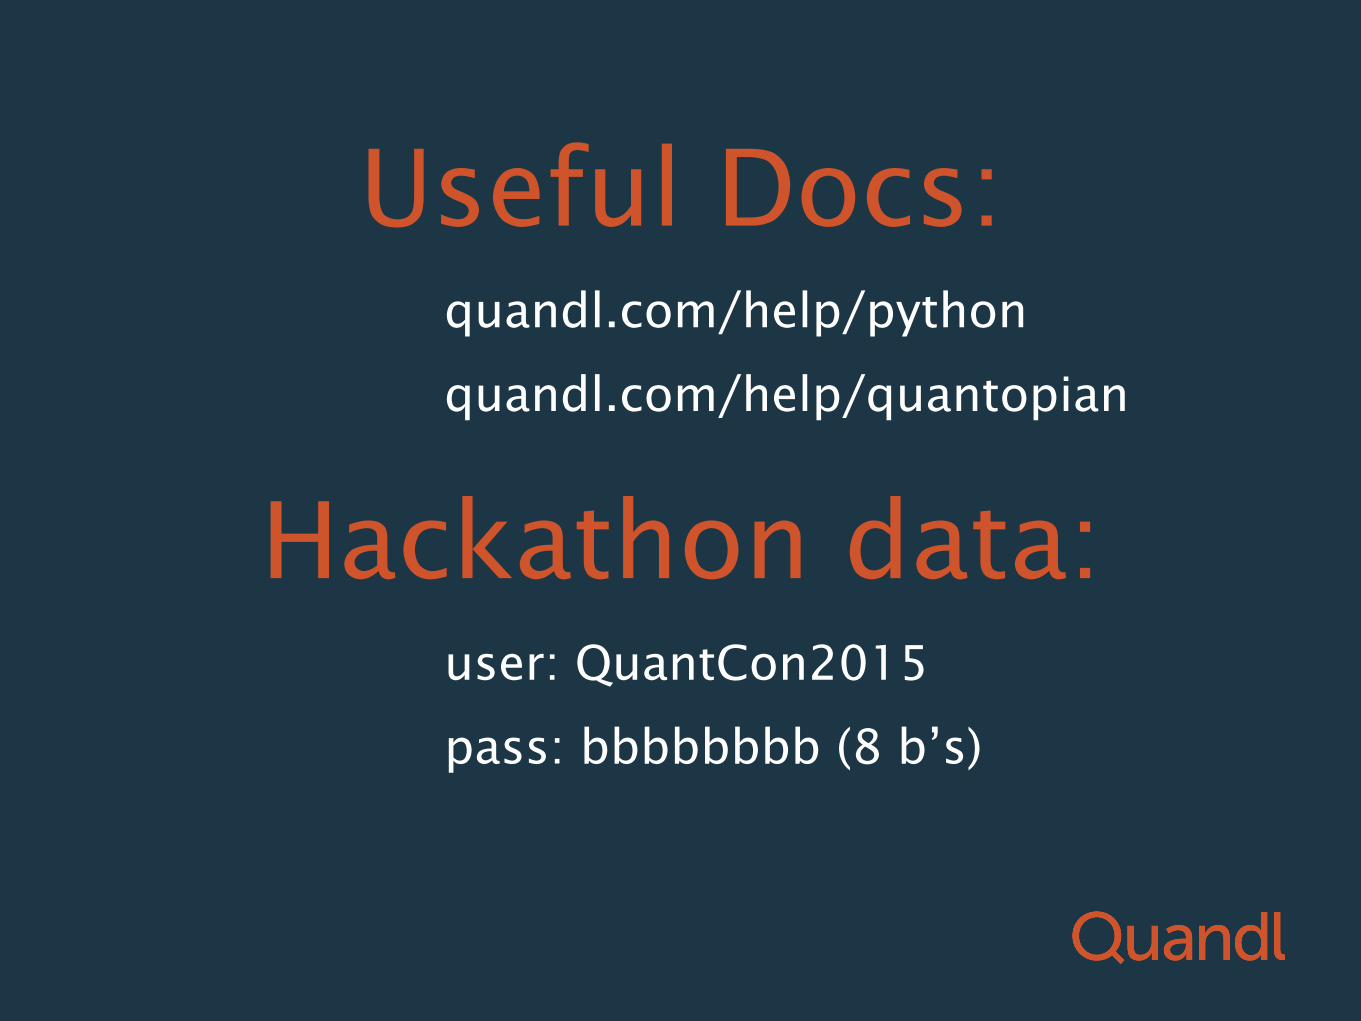
Useful Docs: quandl.com/help/python
quandl.com/help/quantopian
Hackathon data: user: QuantCon2015
pass: bbbbbbbb (8 b’s)