leveraging sas throughout the organization from microsoft ... · paper 223-29 sas® add-in for...
TRANSCRIPT

Paper 223-29
SAS® Add-In for Microsoft Office – Leveraging SAS® Throughout the Organization from Microsoft® Office
Jennifer Clegg, SAS Institute Inc., Cary, NC Stephen McDaniel, SAS Institute Inc., Cary, NC
ABSTRACT The SAS Add-In for Microsoft Office is a Component Object Model (COM) add-in to Microsoft® Excel and Microsoft® Word. The SAS Add-In for Microsoft Office seamlessly exposes the power of SAS data access, reporting, and analytics directly from the familiar environment of Microsoft Office. This paper discusses the capabilities and features of the SAS Add-In for Microsoft Office 1.3. Refer to Appendix A for a list of features by release.
INTRODUCTION Microsoft defines a COM add-in as a program that extends the capabilities of a Microsoft Office application. The SAS Add-In for Microsoft Office uses this COM add-in technology to extend the data access, reporting, and analytic capabilities of Microsoft Excel and Microsoft Word. Once the SAS Add-In is installed, an integrated SAS menu and SAS toolbars are available as part of the Office environment. Using the menu and toolbars you can directly access much of the power of SAS natively. The SAS Add-In for Microsoft Office works with SAS 9.1 servers and later. Using the SAS Add-In for Microsoft Office you can access the power of SAS via three key mechanisms: 1) Data Access - the Add-In gives you the ability to open, query, sort, and browse data via the file system or SAS server accessible data sources (including third party data sources via SAS/ACCESS products) of any size directly from Microsoft Excel. A key advantage of this capability is the ability to access, browse, query, and analyze data sources larger than the Excel imposed row limit of 65,536. 2) SAS Stored Processes – stored processes enable parameterized reporting and analysis. By leveraging this capability, users can access a wide array of SAS content developed by business analysts, statisticians, and programmers. Stored processes are SAS programs that have been parameterized and registered to a SAS Metadata Server. 3) SAS Tasks - using tasks, you can do ad-hoc analysis to manage, summarize, and analyze Excel data or SAS data using a wide range of SAS capabilities, such as regression analysis, linear models, and forecasting. SAS Stored Processes and SAS tasks generate results that display in the Office application.
ARCHITECTURE The SAS Add-In for Microsoft Office is a desktop client interface. When the Add-In for Microsoft Office installs, all necessary SAS components are also installed. No additional SAS install is required on the client PC. The SAS Add-In for Microsoft Office does require the Microsoft .NET Framework. If the .NET Framework is not already on your PC, the SAS Add-In for Microsoft Office setup will install it. See Appendix B for a detailed list of system and software requirements for the SAS Add-In for Microsoft Office. For server side support, the SAS Add-In for Microsoft Office uses the SAS 9.1 Foundation and SAS Foundation Servers of the SAS 9.1 BI Infrastructure. The SAS 9.1 Foundation provides the SAS products to support the powerful data access and analytic capabilities of SAS. The SAS Foundation Servers include SAS Integration Technologies (IT) for enabling client-server communication. SAS Integration Technologies provides distributed object interfaces to SAS software features. SAS Integration Technologies provides access to the following servers used by the SAS Add-In for Microsoft Office. The SAS Metadata Server is a multi-user server that surfaces metadata from one or more SAS metadata repositories. A SAS metadata repository is a collection of related metadata objects that describe enterprise data resources. The SAS Metadata Server is the central information store for SAS 9.1 products. The SAS Add-In for Microsoft Office uses the SAS Metadata Server for identifying the servers, data sources, and stored processes. The SAS Metadata Server also provides the security model allowing you to restrict access by user or group to servers, data sources, and stored processes. The SAS Workspace Server provides a general purpose interface to the SAS Foundation. Clients can access data or submit SAS code for execution using the workspace server. The SAS Add-In for Microsoft Office uses the
1
SUGI 29 Systems Architecture
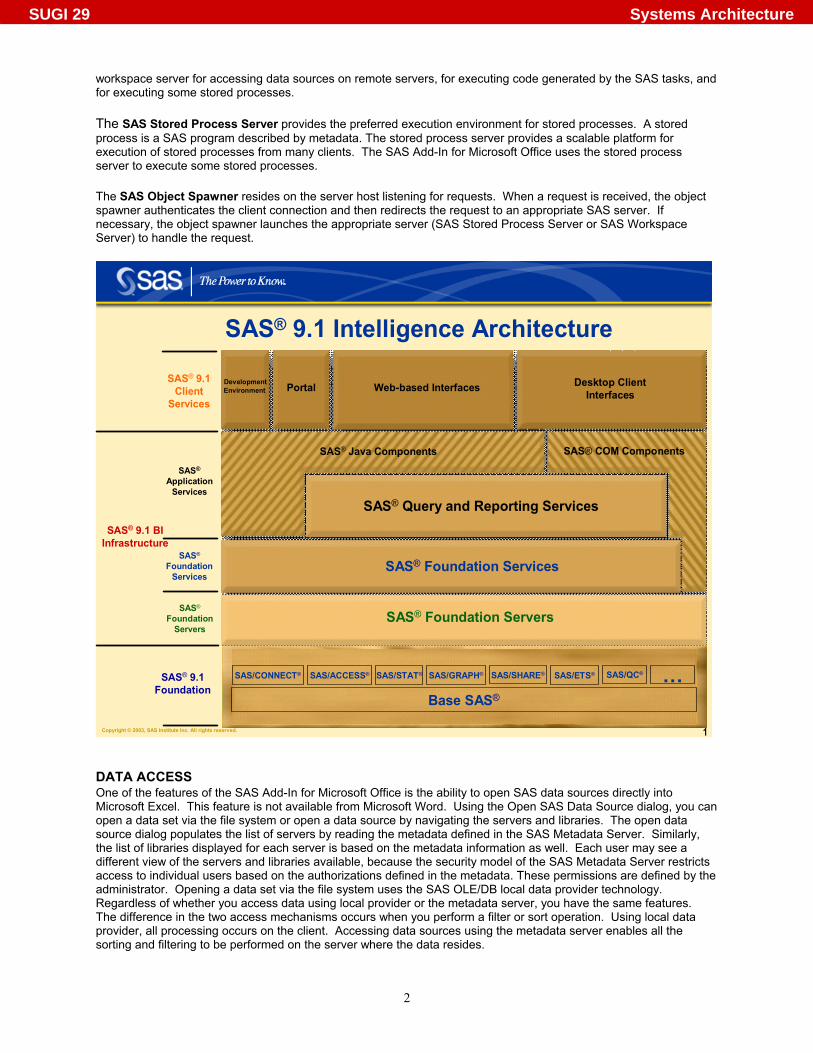
workspace server for accessing data sources on remote servers, for executing code generated by the SAS tasks, and for executing some stored processes. The SAS Stored Process Server provides the preferred execution environment for stored processes. A stored process is a SAS program described by metadata. The stored process server provides a scalable platform for execution of stored processes from many clients. The SAS Add-In for Microsoft Office uses the stored process server to execute some stored processes. The SAS Object Spawner resides on the server host listening for requests. When a request is received, the object spawner authenticates the client connection and then redirects the request to an appropriate SAS server. If necessary, the object spawner launches the appropriate server (SAS Stored Process Server or SAS Workspace Server) to handle the request.
Copyright © 2003, SAS Institute Inc. All rights reserved. 1
SAS® 9.1Foundation
SAS®
Application Services
SAS® 9.1 BIInfrastructure
SAS® 9.1 Intelligence Architecture
SAS® 9.1 Client
Services
SAS® Foundation Servers
SAS® Foundation Services
SAS® Query and Reporting Services
Desktop ClientInterfaces
DevelopmentEnvironment Web-based InterfacesPortal
SAS® COM ComponentsSAS® Java Components
Base SAS®
SAS/CONNECT® SAS/STAT® SAS/SHARE®SAS/ACCESS® SAS/GRAPH® SAS/QC®SAS/ETS® …
SAS®
Foundation Services
SAS®
Foundation Servers
DATA ACCESS One of the features of the SAS Add-In for Microsoft Office is the ability to open SAS data sources directly into Microsoft Excel. This feature is not available from Microsoft Word. Using the Open SAS Data Source dialog, you can open a data set via the file system or open a data source by navigating the servers and libraries. The open data source dialog populates the list of servers by reading the metadata defined in the SAS Metadata Server. Similarly, the list of libraries displayed for each server is based on the metadata information as well. Each user may see a different view of the servers and libraries available, because the security model of the SAS Metadata Server restricts access to individual users based on the authorizations defined in the metadata. These permissions are defined by the administrator. Opening a data set via the file system uses the SAS OLE/DB local data provider technology. Regardless of whether you access data using local provider or the metadata server, you have the same features. The difference in the two access mechanisms occurs when you perform a filter or sort operation. Using local data provider, all processing occurs on the client. Accessing data sources using the metadata server enables all the sorting and filtering to be performed on the server where the data resides.
2
SUGI 29 Systems Architecture
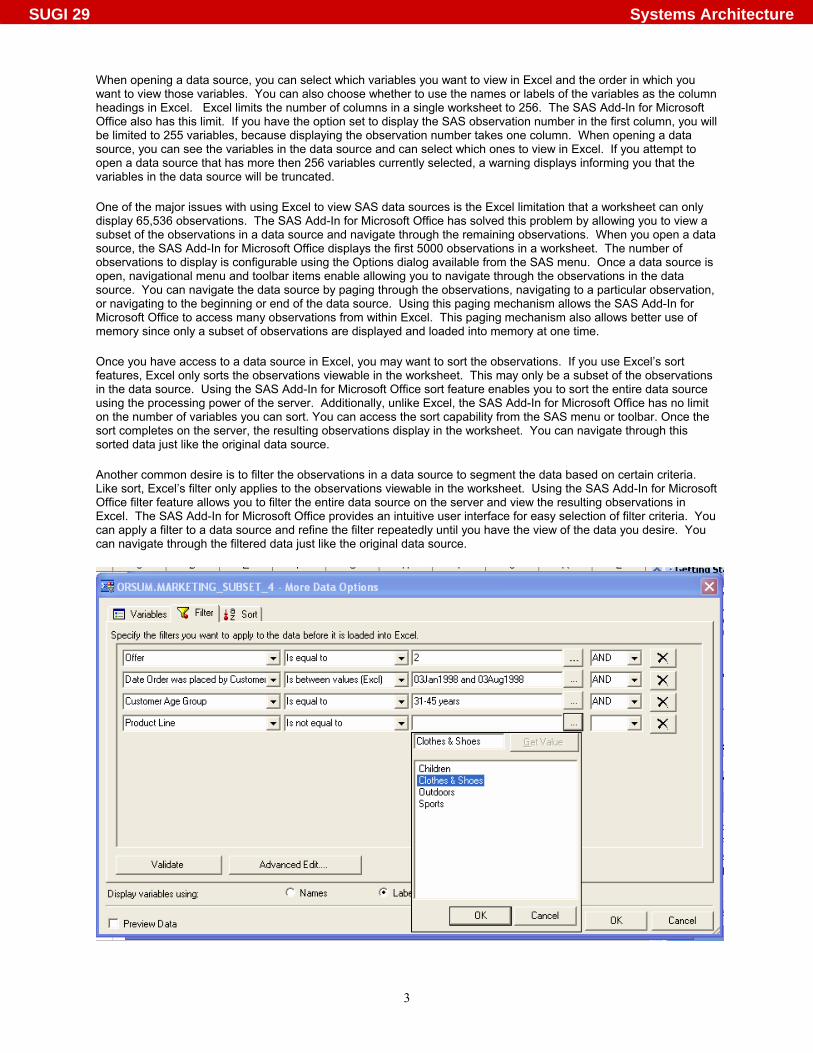
When opening a data source, you can select which variables you want to view in Excel and the order in which you want to view those variables. You can also choose whether to use the names or labels of the variables as the column headings in Excel. Excel limits the number of columns in a single worksheet to 256. The SAS Add-In for Microsoft Office also has this limit. If you have the option set to display the SAS observation number in the first column, you will be limited to 255 variables, because displaying the observation number takes one column. When opening a data source, you can see the variables in the data source and can select which ones to view in Excel. If you attempt to open a data source that has more then 256 variables currently selected, a warning displays informing you that the variables in the data source will be truncated. One of the major issues with using Excel to view SAS data sources is the Excel limitation that a worksheet can only display 65,536 observations. The SAS Add-In for Microsoft Office has solved this problem by allowing you to view a subset of the observations in a data source and navigate through the remaining observations. When you open a data source, the SAS Add-In for Microsoft Office displays the first 5000 observations in a worksheet. The number of observations to display is configurable using the Options dialog available from the SAS menu. Once a data source is open, navigational menu and toolbar items enable allowing you to navigate through the observations in the data source. You can navigate the data source by paging through the observations, navigating to a particular observation, or navigating to the beginning or end of the data source. Using this paging mechanism allows the SAS Add-In for Microsoft Office to access many observations from within Excel. This paging mechanism also allows better use of memory since only a subset of observations are displayed and loaded into memory at one time. Once you have access to a data source in Excel, you may want to sort the observations. If you use Excel’s sort features, Excel only sorts the observations viewable in the worksheet. This may only be a subset of the observations in the data source. Using the SAS Add-In for Microsoft Office sort feature enables you to sort the entire data source using the processing power of the server. Additionally, unlike Excel, the SAS Add-In for Microsoft Office has no limit on the number of variables you can sort. You can access the sort capability from the SAS menu or toolbar. Once the sort completes on the server, the resulting observations display in the worksheet. You can navigate through this sorted data just like the original data source. Another common desire is to filter the observations in a data source to segment the data based on certain criteria. Like sort, Excel’s filter only applies to the observations viewable in the worksheet. Using the SAS Add-In for Microsoft Office filter feature allows you to filter the entire data source on the server and view the resulting observations in Excel. The SAS Add-In for Microsoft Office provides an intuitive user interface for easy selection of filter criteria. You can apply a filter to a data source and refine the filter repeatedly until you have the view of the data you desire. You can navigate through the filtered data just like the original data source.
3
SUGI 29 Systems Architecture

If you prefer to type in SQL code to apply filters, you can use the Advanced Edit dialog. Selecting the Advanced Edit button from the Filter panel invokes a dialog where you can type in SQL code to use as filter criteria. This is an advanced feature and using this dialog requires knowledge and understanding of SQL syntax. Another common activity in Excel is the ability to apply formulas to ranges of cells. With a SAS data source opened into Excel, you can use formulas to further manipulate the data itself. The formulas will apply to the currently visible data cells only. If you refresh the data or navigate to another observation number, the data will update in Excel and the calculations of the formulas will update to reflect the new values of the data. Only formulas that exist outside the cells occupied by the data itself will be retained.
ACCESSING STORED PROCESSES AND TASKS Stored processes and SAS tasks allow you to execute analyses from within Microsoft Excel and Microsoft Word. In the SAS Add-In for Microsoft Office you can access the list of stored processes and SAS tasks available to you using the Browse SAS Programs dialog. Once the SAS Add-In for Microsoft Office is installed, you can access the Browse SAS Programs dialog using the SAS menu or toolbar. The Browse SAS Programs dialog includes a list of favorites (shortcuts to commonly used stored processes or SAS tasks), the list of stored processes you are authorized to view, and the list of SAS tasks available to you. You can execute a stored process or SAS task from this dialog by simply selecting the item you want to run and pressing the run button or by double-clicking the item. You can execute items shown in the Favorites list in this dialog in the same manner. You can add stored processes or SAS tasks to the favorites list. To add an item, simply right mouse button click the item in the Stored Processes or SAS Tasks tree and select to add the item to Favorites. Favorites allow you to organize stored processes and SAS tasks into folders if you desire. Adding an item to Favorites makes it display on a SAS toolbar dropdown menu named My SAS Favorites. This menu allows you to run a stored process or a SAS task without invoking a dialog to select it. Selecting the Manage Favorites menu item invokes this same dialog for easy manipulation of your favorite shortcuts. A snapshot of the Browse SAS Programs dialog is shown below.
4
SUGI 29 Systems Architecture

STORED PROCESSES Stored Processes are SAS programs stored centrally on a server. Stored processes enable you to centrally maintain and manage code, give you better control over changes, enhance security and application integrity, and ensure that every client executes the latest version of code that is available. Stored processes are like other SAS programs except they have an additional feature that enables customization of the program's execution. This feature enables a client such as the SAS Add-In for Microsoft Office to supply parameters at the time the stored process is executed. To make a SAS program work well as a stored process you should modify the code to include the %STPBEGIN and %STPEND macros. These macros provide standardized functionality for generating and delivering output from a stored process. Using these macros enables you to write stored processes that generate content in a variety of formats and styles with minimal programming effort. The %STPBEGIN macro initializes the Output Delivery System (ODS) to generate output from the stored process. The %STPEND macro terminates ODS processing and completes delivery of the output to clients such as the SAS Add-In for Microsoft Office. An example stored process is shown below.
%global gender; %stpbegin; /* initialize ODS processing of output */ proc print data=sashelp.class where (sex = “&gender”); run; %stpend; /* terminate ODS processing of output */
In this program we are executing a proc print of the SASHELP.CLASS data set and filtering the results based on the setting of the gender macro variable. To execute this code from the SAS Add-In for Microsoft Office or any other client you need to register this program to the SAS Metadata Server as a stored process. Two tools for performing this registration are SAS Enterprise Guide 2.1 or later and the SAS Management Console 9.1. Enterprise Guide is a project oriented desktop client designed to enable quick access to much of the analytic power of the SAS System for statisticians, business analysts, and SAS programmers. The SAS Management Console is an administrative tool that performs other administrative functions in addition to allowing you to register stored processes. When registering this stored process, you would register one parameter named gender to let the user dynamically determine which observations display when this stored process executes. The prompt for this example is shown below.
A prompt for a more complex stored process is shown below.
5
SUGI 29 Systems Architecture
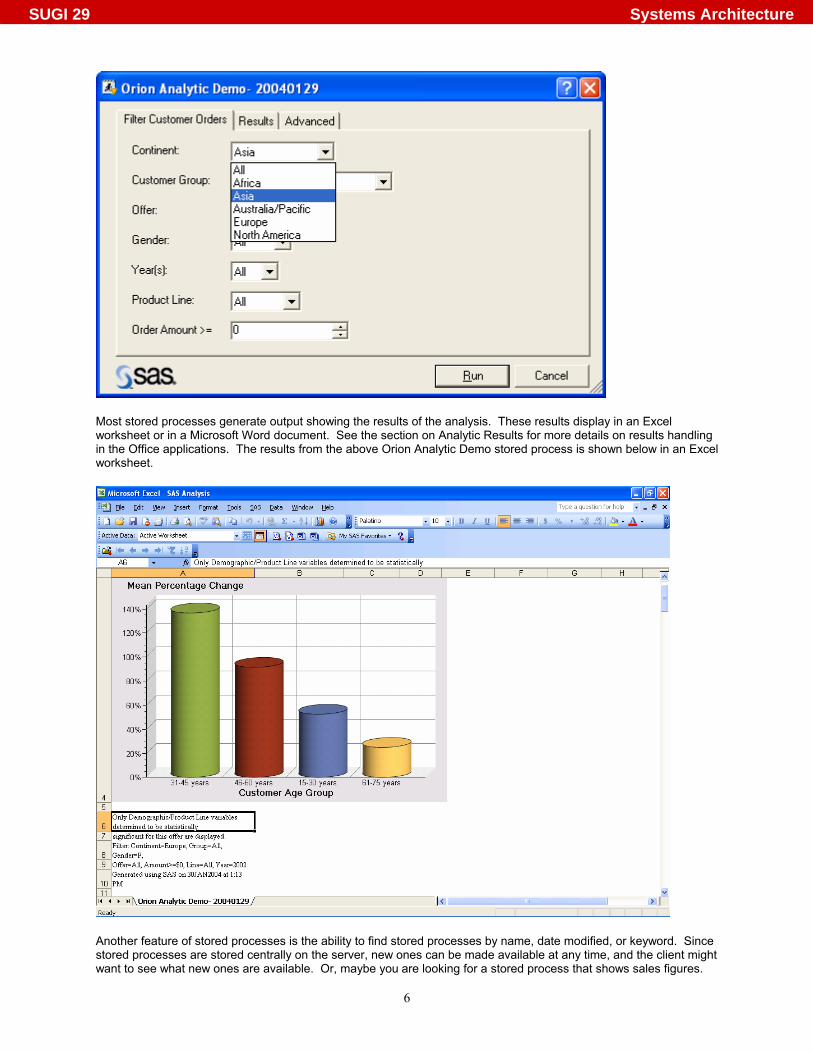
Most stored processes generate output showing the results of the analysis. These results display in an Excel worksheet or in a Microsoft Word document. See the section on Analytic Results for more details on results handling in the Office applications. The results from the above Orion Analytic Demo stored process is shown below in an Excel worksheet.
Another feature of stored processes is the ability to find stored processes by name, date modified, or keyword. Since stored processes are stored centrally on the server, new ones can be made available at any time, and the client might want to see what new ones are available. Or, maybe you are looking for a stored process that shows sales figures.
6
SUGI 29 Systems Architecture

You can search the available stored processes to see if a stored process exists with this capability. You can use the Find Stored Processes dialog to do these types of searches. This dialog is available from the Browse SAS Programs dialog. The Find toolbar and menu item is enabled only when a node in the stored process tree is highlighted. The Find Stored Processes dialog is shown below.
SAS TASKS SAS tasks are a set of dialogs to guide you through an analysis. The SAS tasks available in the SAS Add-In for Microsoft Office are the same tasks available in Enterprise Guide 3.0. Approximately 60 tasks ship with the SAS Add-In for Microsoft Office. The tasks encompass many of the common types of analyses done using SAS. The tasks provide a way to execute an analysis using the powerful statistics of SAS without any knowledge of the SAS language. The tasks generate code on the client machine based on user selections. This code is submitted to a SAS Workspace Server to generate results. The results display in an Excel worksheet or Microsoft Word document. See the section on Analytic Results for more details on results handling in the Office applications. The tasks require an input data source to know what data to act upon. The SAS Add-In for Microsoft Office provides an active data source concept to allow you to select a data source to use for analyses. Using the active data source concept allows you to select a data source and use it for multiple analyses without having to specify the data source each time you run a task. The active data source can be the active Excel worksheet, a SAS data source opened into Excel, or a SAS data source referenced from Excel. By default, active data is set to the active worksheet, meaning the task will use the contents of the active worksheet as the data source. If the worksheet contains Excel data, the task generates a CARDS statement defining the cells in the worksheet as a temporary data set. This temporary data set is used as the data source for the generated analysis code. To analyze SAS data without opening the data source into Excel, drop down the active data combo and choose Select SAS Data Source. Selecting a data source in this way will make this data source the active data for tasks but will not open the data source into the worksheet. If you are using the SAS tasks to perform analyses using a variety of data sources, you can set an option in the Options dialog to be prompted for a data source each time you execute a task.
7
SUGI 29 Systems Architecture
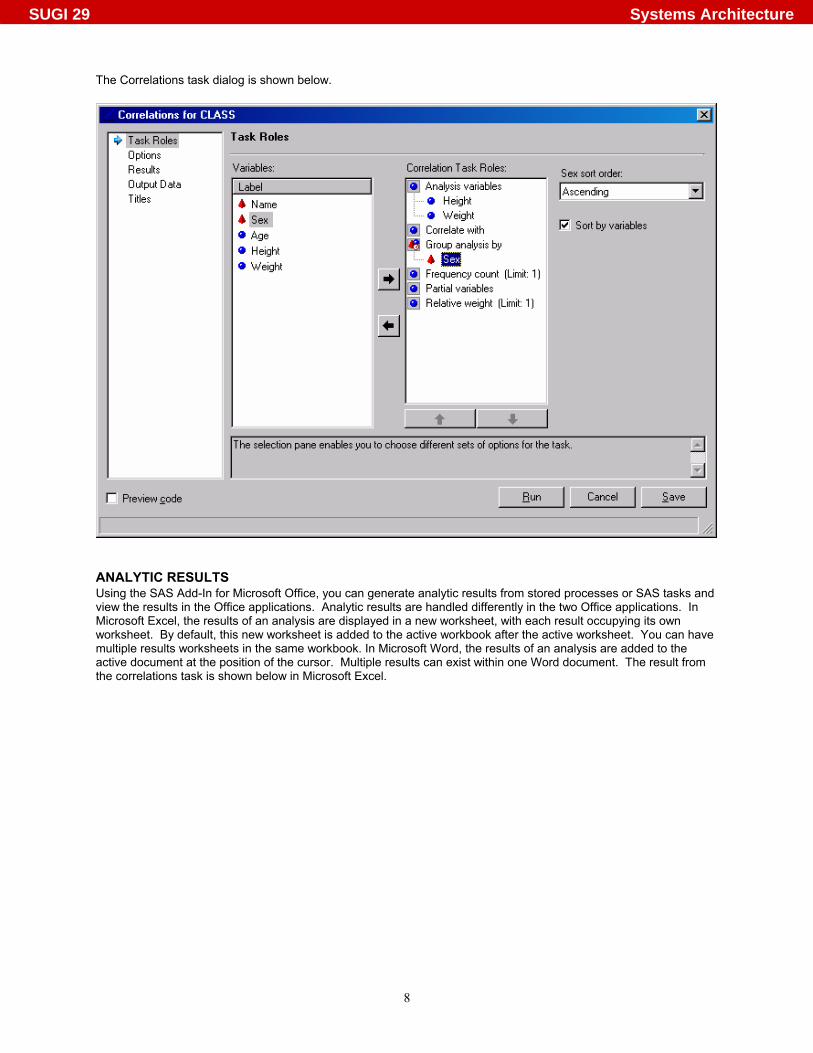
The Correlations task dialog is shown below.
ANALYTIC RESULTS Using the SAS Add-In for Microsoft Office, you can generate analytic results from stored processes or SAS tasks and view the results in the Office applications. Analytic results are handled differently in the two Office applications. In Microsoft Excel, the results of an analysis are displayed in a new worksheet, with each result occupying its own worksheet. By default, this new worksheet is added to the active workbook after the active worksheet. You can have multiple results worksheets in the same workbook. In Microsoft Word, the results of an analysis are added to the active document at the position of the cursor. Multiple results can exist within one Word document. The result from the correlations task is shown below in Microsoft Excel.
8
SUGI 29 Systems Architecture

When you save a workbook or document containing analytic results, the information defining the analysis is also saved and stored as part of the workbook or document. When you open the results later, the analysis result will still be displayed. In addition, you can refresh the results of the analysis by selecting the Refresh toolbar button or menu item. If the stored process program has been modified or if the data source used in the stored process or SAS task has changed, you may want to refresh your results to get an updated copy. For example, suppose you ran a summary statistics task using a SAS data source as the input. If the SAS data source is later updated, you can re-open the worksheet and refresh the analysis. When you select Refresh, the task prompt will display, initialized with the values that generated the current result. When you select Run, the analysis will re-execute and replace the results in the worksheet or document with the updated version. Stored processes work the same way. If you have multiple results to refresh in the same workbook or document, you can use the Refresh Multiple dialog. The Refresh Multiple dialog will scan the active workbook or document to find all analytic results generated by SAS. The dialog will display these results and let you selectively choose which ones to refresh. In Excel, the Refresh Multiple dialog will also display any worksheets in the active workbook containing SAS data sources. If you select to refresh a data source, the SAS Add-In for Microsoft Office will retrieve the latest copy of the data and replace the contents in the worksheet. Using these techniques you can create workbooks or documents of standard reports and refresh the reports as needed to reflect the latest data. A snapshot of the Refresh Multiple dialog is shown below:
9
SUGI 29 Systems Architecture

You can email a workbook or document containing analytic results to another person. That person will be able to view the results even if they don’t have the SAS Add-In for Microsoft Office installed. If the person has a connection to the same SAS Metadata Server, they can also update the results using the Refresh capabilities. Results display in a worksheet in Microsoft Excel. You can generate results in HTML (HyperText Markup Language) or CSV (comma-separated values) format. If you are using HTML, results include formatting. You can modify the format using the Style Manager. The Style Manager is available from the SAS menu or from the Options dialog. With the Style Manager you can select from pre-defined style sheets supplied by SAS or you can create and select your own custom style sheets. For your own custom style sheets you can define colors, fonts, background images, and more. The custom style sheets allow you to add a company letterhead or background image for all of your results. Using HTML you can also generate graphs. By default, the graphs display using the ActiveX format. This format embeds the graphical output into a single file and produces an interactive image. With the interactive image you can hover over points on the graph to see detailed information about a particular data point. HTML sometimes generates large files depending on the amount of data and the formatting. If you are only interested in the values generated by the analysis, you may want to use CSV format. With CSV, no formatting of the results is applied. Consequently, the results will be much smaller and will load more quickly into Excel. When using CSV format, no graphs will display. In Microsoft Word you also have two choices of result formats. You can generate results in HTML just like Microsoft Excel. HTML is the default format in Word just like Excel and has the same features. However, in Word, the graphs are not interactive by default. Word does not activate COM objects by default. If you want to see the values of points as you hover over them, you will need to right mouse button click on the graph and select edit. This will enable the interactivity of the graph. You can also choose to generate results in Microsoft Word using RTF (Rich Text Format). RTF is a native Word format and displays much like HTML. With RTF format, the ActiveX and ActiveX image format for graphs are not supported. You must select one of the static formats (GIF, JPEG, or PNG) for displaying graphs. The SAS Add-In for Microsoft Office exposes a variety of formats for graph output. You can select between ActiveX, ActiveX Image, GIF, JPEG, or PNG. Each format has its own advantages. ActiveX is interactive as described above. ActiveX Image also provides some degree of interactivity. The other formats are static representations. The Office applications do not have the same issue with ActiveX format that web applications often exhibit. If you generate graphs using ActiveX format and mail the resulting worksheet or document to someone who does not have the SAS/Graph ActiveX control, the recipient will be able to view a static version of the graph without needing to download the SAS/Graph ActiveX control.
CUSTOMER EXPERIENCES During the latter half of developing the initial release of SAS Add-In for Microsoft Office, SAS worked with a variety of customers to provide validation and feedback on product functionality, utility, and ease of use. Three experiences collaborating with customers are summarized in this section. At the conclusion of the reviews, each customer expressed strong interest in moving the SAS Add-In for Microsoft Office and the overall SAS BI Server offering to production usage in their organization.
10
SUGI 29 Systems Architecture

Life Sciences Company- Sales and Marketing Division
Situation The department we worked with had already developed an informal data warehouse focused on
operational sales and marketing data. This warehouse had been created using a wide variety of SAS programs developed over several years.
This company was expanding usage of Enterprise Guide among their advanced marketing analysts. However, Enterprise Guide was viewed as too advanced for many users in their marketing teams.
A competing BI vendor’s OLAP solution was deployed and was moderately useful. It was perceived as limited for reporting and more complex analyses such as forecasting.
The typical marketing user we targeted with the Add-In was an expert at Excel and often exported results to Excel from other BI tools or asked the SAS team to deliver results in Excel.
A key requirement identified by the customer was to find an easy to learn application for marketing analysts that would leverage their SAS investment and expertise while enabling ad-hoc data access and analysis.
Implementation We conducted a whiteboard overview of the new SAS 9.1 Business Intelligence Architecture and the
role of the Add-In in this overall offering. We installed and configured the server side SAS Foundation and SAS Business Intelligence Server
components. Client installation of the Add-In was performed on several users’ PCs. We conducted some server administrative training covering:
Server architecture and capabilities A demonstration of the SAS Management Console A walk-through of common administrative activities: server configuration, load balancing, user
and group management, stored process management, and data administration. We concluded with a review of stored process content development and deployment:
How to create stored processes from current and new SAS content How to publish and secure via Enterprise Guide Security management- determined by stored process folder security rights. Maintenance of stored processes from Enterprise Guide and implications to users.
Results Analysts, users, and management agreed that they are very interested in pursuing the production
deployment of the BI Server and are excited about the many possibilities enabled from this expanded usage of SAS. Some examples:
Market forecasting team will likely switch from a basic desktop forecasting tool to ETS stored processes.
The SAS team will be able to leverage years of reports directly to users in a far more interactive form.
The legal team will have direct ad-hoc access to key data, bypassing consistent slow-downs for information research requests.
The marketing team believes they will have much better access to decision-making capabilities in a timelier manner.
Several other areas of the company became interested in the overall BI Server because of the Add-In review program.
Financial Services Company- Risk Assessment and Management Division
Situation The department we worked with supports risk and financial teams for their company. They had already
been aggressively expanding SAS end-user access via Enterprise Guide, growing from 20 to 200 users in several years.
They wanted to expand SAS to all analysts including less technical ones. A key requirement was to have an easy to use interface with a minimal learning curve, yet powerful
capabilities. They were also seeking to phase out a variety of other BI tools and custom apps developed over the
years with SAS and centralize with a more manageable system. Implementation
Similar overall implementation and training pattern to the above mentioned life sciences company Performance testing of various customer queries and analyses showed significant performance
improvements over SAS 8.2, some by a factor of 5X.
11
SUGI 29 Systems Architecture

Results Management is committed to moving forward with the SAS BI Server to expand corporate insight and
analytic capabilities across various departments. This effort created excitement from the executive level down about enabling intuitive analytic capabilities
across their risk and financial teams. The company sees this capability as key to expanding SAS usage across the entire company in the
future. Research University- Scientific Research and Monitoring Spin-off
Situation This research unit manages government data key to many academic, corporate, and government
researchers across the country. They have been using SAS IntrNet to deliver predefined, secured content to these users for several
years. Users have expressed interest in more dynamic data access and analysis capabilities, and in receiving
content in Excel form. The research unit sees the Add-In for Microsoft Office as key to expanding usage and increasing their
service revenue and customer satisfaction. Implementation
Similar overall implementation and training pattern to the above mentioned life sciences company with a somewhat shorter time to implement due to a less complex operational environment.
Results They are very optimistic that this will be a solid investment that will be well accepted by their customers.
Customer Experience Conclusions
Existing SAS customers will be able to leverage their knowledge of SAS by expanding the use of SAS to less technical consumers.
For new SAS customers, additional insight can be gained over traditional BI tools by adding the power of SAS analytics to a solid and comprehensive BI suite.
The SAS Add-In for Microsoft Office helps transform perceptions of SAS from a niche product for just the experts to a powerful and accessible system for any type of user. It is part of an overall system that bridges the gap between traditional BI and analytics in an intuitive and maintainable framework.
CONCLUSION The SAS Add-In for Microsoft Office leverages the knowledge base of many workers by bringing the powerful statistics of SAS to the applications with which they are familiar. The ability to execute analytics directly from Microsoft Excel and Microsoft Word brings new capabilities to the Office environment and allows a familiar user experience. In the past, SAS has provided ways to integrate with Office applications. Most of these solutions required using SAS to export data or results to the Office applications. The SAS Add-In for Microsoft Office takes a much different approach by leveraging your knowledge of Microsoft Office and bringing the capabilities of SAS directly to a familiar environment. The SAS Add-In for Microsoft Office gives Microsoft Office users The Power to Know®.
12
SUGI 29 Systems Architecture

CONTACT INFORMATION Your comments and questions are valued and encouraged. Contact the authors at:
Jennifer Clegg Senior Manager – Software Development SAS Institute Inc. R-3227 SAS Campus Drive Cary, NC 27513 Work Phone: 919-531-6711 Fax: 919-677-4444 Email: [email protected] Stephen McDaniel Product Manager – Business Intelligence SAS Institute Inc. R-A328 SAS Campus Drive Cary, NC 27513 Work Phone: 919-531-0450 Email: [email protected]
SAS and all other SAS Institute Inc. product or service names are registered trademarks or trademarks of SAS Institute Inc. in the USA and other countries. ® indicates USA registration. Other brand and product names are trademarks of their respective companies.
13
SUGI 29 Systems Architecture

APPENDIX A – SAS ADD-IN FOR MICROSOFT OFFICE FEATURES LIST BY VERSION These features apply to Microsoft Excel and Microsoft Word unless explicitly specified. Version Feature 1.0 Open any size SAS data source into Microsoft Excel Filter SAS data source using SQL syntax in Microsoft Excel Sort SAS data source in Microsoft Excel Refresh SAS data source in Microsoft Excel Execute stored processes and view results in Office applications Execute experimental SAS tasks and view results in Office applications Refresh results Provide estimate of time to refresh each analysis/ when refreshing multiple items Send results from Microsoft Excel to Microsoft Word Provide favorites support - shortcuts to commonly used stored processes or SAS tasks 1.2 Filter SAS data source using an intuitive user interface in Microsoft Excel Filter SAS data source using an advanced SQL function builder in Microsoft Excel Sort SAS data source by unlimited number of variables in Microsoft Excel Sort, filter, and order columns when opening SAS data source in Microsoft Excel Retain Excel formulas that surround SAS data source when you refresh Search for stored processes by name, date, or keyword Ability to create custom styles for results 1.3 Execute large selection of production SAS tasks
14
SUGI 29 Systems Architecture
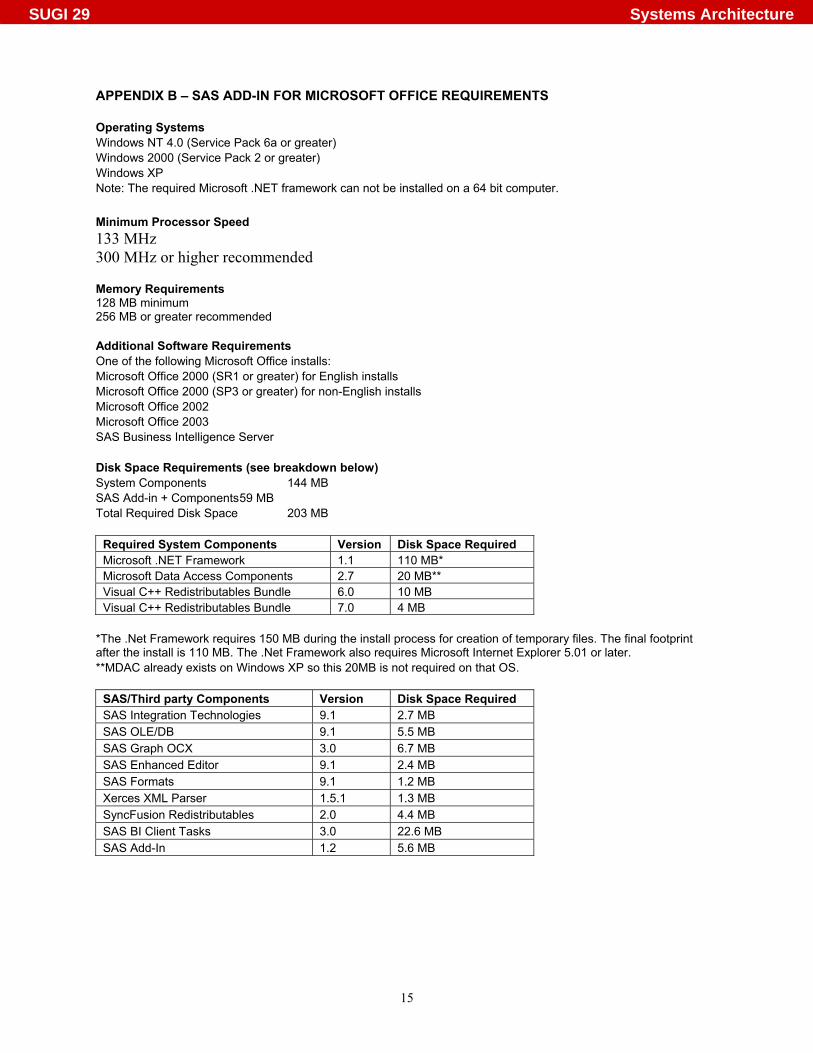
APPENDIX B – SAS ADD-IN FOR MICROSOFT OFFICE REQUIREMENTS Operating Systems Windows NT 4.0 (Service Pack 6a or greater) Windows 2000 (Service Pack 2 or greater) Windows XP Note: The required Microsoft .NET framework can not be installed on a 64 bit computer. Minimum Processor Speed 133 MHz 300 MHz or higher recommended Memory Requirements 128 MB minimum 256 MB or greater recommended Additional Software Requirements One of the following Microsoft Office installs: Microsoft Office 2000 (SR1 or greater) for English installs Microsoft Office 2000 (SP3 or greater) for non-English installs Microsoft Office 2002 Microsoft Office 2003 SAS Business Intelligence Server Disk Space Requirements (see breakdown below) System Components 144 MB SAS Add-in + Components 59 MB Total Required Disk Space 203 MB
Required System Components Version Disk Space Required Microsoft .NET Framework 1.1 110 MB* Microsoft Data Access Components 2.7 20 MB** Visual C++ Redistributables Bundle 6.0 10 MB Visual C++ Redistributables Bundle 7.0 4 MB
*The .Net Framework requires 150 MB during the install process for creation of temporary files. The final footprint after the install is 110 MB. The .Net Framework also requires Microsoft Internet Explorer 5.01 or later. **MDAC already exists on Windows XP so this 20MB is not required on that OS.
SAS/Third party Components Version Disk Space Required SAS Integration Technologies 9.1 2.7 MB SAS OLE/DB 9.1 5.5 MB SAS Graph OCX 3.0 6.7 MB SAS Enhanced Editor 9.1 2.4 MB SAS Formats 9.1 1.2 MB Xerces XML Parser 1.5.1 1.3 MB SyncFusion Redistributables 2.0 4.4 MB SAS BI Client Tasks 3.0 22.6 MB SAS Add-In 1.2 5.6 MB
15
SUGI 29 Systems Architecture