leveraging six sigma tools and methodology to … six sigma is a business improvement strategy that...
TRANSCRIPT
American Journal of Operations Research, 2016, 6, 261-274 Published Online July 2016 in SciRes. http://www.scirp.org/journal/ajor http://dx.doi.org/10.4236/ajor.2016.64026
How to cite this paper: Arafeh, M. (2016) Leveraging Six Sigma Tools and Methodology to Improve Student English Lan-guage Performance at Elementary School. American Journal of Operations Research, 6, 261-274. http://dx.doi.org/10.4236/ajor.2016.64026
Leveraging Six Sigma Tools and Methodology to Improve Student English Language Performance at Elementary School Mazen Arafeh The Department of Industrial Engineering, Faculty of Engineering & Technology, The University of Jordan, Amman, Jordan
Received 11 April 2016; accepted 21 June 2016; published 24 June 2016
Copyright © 2016 by author and Scientific Research Publishing Inc. This work is licensed under the Creative Commons Attribution International License (CC BY). http://creativecommons.org/licenses/by/4.0/
Abstract Purpose: The purpose of this paper is to discuss how the Six Sigma (SS) methodology can be used to improve the performance of students in English as a second language and enhance the teaching process by utilizing quality tools in an educational environment. Design/Methodology/Approach: The paper uses the different quality improvement tools within the Define, Measure, Analyze, Im-prove and Control (DMAIC) phases to improve student performance in an English language class at a private school. Findings: Quality tools, such as cause and effect diagrams and quality function deployment, have been successfully applied within the Six Sigma DMAIC framework in the educa-tional sector to improve the performance of students and enhance the teaching process. Practical Implications: This paper helps school administrations to analyze student performance and im-plement improvement actions to improve their performance. Originality/Value: The principal ob-jective of this paper is to demonstrate how quality improvement tools can be introduced and suc-cessfully applied in an elementary school to improve student performance and communication between the school administration, teachers and parents.
Keywords Six Sigma, DMAIC, Educational Environment, Quality Improvement Tools, Teaching Process
1. Introduction Six Sigma is a business improvement strategy that attempts to improve the effectiveness and efficiency of all operations (or processes) that deal with customer needs and expectations [1].

M. Arafeh
262
Since its inception at Motorola in the mid-1980s [2], this powerful business management strategy has been exploited by many world class organizations such as General Electric, Honeywell, Bombardier, ABB, Sony, to name but a few in a long list [3].
Six Sigma improvement initiatives are usually deployed through the Define, Measure, Analyze, Improve and Control (DMAIC) phases [4]. DMAIC is widely used when a product or process is already in existence but its performance is inadequate [5]. The DMAIC phases lay out a clear strategy for the deployment of SS projects [6].
Six Sigma as it is today has evolved from mere measurement of quality to an overall business improvement strategy for a large number of companies around the world. Six Sigma applications in the service sector are widespread and have been embraced by many healthcare institutions [7]-[9], financial institutions [10] [11], the construction industry [12] [13], hospitality and tourism [14] and governmental organizations [15].
2. Literature Review A pilot study using the Six Sigma methodology was conducted by Hargrove and Burge [16] to assess, evaluate and monitor variation in student performance in the curriculum. The focus of the study was on the performance of minority and under-represented students in science and engineering programs. Specifically, the authors wanted to “retain the students currently enrolled, increase graduation rates, and the result is a more efficient process of producing well-qualified engineers to meet the technological needs of our nation.” They identified three critical success factors: the need for increased financial aid, faculty development and the improvement of instructional quality.
Burtner [17] described a proposal to adapt Six Sigma process improvement methods in engineering education at Mercer University. The implementation of Six Sigma involved a systems approach to problem solving and emphasized the three C’s: common metrics, constant communication and culture change. Four potential Six Sigma projects were identified at the Mercer University School of Engineering, and these addressed issues ranging from retention and student success in mathematics classes, a reduction in the amount of time taken by students to graduate from an engineering program and the success of women as engineering students.
Hoerl and Bryce [18] discussed the current status of Six Sigma in universities as well as its potential influence in an academic environment. As a proven successful strategy in many business organizations, it is largely un-der-applied in university settings. Applying Six Sigma in a university is difficult due to the intangible nature of the educational product, the diversity of departmental and individual goals and viewpoints, and the administra-tive focus on seeking funding for the university’s programs.
Holmes et al. [19] listed several differences in implementing Six Sigma projects in a university environment rather than in manufacturing. The nature of the product, customer definition, quality measurement and employee reward systems differ significantly. A university is in full operation for only nine months of the academic year. A company operates for 12 months annually and it can also be more outcome-oriented. On the other hand, shared governance in academia can lead to a much slower decision making process. Students at a university are also partially responsible for their own learning-this single factor complicates the problem significantly The challenges include the difficulty in defining the customer for a university, the nature of the product, and the dif-ficulty of measuring quality and reward systems for employees.
A study by Jenicke et al. [20] focused on identifying critical factors for implementing Six Sigma in academic institutions such as universities. They proposed a comprehensive framework that would guide academic institu-tions planning to implement Six Sigma.
Kaushik and Khanduja [21] reviewed the implications of applying Six Sigma methodology at a technical in-stitute to increase the passing rate of students.
Prasad et al. [22] presented a case study that was undertaken in a reputed engineering educational institution in Southern India.
Ramasubramanian [23] discussed the role of Six Sigma for transforming higher education and outlined how Six Sigma may be used in the operation of all of the existing work processes in an institution in the best possible manner.
Dhariwal and Bhagchandani [24] presented a case in which they applied the Six Sigma DMAIC approach in an undergraduate technical institute in Dubai, UAE, to improve student performance in a course named “Intro-duction to Operations Research” (OR).
This paper presents the results of a case study in a private elementary school that has applied the Six Sigma

M. Arafeh
263
DMAIC methodology to improve student performance in English. The difficulty of measuring some aspects re-lating to human knowledge made the application of Six Sigma in education research rather challenging; however, the facts suggest that different fields in the educational institutions can be significantly improved by applying the Six Sigma methodology as shown in Figure 1 [25].
3. Background We considered the English Language Department (ELD) at a private school. Specifically, the primary depart-ment consists of the first three grades with 27 classrooms and a total enrollment of 697 students. The ELD con-sists of 14 teachers in the primary department, who teach the McGraw Hill Reading curriculum (Table 1).
The school has started an English Language Intensive Program (ELIP), and students who perform poorly are encouraged to enroll in the program. The ELIP consists of an additional two periods a week to improve the stu-dents’ basic English language skills.
4. Methodology 4.1. Define The Define phase of the DMAIC process is often skipped or short-changed, but it is vital to the overall success of any Six Sigma project. The objective of this first stage is to determine what needs to be improved. A clear project definition is vital to the success of the SS project implementation. The deliverables for this phase are: 1) the team formation, 2) the preliminary process map, 3) the Voice of the Customer (VOC) and 4) the project charter.
The improvement team was composed of Six Sigma black belt and Six Sigma green belt candidates, the process owner (the head of the ELD) and the project champion (an industrial engineer in charge of the quality department in the school).
Figure 1. Common fields in education can be improved by applying Six Sigma [25].

M. Arafeh
264
Table 1. Student enrollment distribution.
Grade Classification
Number of Students in a Class (Range)
Number of Students (Male & Female )
Number of Classes
Number of Teachers
Number of English Periods Weekly*
First 18 - 25 238 10 5 9
Second 26 - 29 219 9 3 9
Third 25 - 29 240 8 3 7
*Each period is 45 minutes.
An SIPOC diagram was created to solidify each member’s understanding of the teaching process. The SIPOC diagram is shown in Figure 2 and is used to identify the relevant elements of the process.
The SIPOC diagram helps to define the process boundaries and identify the stakeholders. The teaching process starts with preparation and ends with evaluation.
A brainstorming session with all of the team members was conducted to gather relevant information. The many ideas that were generated were sorted using an affinity diagram.
The team decided to consider students with grades below a threshold as requiring special attention and en-courage these students to attend the ELIP.
The percentage of students requiring special attention was used as a key performance indicator. The percen-tage of students requiring special attention was based on first grade students with grades below 79% and second and third grade students below 75%. The the percentage of students requiring special attention at the beginning of the project is 13% which as considered high by the school administration.
The project objective was to improve student performance by lowering the percentage of students requiring special attention to an upper specification limit (USL) of 10%.
4.2. Measure The second step in the SS−DMAIC process is to measure the data and organize it in a way that is easily accessi-ble for interpretation and analysis. This is a very important process that helps to better understand the problem in order to reach a solution. An important step in the measure phase is data collection.
Data Collection The team decided that the best approach for collecting the data was via observations, interviews, surveys and
school visits, as illustrated in Figure 3. The Curriculum A focus group of six qualified experts in the field of English instruction and curriculum studies directed by
the head of the ELD conducted a study to evaluate the curriculum and the learning outcomes. The focus group also compared the current curriculum (McGraw Hill Reading) to others and concluded that the current curricu-lum was the most appropriate for use in the school.
Classroom Environment The team attended English classes for the first, second and third grades. This provided an opportunity to
closely observe the classroom environment, especially teacher/student interactions and to closely note how teachers interacted with students.
Surveys The team prepared two surveys, one for parents and one for teachers. The surveys consisted of two parts. The
first was a statement that was intended to measure the degree of acceptance. The second part was in an open- ended format to allow respondents to express their remarks and explain and expand on ideas concerning the questions. The surveys were prepared and tested to ensure question clarity. The surveys were filled out either in person or over the phone during a two month period. Table 2 presents information about the questionnaires.
Parents’ Surveys Figure 4 presents the results of the first part of the parents’ survey that compares the answers for students
who attended the ELIP (referred to as ELIP in the figure) and those who did not attend, referred to as regular (shown as Reg. in the figure). We combined the answers for parents of students in different grades because there were no statistical differences between their answers.
Figure 4 shows that interest in learning English affects student performance and that 72% of parents of stu-

M. Arafeh
265
Figure 2. SIPOC diagram for English periods.
Figure 3. Data collection methods.
Table 2. Questionnaires distribution.
Method Number
Parents Personal 172
ELIP Phone 78
Teachers Personal 12

M. Arafeh
266
Figure 4. Parents’ survey results.
dents who did not attend the ELIP believed that their children were interested in learning English, while only 55% of parents of students who did attend the ELIP believed their children were interested in learning English.
Parents of both groups believed that learning English is important. Sixty seven percent of parents of regular students were satisfied with the extracurricular activities, while only
37% of parents of ELIP students were satisfied. It is apparent that 58% of parents of ELIP students believed that their children had good English language
skills, indicating a problem with their assessment and a lack of communication between the school and the par-ents.
Regarding ELIP, 40% of the weak students did not attend the intensive program because: A) Their parents believed that the intensive program was ineffective. B) They had a private tutor. C) Their primary English teacher believed that it was unnecessary. D) The program was offered at an unsuitable time. E) The parents were not aware of the program.
The survey also indicated that only 25% of parents of ELIP students were satisfied with the results of the pro-gram.
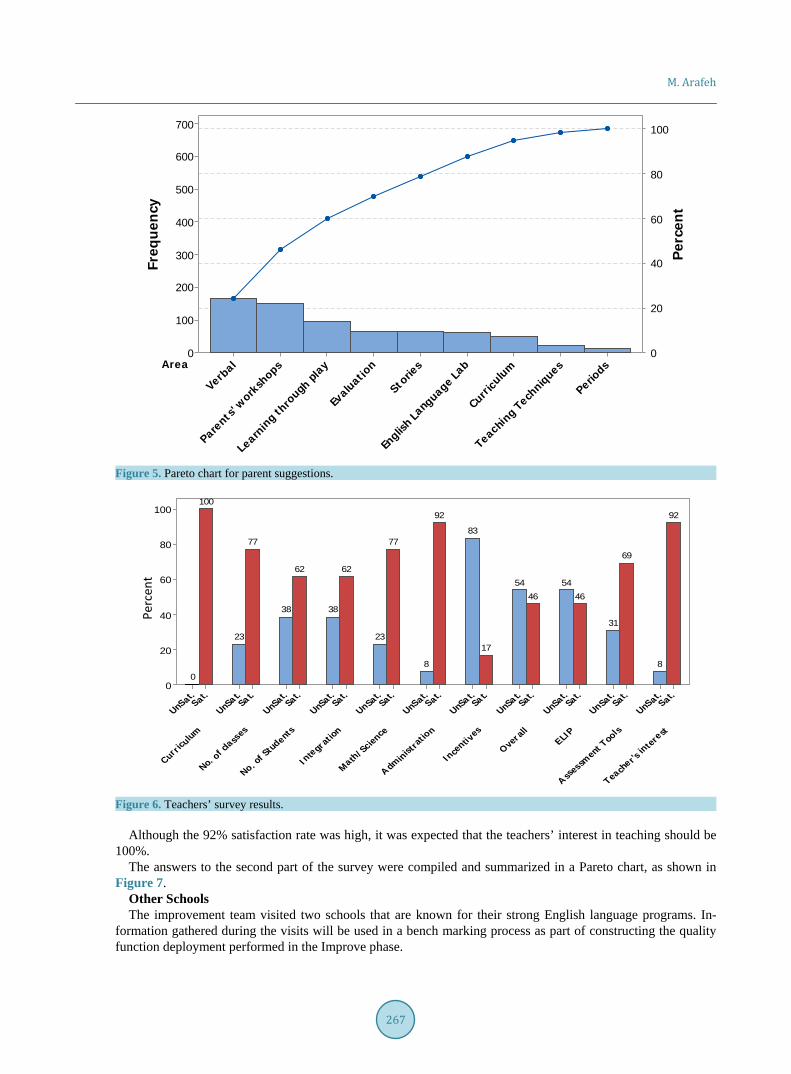
The answers to the second part of the survey were compiled and summarized in a Pareto chart, as shown in Figure 5.
The parents felt that the students were weak in the area of verbal communication; they also indicated a need for workshops to learn how to follow up with their children’s learning. The parents expressed a need for extra-curricular activities such as learning through playing and reading stories.
Teachers’ Survey Figure 6 presents the results of the first part of the teachers’ survey. Regarding Figure 6, the following points can be made. When asked about the integration between the English lessons and the math and science lessons, about 62%
of the teachers indicated some degree of integration, and 77% indicated that math and science classes impacted the students’ ability to learn English.
It is noteworthy that when the teachers were asked about how the school administration responded to their needs, 92% of the respondents were satisfied; however, only 17% were satisfied with the school’s incentive sys-tem and only 46% were satisfied with the overall environment.
As an alarming note, only 46% of the teachers found the ELIP to be effective.
M. Arafeh
267
Figure 5. Pareto chart for parent suggestions.
Figure 6. Teachers’ survey results.
Although the 92% satisfaction rate was high, it was expected that the teachers’ interest in teaching should be
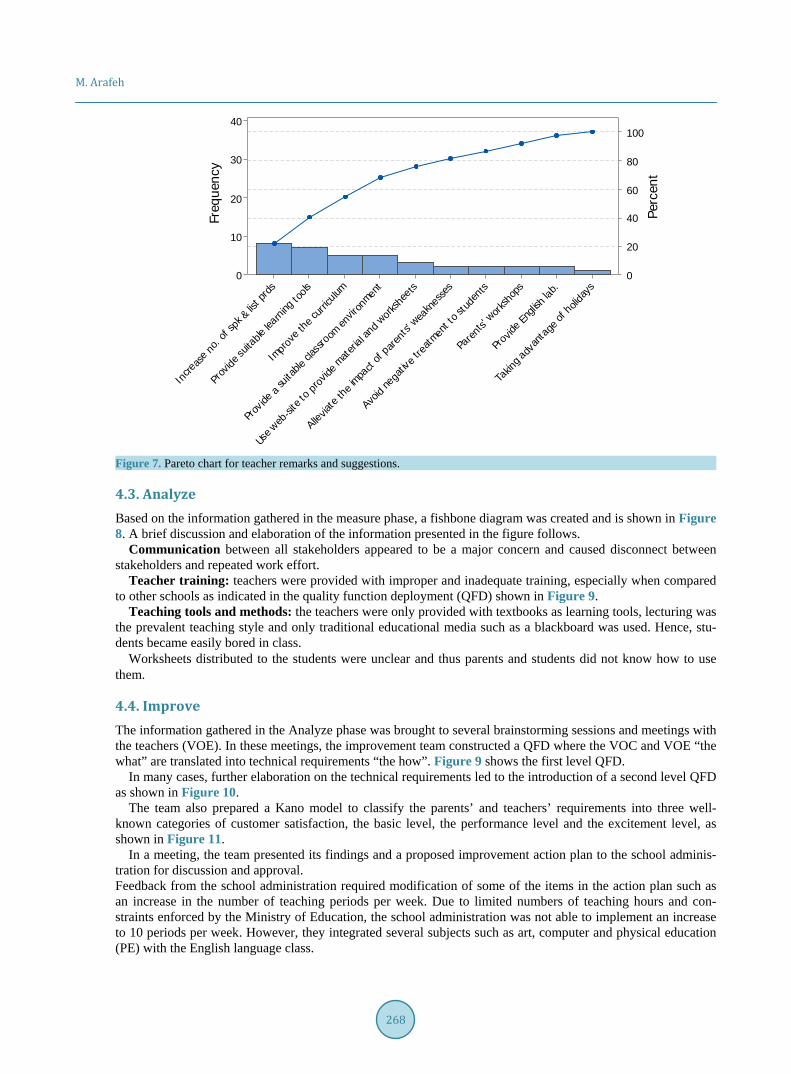
100%. The answers to the second part of the survey were compiled and summarized in a Pareto chart, as shown in
Figure 7. Other Schools The improvement team visited two schools that are known for their strong English language programs. In-
formation gathered during the visits will be used in a bench marking process as part of constructing the quality function deployment performed in the Improve phase.
Area
Periods
Teaching Tech
niques
Curricu
lum
Englis
h Language La
b
Storie
s
Evaluatio
n
Learnin
g thro
ugh play
Parents
' work
shops
Verbal
700
600
500
400
300
200
100
0
100
80
60
40
20
0
Freq
uen
cy
Per
cen
t
Teach
er's in
tere
st
Asses
smen
t Too
lsELI
P
Overa
ll
Ince
ntives
Admin
istra
tion
Math
/Scie
nce
Inte
grat
ion
No. of S
tuden
ts
No. of
class
es
Curric
ulum
Sat.
UnSat
.Sa
t.
UnSat.
Sat.
UnSat
.Sa
t.
UnSat.
Sat.
UnSat.
Sat.
UnSat
.Sa
t.
UnSat.
Sat.
UnSat
.Sa
t.
UnSat
.Sa
t.
UnSat.
Sat.
UnSat
.
100
80
60
40
20
0
92
8
69
31
46
54
46
54
17
83
92
8
77
23
62
38
62
38
77
23
100
0
Perc
ent
M. Arafeh
268
Figure 7. Pareto chart for teacher remarks and suggestions.
4.3. Analyze Based on the information gathered in the measure phase, a fishbone diagram was created and is shown in Figure 8. A brief discussion and elaboration of the information presented in the figure follows.
Communication between all stakeholders appeared to be a major concern and caused disconnect between stakeholders and repeated work effort.
Teacher training: teachers were provided with improper and inadequate training, especially when compared to other schools as indicated in the quality function deployment (QFD) shown in Figure 9.
Teaching tools and methods: the teachers were only provided with textbooks as learning tools, lecturing was the prevalent teaching style and only traditional educational media such as a blackboard was used. Hence, stu-dents became easily bored in class.
Worksheets distributed to the students were unclear and thus parents and students did not know how to use them.
4.4. Improve The information gathered in the Analyze phase was brought to several brainstorming sessions and meetings with the teachers (VOE). In these meetings, the improvement team constructed a QFD where the VOC and VOE “the what” are translated into technical requirements “the how”. Figure 9 shows the first level QFD.
In many cases, further elaboration on the technical requirements led to the introduction of a second level QFD as shown in Figure 10.
The team also prepared a Kano model to classify the parents’ and teachers’ requirements into three well- known categories of customer satisfaction, the basic level, the performance level and the excitement level, as shown in Figure 11.
In a meeting, the team presented its findings and a proposed improvement action plan to the school adminis-tration for discussion and approval. Feedback from the school administration required modification of some of the items in the action plan such as an increase in the number of teaching periods per week. Due to limited numbers of teaching hours and con-straints enforced by the Ministry of Education, the school administration was not able to implement an increase to 10 periods per week. However, they integrated several subjects such as art, computer and physical education (PE) with the English language class.
Takin
g adv
anta
ge of
holid
ays
Prov
ide Eng
lish la
b.
Pare
nts'
works
hops
Avoid
nega
tive tre
atmen
t to s
tude
nts
Allev
iate t
he im
pact of
pare
nts'
weakn
esse
s
Use w
eb-si
te to
pro
vide mat
eria l
and wor
kshe
ets
Prov
ide a
suita
ble cl
assro
om en
viron
ment
Impr
ove t
he cu
rricu
lum
Prov
ide su
itable
lear
ning t
ools
Incre
ase n
o. of
spk &
list p
rds
40
30
20
10
0
100
80
60
40
20
0
Freq
uenc
y
Perc
ent

M. Arafeh
269
Figure 8. Fishbone diagram for the information gathered in the measure phase.
The school administration also decided to study the feasibility of limiting the number of students in each class
to a maximum of 22. The school administration also decided on setting new policies and procedures for hiring new teachers. The
hiring process was reviewed and any sign of lack of interest in teaching was noted and evaluated. Candidates who did not show keen interest in teaching would be disqualified. New teachers are required to attend training programs before starting at the school, including workshops focused on creative teaching methods.
The improvement action plan had four facets. First, ELD teachers participated in regularly held meeting to share experiences and discuss concerns. Each
teacher had to present an innovative idea at least once during a semester. Second, regarding communication with the parents, the ELD organized several meetings to provide conti-
nuous feedback and updates on student performance and workshops for the parents to provide supplementary information and material to reinforce student learning. Text messages were sent to parents to remind them about the workshops and meetings.
Third, concerning the curriculum, Table 3 shows the parts of the improvement action plan. Fourth, several actions were taken to improve the ELIP:
1) A special training program for ELIP teachers was prepared. 2) A progress report for each ELIP student was prepared including information about the students’ English
language skills and opportunities for improvement. The report was prepared and reviewed by the primary English teacher and the ELIP teacher.
3) A regular meeting was held between the primary teachers and the ELIP teachers to review the progress re-ports of the students.
4) Special worksheets dedicated to the intensive program students were prepared. After implementing the improvement actions, the students’ progress was monitored by the ELD and their
grades were recorded for four years. A capability study was conducted and the results are shown in Figure 12. The percentage of students who required special attention dropped below the USL of 10%, although in the last year, it went up to 14%. This was expected since the evaluation method was changed.
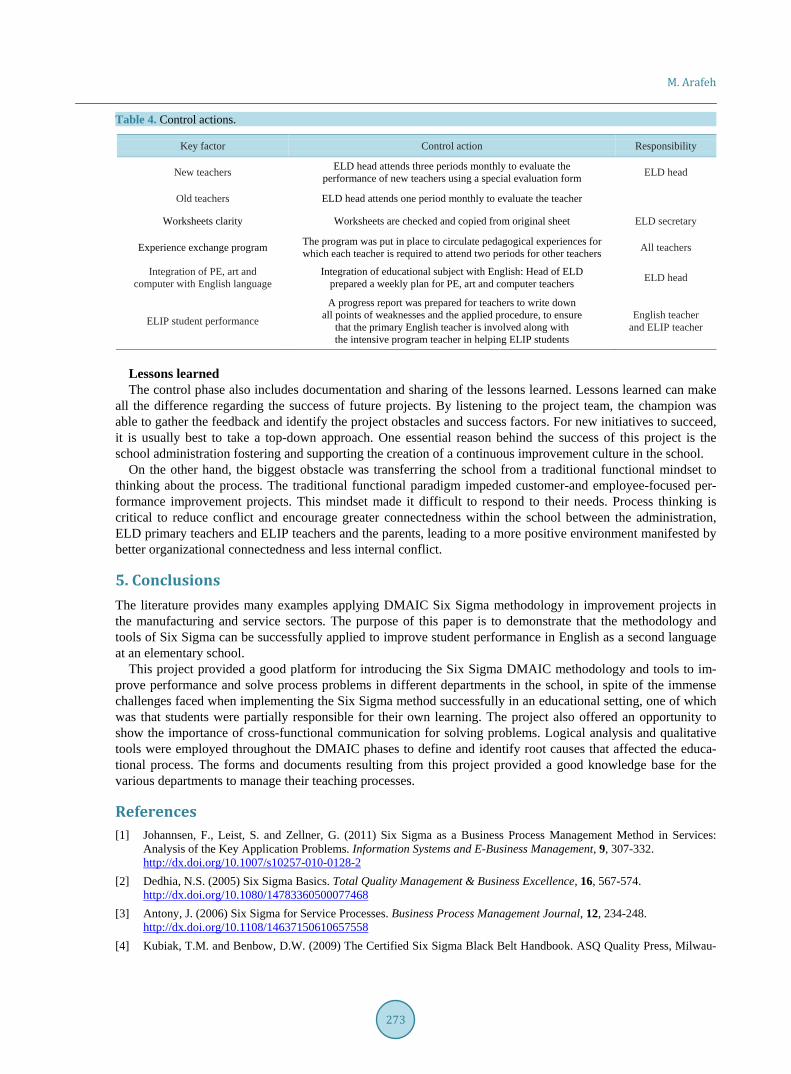
4.5. Control The control phase is the last of the DMAIC phases. This phase identifies the controls that must be in place to ensure that the improvements and benefits of the new processes can be consistently maintained and controlled. The control phase must be carefully performed and reviewed in order to keep the evaluation consistent, avoid mistakes and prevent quality deterioration. In this phase, the improvement project leadership is transferred from the project leader to the process owner (the ELD head). Table 4 presents some of the control actions that were required to sustain the gains and avoid decay.
Stedent Performance
Teachers
Methods
Training
Teaching
Learning ToolsEvaluation methods
Administration
Communication
Parents
AdministrationELIP
ELDStudents
Students
Interest
Curriculum
Verbal
Writing
Worksheets

M. Arafeh
270
Figure 9. First level quality function deployment.
QFD
: House of Q
uality 1P
roject:D
MA
C A
pplication for Better Q
uality Education
Revision:
3D
ate: 9\11\2011
●●
●●
●
●
●
●●
●
●●
●●
●●
●●
●●
●●
●●
●●
Techical Requirements
Custom
er R
equirements
(Explicit and Im
plicit)
1||||||
14%6
92
54
1
2||||
9%4
95
32
2
3|||
7%3
93
51
3
4||||
9%4
94
24
4
5|||
7%3
94
52
5
6||||||
14%6
93
52
6
7|||||
12%5
92
51
7
8||||||
14%6
93
43
8
9||||||
14%6
94
44
9
Maximum Relationship
5
Row #
12
34
My School Competitor #1 Competitor #2
0
1415
2299
99
| | | |
| |
|
| | |6%
| | |
8%6%300
258174
9
|
10%5%| |
3%4%|
3%
Correlations
Strong●
Moderate
○N
o Correlation
Direction of Im
provement
Relationships
Strong●
Moderate
○W
eak▽▲◇▼
Maxim
ize
Target
Minim
ize
99
99
99
99
9
45
67
89
10
Technical Im
portance Rating
Max R
elationship 9
9
Weight C
hart
Relative W
eight
| |
| |
6%
| |
| |
| |
| |
|
|
|
1%1%
8%5%
3%
9
|
4%|
| | | |
284372
405237
1654%
4%4%
4%3%
4%3%
●
62.862.8
209209
209209
126177
153284
●●
Colum
n # 1
23
○
Customer Importance
Relative Weight
Row #
Weight Chart
●●●
Qualified Teacher
●
Extracurricular A
ctivities
Parents' Ability to Teach their C
hildren
Excellent L
anguage Skills
▽▽
○●
▽●
●
○○
●○
▽●
○○
○●
●
▽ ▽●
●○
●○
○
○ ○ ●●
●●
●▽
○○ ●
●○
○○
●○
○●
○○
Effective C
urriculum
Effective E
xams
Effective W
orksheet
Com
fortable Classroom
Environm
ent
Appropriate L
earning Tools
Clear Exam
Appropriate Exam Level
Improve Speaking
Improve Reading
Improve Writing
Improve Listening
Improve Conceptual and Practical Skil
Clear Worksheet
On Time Worksheet
○
Teachers' Adequate Language Skills
Data Show
13
Suitable Number of English Periods
Interaction with Students
Innovative Curriculum's Presentation M
Suitable Number of Students in Class
1112
Stories
2021
16Educational Panels
1817Drama Club
○●●
Smart Board
●
●9 19English Trips
○○
9156
● ○▽9156
○▽●
○9195
○○○●
Parents' Workshps
Teachers' Communication Skills
○●○○●
○
9481
●AL-Ridw
an SchoolsCom
petitor #1Com
petitor #2

M. Arafeh
271
Figure 10. Second level quality function deployment.
Table 3. Improvement action plan: curriculum.
Key process area Recommendations proposed
Learning tools 1. Provide CD for phonics vocabulary 2. Recruit an employee responsible for the learning tools 3. Provide smart board and data shows
Stories Establish reading corner
Extracurricular activities 1. Establish drama club 2. Add an English section to the school website for learning videos, worksheets and weekly reports 3. Entertainment trips supporting English language
Integration of educational subjects Relate art, computer and PE periods with English
QFD
: House of Q
uality 2P
roject:D
MA
C A
pplication for Better Q
uality Education
Revision:
3D
ate: 16\11\2011
●
●
●
●
●●
●●
●●
●
●●
●●
●●
●●
●●
Technical Requirements
Custom
er R
equirements
(Explicit and Im
plicit)
1|||
8%5
9
2|||
8%5
9
3||||
9%6
9
4|||
6%4
9
5|||
6%4
9
|||6%
49
6||
5%3
9
7|||
6%4
3
8|||
6%4
9
9||||
9%6
9
10|||
8%5
9
112%
19
122%
19
13|
3%2
9
14|||
8%5
9
15||||
9%6
9
Effective E
xams
●●
●
99
99
47.69241.538
●●241.54
307.6955.385
55.385406.15
323.08241.54
253.85
9
| |
| |
123.08221.54
363.08243.08
7%
18.462263.08
226.15350.77
○○○9
387.69
8% ▽▽●
○○○335.38
7%| | |
▽●
| | |
| | | |
| | |
| |
| |
○●○●
○●○●●
| | |
5%7%
8%
|
|
| |
| | |
Weight C
hart
Relative W
eight
|
|
| |
| | |
| |
1%1%
1%1%
0%5%
5%3%
5%7%
5%5%
6%5%
2%2%
2%2%
99
3
98.46287.692
120110.77
99
99
99
93
99
Technical Importance R
ating
Max R
elationship 9
99
99
Stories
Teachers' Adequate L
anguage Skills
Teachers' Com
munication Skills
○○
●●
▽●
▽ ●D
rama C
lub
Educational P
anels
●Suitable N
umber of Students in C
lass
▽
●○
○○
●●
●ovative C
urriculum's P
resentation Meth○
●○
○●
▽○
●●
Interaction with Students
○●
●○
○Suitable N
umber of E
nglish Periods
●●
○○
●●
Clear W
orksheet
○
○○
●○
○●
○Im
prove Conceptual and P
ractical Skills●
○●
○○
●○
Improve L
istening ●
●●
○●
●○
○▽
○
○○
○○●
○○
○○
○○
●▽
○○
○○
○●
▽●
○○
○○●
●
○○
Improve W
riting ▽
▽○
○●
○○
○●
●
Improve Speaking
●●
Improve R
eading ●
○○
▽●
○
Teachers' Training
Fluent Teachers
Data Show
Smart Board
○
Employee Responsible for the Learning T
Theatre
Library
Parents' Workshps
Clear Exam
Worksheet with Clear Font
Worksheet with Clear Picture
On Time Worksheet
Appropriate Exam Level
10 Periods Weekly
Max. 22 Students in Class
Teachers' Prepration for Class
Teachers' Pedagogical Skills
Educational Games
English Trips
Intensive Program
English Laboratory
Group presentation
Class Discussion
CD for Vocabulary and Conversation less
Row #
Weight Chart
Relative Weight
Customer Importance
Maximum Relationship
2416
1718
1920
2110
1112
1314
1523
224
56
78
9C
olumn #
12
3
No Correlation
Relationships
Strong●
Moderate
○
Correlations
Strong●
Moderate
○
Weak
▽

M. Arafeh
272
Figure 11. Kano model for English period.
Figure 12. Student grade process capability report.
654321
0.15
0.10
0.05
Sample
Prop
ortio
n
_P=0.1013
UCL=0.1636
LCL=0.0390
654321
13
12
11
10
9Upper CI: 1.3668
%Defective: 10.13Lower CI: 8.58Upper CI: 11.85Target: 0.00PPM Def: 101312Lower CI: 85848Upper CI: 118506Process Z: 1.2741Lower CI: 1.1825
(95.0% confidence)
Summary Stats
Sample
%D
efec
tive
240225210
15
12
9
6
Sample Size
%D
efec
tive
14121086420
2.0
1.5
1.0
0.5
0.0
%Defective
Freq
uenc
y
Target
Binomial Process Capability Report for C8P Chart
Tests performed with unequal sample sizes
Cumulative %Defective
Rate of Defectives
Histogram
M. Arafeh
273
Table 4. Control actions.
Key factor Control action Responsibility
New teachers ELD head attends three periods monthly to evaluate the performance of new teachers using a special evaluation form ELD head
Old teachers ELD head attends one period monthly to evaluate the teacher
Worksheets clarity Worksheets are checked and copied from original sheet ELD secretary
Experience exchange program The program was put in place to circulate pedagogical experiences for which each teacher is required to attend two periods for other teachers All teachers
Integration of PE, art and computer with English language
Integration of educational subject with English: Head of ELD prepared a weekly plan for PE, art and computer teachers ELD head
ELIP student performance
A progress report was prepared for teachers to write down all points of weaknesses and the applied procedure, to ensure
that the primary English teacher is involved along with the intensive program teacher in helping ELIP students
English teacher and ELIP teacher
Lessons learned The control phase also includes documentation and sharing of the lessons learned. Lessons learned can make
all the difference regarding the success of future projects. By listening to the project team, the champion was able to gather the feedback and identify the project obstacles and success factors. For new initiatives to succeed, it is usually best to take a top-down approach. One essential reason behind the success of this project is the school administration fostering and supporting the creation of a continuous improvement culture in the school.
On the other hand, the biggest obstacle was transferring the school from a traditional functional mindset to thinking about the process. The traditional functional paradigm impeded customer-and employee-focused per-formance improvement projects. This mindset made it difficult to respond to their needs. Process thinking is critical to reduce conflict and encourage greater connectedness within the school between the administration, ELD primary teachers and ELIP teachers and the parents, leading to a more positive environment manifested by better organizational connectedness and less internal conflict.
5. Conclusions The literature provides many examples applying DMAIC Six Sigma methodology in improvement projects in the manufacturing and service sectors. The purpose of this paper is to demonstrate that the methodology and tools of Six Sigma can be successfully applied to improve student performance in English as a second language at an elementary school.
This project provided a good platform for introducing the Six Sigma DMAIC methodology and tools to im-prove performance and solve process problems in different departments in the school, in spite of the immense challenges faced when implementing the Six Sigma method successfully in an educational setting, one of which was that students were partially responsible for their own learning. The project also offered an opportunity to show the importance of cross-functional communication for solving problems. Logical analysis and qualitative tools were employed throughout the DMAIC phases to define and identify root causes that affected the educa-tional process. The forms and documents resulting from this project provided a good knowledge base for the various departments to manage their teaching processes.
References [1] Johannsen, F., Leist, S. and Zellner, G. (2011) Six Sigma as a Business Process Management Method in Services:
Analysis of the Key Application Problems. Information Systems and E-Business Management, 9, 307-332. http://dx.doi.org/10.1007/s10257-010-0128-2
[2] Dedhia, N.S. (2005) Six Sigma Basics. Total Quality Management & Business Excellence, 16, 567-574. http://dx.doi.org/10.1080/14783360500077468
[3] Antony, J. (2006) Six Sigma for Service Processes. Business Process Management Journal, 12, 234-248. http://dx.doi.org/10.1108/14637150610657558
[4] Kubiak, T.M. and Benbow, D.W. (2009) The Certified Six Sigma Black Belt Handbook. ASQ Quality Press, Milwau-

M. Arafeh
274
kee. [5] Jones, E.C., Parast, M.M. and Adams, S.G. (2010) A Framework for Effective Six Sigma Implementation. Total Qual-
ity Management, 21, 415-424. http://dx.doi.org/10.1080/14783361003606720 [6] Voehl, F., Harrington, H.J., Mignosa, C. and Charron, R. (2013) The Lean Six Sigma Black Belt Handbook: Tools and
Methods for Process Acceleration. Productivity Press, New York. [7] Arafeh, M., Barghash, M.A., Sallam, E. and Alsamhouri, A. (2014) Six Sigma Applied to Reduce Patients’ Waiting
Time in a Cancer Pharmacy. International Journal of Six Sigma and Competitive Advantage, 8, 105-124. http://dx.doi.org/10.1504/IJSSCA.2014.064256
[8] Munro, R.A. (2009) Lean Six Sigma for the Healthcare Practice: A Pocket Guide. ASQ Quality Press, Milwaukee. [9] Taner, M.T., Sezen, B. and Antony, J. (2007) An Overview of Six Sigma Applications in Healthcare Industry. Interna-
tional Journal of Health Care Quality Assurance, 20, 329-340. http://dx.doi.org/10.1108/09526860710754398 [10] Krehbiel, T.C., Eighme, J.E. and Cottell, P.G. (2009) Morgan Systems, Inc.: Application of Six Sigma to the Finance
Function. Journal of Accounting Education, 27, 104-123. http://dx.doi.org/10.1016/j.jaccedu.2009.11.002 [11] Leseure, M., Hudson-Smith, M., Delgado, C., Ferreira, M. and Castelo Branco, M. (2010) The Implementation of Lean
Six Sigma in Financial Services Organizations. Journal of Manufacturing Technology Management, 21, 512-523. http://dx.doi.org/10.1108/17410381011046616
[12] Setijono, D. and Al-Aomar, R. (2012) A Lean Construction Framework with Six Sigma Rating. International Journal of Lean Six Sigma, 3, 299-314. http://dx.doi.org/10.1108/20401461211284761
[13] Banawi, A. and Bilec, M.M. (2014) A Framework to Improve Construction Processes: Integrating Lean, Green and Six Sigma. International Journal of Construction Management, 14, 45-55. http://dx.doi.org/10.1080/15623599.2013.875266
[14] Pearlman, D.M. and Chacko, H. (2012) The Quest for Quality Improvement: Using Six Sigma at Starwood Hotels and Resorts. International Journal of Hospitality & Tourism Administration, 13, 48-66. http://dx.doi.org/10.1080/15256480.2012.640212
[15] Maleyeff, J. and Campus, H. (2007) Improving Service Delivery in Government with Lean Six Sigma. IBM Center for the Business of Government Washington DC.
[16] Hargrove, S.K. and Burge, L. (2002) Developing a Six Sigma Methodology for Improving Retention in Engineering Education. Frontiers in Education Conference, 3, S3C-20-S3C-24. http://dx.doi.org/10.1109/fie.2002.1158694
[17] Burtner, J. (2004) The Adaptation of Six Sigma Methodology to the Engineering Education Enterprise. Proceedings of the ASEE Southeast Section Conference, Auburn, 4-6 April 2004. http://cee.citadel.edu/asee-se/proceedings/ASEE2004/ ASEE2004SE.html
[18] Zahn, D., Watson, G., Voelkel, J. and Patterson, A. (2003) What Influence Is the Six Sigma Movement Having in Universities? What Influence Should It Be Having? ASQ Six Sigma Forum Magazine, 33-38.
[19] Holmes, M.C., Kumar, A. and Jenicke, L.O. (2005) Improving the Effectiveness of the Academic Delivery Process Utilizing Six Sigma. Sigma, 1, 15.
[20] Jenicke, L.O., Kumar, A. and Holmes, M.C. (2008) A Framework for Applying Six Sigma Improvement Methodology in an Academic Environment. The TQM Journal, 20, 453-462. http://dx.doi.org/10.1108/17542730810898421
[21] Kaushik, P. and Khanduja, D. (2010) Utilising Six Sigma for Improving Pass Percentage of Students: A Technical In-stitute Case Study. Educational Research & Review, 5, 471-483.
[22] Prasad, K.D., Subbaiah, K.V. and Padmavathi, G. (2012) Application of Six Sigma Methodology in an Engineering Educational Institution. International Journal of Emerging Sciences, 2, 210-221.
[23] Ramasubramanian, P. (2012) Six Sigma in Educational Institutions. International Journal of Engineering Practical Research, 1, 1-5.
[24] Dhariwal, P. and Bhagchandani, M. (2013) Implementation of Six Sigma Methodology in Academics. International Journal of Sustainable Development and Green Economics, 2, 17-21.
[25] Mehrotra, D. (2012) Implementing Six Sigma in Education towards TQM in Academics. S. Chand Publishing, New Delhi.
