levine smume7 ch09 modified
TRANSCRIPT

Statistics for Managers Using Microsoft Excel
7th Edition
Chapter 9
Fundamentals of Hypothesis Testing: One-Sample Tests
Chap 9-1Statistics for Managers Using Microsoft Excel® 7e Copyright ©2014 Pearson Education, Inc.
Chap 9-2
Learning Objectives
In this chapter, you learn: The basic principles of hypothesis testing
How to use hypothesis testing to test a mean
The assumptions of each hypothesis-testing procedure, how to evaluate them, and the consequences if they are seriously violated
How to avoid the pitfalls involved in hypothesis testing
Pitfalls & ethical issues involved in hypothesis testing
Statistics for Managers Using Microsoft Excel® 7e Copyright ©2014 Pearson Education, Inc.

Chap 9-3
What is a Hypothesis?
A hypothesis is a claim (assertion) about a population parameter:
population mean
Example: The mean monthly cell phone bill in this city is μ = $42
Statistics for Managers Using Microsoft Excel® 7e Copyright ©2014 Pearson Education, Inc.
DCOVA

Chap 9-4
The Null Hypothesis, H0
States the claim or assertion to be tested
Example: The mean diameter of a manufactured
bolt is 30mm ( )
Is always about a population parameter, not about a sample statistic
30μ:H0 =
30μ:H0 = 30X:H0 =
Statistics for Managers Using Microsoft Excel® 7e Copyright ©2014 Pearson Education, Inc.
DCOVA

Chap 9-5
The Null Hypothesis, H0
Begin with the assumption that the null hypothesis is true Similar to the notion of innocent until
proven guilty
Refers to the status quo or historical value Always contains “=“, or “≤”, or “≥” sign May or may not be rejected
(continued)
Statistics for Managers Using Microsoft Excel® 7e Copyright ©2014 Pearson Education, Inc.
DCOVA

Chap 9-6
The Alternative Hypothesis, H1
Is the opposite of the null hypothesis e.g., The average diameter of a manufactured
bolt is not equal to 30mm ( H1: μ ≠ 30 )
Challenges the status quo Never contains the “=“, or “≤”, or “≥” sign May or may not be proven Is generally the hypothesis that the
researcher is trying to prove
Statistics for Managers Using Microsoft Excel® 7e Copyright ©2014 Pearson Education, Inc.
DCOVA

Chap 9-7
The Hypothesis Testing Process
Claim: The population mean age is 50. H0: μ = 50, H1: μ ≠ 50
Sample the population and find sample mean.
Population
Sample
Statistics for Managers Using Microsoft Excel® 7e Copyright ©2014 Pearson Education, Inc.
DCOVA

Chap 9-8
The Hypothesis Testing Process
Suppose the sample mean age was X = 20.
This is significantly lower than the claimed mean population age of 50.
If the null hypothesis were true, the probability of getting such a different sample mean would be very small, so you reject the null hypothesis .
In other words, getting a sample mean of 20 is so unlikely if the population mean was 50, you conclude that the population mean must not be 50.
(continued)
Statistics for Managers Using Microsoft Excel® 7e Copyright ©2014 Pearson Education, Inc.
DCOVA

Chap 9-9
The Hypothesis Testing Process
Sampling Distribution of X
μ = 50If H0 is true
If it is unlikely that you would get a sample mean of this value ...
... then you reject the null hypothesis
that μ = 50.
20
... When in fact this were the population mean…
X
(continued)
Statistics for Managers Using Microsoft Excel® 7e Copyright ©2014 Pearson Education, Inc.
DCOVA

Chap 9-10
The Test Statistic and Critical Values
If the sample mean is close to the stated population mean, the null hypothesis is not rejected.
If the sample mean is far from the stated population mean, the null hypothesis is rejected.
How far is “far enough” to reject H0?
The critical value of a test statistic creates a “line in the sand” for decision making -- it answers the question of how far is far enough.
Statistics for Managers Using Microsoft Excel® 7e Copyright ©2014 Pearson Education, Inc.
DCOVA

Chap 9-11
The Test Statistic and Critical Values
Critical Values
“Too Far Away” From Mean of Sampling Distribution
Sampling Distribution of the test statistic
Region of Rejection
Region of Rejection
Region ofNon-Rejection
Statistics for Managers Using Microsoft Excel® 7e Copyright ©2014 Pearson Education, Inc.
DCOVA

Chap 9-12
Possible Errors in Hypothesis Test Decision Making
Type I Error Reject a true null hypothesis Considered a serious type of error The probability of a Type I Error is α
Called level of significance of the test Set by researcher in advance
Type II Error Failure to reject a false null hypothesis The probability of a Type II Error is β
Statistics for Managers Using Microsoft Excel® 7e Copyright ©2014 Pearson Education, Inc.
DCOVA

Chap 9-13
Possible Errors in Hypothesis Test Decision Making
Possible Hypothesis Test Outcomes
Actual Situation
Decision H0 True H0 False
Do Not Reject H0
No ErrorProbability 1 - α
Type II ErrorProbability β
Reject H0 Type I ErrorProbability α
No ErrorPower 1 - β
(continued)
Statistics for Managers Using Microsoft Excel® 7e Copyright ©2014 Pearson Education, Inc.
DCOVA
Chap 9-14
Possible Errors in Hypothesis Test Decision Making
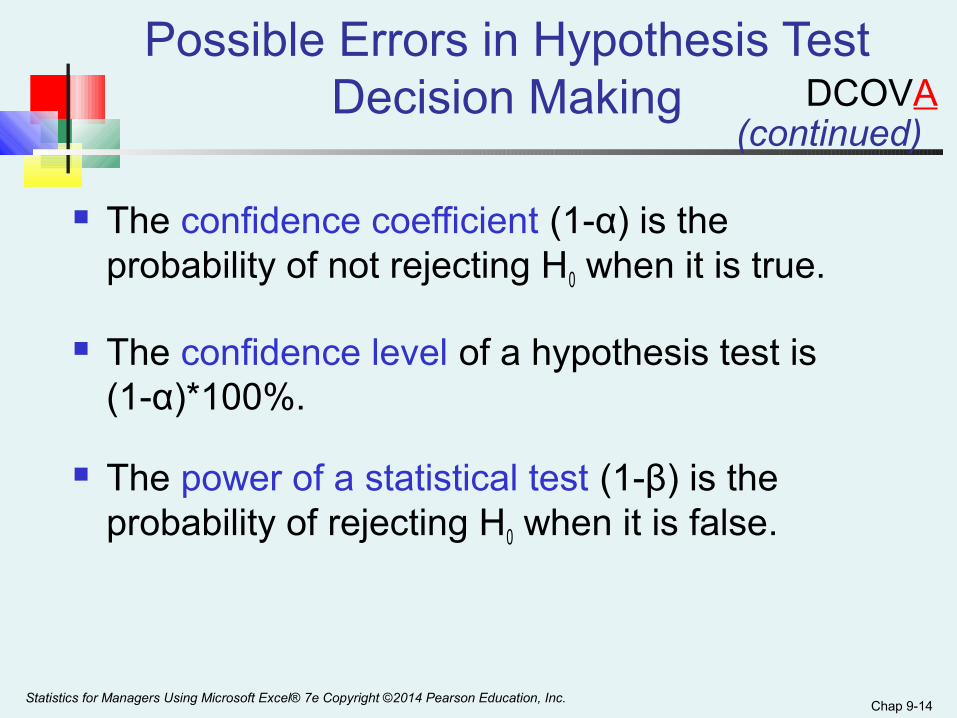
The confidence coefficient (1-α) is the probability of not rejecting H0 when it is true.
The confidence level of a hypothesis test is (1-α)*100%.
The power of a statistical test (1-β) is the probability of rejecting H0 when it is false.
(continued)
Statistics for Managers Using Microsoft Excel® 7e Copyright ©2014 Pearson Education, Inc.
DCOVA

Chap 9-15
Type I & II Error Relationship
Type I and Type II errors cannot happen at the same time
A Type I error can only occur if H0 is true
A Type II error can only occur if H0 is false
If Type I error probability (α) , then
Type II error probability (β)
Statistics for Managers Using Microsoft Excel® 7e Copyright ©2014 Pearson Education, Inc.
DCOVA

Chap 9-16
Level of Significance and the Rejection Region
Level of significance = α
This is a two-tail test because there is a rejection region in both tails
H0: μ = 30
H1: μ ≠ 30
Critical values
Rejection Region
/2
30
α /2α
Statistics for Managers Using Microsoft Excel® 7e Copyright ©2014 Pearson Education, Inc.
DCOVA

Chap 9-17
Hypothesis Tests for the Mean
σ Known σ Unknown
Hypothesis Tests for µ
(Z test) (t test)
Statistics for Managers Using Microsoft Excel® 7e Copyright ©2014 Pearson Education, Inc.
DCOVA

Chap 9-18
Z Test of Hypothesis for the Mean (σ Known)
Convert sample statistic ( ) to a ZSTAT test statistic X
The test statistic is:
n
σμX
ZSTAT
−=
σ Known σ Unknown
Hypothesis Tests for µ
σ Known σ Unknown(Z test) (t test)
Statistics for Managers Using Microsoft Excel® 7e Copyright ©2014 Pearson Education, Inc.
DCOVA

Chap 9-19
t Test of Hypothesis for the Mean (σ Unknown)
The test statistic is:
Hypothesis Tests for µ
σ Known σ Unknownσ Known σ Unknown(Z test) (t test)
Convert sample statistic ( ) to a tSTAT test statistic
The test statistic is:
Hypothesis Tests for µ
σ Known σ Unknownσ Known σ Unknown(Z test) (t test)
X
The test statistic is:
n
SμX
tSTAT
−=
Hypothesis Tests for µ
σ Known σ Unknownσ Known σ Unknown(Z test) (t test)
Statistics for Managers Using Microsoft Excel® 7e Copyright ©2014 Pearson Education, Inc.
DCOVA

Chap 9-20
Example: Two-Tail Test(σ Unknown)
The average cost of a hotel room in New York is said to be $168 per night. To determine if this is true, a random sample of 25 hotels is taken and resulted in an X of $172.50 and an S of $15.40. Test the appropriate hypotheses at α = 0.05.
(Assume the population distribution is normal)
Is there evidence that average cost is different from $168?
Statistics for Managers Using Microsoft Excel® 7e Copyright ©2014 Pearson Education, Inc.
DCOVA

Chap 9-21
α = 0.05
n = 25, df = 25-1=24
σ is unknown, so use a t statistic
Critical Value:
±t24,0.025 = ± 2.0639
Example Solution: Two-Tail t Test
Do not reject H0: insufficient evidence that true mean cost is different from $168
Reject H0Reject H0
α/2=.025
-t 24,0.025
Do not reject H0
0
α/2=.025
-2.0639 2.0639
1.46
25
15.40168172.50
n
SμX
STATt =−=−=
1.46
H0: μ = 168
H1: μ ≠
168t 24,0.025
Statistics for Managers Using Microsoft Excel® 7e Copyright ©2014 Pearson Education, Inc.
DCOVA

Chap 9-22
Example Two-Tail t Test Using A p-value from Excel
Since this is a t-test we cannot calculate the p-value without some calculation aid.
The Excel output below does this:t Test for the Hypothesis of the Mean
Null Hypothesis µ= 168.00$ Level of Significance 0.05Sample Size 25Sample Mean 172.50$ Sample Standard Deviation 15.40$
Standard Error of the Mean 3.08$ =B8/SQRT(B6)Degrees of Freedom 24 =B6-1t test statistic 1.46 =(B7-B4)/B11
Lower Critical Value -2.0639 =-TINV(B5,B12)Upper Critical Value 2.0639 =TINV(B5,B12)p-value 0.157 =TDIST(ABS(B13),B12,2)
=IF(B18<B5, "Reject null hypothesis","Do not reject null hypothesis")
Data
Intermediate Calculations
Two-Tail Test
Do Not Reject Null Hypothesis
p-value > αSo do not reject H0
Statistics for Managers Using Microsoft Excel® 7e Copyright ©2014 Pearson Education, Inc.
DCOVA

Connection of Two Tail Tests to Confidence Intervals
For X = 172.5, S = 15.40 and n = 25, the 95% confidence interval for µ is:
172.5 - (2.0639) 15.4/ 25 to 172.5 + (2.0639) 15.4/ 25
166.14 ≤ μ ≤ 178.86
Since this interval contains the Hypothesized mean (168), we do not reject the null hypothesis at α = 0.05
Statistics for Managers Using Microsoft Excel® 7e Copyright ©2014 Pearson Education, Inc.
DCOVA

Chap 9-24
Example: Two-Tail Test(σ Unknown)
The average cost of a hotel room in New York is said to be $168 per night. To determine if this is true, a random sample of 25 hotels is taken and resulted in an X of $172.50 and an S of $15.40. Test the appropriate hypotheses at α = 0.05.
(Assume the population distribution is normal)
Is there evidence that average cost is greater than $168?
Statistics for Managers Using Microsoft Excel® 7e Copyright ©2014 Pearson Education, Inc.
DCOVA

Chap 9-25
One-Tail Tests
In many cases, the alternative hypothesis focuses on a particular direction
H0: μ ≥ 3
H1: μ < 3
H0: μ ≤ 3
H1: μ > 3
This is a lower-tail test since the alternative hypothesis is focused on the lower tail below the mean of 3
This is an upper-tail test since the alternative hypothesis is focused on the upper tail above the mean of 3
Statistics for Managers Using Microsoft Excel® 7e Copyright ©2014 Pearson Education, Inc.
DCOVA
Chap 9-26
Reject H0 Do not reject H0
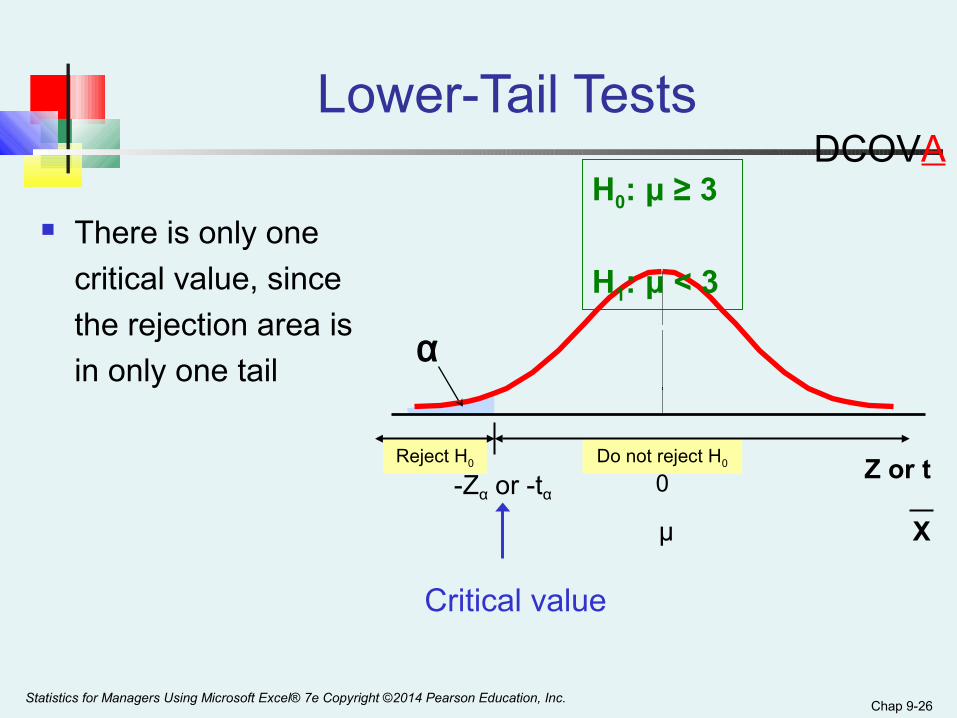
There is only one
critical value, since
the rejection area is
in only one tail
Lower-Tail Tests
α
-Zα or -tα 0
μ
H0: μ ≥ 3
H1: μ < 3
Z or t
X
Critical value
Statistics for Managers Using Microsoft Excel® 7e Copyright ©2014 Pearson Education, Inc.
DCOVA

Chap 9-27
Reject H0Do not reject H0
Upper-Tail Tests
α
Zα or tα0
μ
H0: μ ≤ 3
H1: μ > 3 There is only one
critical value, since
the rejection area is
in only one tail
Critical value
Z or t
X_
Statistics for Managers Using Microsoft Excel® 7e Copyright ©2014 Pearson Education, Inc.
DCOVA

Chap 9-28
Example: Upper-Tail t Test for Mean (σ unknown)
A phone industry manager thinks that customer monthly cell phone bills have increased, and now average over $52 per month. The company wishes to test this claim. (Assume a normal population)
H0: μ ≤ 52 the average is not over $52 per month
H1: μ > 52 the average is greater than $52 per month(i.e., sufficient evidence exists to support the manager’s claim)
Form hypothesis test:
Statistics for Managers Using Microsoft Excel® 7e Copyright ©2014 Pearson Education, Inc.
DCOVA

Chap 9-29
Reject H0Do not reject H0
Suppose that α = 0.10 is chosen for this test and n = 25.
Find the rejection region:
α = 0.10
1.3180
Reject H0
Reject H0 if tSTAT > 1.318
Example: Find Rejection Region
(continued)
Statistics for Managers Using Microsoft Excel® 7e Copyright ©2014 Pearson Education, Inc.
DCOVA

Chap 9-30
Obtain sample and compute the test statistic
Suppose a sample is taken with the following results: n = 25, X = 53.1, and S = 10
Then the test statistic is:
0.55
25
105253.1
n
SμX
tSTAT =−=−=
Example: Test Statistic
(continued)
Statistics for Managers Using Microsoft Excel® 7e Copyright ©2014 Pearson Education, Inc.
DCOVA
Chap 9-31
Reject H0Do not reject H0
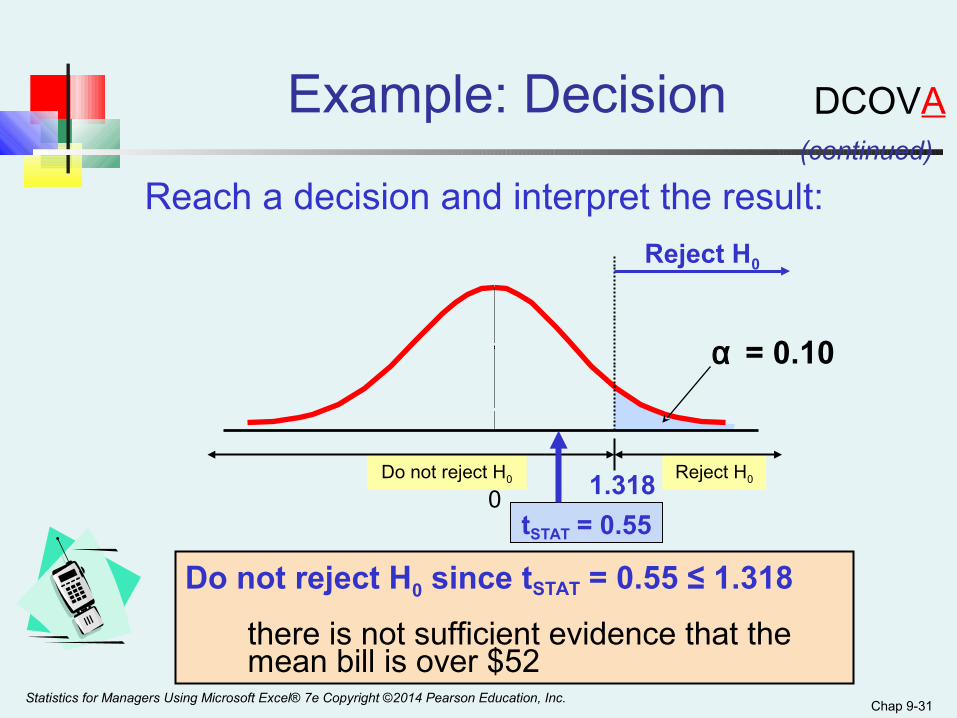
Example: Decision
α = 0.10
1.3180
Reject H0
Do not reject H0 since tSTAT = 0.55 ≤ 1.318
there is not sufficient evidence that the mean bill is over $52
tSTAT = 0.55
Reach a decision and interpret the result:(continued)
Statistics for Managers Using Microsoft Excel® 7e Copyright ©2014 Pearson Education, Inc.
DCOVA

Chap 9-32
Example: Utilizing The p-value for The Test
Calculate the p-value and compare to α (p-value below calculated using excel spreadsheet on next page)
Reject H0
α = .10
Do not reject H0
1.318
0
Reject H0
tSTAT = .55
p-value = .2937
Do not reject H0 since p-value = .2937 > α = .10
Statistics for Managers Using Microsoft Excel® 7e Copyright ©2014 Pearson Education, Inc.
DCOVA

Chap 9-33
Excel Spreadsheet Calculating The p-value for An Upper Tail t Test
Statistics for Managers Using Microsoft Excel® 7e Copyright ©2014 Pearson Education, Inc.
DCOVA

Statistical Significance vs Practical Significance
Statistically significant results (rejecting the null hypothesis) are not always of practical significance This is more likely to happen when the sample size
gets very large
Practically significant results might be found to be statistically insignificant (failing to reject the null hypothesis) This is more likely to happen when the sample size is
relatively small
Statistics for Managers Using Microsoft Excel® 7e Copyright ©2014 Pearson Education, Inc.Chap 9-34

Reporting Findings & Ethical Issues
Should document & report both good & bad results Should not only report statistically significant results Reports should distinguish between poor research
methodology and unethical behavior Ethical issues can arise in:
The use of human subjects The data collection method The type of test being used The level of significance being used The cleansing and discarding of data The failure to report pertinent findings
Chap 9-35Statistics for Managers Using Microsoft Excel® 7e Copyright ©2014 Pearson Education, Inc.

Chap 9-36
Chapter Summary
In this chapter we discussed
Hypothesis testing methodology
Performing a t test for the mean (σ unknown)
Statistical and practical significance
Pitfalls and ethical issues
Statistics for Managers Using Microsoft Excel® 7e Copyright ©2014 Pearson Education, Inc.