lgps 2016 valuation advice on assumptions
TRANSCRIPT

Local Government Pension Scheme (LGPS) Actuarial valuation as at 31 March 2016 Advice on assumptions
3 October 2019
Michael Scanlon FIA

Local Government Pension Scheme: Actuarial valuation as at 31 March 2016
Advice on assumptions
Contents
1 Executive summary 2
2 Introduction 5
3 General considerations 7
4 Pensioner Mortality 9
5 Age retirement from service 18
6 Ill-health retirement from service 23
7 Voluntary withdrawal from service 27
8 Death before retirement 31
9 Promotional pay increases 34
10 Commutation of pension for cash at retirement 39
11 Family statistics 41
Details of assumptions 43
Modelling approach and minor assumptions 48
Assumptions made for data uncertainties 53
Sensitivity of valuation results to Secretary of State set assumptions 56
At GAD, we seek to achieve a high standard in all our work. We are accredited under the Institute and Faculty of Actuaries’ Quality Assurance Scheme. Our website describes the standards we apply.

LGPS actuarial valuation as at 31 March 2016
Advice on assumptions
2
1 Executive summary
1.1 An actuarial valuation of the Local Government Pension Scheme (‘LGPS’ or ‘the Scheme’) is being carried out as at 31 March 2016. The Public Service Pension (Valuation and Employer Cost Cap) Directions 2014 as amended (‘the Directions’) require that, unless specified otherwise1, the assumptions to be adopted for this valuation will be set by the Secretary of State for Housing, Communities and Local Government, having obtained advice from the scheme actuary. Direction 19(c) requires the assumptions to be Secretary of State’s best estimates.
1.2 GAD is the appointed scheme actuary to the Scheme. This report sets out GAD’s formal advice to the Secretary of State on the actuarial assumptions to be adopted where these are not otherwise specified. The advice covers the assumptions to be set by the Secretary of State. The main advised assumptions are summarised in Table 1 with further detail in Appendix A. This report was provided to the Secretary of State for Housing, Communities and Local Government in draft form, and was also provided to the Scheme’s member and employer representatives, in June 2017. The Secretary of State has already confirmed to GAD, having consulted with relevant stakeholders, that the actuarial assumptions to be adopted for the valuation should be those set out in this report.
1.3 The 2016 valuation is currently paused, following the Court of Appeal judgment that found the transition protections provided to firefighters and members of the Judiciary give rise to unlawful age discrimination. Government has confirmed that they expect that the difference in treatment will also need to be remedied for LGPS, and other public service pension schemes2. However the form of remedy is unclear at this stage. Once the implications of this judgement are clear we will consider if there is any reason to update this advice on assumptions.
1.4 This report relates to demographic assumptions i.e. assumptions about member behaviours. When considering appropriate assumptions experience, both recent and longer term, generally provides the most reliable evidence when considering best estimates of future experience. Anticipated future events may also influence how assumptions are set. This advice sets out relevant analysis of recent experience and indicates which other factors have been considered in deriving recommendations of best estimate assumptions.
1.5 The previous completed actuarial valuation of the Local Government Pension Scheme was carried out as at 31 March 2013. Some of the assumptions put forward in this report are the same as those adopted for that valuation. The most significant changes are:
1 Certain assumptions are specified in the Directions. 2 https://www.parliament.uk/business/publications/written-questions-answers-statements/written-statement/Commons/2019-07-15/HCWS1725/
This report contains our recommendations for the best estimate assumptions to be set by the Secretary of State for Housing, Communities and Local Government for the 2016 valuation of the Local Government Pension Scheme (England and Wales).

LGPS actuarial valuation as at 31 March 2016
Advice on assumptions
3
> Rates of pensioner mortality have been updated to reflect recent experience and to reflect changes in population mortality as reflected in the updated ONS population projections3.
> The rates of voluntary withdrawal from the Scheme have been updated to assume that members will in future leave the Scheme at a higher rate than that assumed at the previous valuation.
> The rates of ill-health retirement from the Scheme have been updated to assume that members will in future retire from the Scheme at a lower rate than that assumed at the previous valuation.
> The assumption for promotional pay increases for female members now extends to age 50. The 2013 assumption had anticipated no promotional increases for women after age 40.
1.6 The following chapters and appendices provide more detail on the advice, supporting analysis and an indication of the magnitude of the financial impact of each assumption on valuation results. They also contain important background information about the context of this advice and its limitations.
1.7 Where the Scheme membership data is not sufficient for the scheme actuary to carry out a robust analysis of that aspect, the Directions require the report to include a statement to that effect. There was insufficient data to undertake an analysis of spouse or remarriage rates. Despite these shortcomings it is still possible to propose reasonable assumptions.
1.8 This work has been carried out in accordance with the applicable Technical Actuarial Standards: TAS 100 and TAS 300 issued by the Financial Reporting council (FRC). The FRC sets technical standards for actuarial work in the UK.
3 From the 2012 based projections to the 2016 based projections.
LGPS actuarial valuation as at 31 March 2016
Advice on assumptions
2
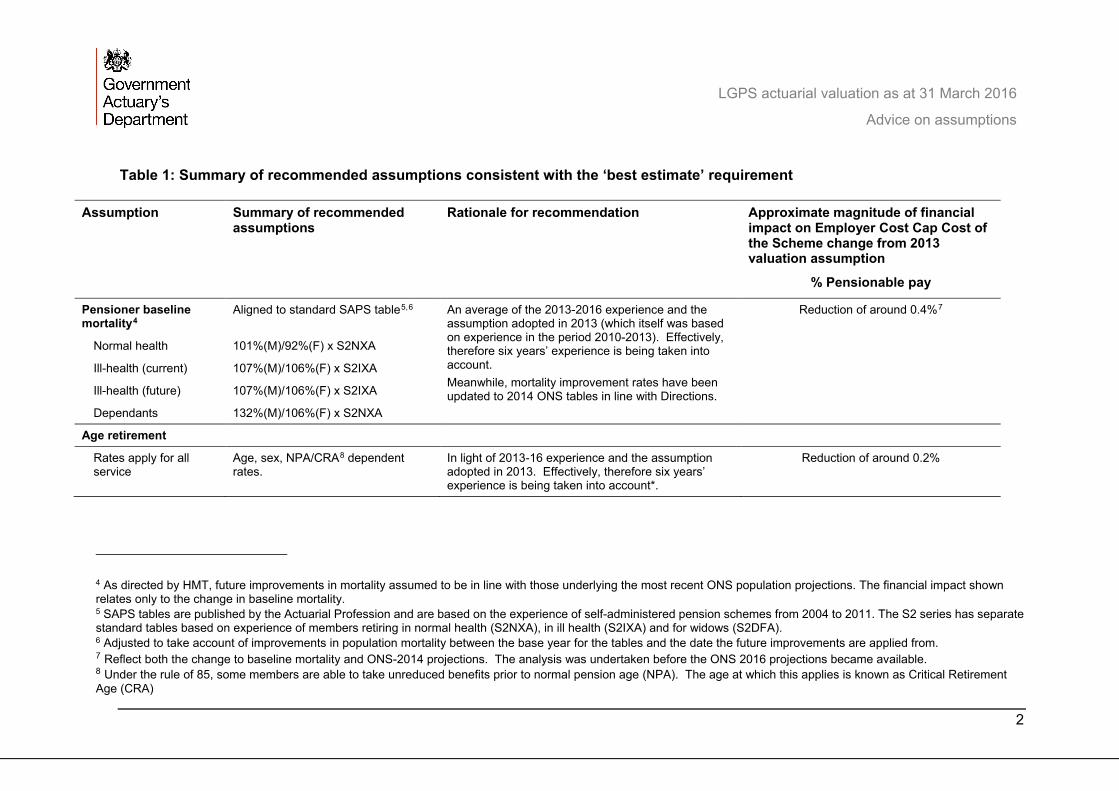
Table 1: Summary of recommended assumptions consistent with the ‘best estimate’ requirement
Assumption Summary of recommended assumptions
Rationale for recommendation Approximate magnitude of financial impact on Employer Cost Cap Cost of the Scheme change from 2013 valuation assumption
% Pensionable pay
Pensioner baseline mortality4
Aligned to standard SAPS table5,6 An average of the 2013-2016 experience and the assumption adopted in 2013 (which itself was based on experience in the period 2010-2013). Effectively, therefore six years’ experience is being taken into account. Meanwhile, mortality improvement rates have been updated to 2014 ONS tables in line with Directions.
Reduction of around 0.4%7
Normal health 101%(M)/92%(F) x S2NXA
Ill-health (current) 107%(M)/106%(F) x S2IXA
Ill-health (future) 107%(M)/106%(F) x S2IXA
Dependants 132%(M)/106%(F) x S2NXA
Age retirement
Rates apply for all service
Age, sex, NPA/CRA8 dependent rates.
In light of 2013-16 experience and the assumption adopted in 2013. Effectively, therefore six years’ experience is being taken into account*.
Reduction of around 0.2%
4 As directed by HMT, future improvements in mortality assumed to be in line with those underlying the most recent ONS population projections. The financial impact shown relates only to the change in baseline mortality. 5 SAPS tables are published by the Actuarial Profession and are based on the experience of self-administered pension schemes from 2004 to 2011. The S2 series has separate standard tables based on experience of members retiring in normal health (S2NXA), in ill health (S2IXA) and for widows (S2DFA). 6 Adjusted to take account of improvements in population mortality between the base year for the tables and the date the future improvements are applied from. 7 Reflect both the change to baseline mortality and ONS-2014 projections. The analysis was undertaken before the ONS 2016 projections became available. 8 Under the rule of 85, some members are able to take unreduced benefits prior to normal pension age (NPA). The age at which this applies is known as Critical Retirement Age (CRA)

LGPS actuarial valuation as at 31 March 2016
Advice on assumptions
3
Assumption Summary of recommended assumptions
Rationale for recommendation Approximate magnitude of financial impact on Employer Cost Cap Cost of the Scheme change from 2013 valuation assumption
% Pensionable pay
Ill-health retirement
Incidence Sex dependent rates increasing by age: 0.01% at age 30, 0.09%/0.06% (M/F) at age 45, 0.74%/0.62% (M/F) at age 60
An average of the 2013-2016 experience and the assumption adopted in 2013 (which itself was based on experience in the period 2010-2013). Effectively, therefore six years’ experience is being taken into account*. An average of the 2013-2016 experience and the assumption adopted in 2013
Immaterial
Upper/lower tier split 77% assumed to retire on tier 1 benefits, 10% tier 2 and 13% tier 3.
Immaterial
Withdrawal Sex dependent rates decreasing by age: 9.2%/10.2% (M/F) at age 25, 3.5/4.0% (M/F) at age 45, 1.7%/2.0% (M/F) at age 60
An average of the 2013-2016 experience, adjusted for expected rates of re-joining and the assumption adopted in 2013 (which itself was based on experience in the period 2010-2013, adjusted for re-joining). Effectively, therefore six years’ experience is being taken into account*.
Reduction of around 0.1%
Death before retirement Sex dependent rates increasing by age: 0.02%/0.01% (M/F) at age 25, 0.09%/0.05% (M/F) at age 45, 0.32%/0.19% (M/F) at age 60
An average of the 2013-2016 experience and the assumption adopted in 2013 (which itself was based on experience in the period 2010-2013). Effectively, therefore six years’ experience is being taken into account*. (Not adjusted for expected future improvements in mortality.)
Immaterial
LGPS actuarial valuation as at 31 March 2016
Advice on assumptions
4
Assumption Summary of recommended assumptions
Rationale for recommendation Approximate magnitude of financial impact on Employer Cost Cap Cost of the Scheme change from 2013 valuation assumption
% Pensionable pay
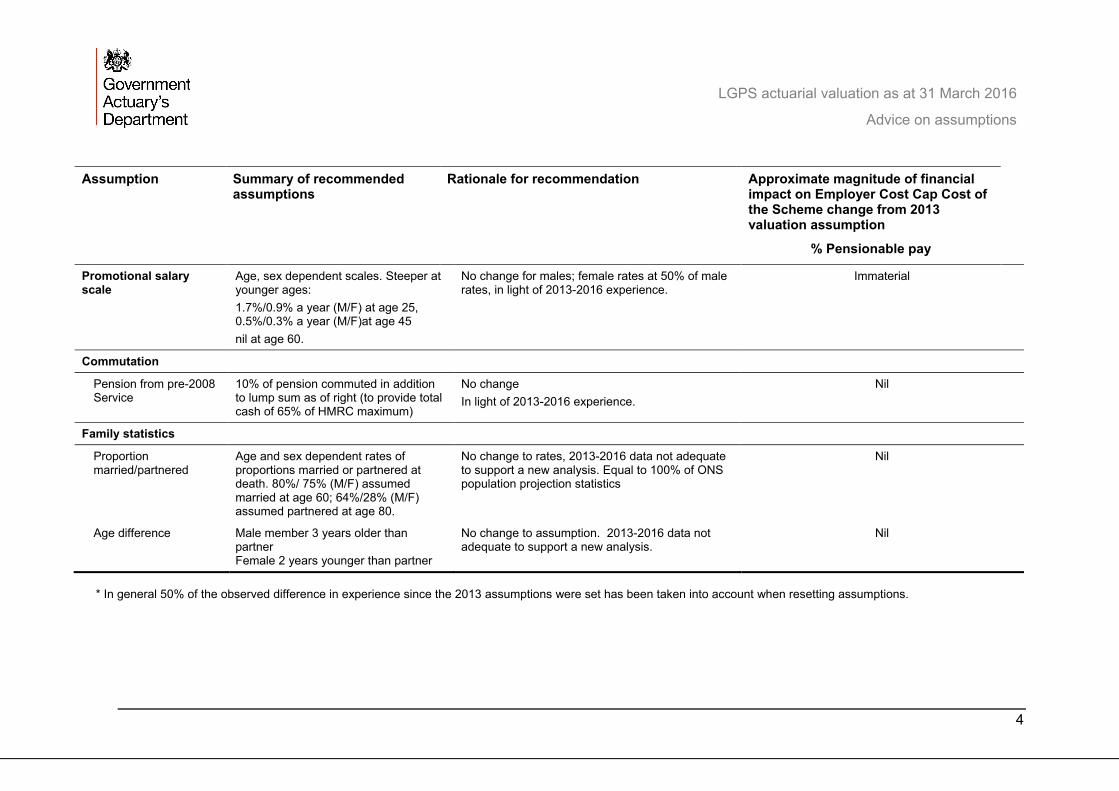
Promotional salary scale
Age, sex dependent scales. Steeper at younger ages: 1.7%/0.9% a year (M/F) at age 25, 0.5%/0.3% a year (M/F)at age 45 nil at age 60.
No change for males; female rates at 50% of male rates, in light of 2013-2016 experience.
Immaterial
Commutation
Pension from pre-2008 Service
10% of pension commuted in addition to lump sum as of right (to provide total cash of 65% of HMRC maximum)
No change In light of 2013-2016 experience.
Nil
Family statistics
Proportion married/partnered
Age and sex dependent rates of proportions married or partnered at death. 80%/ 75% (M/F) assumed married at age 60; 64%/28% (M/F) assumed partnered at age 80.
No change to rates, 2013-2016 data not adequate to support a new analysis. Equal to 100% of ONS population projection statistics
Nil
Age difference Male member 3 years older than partner Female 2 years younger than partner
No change to assumption. 2013-2016 data not adequate to support a new analysis.
Nil
* In general 50% of the observed difference in experience since the 2013 assumptions were set has been taken into account when resetting assumptions.

LGPS actuarial valuation as at 31 March 2016
Advice on assumptions
5
2 Introduction
2.1 An actuarial valuation of the Local Government Pension Scheme (‘LGPS’ or ‘the Scheme’) is being undertaken as at 31 March 2016. The Public Service Pensions (Valuations and Employer Cost Cap) Directions 2014 as amended (‘the Directions’) require that, unless specified otherwise9, the demographic actuarial assumptions to be adopted for this valuation are the responsibility of the Secretary of State for Housing, Communities and Local Government, having taken advice from the scheme actuary. Direction 19(c) requires the assumptions to be the Secretary of State’s best estimates.
2.2 GAD is the appointed scheme actuary to the Scheme. This report is addressed to the Secretary of State for Housing, Communities and Local Government and contains our formal advice on the appropriate assumptions to be adopted for the 2016 valuation, as required by the Directions. The purpose of this advice is to enable the Secretary of State to determine the required best estimate assumptions.
2.3 The advice covers the main assumptions to be set by the Secretary of State. In particular, we consider the following sets of demographic assumptions in this report:
> Pensioner mortality > Age retirement from service > Ill-health retirement from service > Voluntary withdrawal from service > Death before retirement > Promotional pay progression > Commutation of pension for cash at retirement > Family statistics
Appendix B includes other calculation assumptions as required to complete the valuation, Appendix C discusses assumptions made to deal with data uncertainties and Appendix D gives information on the sensitivity of the valuation results to assumptions set by the Secretary of State.
2.4 It should be noted that the assumptions set out in this report are not the same as those used locally to set employer contributions to the Scheme. Employer contributions are set locally, based on local actuarial advice, and the assumptions made vary between local funds.
9 Certain assumptions are specified in the Directions.
This report contains our advice to the Secretary of State for Housing, Communities and Local Government but will be of interest to other parties who should note the limitations.

LGPS actuarial valuation as at 31 March 2016
Advice on assumptions
6
2.5 This report was provided to the Secretary of State for Housing, Communities and Local Government in draft form in June 2017. The Secretary of State consulted with the LGPS Pension Scheme SAB (‘SAB’) in accordance with direction 19(b) and based on the draft report.
2.6 The Secretary of State has already confirmed to GAD, having consulted with relevant stakeholders, that the actuarial assumptions to be adopted for the valuation should be those set out in this report.
2.7 Local fund administrators supplied data on the experience of the scheme membership over the three-year period to 31 March 2016. We have used this data to analyse the Scheme’s experience in order to develop our advice on the assumptions. Our report, LGPS Actuarial Valuation at 31 March 2016: Report on valuation data also finalised today, provides information about this data and should be read in conjunction with this advice. The report includes details of the checks carried out on the data, the amendments made to the data and any residual concerns about the quality of the data. In preparing our advice, we have relied upon the general completeness and accuracy of the data provided.
2.8 When considering appropriate assumptions experience, both recent and longer term, generally provides the most reliable evidence when considering best estimates of future experience. Anticipated future events may also influence how assumptions are set. This advice sets out relevant analysis of recent experience and indicates which other factors have been considered in deriving recommendations of best estimate assumptions. The Secretary of State should consider whether there is any reason why this approach would be inappropriate.
2.9 We are content for the Secretary of State to release this report to third parties, provided that:
> it is released in full > the advice is not quoted selectively or partially > GAD is identified as the source of the report, and > GAD is notified of such release.
2.10 Third parties whose interests may differ from those of the Secretary of State for Housing, Communities and Local Government should be encouraged to seek their own actuarial advice where appropriate. Other than to the Secretary of State for Housing, Communities and Local Government, GAD has no liability to any person or third party for any act or omission taken, either in whole or in part, on the basis of this report.

LGPS actuarial valuation as at 31 March 2016
Advice on assumptions
7
3 General considerations
3.1 The key considerations taken into account in formulating the advice in this report are explained in this section.
Directions
3.2 The advice in this report reflects the requirements of the Directions issued by HM Treasury that assumptions should be set as the Secretary of State’s ‘best estimates’ of future experience and should contain no margin for prudence or optimism. They should be set having regard to:
> assumptions set for previous valuations > analysis of demographic experience in the period up to the valuation date > historic long term trends and emerging evidence which may illustrate long-
term trends in the future > relevant data from any other sources.
Different populations
3.3 The Directions require this actuarial valuation to cover both the scheme established under the Public Service Pensions Act 2013 (‘2014 Scheme’) and the previous pension schemes for local government workers (‘Earlier Schemes’). Assumptions appropriate to both the 2014 Scheme and the Earlier Schemes are required for the valuation. The Directions also require assessment of benefit accrual costs over the implementation period10 (as defined in the Directions). This requires assumptions about anticipated member behaviour and characteristics during 2019 - 2022 as well as assumptions about member behaviour and characteristics in the longer term.
3.4 There are currently 3 distinct groups of members.
> Existing members with membership accrued in the Earlier Schemes for whom the ‘Rule of 85’ continues to apply for service up to retirement: the introduction of the 2014 Scheme is not expected to have any impact on this group’s behaviour.
> New members to the 2014 scheme. These members’ retirement behaviours are expected to be heavily influenced by the provisions of the 2014 Scheme.
10 1 April 2019 to 31 March 2022
This chapter sets out a number of general considerations common to the setting of the different assumptions considered in this report.

LGPS actuarial valuation as at 31 March 2016
Advice on assumptions
8
> Members who have both service before 1 April 2014 and service after 1 April 2014 without ‘rule of 85’ protection. Behaviour is likely to be influenced by the provisions of the Earlier Schemes. Over time, as the proportion of 2014 Scheme service increases, the behaviour is expected to become increasingly influenced by the provisions of that scheme.
3.5 Where relevant we indicate in each of the following chapters the relative importance of each set of assumptions to each of the three groups of members identified above.
Relative importance of assumptions
3.6 The Directions require the valuation results to be estimated to the nearest 0.1% of pensionable payroll. This is a required level of accuracy for a particular calculation and based on a particular set of assumptions. Appendix D provides an indication of the sensitivity of the valuation results to the particular assumptions under consideration.

LGPS actuarial valuation as at 31 March 2016
Advice on assumptions
9
4 Pensioner Mortality
4.1 The assumptions we recommend for baseline pensioner mortality for the 2016 valuation may be summarised by reference to standard mortality tables as follows. The corresponding assumptions for the 2013 valuation are also shown.
Table 4.1: Recommended mortality assumptions
2016 valuation 2013 valuation
Baseline mortality Standard table11 Adjustment Standard
table Adjustment
Males
Retirements in normal health S2NMA 101% S1NMA 99%
Current ill-health pensioners S2IMA 107% S1IMA 104%
Future ill-health pensioners S2IMA 107% S1IMA 104%
Dependants S2NMA 132% S1DMA 120%
Females
Retirements in normal health S2NFA 92% S1NFA 93%
Current ill-health pensioners S2IFA 106% S1IFA 106%
Future ill-health pensioners S2IFA 106% S1IFA 106%
Dependants S2NFA 106% S1DFA 101%
11 SAPS (S2) tables are published by the Actuarial Profession and based on the experience of self-administered pension schemes over the period 2004 to 2011. The ‘S2’ series has separate standard tables based on experience of members retiring in normal health (S2NXA) and in ill health (S2IXA) and for dependants (S2DXA). The S3 series of tables were released by CMI on 5 December 2018, these updated mortality tables cover experience between 2009 and 2016. The final tables are unchanged from the working paper issued during 2018, from which GAD concluded that moving to the S3 tables would likely have no material impact on the valuation results as a whole. It therefore remains appropriate to use the S2 tables for the current valuation.
This chapter sets out our recommendation for the baseline pensioner mortality assumptions and summarises the analysis undertaken in order to inform that recommendation.

LGPS actuarial valuation as at 31 March 2016
Advice on assumptions
10
4.2 As specified by HM Treasury, future improvements in mortality will be assumed to be in line with those underlying the most recent ONS principal population projections for the UK, ONS 2016.
Comparison of expected pensioner longevity
4.3 Table 4.2, below, gives a comparison of the resulting life expectancies12 (allowing for future improvements) assumed and recommended for the 2013 and 2016 valuations. The middle column shows life expectancies on the 2013 base tables but with future improvements based on the ONS 2016 projections. This column is provided to illustrate the impact of the change in allowance for future improvements on expected life expectancy.
Table 4.2: Comparison of life expectancies (years) at the valuation date
2013 base tables
ONS 2012 Age 65 in 2013
2013 base tables
ONS 2016 Age in 2016
2016 base tables
ONS 2016 Age in 2016
Current pensioners
Male aged 60 28.3 27.3 27.5
Male aged 65 23.4 22.4 22.6
Female aged 60 31.4 29.9 30.0
Female aged 65 26.4 24.9 25.0
Future pensioners – current age 45
Male life expectancy from age 60 30.0 28.0 29.1
Male life expectancy from age 65 25.5 24.4 24.6
Female life expectancy from age 60 33.1 31.4 31.5
Female life expectancy from age 65 28.6 26.8 26.9
Use of the assumption
4.4 Pensioner mortality is a key valuation assumption and is a measure of how long members retiring in normal or ill-health, or their dependants, expect to live and receive benefits.
12 Cohort life expectancies based on the ages shown as at the valuation date, i.e. allowing for future mortality improvement .

LGPS actuarial valuation as at 31 March 2016
Advice on assumptions
11
Analysis and setting the assumption
4.5 We have analysed the actual pensioner mortality experience over the three-year period to 31 March 2016 on an ‘amounts’ basis. An amounts basis weights the experience by the size of each member’s pension. To derive an assumption we have compared the actual total amounts of pension ceasing on death with that expected had the members’ experience been in line with the mortality rates in the relevant current SAPS tables (‘S2 tables’). The recommended assumption of baseline pensioner mortality is expressed by reference to suitable adjustments to the rates in the relevant S2 table (‘the base table’).
4.6 The three year period ending on the valuation date showed significant volatility in mortality experience year on year. This is illustrated in Table 4.3 (for normal health only) below. The figures shown are the ratios of actual to expected death rates with expected rates based on the 2013 valuation assumptions, adjusted as appropriate for each period analysed. This analysis suggests that differing conclusions may have been drawn had the valuation date and inter-valuation period fallen differently. As assumptions are intended to reflect long term expectations it is reasonable to seek to smooth out the impact of these short term effects. Our recommendation is that the short term effects should be smoothed out by taking account of only 50% of the difference in experience since the 2013 valuation.
Table 4.3 – Variation in rates of death by scheme year
Year
Normal health males (Actual vs Expected based on 2013 assumption*)
Normal health females (Actual vs Expected based on 2013 assumption*)
2013-14 92.7% 96.5%
2014-15 97.8% 98.7%
2015-16 90.8% 90.6%
Overall 93.8% 95.1%
*2013 baseline with ONS-2014 improvements13
Results of analysis
4.7 Table 4.4 sets out the number of pensioner deaths and amount of pension ceasing over the intervaluation period. Figures are shown separately for males and females retiring in normal or ill-health and for dependants.
13 The analysis was undertaken before the ONS 2016 projections became available. A similar conclusion would be reached if the analysis was updated to take these later projections into account.

LGPS actuarial valuation as at 31 March 2016
Advice on assumptions
12
4.8 For ill health deaths, we have based our analysis on over 50 year olds only as data is less credible below that age. The figures for ill health deaths in table 4.4 include over 50 year olds only.
Table 4.4: Pensioner mortality experience 2013-16
Category Number of Pensions ceasing due to death
Pension amount ceasing due to death £’000s (pa)
A/E* relative to the 2013 valuation assumption†
Normal Health: Males 28,852 176,886 93.8% Females 25,163 76,355 95.1% Ill Health#:
Males 9,777 55,179 102.7% Females 8,298 31,646 103.3% Dependants:
Males 3,536 3,578 107.5% Females 20,254 55,090 104.0%
*A/E is actual amount of pension ceasing on death divided by that expected † With ONS-201414 improvements in each case # For ill health figures represent deaths above age 50 only.
4.9 The proposed assumption is a combination of the previous assumption and the last three years’ experience, and is based on the latest S2 base tables.
Results of Analysis: Normal Health Pensioner Mortality
4.10 The charts below show by age, and for males and females separately,
> the actual mortality experience (amount of pension ceasing) over the three year period with that
> expected pension ceasing based on the 2013 valuation assumption15
> the proposed assumption15
14 The analysis was undertaken before the ONS 2016 projections became available. A similar conclusion would be reached if the analysis was updated to take these later projections into account. 15 In each case with ONS-2014 improvements

LGPS actuarial valuation as at 31 March 2016
Advice on assumptions
13
4.11 The proposed assumption (red line) in each case is broadly midway between the 2013 assumption (green line) and the experience – reflecting the fact that we are proposing taking into account 50% of the actual mortality experience over 2013-2016 (see paragraph 4.6).
Chart 4.1: Male normal health pensioner mortality experience 2013-16
Chart 4.2: Female normal health pensioner mortality experience 2013-16

LGPS actuarial valuation as at 31 March 2016
Advice on assumptions
14
Comments on analysis
4.12 The ‘shape’ of the proposed base table is more representative of the Scheme’s experience (particularly for females at older ages) than the previous assumption.
Results of Analysis: Ill-Health Pensioner Mortality
4.13 Charts 4.1 and 4.2 are repeated below for ill-health retirees. As for normal health retirements the proposed assumption (red line) in each case is broadly midway between the 2013 assumption (green line) and the experience – reflecting the fact that we are proposing taking into account 50% of the actual mortality experience over 2013-2016.
Chart 4.3: Male ill-health pensioner mortality experience 2013-16

LGPS actuarial valuation as at 31 March 2016
Advice on assumptions
15
Chart 4.4: Female ill-health pensioner mortality experience 2013-16
Comments on ill-health analysis
4.14 For ill-health pensioners, an assumption has been derived by fitting the 2013-2016 experience to a standard table for ages 50 and upwards only. This was because the experience data at ages below age 50 did not give a satisfactory fit against a standard table. We do not consider is an issue worth pursuing further since we expect any impact on the valuation results would be immaterial.
4.15 For future ill-health retirements we recommend the same base table as for current ill-health pensioners. We do not hold sufficient data on those retiring under the current (new) ill-health arrangements to carry out a credible mortality analysis relative to previous retirements; therefore a pragmatic approach is needed to setting the assumption for the mortality of future ill-health pensioners.

LGPS actuarial valuation as at 31 March 2016
Advice on assumptions
16
Results of Analysis: Dependant Pensioner Mortality
4.16 Charts 4.1 and 4.2 are repeated below for dependants.
Chart 4.5: Male Dependants mortality experience 2013-16
Chart 4.6: Female Dependants mortality experience 2013-16
0
50,000
100,000
150,000
200,000
250,000
50 51 52 53 54 55 56 57 58 59 60 61 62 63 64 65 66 67 68 69 70 71 72 73 74 75 76 77 78 79 80 81 82 83 84 85 86 87 88 89 90 91 92 93 94 95
Amou
nt o
f Pen
sion
Ceas
ing
(£)
Age
Dependent MenActual vs Expected Pension Ceasing on Death
Experience 2016 Proposal 2013 Assumption

LGPS actuarial valuation as at 31 March 2016
Advice on assumptions
17
Comments on Dependants analysis
4.17 In the case of male dependants the analysis is not particularly robust given the limited number of deaths involved (women typically outlive men). Despite these reservations, for consistency, we have recommended an assumption derived in the same way as for normal health retirements by taking account of 50% of the change in experience since the previous valuation.
4.18 In the case of female dependants the experience suggests slightly heavier mortality of the dependant population compared to that of female members (when compared to the standard tables). As above, we have recommended an assumption by taking account of 50% of the change in experience since the previous valuation.

LGPS actuarial valuation as at 31 March 2016
Advice on assumptions
18
5 Age retirement from service
Proposed assumptions for 2016 valuation
5.1 We recommend that a separate assumptions are adopted depending on the member’s Critical Retirement Age (CRA, the age at which members can take unreduced benefits under the ‘rule of 85’):
> CRA 65: members joining on or after 1 Oct 2006 (including new entrants to 2014 Scheme), and all members not entitled to unreduced benefits before age 65 under the ‘Rule of 85’
> CRA 60: members entitled to unreduced benefits at age 60 under the ‘Rule of 85’
> CRA 62: members entitled to unreduced benefits at between 60 and 65 under the ‘Rule of 85’ (for simplicity, these members are assumed to have CRA 62)
5.2 We recommend that the assumptions also reflect the member’s NPA in the 2014 scheme, which is equal to the member’s State Pension age (SPa), or age 65 if later.
5.3 The recommended age retirement rates for CRA 60 and 65 are based on experienced rates of age retirement. Our analysis showed that there was some change in the experienced rates in the three years 2013-2016. We recommend that this should be smoothed by taking an average of the 2013-2016 experience and the assumption adopted in 2013.
5.4 There are fewer members in the CRA 62 group than CRA 60 or 65, so there is less experience for this group. The recommended age retirement rates for CRA 62 reflect the benefit structure and are based on those for CRA 60 and CRA 65.
5.5 For members with CRA 60 or 62 and SPA 67 or 68, it is assumed that age retirement patterns will reflect both pre-2014 benefits (with CRA 60 or 62) and post 2014 benefits (with NPA 67 or 68), and the assumed rates are intermediate between those for CRA 60 / CRA 62 and those for new entrants to the 2014 scheme (which are equal to the assumed rates for CRA 65 members).
5.6 The recommended assumptions are intended to exclude the incidence of early retirement occurring as a result of redundancy (which is taken as including business efficiency or any similar circumstance in which the employment termination and early payment of benefits is supported by the employer under regulation 30(7) of the 2013 regulations).
Previous valuation assumptions
5.7 The 2013 valuation assumptions followed the same structure as the 2016 rates set out above. However:
This chapter sets out our recommendation for the assumed patterns of retirement on grounds other than ill-health, and summarises the analysis undertaken in order to inform that recommendation.

LGPS actuarial valuation as at 31 March 2016
Advice on assumptions
19
> The recommended 2016 rates assume fewer members retire at CRA (2013 rates: 31% (Men), 30 (Women) retire at CRA; 2016 rates: 25% (Men and Women) retire at CRA)
> The recommended 2016 rates assume that more CRA 65 members retire at and before age 60 (2013 rates: 9% retire at 60, 0.3% (Men), 0.2% (Women) each year age 55-59, 2016 rates: 10.5% retire at 60, 2% each year age 55-59)
Financial effect of early and late retirement
5.8 The actuarial reductions/uplifts applied to the pensions of those who retire earlier/later than the earliest age at which they can take unreduced benefits are intended to mean that the timing of a member’s retirement does not affect the cost to the scheme of providing their benefits. However, this is not true in all circumstances and so having an explicit assumption for a spread of retirements will provide a materially more accurate reflection of the cost of the Scheme so long as future experience is in line with the assumptions.
5.9 The main ways in which the spread of retirements (on grounds other than ill-health) affects the financial position of the Scheme (and ultimately the cost cap mechanism) are:
> Members who retire after their CRA but before age 65 do not receive a late retirement uplift. If members defer retirement beyond their CRA in this way this will, other things being equal, reduce the cost of providing benefits
> The actuarial reduction on early retirement is set at a level to give an early retirement pension, broadly the same value as the deferred benefit for someone leaving at the same age. If more members than expected take early retirement, other things being equal, this will reduce the cost of providing benefits because they are foregoing future (assumed) salary increases to their benefit.
> Since commutation terms do not vary by age, then if a member retiring early commutes part of their pension for cash, the cost of providing the benefit is reduced, due to the widening differential between the cost of providing pension and cash.
5.10 The financial impact of late retirement beyond NPA is much less material and we do not propose to model such late retirements explicitly.
Analysis and setting the assumption
5.11 The following charts set out our analysis for selected CRA/NPA/gender combinations, comparing the actual rate of normal health retirements for members by sex and CRA, to that expected based on the 2013 valuation assumptions.

LGPS actuarial valuation as at 31 March 2016
Advice on assumptions
20
Chart 5.1: CRA 60 NPA 65 male
Chart 5.2: CRA 60 NPA 65 female
5.12 The charts show that the number of members retiring at CRA 60 and between age 61 and 65 were lower than expected based on the 2013 assumptions.
0.000
0.100
0.200
0.300
0.400
55 56 57 58 59 60 61 62 63 64 65 66 67 68
Age
Retir
emen
t Rat
e
Age
CRA60, NPA 65, Male
2013 Assumptions 2016 experience before smoothing 2016 final assumptions
0.000
0.100
0.200
0.300
0.400
55 56 57 58 59 60 61 62 63 64 65 66 67 68
Age
Retir
emen
t Rat
e
Age
CRA60, NPA 65, Female
2013 Assumptions 2016 experience before smoothing 2016 final assumptions

LGPS actuarial valuation as at 31 March 2016
Advice on assumptions
21
Chart 5.3: CRA 65 NPA 65 male
Chart 5.4: CRA 65, NPA 65 female
5.13 The charts show that the number of members retiring at between ages 55 and 60 and at age 60 were higher than expected based on the 2013 assumptions.
5.14 Tables 5.1 sets out the assumptions proposed for age retirement. The recommended rates are based on the average between the 2013 assumptions and the 2013-16 experience, with the following amendments:
0.000
0.050
0.100
0.150
0.200
55 56 57 58 59 60 61 62 63 64 65 66 67 68
Age
Retir
emen
t Rat
e
Age
2013 Assumptions 2016 experience before smoothing
2016 final assumptions
0.000
0.050
0.100
0.150
0.200
55 56 57 58 59 60 61 62 63 64 65 66 67 68
Age
Retir
emen
t Rat
e
Age
2013 Assumptions 2016 experience before smoothing
2016 final assumptions

LGPS actuarial valuation as at 31 March 2016
Advice on assumptions
22
> For Women with CRA 60, the rate between CRA and NPA is set equal the rate for Men (13%, rather than 16% without this adjustment), as the experience may be higher that we might expect in the longer term if it is influenced by the fact that the State Pension age for Women was below 65 during the period.
> For Men and Women with CRA 65, the rate for age 55-59 is set equal to 2% per year (rather than 1.2% for Men / 1.1% for Women), in line with most recent experience, and consistent with the rate for members with CRA 60)
> For Women with CRA 60, the rate at CRA is set equal to 25% (rather than 24.5%)
> Rates for CRA 62 are set equal to the CRA 65 rates below age 62 and equal to the CRA 60 rates at age 62 and above.
Table 5.1: Summary of age retirement assumptions
CRA60, CRA61 to 64,
CRA65 and new members to 2014
scheme
NPA65 or 66 NPA65 or 66
Males Females Males Females Males Females
Age 55-59 2.0% 2.0% 2.0% 2.0% 2.0% 2.0% Age 60 25.0% 25.0% 10.5% 10.5% 10.5% 10.5% Age 61 13.0% 13.0% 9.0% 9.0% 9.0% 9.0% Age 62 13.0% 13.0% 25.0% 25.0% 9.0% 9.0% Age 63 to NPA 13.0% 13.0% 13.0% 13.0% 9.0% 9.0% NPA 100.0% 100.0% 100.0% 100.0% 100.0% 100.0%
5.15 Detailed tables of the assumed rates are shown in Appendix A. For members with
CRA 60 or 62 and SPA 67 or 68, the assumed rates are intermediate between those for CRA 60 / CRA 62 as set out above and those for new entrants to the 2014 scheme (which are equal to the assumed rates for CRA 65 members).

LGPS actuarial valuation as at 31 March 2016
Advice on assumptions
23
6 Ill-health retirement from service
Proposed assumptions for 2016 valuation
6.1 We recommend that a single set of assumptions (separate for men and women) is used to allow for the incidence of ill-health retirement.
6.2 Our analysis showed that there was some volatility in the experienced rates of ill-health in each of the three years 2013-2016. We therefore recommend that this should be smoothed by taking an average of the 2013-2016 experience and the assumption adopted in 2013 (which itself was based on experience in the period 2010-2013). Effectively, therefore six years’ experience is being taken into account in setting the assumption.
6.3 Resulting rates of ill-health increase with age albeit that fewer than 1% of members are assumed to retire on ill-health grounds each year, except above age 60.
6.4 We also recommend assuming that 77% of members retiring on ill-health grounds will receive the tier 1 benefit while 10% will receive the tier 2 benefit and 13% will receive tier 3 benefit, being the average of the 2013 assumption and the 2013-2016 experience.
6.5 Ill-health retirement rates specify the rate at which members are assumed to retire on grounds of ill-health. The rates of mortality experienced after ill-health retirement are also relevant to the valuation calculations and are discussed in Section 4 of this report.
Previous valuation assumptions
6.6 The proposed 2016 assumptions are approximately 87% for both men and women of the rates adopted for the 2013 actuarial valuation.
6.7 The assumed proportion of members eligible for tier 1 benefits16 is unchanged from that adopted for the previous valuation at 77%.
16 Tier 1 provides a higher level of benefit than tier 2, while tier 3 provides a benefit for a limited period after which a review takes place.
This chapter sets out our recommendation for the assumed rates of retirement on the grounds of ill-health, and summarises the analysis undertaken in order to inform that recommendation.

LGPS actuarial valuation as at 31 March 2016
Advice on assumptions
24
Analysis and setting the assumption
Ill health incidence
6.8 There were around 4,500 ill-health retirements over the three-year period to 31 March 2016 compared to an expected 6,100 retirements based on the 2013 assumptions.
6.9 We have compared the actual rate of ill-health retirements (by gender and age of retirement) to the expected rate from the 2013 actuarial valuation and the recommended assumption has been based on this comparison.
6.10 Table 6.1 summarises the rates proposed for the 2016 valuation.
Table 6.1: Recommended ill health retirement assumptions
Age Males Females 20 0.0000 0.0000 25 0.0001 0.0000 30 0.0001 0.0001 35 0.0002 0.0001 40 0.0004 0.0003 45 0.0009 0.0006 50 0.0018 0.0013 55 0.0036 0.0028 60 0.0074 0.0062 65 0.0151 0.0134
Results of analysis
6.11 The charts below show actual numbers of ill-health retirements at each age compared to the number expected to ill-health retire based on the 2013 assumption and the number expected to retire on the proposed assumption.

LGPS actuarial valuation as at 31 March 2016
Advice on assumptions
25
Chart 6.1: Proposed male ill-health retirement rate assumption
Chart 6.2: Proposed female ill-health retirement rate assumption

LGPS actuarial valuation as at 31 March 2016
Advice on assumptions
26
Comments on ill-health retirement analysis
6.12 The charts above show a reasonably good alignment of experience against the proposed assumptions for both men and women, and noting that the numbers retiring at each age are relatively small. Overall around 25% fewer women and 26% fewer men than expected retired on ill-health grounds over the three-year period. For this reason we recommend that the assumed rates of ill-health retirement for women are reduced a little for the purposes of the 2016 valuation. Allowing for some expected fluctuation in experience over periods of time we recommend that around half of the difference in experience is reflected in the revised assumption for both men and women i.e. the rates are set equal to around 87% of those adopted for the 2013 valuation.
Split between tiers
6.13 The table below shows the percentage of members retiring on ill-health grounds over the four-year period who qualified for upper tier benefits. Over the period 2010-2013 the percentage of upper tier awards was 77% i.e. the current intervaluation experience is very similar to that from the previous period. In both cases these figures allow for members retiring with lower tier benefits and later qualifying for upper tier.
Table 6.2: Ill-health retirements on tier 1
2013/14 2014/15 2015/16 Total
Males 79% 75% 74% 76%
Females 77% 80% 77% 78%
6.14 Averaging this evidence with the 2013 assumptions led to an assumption that members receive for tier 1, tier 2 and tier 3 benefits according to the following table. The assumption remains of minor financial significance whilst ill-health incidence rates remain low and variations between actual experience and that expected remains low.
Table 6.2: Proposed Ill-health retirement tiers
Tier 1 Tier 2 Tier 3 77% 10% 13%

LGPS actuarial valuation as at 31 March 2016
Advice on assumptions
27
7 Voluntary withdrawal from service
Proposed assumptions for 2016 valuation
7.1 We recommend that a single set of assumptions (separate for men and women) is used to allow for the incidence of voluntary withdrawal from service.
7.2 We recommend that this assumption should be smoothed by taking an average of the 2013-2016 experience and the assumption adopted in 2013 (which itself was based on experience in the period 2010-2013). Effectively, therefore six years’ experience is being taken into account in setting the assumption.
7.3 We recommend basing the assumption on the experience of those voluntarily withdrawing from service after being a member of the scheme for at least three years.
7.4 Resulting rates of voluntary withdrawal from service decrease with age.
Previous valuation assumptions
7.5 The proposed 2016 assumptions are approximately 13% higher than the rates adopted for the previous valuation.
Analysis and setting the assumption
Voluntary withdrawal from service incidence
7.6 In setting the withdrawal assumption, we analysed actual withdrawal experience over the three years to 31 March 2016, adjusted this for the rate at which members rejoin, then took the average of the implied net withdrawal rate and the assumption adopted in 2013.
7.7 Data analysed suggested a very high level of voluntary withdrawal from service, relative to the assumption set for the 2013 valuation. The period since 31 March 2013 has however been affected by auto-enrolment: people being automatically enrolled into the Scheme, then leaving shortly afterwards, which would have served to push up the incidence of voluntary withdrawal from service.
7.8 The data for the three years indicated that a significant proportion (around 26%) of the exits were also in the active member data set as at 31 March 2016. We inferred that these were people who had left the scheme, but subsequently rejoined. This could include both genuine exits and rejoiners, as well as those who have been processed as an exit, for example if they had taken a new role with the same or a different employer. In either case, they are entitled to continuation of service in respect of final salary benefits provide they return within 5 years.
This chapter sets out our recommendation for the assumed rates of voluntary withdrawal from active service, and summarises the analysis undertaken in order to inform that recommendation.

LGPS actuarial valuation as at 31 March 2016
Advice on assumptions
28
7.9 Since the analysis was based on three, rather than five, years’ data, we rounded the rate of rejoining up from 26% to 30%.
Analysis excludes short term leavers
7.10 In a CARE scheme where active members’ benefits are revalued in line with CPI, members leaving voluntarily do not significantly affect the cost of providing benefits. Under a final salary scheme, members who leave after short periods do not have large liabilities and therefore again have only minor impact on the cost of the scheme.
7.11 Consequently, to avoid distortions resulting from the possible short term impact of auto-enrolment, for the purpose of setting the assumption for voluntary withdrawal from service, we have analysed data for members leaving service having completed three or more years’ service.
7.12 Data analysed contained around 124,000 exits with more than three years’ service over the three-year period to 31 March 2016 compared to an expected 69,000 retirements based on the 2013 assumptions. That is experience was 80% higher than expected in the 2013 valuation. However, evidence suggests a high proportion of leavers rejoin the Scheme, so the net effect is around 25% more withdrawals than expected.
7.13 Table 7.1 summarises the rates proposed for the 2016 valuation.
Table 7.1: Recommended Voluntary withdrawal from service assumptions
Age Males Females 20 0.1171 0.1282 25 0.0921 0.1017 30 0.0725 0.0807 35 0.0570 0.0640 40 0.0448 0.0507 45 0.0353 0.0403 50 0.0278 0.0319 55 0.0218 0.0253 60 0.0172 0.0201 65 0.0135 0.0159
Results of analysis
7.14 The charts below show the actual experience compared with the 2013 assumption and the proposed assumption for 2016.
Chart 7.1: Proposed male voluntary withdrawal from service assumption

LGPS actuarial valuation as at 31 March 2016
Advice on assumptions
29
Chart 7.2: Proposed female voluntary withdrawal from service assumption

LGPS actuarial valuation as at 31 March 2016
Advice on assumptions
30
Comments on voluntary withdrawal from service analysis
7.15 The experience lines in charts 7.1 and 7.2 is unadjusted for rejoiners.
7.16 Even after adjusting for an assumed rate of rejoining, experience during the three years to 31 March 2016 has been that more members have voluntarily withdrawn from the scheme than expected. This is after allowing for the effects of auto-enrolment – i.e. noting that these charts represent withdrawals of members with three or more years’ service.
7.17 It is too early to tell if this is part of a trend. The rates of withdrawal were higher in the first two years than the third relative to expectations.
7.18 We recommend that the assumed rates of voluntary withdrawal are increased for the purposes of the 2016 valuation to allow for half of the difference in experience i.e. the rates are set equal to around 13% higher than those adopted for the 2013 valuation.

LGPS actuarial valuation as at 31 March 2016
Advice on assumptions
31
8 Death before retirement
Proposed assumptions for 2016 valuation
8.1 We recommend that a single set of assumptions (separate for men and women) is used to allow for the possibility of death before retirement. Assumed rates of death in service increase with age but less than 0.5% of members are assumed to die each year, even at the highest ages for active members.
Previous valuation assumptions
8.2 The proposed 2016 assumptions are 98% of the rates adopted in the previous valuation for men and 94% of the previous rates adopted for women.
Use of the assumption
8.3 Death before retirement rates are used to allow for the possibility of deaths whilst in active service or whilst entitled to a deferred pension. The numbers of deaths observed annually, and the recommended rates to be assumed are low, and thus this assumption has relatively little financial significance.
Analysis and setting the assumption
To formulate a recommended assumption we compared the scheme experience to the expected rates from the 2013 actuarial valuation. In total we analysed around 2,400 deaths of active members, compared to an expected number of 2,643 based on the 2013 valuation assumption.
Table 8.1 Proposed death before retirement assumption
Age Males Females 20 0.0002 0.0001 25 0.0002 0.0001 30 0.0003 0.0001 35 0.0005 0.0002 40 0.0006 0.0003 45 0.0009 0.0005 50 0.0013 0.0008 55 0.0021 0.0012 60 0.0032 0.0019 65 0.0050 0.0029
8.4 The graphs below compare the rates of actual and expected deaths by age for men and women respectively. In each case expected deaths are shown by reference to the 2013 valuation assumptions.
This chapter sets out our recommendation for the assumed rates of death before retirement, and summarises the analysis undertaken in order to inform that recommendation.

LGPS actuarial valuation as at 31 March 2016
Advice on assumptions
32
Chart 8.1: Proposed male death before retirement assumption
Chart 8.2: Proposed female death before retirement assumption

LGPS actuarial valuation as at 31 March 2016
Advice on assumptions
33
Comments on death before retirement analysis
8.5 Data was only available on deaths of members in active service though the assumption is used for all non-pensioner members.
8.6 Around 9% fewer people than expected died before retirement over the three-year period.
8.7 We recommend that the assumed rates of death before retirement are reduced for the purposes of the 2016 valuation to allow for 50% of the difference in experience i.e. the rates are set equal to around 98% and 94% of those adopted for the 2013 valuation for men and women respectively.

LGPS actuarial valuation as at 31 March 2016
Advice on assumptions
34
9 Promotional pay increases
Proposed assumptions for 2016 valuation
9.1 We recommend assuming separate scales of promotional increases for men and women. The increases are dependent on age and, although relatively flat, are steeper at younger ages.
Previous assumption
9.2 The assumption adopted for the 2013 valuation for men is the same as that now recommended for the 2016 valuation. For women, a separate scale of promotional increases was adopted which was equivalent to around 50% of the assumption for male members except that no promotional pay increases were assumed after age 40.
Use of the assumption
9.3 For members who joined the Scheme prior to 31 March 2014, benefits earned prior to that date are linked to pay at or near retirement. Members’ pay can increase through a combination of general annual pay awards and promotional increases, or other increases. To calculate an estimate of the level of benefit payable in the future requires assumptions for both these components. The assumption for general pay awards is directed by HMT. The assumption for promotional pay increases is set by the Secretary of State for Housing, Communities and Local Government.
Analysis and setting the assumption
9.4 To formulate a recommended assumption we compared the scheme experience to the assumption adopted for the 2013 valuation. Two types of analysis can be considered.
> Profile analysis: This considers the overall active membership as at 31 March 2016 and compares average (whole time equivalent or ‘WTE’) pensionable pay at each year of age with that at other ages. This analysis illustrates how (average WTE) pay varies by age and may be a suitable basis on which to set an age related pay scale.
> Starter/ender analysis: This analysis would consider only those members who were in active membership at both the 2013 and 2016 valuation dates. For those members we would calculate their increase in pensionable pay (WTE) over the period (net of assumed general pay increases) and compare the average increase with that assumed. The rates of assumed increase being based on the members’ ages over the intervaluation period and the 2013 valuation assumptions. This analysis would illustrate how actual promotional pay increases have impacted actual members which could form a suitable basis on which to set an age related pay scale.
This chapter sets out our recommendation for the assumed promotional pay increases of active members, and summarises the analysis undertaken in order to inform that recommendation.

LGPS actuarial valuation as at 31 March 2016
Advice on assumptions
35
9.5 In practice we were able to do starter/ender analysis, but we proposed assumptions based on the profile analysis because data for the second analysis, where available, include general increases, promotional pay increases and so called pay drift. These components were not able to be separated because:
> The headline pay increases we were provided were for Local Authority employers only, pay awards for other employers could be significantly different and we have no data for these.
> The period in question was atypical because of general austerity, auto-enrolment and the high number of withdrawals experienced.
Results of analysis
9.6 The following table sets out a sample of rates of increases by age for men and women that we recommend.
Table 9.1 Recommended promotional increase rates
Age Males Females 20 0.4% 0.2% 25 1.7% 0.9% 30 1.1% 0.6% 35 0.7% 0.4% 40 0.6% 0.3% 45 0.5% 0.3% 50 0.0% 0.0% 55 0.0% 0.0% 60 0.0% 0.0% 65 0.0% 0.0%

LGPS actuarial valuation as at 31 March 2016
Advice on assumptions
36
9.7 We can express these rates as an implied level of salary at each age, age 30 = 100.
Table 9.1 Recommended promotional increase rates, age 30 = 100
Age Males Females 20 90 95 25 92 96 30 100 100 35 105 103 40 109 104 45 112 106 50 115 107 55 115 107 60 115 107 65 115 107
9.8 The charts below show the implied age related promotional pay scales for men and women respectively based on the pay profile of all members at the valuation date. These are compared with the assumed age related promotional scales adopted for the 2013 valuation.
Chart 9.1: Male promotional pay scale

LGPS actuarial valuation as at 31 March 2016
Advice on assumptions
37
Chart 9.2: Female promotional pay scale
Comments on the analysis
9.9 The analysis above should be treated with some caution, for the reasons set out below.
9.10 In respect of the starter / ender analysis:
> Not all members will benefit from the same headline pay award. The headline pay increases we were provided were for Local Authority employers only, pay awards for other employers could be significantly different and we have no data for these.
> It is often the case that average pay increases by more than the headline general pay award (usually referred to as ‘pay drift’). We have only allowed for the headline general pay award and so any drift will be included in this analysis. HMT have included an allowance for drift in their directed general earnings increase assumption. If the promotional salary assumption also includes drift then this will be double counted.
9.11 In respect of the profile analysis, the population at each age is not homogeneous thus the profile analysis could be distorted by a changing mix of members and different behaviours at different ages.
9.12 In respect of both analyses, the period in question was atypical because pay restraint. It is possible that in a period of general pay restraint, such as the intervaluation period, that increases in other elements of pay may not be representative of the level of increases in periods of more normal pay growth. For this reason care should be applied when considering if the evidence from recent periods would be equally applicable to other periods.

LGPS actuarial valuation as at 31 March 2016
Advice on assumptions
38
9.13 The results of the analyses are that, although somewhat volatile, the assumption adopted in 2013 for men appears not to be inconsistent with experience for men in terms of the broad overall shape of that experience. For women, the rates of increase appear slower at most ages compared with those for men (except in the mid/late 40s). There also appears to be a negative “spike” for women at age 38, the reason for which is not known and without further evidence we would not propose to make an allowances for this in the assumptions. However, there does appear to be evidence of promotional pay increases for females between ages 40 and 50, where none was assumed at the 2013 valuation.
9.14 For the reasons above our recommendation is that no change should be made to the pay scales for men assumed for the 2013 valuation, but the evidence of pay increases for women beyond age 40 suggests a change should be made to 50% of the scales adopted for men, including allowance for promotional pay between the ages of 40 and 50.

LGPS actuarial valuation as at 31 March 2016
Advice on assumptions
39
10 Commutation of pension for cash at retirement
Proposed assumptions for 2016 valuation
10.1 An assumption is required about the amount of pension commuted by members in respect of their service prior to 31 March 2008. Prior to this date members received an automatic entitlement to retirement lump sum in addition to pension they might choose to commute for further cash. The assumption for the service after 2008, including post 2014 service, is specified in the HM Treasury directions, as set out in Table 10.1.
Table 10.1: Recommended commutation assumption for the 2016 valuation
Pre-2008 Service 2008-2014 service (directed)
Post 2014service (directed)
10% 15% 15%
10.2 The recommended assumption for pre-2008 service is roughly equivalent to
assuming members take a total lump sum of 65% of the HMRC maximum permitted lump sum.
Previous valuation assumptions
10.3 The same assumptions as set out above were adopted for the previous valuation.
Use of the assumption
10.4 Members may commute part of their pension for a lump sum at a rate of £12 for each £1 of annual pension given up. The value of the pension given up, as assessed using the actuarial assumptions underlying the valuation is, on average, more than £12 and so commutation has a significant impact on total liabilities and contribution rates. The cost cap is not affected by differences between assumed and actual experience, but would be affected if the assumption changed.
This chapter sets out our recommendation for the assumed level of pension commutation at retirement (where this is not specified in the HM Treasury valuation directions), and summarises the analysis undertaken in order to inform that recommendation.

LGPS actuarial valuation as at 31 March 2016
Advice on assumptions
40
Results of analysis
10.5 Two different types of analysis are possible. First, an analysis of the amounts of pension exchanged for cash at retirement. Second, an analysis by reference to the amounts of lump sum paid. The data provided supported a more robust analysis based on the second approach (with perfect data, the two approaches should be expected to yield identical results). The table below shows the conclusions of the second analysis based on around 161,000 members retiring over the three year period to 31 March 2016.
Table 10.2: Lump sum based approach (normal health)
Number of retirements
Lump sum at retirement (before commutation) £ 000s
Lump sum post commutation £000s
Implied Commutation proportion
Males 59,000 984,512 1,591,441 12.0%
Females 102,000 915,643 1,583,196 13.3%
Comments on commutation analysis
10.6 Members with both pre-2008 and post-2008 pension do not, in practice, choose which part of the pension to commute. In 2013 it was assumed that 10% of pre-2008 pension was commuted for cash (in addition to cash as of right). On the other hand under HM Treasury Directions 15% of post 2008 pension is assumed to be commuted. A result from our analysis of close to 13% for combined pre and post 2008 pension being commuted is therefore not inconsistent with an assumed rate of 10% of pre 2008 pension being commuted. On this basis, we recommend retaining the 2013 valuation assumption for pre 2008 service.

LGPS actuarial valuation as at 31 March 2016
Advice on assumptions
41
11 Family statistics
Proposed assumptions for 2016 valuation
11.1 We recommend the following assumptions be adopted for the percentage of members married or partnered at death at each age.
Age Males Females
60 80% 75% 70 78% 57% 80 64% 28% 90 36% 8%
11.2 We also recommend that male members are assumed to be three years older than their partners and female members are assumed to be two younger than their partners
Previous valuation assumptions
11.3 The assumed proportions partnered proposed are the same as those adopted for
the 2013 valuation, which in turn were based on ONS population statistics.
Use of the assumptions
11.4 Dependants’ pensions17 are provided on the death of a member. The scheme’s benefit provisions for dependants differ according to when the service ended. For members who left service before 1 April 2008 only legal spouses and civil partners are eligible for a survivor’s pension. For members in service on or after 1 April 2008, survivors pensions are payable to a qualifying partner18.
11.5 Where the member has no service on or after 1 April 2008, the spouse’s pension will cease if the spouse remarries.
17 Pensions are also payable to dependent children on a member’s death but the costs are not material overall. 18 Qualifying partners includes legal spouse, civil partner and ‘surviving nominated partner’. To satisfy the latter definition requires a 2-year exclusive relationship between parties able to legally marry or enter a civil partnership, and financial interdependency.
This chapter sets out our recommendation for the assumptions around dependants’ pensions, and summarises the analysis undertaken in order to inform that recommendation.

LGPS actuarial valuation as at 31 March 2016
Advice on assumptions
42
Analysis and approach to setting the assumptions
11.6 To formulate a recommended assumption we would normally analyse the scheme experience against the corresponding 2013 assumption. However, the data provided did not support a comprehensive analysis being undertaken. On the basis of a minimal analysis we concluded there was no evidence to support a change to the assumption for percentage partnered, and the data supported the assumptions adopted in 2013 for age difference between men and women.

LGPS actuarial valuation as at 31 March 2016
Advice on assumptions
43
Details of assumptions
This appendix contains details of the recommended assumptions including sample rates and values.
Pensioner mortality
Table A1: Baseline mortality assumptions
Baseline mortality Standard table19 Adjustment
Males
Retirements in normal health S2NMA 101%
Current ill-health pensioners S2IMA 107%
Future ill-health pensioners S2IMA 107%
Dependants S2NMA 132%
Females
Retirements in normal health S2NFA 92%
Current ill-health pensioners S2IFA 106%
Future ill-health pensioners S2IFA 106%
Dependants S2NFA 106%
As specified by HM Treasury, future improvements in mortality will be assumed to be in line with those underlying the ONS 2016-based principal population projections for the UK.
19 From the ‘S2’ series of standard tables published by the CMI and based on the experience of self-administered pension schemes. Separate tables are available based on experience of members retiring in normal and ill-health and for dependants.

LGPS actuarial valuation as at 31 March 2016
Advice on assumptions
44
Age retirement from service Table A2: Detailed age retirement rates for members joining on or after 1 Oct 2006 (including new entrants to 2014 Scheme), and all members not entitled to unreduced benefits before age 65 under the ‘Rule of 85’ Age NPA 65 NPA 66 NPA 67 NPA 68 55 0.020 0.020 0.020 0.020 56 0.020 0.020 0.020 0.020 57 0.020 0.020 0.020 0.020 58 0.020 0.020 0.020 0.020 59 0.020 0.020 0.020 0.020 60 0.105 0.105 0.105 0.105 61 0.090 0.090 0.090 0.090 62 0.090 0.090 0.090 0.090 63 0.090 0.090 0.090 0.090 64 0.090 0.090 0.090 0.090 65 1.000 0.090 0.090 0.090 66 1.000 1.000 0.090 0.090 67 1.000 1.000 1.000 0.090 68 1.000 1.000 1.000 1.000
Table A3: Detailed age retirement rates for members entitled to unreduced benefits at age 60 under the ‘Rule of 85’ Age NPA 65 NPA 66 NPA 67 NPA 68 55 0.020 0.020 0.020 0.020 56 0.020 0.020 0.020 0.020 57 0.020 0.020 0.020 0.020 58 0.020 0.020 0.020 0.020 59 0.020 0.020 0.020 0.020 60 0.250 0.250 0.191 0.150 61 0.130 0.130 0.114 0.102 62 0.130 0.130 0.114 0.102 63 0.130 0.130 0.114 0.102 64 0.130 0.130 0.114 0.102 65 1.000 0.130 0.114 0.102 66 1.000 1.000 0.114 0.102 67 1.000 1.000 1.000 0.102 68 1.000 1.000 1.000 1.000

LGPS actuarial valuation as at 31 March 2016
Advice on assumptions
45
Table A4: Detailed age retirement rates for members entitled to unreduced benefits at between 60 and 65 under the ‘Rule of 85’ Age NPA 65 NPA 66 NPA 67 NPA 68 55 0.020 0.020 0.020 0.020 56 0.020 0.020 0.020 0.020 57 0.020 0.020 0.020 0.020 58 0.020 0.020 0.020 0.020 59 0.020 0.020 0.020 0.020 60 0.105 0.105 0.105 0.105 61 0.090 0.090 0.090 0.090 62 0.250 0.250 0.185 0.140 63 0.130 0.130 0.114 0.102 64 0.130 0.130 0.114 0.102 65 1.000 0.130 0.114 0.102 66 1.000 1.000 0.114 0.102 67 1.000 1.000 1.000 0.102 68 1.000 1.000 1.000 1.000
Ill-health retirement from service
Table A5: Ill-health retirement rates for all members
Age Males Females 20 0.0000 0.0000 25 0.0001 0.0000 30 0.0001 0.0001 35 0.0002 0.0001 40 0.0004 0.0003 45 0.0009 0.0006 50 0.0018 0.0013 55 0.0036 0.0028 60 0.0074 0.0062 65 0.0151 0.0134
*rates are zero if above the NPA of the relevant section
In all scheme sections, 77% of ill-health retirements are assumed to qualify for tier 1 benefits, 10% for tier 2 benefits and 13% for tier 3.

LGPS actuarial valuation as at 31 March 2016
Advice on assumptions
46
Voluntary withdrawal from service
Table A6: Voluntary withdrawal rates for all members
Age Males Females 20 0.1171 0.1282 25 0.0921 0.1017 30 0.0725 0.0807 35 0.0570 0.0640 40 0.0448 0.0507 45 0.0353 0.0403 50 0.0278 0.0319 55 0.0218 0.0253 60 0.0172 0.0201 65 0.0135 0.0159
Death before retirement
Table A7: Death before retirement rates for all members
Age Males Females 20 0.0002 0.0001 25 0.0002 0.0001 30 0.0003 0.0001 35 0.0005 0.0002 40 0.0006 0.0003 45 0.0009 0.0005 50 0.0013 0.0008 55 0.0021 0.0012 60 0.0032 0.0019 65 0.0050 0.0029

LGPS actuarial valuation as at 31 March 2016
Advice on assumptions
47
Promotional pay increases
Table A8: Promotional salary scales for all members
Age Males Females 20 90 95 25 92 96 30 100 100 35 105 103 40 109 104 45 112 106 50 115 107 55 115 107 60 115 107 65 115 107
Commutation of pension for cash at retirement
Table A9: Recommended commutation assumptions for the 2016 valuation
Pre-2008 Service 2008-2014 service (directed)
Post 2014service (directed)
10% 15% 15%
Family statistics
Table A10: Proportion married or entitled to a partners’/dependent’s pension at death
Age Males Females
60 80% 75% 70 78% 57% 80 64% 28% 90 36% 8%
Male members are assumed to be three years older than their partners and female members are assumed to be two years younger than their partners.

LGPS actuarial valuation as at 31 March 2016
Advice on assumptions
48
Modelling approach and minor assumptions
Active membership projections
B.1 Direction 1120 requires the actuary to use the ‘projected unit methodology’ to calculate the valuation results. The valuation results require the calculation of the cost of benefit accrual over periods after the effective date (31 March 2016). This implicitly requires the actuary to estimate the membership to future dates in order to determine the valuation results.
B.2 Assumptions are also be required to project membership to 2019-2022. In addition to the assumptions used, the profile of the active membership over these periods affects the expected cost of the benefits.
B.3 The Directions implicitly require the actuary to determine the expected active membership up to 31 March 2031 (valuation effective date plus 15 year spreading period) in order to determine the valuation results. However, for a practical application of the methodology we have focussed on the membership of the Scheme as at 31 March 2019 and 31 March 2022.
Total membership as at 31 March 2019 and 31 March 2022
B.4 In order to project the membership to 2022, it is necessary to make assumptions about the number of active members in 2022 and their payroll. This is a workforce issue, not an actuarial one, and we have sought input from MHCLG.
B.5 It is not certain what the size any future change in membership might be. The number of active members in the LGPS in future depends on many factors, including the decisions of local authorities and other participating employers, and the impact of policies such as new Fair Deal. MHCLG do not hold projections of the future number of members of the LGPS.
B.6 In the light of these uncertainties, MHCLG have instructed us to assume that the payroll of LGPS active members remains constant (in 2016 earning terms) in the period to 2022.
B.7 This is the same approach as adopted for the 2013 valuation.
Approach to determining the active membership of the LGPS as at 31 March 2019 and 31 March 2022
B.8 There are two main alternative approaches which could be used to determine the active membership at future dates:
(i) Assume the active population remains relatively stable by total salary roll at each age.
20 The Public Service Pensions (Valuations and Employer Cost Cap) Directions 2014, as amended.

LGPS actuarial valuation as at 31 March 2016
Advice on assumptions
49
(ii) Project forward the 31 March 2016 data, and allow for expected new members joining at future dates.
B.9 Since MHCLG have instructed us to assume that the payroll of LGPS active members remains constant (in 2016 earning terms) in the period to 2022, and in the light of many other uncertainties about projection of active membership to 2022, the first option above seems most appropriate. We have applied this assumption to mean that over the period from the effective date to the end of the implementation period (31 March 2022) the overall profile of the membership in terms of distribution of pay by age and gender will remain stable.
B.10 If an alternative assumption were adopted the contribution rates determined as part of the valuation would be likely to differ. In general any assumption which results in an ageing of the workforce will result in a higher contribution rate being calculated and vice versa: increase the average age of the members by 1 year would increase the contribution rate by about ½% of pay.
B.11 The expected cost of accruing benefits over periods after the effective date for is therefore determined by assuming:
> The aggregate membership has the same age/pay profile over all projection periods (i.e. to 2023).
> Allow for the actual membership (assumed) accruing benefits in the 2014 scheme to change over the projection period (i.e. to 2023). SPA in the projected populations is determined by implied dates of birth and so the SPA mix changes over time despite the assumed stable population.
> Mortality is projected forward to the relevant year of use in all cases.
Grouping of individual active member records
B.12 Individual active members have been grouped together for the purposes of calculating past service liabilities and future service contribution rates. Grouping data in this way is appropriate where there is a high volume of data and where grouping should not in itself lead to a distortion in the results. The volume of data in this situation is more than sufficient to permit grouping without compromising the accuracy of the valuation results.
B.13 Active members have been grouped by gender, age (to nearest whole year), Normal Pension Age (to nearest whole year) and Critical Retirement Age (CRA). CRA has been taken as either 60 (where that is the nearest whole year of CRA), 62 (where CRA is between 61 and 64 to the nearest whole year) or 65 (where that is the nearest whole year of CRA, or where the member does not have a CRA). The CRA groups of 60 and 65 jointly cover around 91% of the total active membership at 31 March 2016; with CRA 62 being the balance of around 9%. The CRA group of 62 is therefore relatively minor, and hence grouping a wide range of actual CRAs does not introduce a significant element of approximation to the overall results.
B.14 Deferred pensions and pensions in payment have similarly been grouped for the purposes of calculating past service liabilities.
LGPS actuarial valuation as at 31 March 2016
Advice on assumptions
50
Accrual cost methodology
B.15 When determining the costs of accrual as required by Directions 27(1)(d) and 40(1) the cost for members in each group at each relevant date (as identified from the membership projections) has been determined for each age and that rate has been applied to the total pensionable pay at each age to determine the average for the membership as a whole at each date. The cost over each relevant period has been taken as the average of the cost at the start and end of each period. The calculation allows for mortality improvements assuming the calculation date is the midpoint of each period.
B.16 Non-accruing benefits such as lump sums payable on death in service have been recognised only when a benefit payment is expected. Guaranteed Minimum Pensions (GMPs)
B.17 A global adjustment was applied to reduce the past service liability in respect of
estimated GMP entitlements. The reduction is equivalent to a contribution rate of 0.8% over the 15 year period from the implementation date. This estimation has no impact on the calculation of the cost cap.
Earnings cap
B.18 For members who were subject to the Inland Revenue earnings cap, which affected members whose pensionable service commenced on or after 1 June 1989 and which ceased to apply at 6 April 2006, their period of pensionable service was adjusted in 2006 to reflect the limitation on pensionable pay over the relevant period. Following that adjustment, the earnings cap therefore no longer has any impact on members’ benefits or contributions, and therefore does not materially impact on the valuation results.
Public Service Transfer Club (PSTC) B.19 Allowance has been made for the potential additional liabilities arising from inward
transfers on PSTC terms by assuming that the level of transfers continues at recent levels and the cost of providing the service credit is about twice the transfer value received. Overall, the additional costs are equivalent to about 0.2% of pensionable pay. In the longer term, PSTC transfers will increasingly be transfers of career average benefits and costs are expected to fall over time.
Final pensionable pay B.20 All liabilities have been based on pensionable pay at the effective date as provided
by local administrators. No explicit allowance has been made for the impact of prior years’ earnings resulting in higher final pensionable pay for particular members since this effect is not expected to impact a material number of members.

LGPS actuarial valuation as at 31 March 2016
Advice on assumptions
51
Children’s pensions B.21 No allowance has been made for children’s pensions (other than those already in
payment), on grounds of immateriality.
Expenses B.22 No allowance has been made for expenses. Expenses are outside the valuation
framework.
Early retirement factors B.23 When modelling retirement before Normal Pension Age where an actuarial reduction
would be applied, we have made an explicit allowance in age retirement rates and applied current early retirement factors (for the appropriate period before the normal pension age).
Re-entry of members B.24 Re-entry of members to pensionable service has been modelled by the use of a ‘net’
withdrawal assumption for active members. This explicitly allows for a proportion of those leaving active service to return. No explicit allowance has been made in the valuation for a proportion of those deferred at the effective date to subsequently rejoin. This simplification has no material impact in the cost cap arena.
Additional voluntary contributions
B.25 Additional voluntary contributions paid to on a money purchase basis are paid in accordance with Regulations which are separate to the pension scheme regulations and have not been considered for the valuation. Additional voluntary contributions paid in accordance with the pension scheme regulations to secure added service or pension are taken into account as liabilities of the scheme.
Taper protection
B.26 As a result of the phasing out of the ‘Rule of 85’, some members are entitled to tapered early retirement factors in respect of service during the implementation period. In calculating the employer contribution rate, no allowance has been made for the impact of tapered early retirement factors on the grounds of immateriality. This simplification has no material impact in the cost cap arena.
The Scheme’s 50/50 section
B.27 When calculating the valuation results we are required by the Direction 18 to assume that no members ever have, or ever will, make an election under regulation 10 of the Local Government Pension Scheme Regulations 2013 (Temporary reduction in contributions), which we refer to as ‘the 50/50 section’.

LGPS actuarial valuation as at 31 March 2016
Advice on assumptions
52
Member contribution yield over implementation period
B.28 The Member contribution yield over implementation period is calculated as the contribution yield expected from members between 1 April 2019 and 31 March 2022 based on the current regulations.
Other Direction interpretations
Directions 27 and 28 (contribution rates)
B.29 27(1)(a) and 27(1)(c) : Payroll at effective date projected forward (only) in line with valuation earnings assumptions for purposes of spreading the deficit.
B.30 27(1)(c)(ii) and 28 : Member contributions since the effective date based on actual (or expected) yield for past periods and expected rate based on the current regulations for future periods. See B.29.
B.31 27(1)(b) and 27(1)(d) – cost of accruing benefits: See B.11.
Directions 28, 31, 32(1), 33(2)(a) (and related) – member contribution yields
B.32 See paragraph B.29.
Directions 32(1) – expected cost of benefits for past periods (for cost cap purposes)
B.33 Assume that contribution rate required to cover cost of benefits over 2014-16 is the same as the rate required to cover cost of benefits over 2015-18.
Directions 32(1) and 40(1) – expected cost of benefits for future periods (for cost cap purposes)
B.34 See B.11
Direction 33 – cost cap income
B.35 When calculating the Cost Cap income under Direction 33, we have included:
> Actual employee contributions payable
> Actual employer contributions made to fund early retirements which required employer consent, redundancy and efficiency retirements
> Employer normal contributions that would have been paid if employers had been required to pay contributions at the rate of the Cost Cap Fund Contribution Rate.
> Actual transfers-in
> The liability discount rate used for the cost cap liabilities at 2016 rather than the investment roll up. The impact is immaterial to the results.

LGPS actuarial valuation as at 31 March 2016
Advice on assumptions
53
Assumptions made for data uncertainties
Summary
C1 Whilst comprehensive data was received from the administering authorities and their actuaries for the 2016 valuation, some aspects of the data were incomplete and/or unreliable for certain elements of our valuation calculations.
C2 It has not been possible to fully resolve these data issues in the timescale required for the valuation. Therefore to calculate results for the 2016 valuation of the Scheme requires assumptions in respect of incomplete and/or unreliable individual member records and movements data, the latter is used for setting assumptions and in the calculation of the Cost Cap Net Leavers Liability.
C3 Scheme specific assumptions are determined by the “responsible authority”, which is the Secretary of State for Housing, Communities and Local Government in the case of the Scheme, and must be set as best estimate assumptions and not include margins for prudence or optimism.
Individual member records
C4 We applied checks to the membership data as provided for the purpose of the 2016 valuation to ensure all key data items were provided and reliable for valuation purposes. Following these checks, it was identified that individual member records at the relevant dates as required for valuation purposes were not fully complete and reliable. We worked with the data providers to address a number of these issues, however where critical data items were missing from member records the general approach taken was to exclude that record for calculation purposes with calculations based on the remaining dataset being rated up to incorporate an allowance for the excluded records.
C5 The key adjustments made to the data were:
> To remove records with incomplete or unreliable data and then apply a rating up factor to the remaining records to implicitly include the excluded members within the calculations as though they had the characteristics of an average member.
> To apply a further rating factor to the resultant datasets to allow for the missing funds (again on the assumption the members of those funds had the characteristics of an average member).
C6 Implicitly this uprating approach assumes that the records with omissions or errors have the same average profile (age, sex, pay, service) as fully complete records. The 2016 valuation data was uprated by 3% and the 2014 data provided for the purposes of setting the initial cost cap fund was uprated by 49%.
C7 As noted, the approach taken to data omissions is to assume each record with missing
data has the same average profile as the complete records and therefore there is a risk that this assumption is not appropriate. The table below indicates the extent to which the valuation results might be incorrect if the approach in fact under/overstates the liability for the omitted members by 10%.

LGPS actuarial valuation as at 31 March 2016
Advice on assumptions
54
Uncertainty in data at 31 March 2016
31 March 2016 Employer contribution
correction cost Active members (uprating applied: 5%) ±0.1%
Deferred members (uprating applied: 2%) Nil
Pensioners (uprating applied: 3%) Nil
Uncertainty in data at 31 March 2014
31 March 2014 Employer contribution
correction cost Active members (uprating applied: 49%) ±0.9%
C8 The table above illustrates the potential impact if known data omissions are
subsequently found to have been handled incorrectly. Since it is not possible to undertake independent checks for all categories of members and a full reconciliation has not been achieved against all prior datasets there is the potential for currently unidentified problems with the data to emerge in future. For example a group of deferred members could be identified where no liability has previously been determined. The impact of such unknowns emerging at subsequent valuations could be considerably more than the sensitivity indicated above.
C9 Due to these concerns about the 2014 data, in preparing valuation results we would propose to separately estimate gains and losses. A risk of this approach is that any upward or downward cost pressure that has occurred but we have not identified will not be reflected in the results. However, it would not be expected that there would be significant unidentified cost pressures given the relatively short period of experience from 2014 to 2016, although such unidentified cost pressure could certainly change the result as quoted to 0.1% pay.
Movements data
Setting assumptions C10 Data on the experience of the scheme membership over the three-year period to 31
March 2016 was supplied. Fully complete and comprehensive data about members moving status between certain dates (e.g. leaving active status due to death or retirement) was not able to be provided. Analysis of member movements is needed to inform scheme specific demographic assumptions as scheme-specific experience, both recent and longer term, generally provides the most reliable evidence when considering best estimates of future experience.

LGPS actuarial valuation as at 31 March 2016
Advice on assumptions
55
C11 Assumption setting relies on analysis of movements data in consideration with such other relevant information which is available. The setting of demographic assumptions is to some extent subjective and a matter of interpretation. Changes in assumptions may be expected at successive valuations as circumstances change even with full data. Thus the absence of fully complete movements data does not necessarily introduce uncertainty into the valuation results provided there is other relevant information available to inform those assumptions. It is to be expected that there is some volatility in the experience arising from an analysis of movements data. As assumptions are intended to reflect long term expectations it is reasonable to seek to smooth out the impact of these short term effects. A number of the recommendations we make for scheme-specific valuation assumptions smooth out the short term effects by taking only 50% of the difference in experience since the 2013 valuation, for example in recommending the assumption for baseline pensioner mortality.
Cost Cap Net Leavers Liability (CCNLL) C12 The initial cost cap fund is set equal to the liability for actives members at 31 March
2014. The cost cap mechanism is intended to manage the costs of the reformed scheme and recognise any unexpected experience relating to pre-reformed entitlements of members in service at 1 April 2014, but only to the point at which they leave active service. CCNLL is a quantification of the amount of pre-reformed liabilities which fall out of the cost cap fund at a valuation owing to members which have left service since the previous valuation (or since the initial cost cap fund was set in the case of the 2016 valuation), net of the additional liabilities in respect of members with pre-reformed service who rejoined active membership during 2014-16.
C13 To accurately calculate CCNLL in accordance with the directions requires full movement data for all members who were active in 2014 and are no longer active at the 2016 valuation. Some approximation has been required to determine CCNLL for all valuations being undertaken in accordance with the valuation directions.
C14 For the purposes of determining the 2016 valuation results, we recommend an approach which implicitly makes an assumption that there is no unidentified experience gain or loss arising over the period 2014 to 2016. A risk of this approach is that any upward or downward cost pressure that has occurred over the period but has not been explicitly identified will not be reflected in the 2016 valuation results.
C15 We expect that the uncertainty introduced by the approach above is not more than 0.5% of pay. We would not expect significant unidentified experience gains or losses to arise over the two year period 2014 to 2016; although some uncertainty remains we would not expect any item as large as 0.5% of pay.
C16 For the 2016 valuation, the CCNLL calculation period is only two years, rather than a full four-year inter-valuation period. Given the short period over which any gain or loss may have arisen it might reasonably be concluded that the lack of data for the CCNLL calculation is not critical for this valuation although it would become so in future valuations when a longer inter-valuation period is considered.

LGPS actuarial valuation as at 31 March 2016
Advice on assumptions
56
Sensitivity of valuation results to Secretary of State set assumptions
D1 The table below provides an indication of the sensitivity of the valuation results to the particular assumptions under consideration.
Sensitivity of valuation results to Secretary of State set assumptions
Addition to cost cap cost of the Scheme
Membership profile: 2 years older on average over implementation period 1.1%
Mortality rates: 5%* heavier rates of pensioner mortality -0.5%
Age retirement rates: Members assumed to retire one year later 0.0%
Commutation (other than as directed) Members commute 2% of pension more than assumed in respect of pre 2019 service, keep 17.5% assumption for post 2009 service
-0.2%
Ill-health retirement: 5%* increase to assumed rates 0.1% Ill-health retirement: 5%* increase in proportion assumed to receive higher tier benefits
0.0%
Proportions partnered: 5%* more members assumed to have qualifying partners at death
0.1%
Resignations and opt outs: 5%* higher numbers assumed to leave voluntarily before retirement (net of rejoiners)
0.0%
Promotional pay increases: 0.5% higher promotional pay increases than assumed
0.4%
* All these represent multiplicative increases to rates, i.e. 5% means rates 1.05 times higher. Note: Opposite changes in the assumptions will produce approximately equal and opposite changes in the valuation results. D2 In each variant of the above table the sensitivity shown is in relation only to the change in
assumption described. The impact of a combination of assumption changes will not necessarily equate to the sum of the relevant rows above.