lhin region report 2016 - cno · college of nurses of ontario – lhin region report 2016 4 . 4 o....
TRANSCRIPT

LHIN Region Report2016
College of Nurses of Ontario
LHIN Region Report 2016 Pub 45043
ISSN 2368-8300
Copyright © College of Nurses of Ontario, 2016
Commercial or for-profit redistribution of this document in part or in whole is prohibited except with the written consent of CNO. This document may be reproduced in part or in whole for personal or educational use without permission, provided that:
• due diligence is exercised in ensuring the accuracy of the materials reproduced;
• CNO is identified as the source; and
• the reproduction is not represented as an official version of the materials reproduced, nor as having been made in affiliationwith, or with the endorsement of, CNO.
Copies of this booklet can be downloaded, free of charge, from the CNO website at www.cno.org.
College of Nurses of Ontario 101 Davenport Rd. Toronto, ON M5R 3P1
www.cno.org
VISION Leading in regulatory excellence
MISSION Regulating nursing in the public interest
College of Nurses of Ontario – LHIN Region Report 2016 i
Table of Contents 1 Introduction 1
1.1 About the College of Nurses of Ontario ............................................................................... 1
1.2 About this document ........................................................................................................... 1
2 Methods and Notes 2
2.1 Data collection .................................................................................................................... 2
2.2 Classes of registration ........................................................................................................ 2
2.2.1 General Class ............................................................................................................... 2
2.2.2 Extended Class............................................................................................................. 2
2.3 Multiple nursing employment positions ................................................................................ 2
3 LHIN Region Map 3
4 Ontario 4
4.1 Ontario demographics......................................................................................................... 4
4.2 Nursing employment positions in Ontario ............................................................................ 5
5 Central 7
5.1 Central LHIN demographics ................................................................................................ 7
5.2 Nursing employment positions in the Central LHIN ............................................................. 9
6 Central East 10
6.1 Central East LHIN demographics ...................................................................................... 10
6.2 Nursing employment positions in the Central East LHIN ................................................... 12
7 Central West 13
7.1 Central West LHIN demographics ..................................................................................... 13
7.2 Nursing employment positions in the Central West LHIN .................................................. 15
8 Champlain 16
8.1 Champlain LHIN demographics ........................................................................................ 16
8.2 Nursing employment positions in the Champlain LHIN ...................................................... 18
9 Erie St. Clair 19
9.1 Erie St. Clair LHIN demographics ..................................................................................... 19
9.2 Nursing employment positions in the Erie St. Clair LHIN ................................................... 21
10 Hamilton Niagara Haldimand Brant 22
10.1 Hamilton Niagara Haldimand Brant LHIN demographics ................................................... 22
10.2 Nursing employment positions in the Hamilton Niagara Haldimand Brant LHIN ................ 24
11 Mississauga Halton 25
11.1 Mississauga Halton LHIN demographics ........................................................................... 25
11.2 Nursing employment positions in the Mississauga Halton LHIN ........................................ 27
12 North East 28
12.1 North East LHIN demographics ........................................................................................ 28
12.2 Nursing employment positions in the North East LHIN ...................................................... 30

College of Nurses of Ontario – LHIN Region Report 2016 ii
13 North Simcoe Muskoka 31
13.1 North Simcoe Muskoka LHIN demographics ..................................................................... 31
13.2 Nursing employment positions in the North Simcoe Muskoka LHIN .................................. 33
14 North West 34
14.1 North West LHIN demographics........................................................................................ 34
14.2 Nursing employment positions in the North West LHIN ..................................................... 36
15 South East 37
15.1 South East LHIN demographics ........................................................................................ 37
15.2 Nursing employment positions in the South East LHIN ..................................................... 39
16 South West 40
16.1 South West LHIN demographics ....................................................................................... 40
16.2 Nursing employment positions in the South West LHIN .................................................... 42
17 Toronto Central 43
17.1 Toronto Central LHIN demographics ................................................................................. 43
17.2 Nursing employment positions in the Toronto Central LHIN .............................................. 45
18 Waterloo Wellington 46
18.1 Waterloo Wellington LHIN demographics .......................................................................... 46
18.2 Nursing employment positions in the Waterloo Wellington LHIN ....................................... 48
College of Nurses of Ontario – LHIN Region Report 2016 1
1 INTRODUCTION
1.1 About the College of Nurses of Ontario
The College of Nurses of Ontario (the College) is the regulatory body for nursing
in Ontario. Its mission is to regulate nursing in the public interest. The College
sets the requirements for becoming a nurse in Ontario and the standards of
practice that nurses must meet to maintain that designation. Only a person with a
valid Certificate of Registration from the College can practise as a nurse in
Ontario and use the protected titles: nurse, Registered Nurse (RN), Registered
Practical Nurse (RPN) or Nurse Practitioner (NP).
To find out more about the College’s statistical resources, or to sign up for
statistics announcements from the College, please visit http://www.cno.org/stats.
1.2 About this document
This document provides an overview of the membership of the College’s General
and Extended Classes,1 who reported employment in nursing in Ontario when
renewing their membership for the 2016 practice year. It analyses nursing
employment in all of Ontario and in each Local Health Integration Network
(LHIN)2 in Ontario independently.
1 Visit http://www.cno.org/en/become-a-nurse/classes-of-registration/ for more information about the College’s classes of registration. 2 Visit www.lhins.on.ca for more information about LHINs.

College of Nurses of Ontario – LHIN Region Report 2016 2
2 METHODS AND NOTES
2.1 Data collection
Every year, members in the General, Extended and Non-Practising Classes are
required to renew their membership with the College to register to practice in the
following practice year.3 A component of the renewal process is the collection of
information that the College requires to carry out our regulatory mandate and that
the College must report to the provincial government.
The data in this report provide a point-in-time snapshot of the employment of
nurses who renewed their membership for the 2016 practice year.4
2.2 Classes of registration
2.2.1 General Class
Members in the General Class are Registered Nurses (RNs) or Registered
Practical Nurses (RPNs) who are registered with the College and are eligible to
practise nursing in Ontario. Most nurses registered with the College belong to
this class.
2.2.2 Extended Class
The Extended Class is for RNs who have additional education and clinical
experience that allows them to practise as NPs in Ontario. Members in this class
have an expanded scope of practice, with the authority to diagnose, prescribe
medication, perform procedures, and order and interpret diagnostic tests.
2.3 Multiple nursing employment positions
During renewal, the College asks members for information about all of their
employment positions. This includes: employer’s business address; employer
type; whether the position is a nursing role; and the member’s position and area
of practice within the employment setting (if it is a nursing role).
Because some members have more than one nursing position, the number of
nursing positions that members report in a LHIN region is higher than the
number of members employed in that LHIN.
3 Visit http://www.cno.org/en/become-a-nurse/classes-of-registration/ for more information about the College’s classes of registration. 4 The 2016 renewal period was open between October 19, 2015 and March 21, 2016.

College of Nurses of Ontario – LHIN Region Report 2016 3
3 LHIN REGION MAP
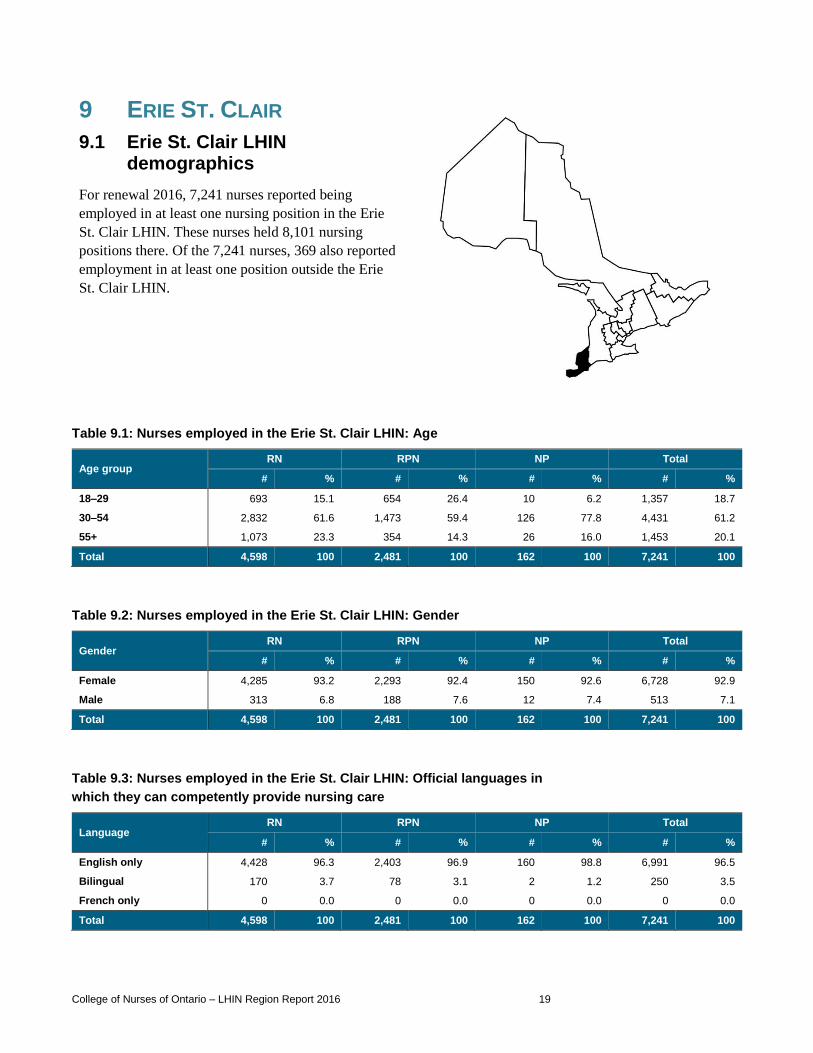
Ontario is divided into 14 LHIN regions, as shown in the map below:
1. Erie St. Clair
2. South West
3. Waterloo Wellington
4. Hamilton Niagara Haldimand Brant
5. Central West
6. Mississauga Halton
7. Toronto Central
8. Central
9. Central East
10. South East
11. Champlain
12. North Simcoe Muskoka
13. North East
14. North West
Map reproduced from the Ontario Local Health Integration Network website:
http://www.lhins.on.ca/ .
© Queen's Printer for Ontario, 2014.
College of Nurses of Ontario – LHIN Region Report 2016 4
4 ONTARIO
4.1 Ontario demographics
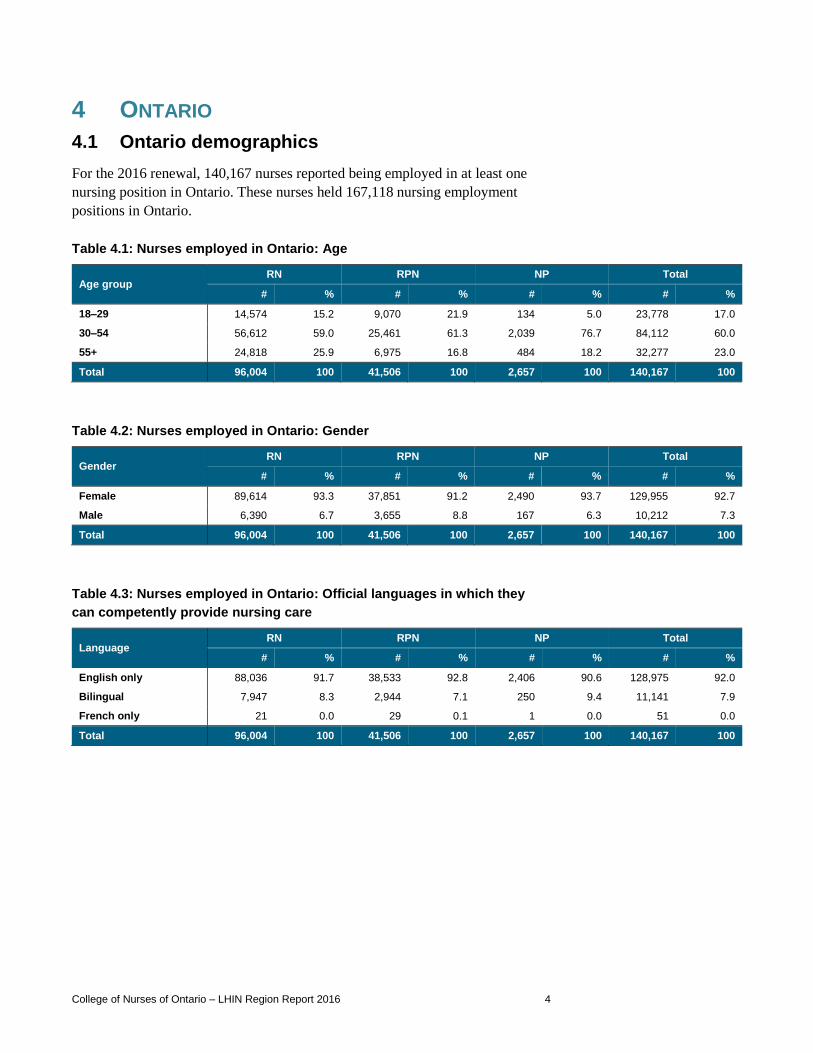
For the 2016 renewal, 140,167 nurses reported being employed in at least one
nursing position in Ontario. These nurses held 167,118 nursing employment
positions in Ontario.
Table 4.1: Nurses employed in Ontario: Age
Age group RN RPN NP Total
# % # % # % # %
18–29 14,574 15.2 9,070 21.9 134 5.0 23,778 17.0
30–54 56,612 59.0 25,461 61.3 2,039 76.7 84,112 60.0
55+ 24,818 25.9 6,975 16.8 484 18.2 32,277 23.0
Total 96,004 100 41,506 100 2,657 100 140,167 100
Table 4.2: Nurses employed in Ontario: Gender
Gender RN RPN NP Total
# % # % # % # %
Female 89,614 93.3 37,851 91.2 2,490 93.7 129,955 92.7
Male 6,390 6.7 3,655 8.8 167 6.3 10,212 7.3
Total 96,004 100 41,506 100 2,657 100 140,167 100
Table 4.3: Nurses employed in Ontario: Official languages in which they
can competently provide nursing care
Language RN RPN NP Total
# % # % # % # %
English only 88,036 91.7 38,533 92.8 2,406 90.6 128,975 92.0
Bilingual 7,947 8.3 2,944 7.1 250 9.4 11,141 7.9
French only 21 0.0 29 0.1 1 0.0 51 0.0
Total 96,004 100 41,506 100 2,657 100 140,167 100

College of Nurses of Ontario – LHIN Region Report 2016 5
Table 4.4: Nurses employed in Ontario: Number of nursing employment
positions held in Ontario
Number of nursing employment positions RN RPN NP Total
# % # % # % # %
1 81,362 84.7 33,294 80.2 1,967 74.0 116,623 83.2
2 12,772 13.3 7,247 17.5 567 21.3 20,586 14.7
3+ 1,870 1.9 965 2.3 123 4.6 2,958 2.1
Total nurses employed in Ontario 96,004 100 41,506 100 2,657 100 140,167 100
Total nursing employment positions in Ontario
112,812 50,805 3,501 167,118
4.2 Nursing employment positions in Ontario
Table 4.5: Nursing employment positions in Ontario: LHIN regions
Location RN RPN NP Total
# % # % # % # %
Central 10,049 8.9 4,913 9.7 173 4.9 15,135 9.1
Central East 9,225 8.2 5,267 10.4 256 7.3 14,748 8.8
Central West 4,153 3.7 1,727 3.4 90 2.6 5,970 3.6
Champlain 12,075 10.7 5,188 10.2 305 8.7 17,568 10.5
Erie St. Clair 5,051 4.5 2,844 5.6 206 5.9 8,101 4.8
Hamilton Niagara Haldimand Brant 12,129 10.8 6,034 11.9 324 9.3 18,487 11.1
Mississauga Halton 7,726 6.8 3,253 6.4 128 3.7 11,107 6.6
North East 6,089 5.4 3,269 6.4 294 8.4 9,652 5.8
North Simcoe Muskoka 3,753 3.3 2,161 4.3 156 4.5 6,070 3.6
North West 2,936 2.6 1,468 2.9 174 5.0 4,578 2.7
South East 5,044 4.5 2,530 5.0 204 5.8 7,778 4.7
South West 9,669 8.6 4,214 8.3 284 8.1 14,167 8.5
Toronto Central 19,883 17.6 5,014 9.9 695 19.9 25,592 15.3
Waterloo Wellington 5,030 4.5 2,923 5.8 212 6.1 8,165 4.9
Ontario total 112,812 100 50,805 100 3,501 100 167,118 100
Table 4.6: Nursing employment positions in Ontario: Working status
Working status RN RPN NP Total
# % # % # % # %
Full-time 63,901 56.6 22,643 44.6 2,141 61.2 88,685 53.1
Part-time 29,861 26.5 18,387 36.2 734 21.0 48,982 29.3
Casual 19,050 16.9 9,775 19.2 626 17.9 29,451 17.6
Total 112,812 100 50,805 100 3,501 100 167,118 100

College of Nurses of Ontario – LHIN Region Report 2016 6
Table 4.7: Nursing employment positions in Ontario: Employment sectors
Employment sector RN RPN NP Total
# % # % # % # %
Community 22,548 20.0 10,135 19.9 1,754 50.1 34,437 20.6
Hospital 68,844 61.0 18,431 36.3 1,277 36.5 88,552 53.0
Long-term care 10,141 9.0 19,676 38.7 114 3.3 29,931 17.9
Other 11,279 10.0 2,563 5.0 356 10.2 14,198 8.5
Total 112,812 100 50,805 100 3,501 100 167,118 100
Table 4.8: Nursing employment positions in Ontario: Top three nursing
employers5
RN # % RPN # %
Acute care hospital 60,853 53.9 Long-term care facility 15,451 30.4
Long-term care facility 9,345 8.3 Acute care hospital 11,245 22.1
Community care access centre 4,202 3.7 Retirement home 3,884 7.6
NP # % Total # %
Acute care hospital 1,122 32.0 Acute care hospital 73,220 43.8
Family health team 558 15.9 Long-term care facility 24,892 14.9
Community health centre 479 13.7 Other community 6,957 4.2
5 For the definition of “nursing employers”, see the Membership Statistics Report at http://www.cno.org/en/what-is-cno/nursing-demographics/statistical-reports/ .

College of Nurses of Ontario – LHIN Region Report 2016 7
5 CENTRAL
5.1 Central LHIN demographics
For the 2016 renewal, 13,802 nurses reported being
employed in at least one nursing position in the
Central LHIN. These nurses held 15,135 nursing
positions there. Of the 13,802 nurses, 3,638 also
reported employment in at least one position outside
the Central LHIN.
Table 5.1: Nurses employed in the Central LHIN: Age
Age group RN RPN NP Total
# % # % # % # %
18–29 1,221 13.1 805 18.5 11 7.0 2,037 14.8
30–54 5,812 62.6 2,970 68.2 127 80.9 8,909 64.5
55+ 2,254 24.3 583 13.4 19 12.1 2,856 20.7
Total 9,287 100 4,358 100 157 100 13,802 100
Table 5.2: Nurses employed in the Central LHIN: Gender
Gender RN RPN NP Total
# % # % # % # %
Female 8,628 92.9 3,887 89.2 149 94.9 12,664 91.8
Male 659 7.1 471 10.8 8 5.1 1,138 8.2
Total 9,287 100 4,358 100 157 100 13,802 100
Table 5.3: Nurses employed in the Central LHIN: Official languages in
which they can competently provide nursing care
Language RN RPN NP Total
# % # % # % # %
English only 9,043 97.4 4,266 97.9 154 98.1 13,463 97.5
Bilingual 243 2.6 92 2.1 3 1.9 338 2.4
French only 1 0.0 0 0.0 0 0.0 1 0.0
Total 9,287 100 4,358 100 157 100 13,802 100

College of Nurses of Ontario – LHIN Region Report 2016 8
Table 5.4: Nurses employed in the Central LHIN: Number of nursing
employment positions held in the Central LHIN
Number of nursing employment positions RN RPN NP Total
# % # % # % # %
1 8,596 92.6 3,845 88.2 142 90.4 12,583 91.2
2 630 6.8 472 10.8 14 8.9 1,116 8.1
3+ 61 0.7 41 0.9 1 0.6 103 0.7
Total nurses employed in the Central LHIN 9,287 100 4,358 100 157 100 13,802 100
Total nursing employment positions in the Central LHIN
10,049 4,913 173 15,135
Table 5.5: Nursing employment positions of Central LHIN nurses who are
also employed in another LHIN
Location of nursing employment positions outside the Central LHIN RN RPN NP Total
Central East 532 338 12 882
Central West 368 150 6 524
Champlain 37 8 1 46
Erie St. Clair 18 3 0 21
Hamilton Niagara Haldimand Brant 90 39 1 130
Mississauga Halton 268 143 1 412
North East 18 4 4 26
North Simcoe Muskoka 147 58 5 210
North West 4 1 0 5
South East 13 3 2 18
South West 26 16 1 43
Toronto Central 1,269 588 39 1,896
Waterloo Wellington 32 14 2 48
Other Canadian jurisdictions 36 0 4 40
United States 17 3 1 21
International (excluding the U.S.) 1 1 0 2
Total nurses employed in nursing outside the Central LHIN6 2,406 1,178 54 3,638
6 This number is not a sum of the column above because a nurse may be employed in multiple LHINs outside the Central LHIN. This number is only a count of the number of nurses employed outside the Central LHIN, regardless of how many other LHINs employed them.

College of Nurses of Ontario – LHIN Region Report 2016 9
5.2 Nursing employment positions in the Central LHIN
Table 5.6: Nursing employment positions in the Central LHIN: Working
status
Working status RN RPN NP Total
# % # % # % # %
Full-time 5,467 54.4 2,014 41.0 98 56.6 7,579 50.1
Part-time 2,429 24.2 1,759 35.8 36 20.8 4,224 27.9
Casual 2,153 21.4 1,140 23.2 39 22.5 3,332 22.0
Total 10,049 100 4,913 100 173 100 15,135 100
Table 5.7: Nursing employment positions in the Central LHIN: Employment
sectors
Employment sector RN RPN NP Total
# % # % # % # %
Community 2,305 22.9 1,044 21.2 71 41.0 3,420 22.6
Hospital 5,442 54.2 1,351 27.5 72 41.6 6,865 45.4
Long-term care 1,095 10.9 2,142 43.6 9 5.2 3,246 21.4
Other 1,207 12.0 376 7.7 21 12.1 1,604 10.6
Total 10,049 100 4,913 100 173 100 15,135 100
Table 5.8: Nursing employment positions in the Central LHIN: Top three
nursing employers7
RN # % RPN # %
Acute care hospital 5,102 50.8 Long-term care facility 1,663 33.8
Long-term care facility 1,003 10.0 Acute care hospital 1,073 21.8
Other community 480 4.8 Retirement home 449 9.1
NP # % Total # %
Acute care hospital 68 39.3 Acute care hospital 6,243 41.2
Family health team 20 11.6 Long-term care facility 2,672 17.7
College/university 17 9.8 Other community 730 4.8
7 For the definition of “nursing employers”, see the Membership Statistics Report at http://www.cno.org/en/what-is-cno/nursing-demographics/statistical-reports/ .

College of Nurses of Ontario – LHIN Region Report 2016 10
6 CENTRAL EAST
6.1 Central East LHIN demographics
For renewal 2016, 13,271 nurses reported being
employed in at least one nursing position in the
Central East LHIN. These nurses held 14,748 nursing
positions there. Of the 13,271 nurses, 2,072 also
reported employment in at least one position outside
the Central East LHIN.
Table 6.1: Nurses employed in the Central East LHIN: Age
Age group RN RPN NP Total
# % # % # % # %
18–29 995 11.8 1,086 23.3 6 2.7 2,087 15.7
30–54 5,154 61.3 2,860 61.5 166 75.8 8,180 61.6
55+ 2,252 26.8 705 15.2 47 21.5 3,004 22.6
Total 8,401 100 4,651 100 219 100 13,271 100
Table 6.2: Nurses employed in the Central East LHIN: Gender
Gender RN RPN NP Total
# % # % # % # %
Female 7,931 94.4 4,267 91.7 204 93.2 12,402 93.5
Male 470 5.6 384 8.3 15 6.8 869 6.5
Total 8,401 100 4,651 100 219 100 13,271 100
Table 6.3: Nurses employed in the Central East LHIN: Official languages in
which they can competently provide nursing care
Language RN RPN NP Total
# % # % # % # %
English only 8,208 97.7 4,566 98.2 214 97.7 12,988 97.9
Bilingual 192 2.3 84 1.8 5 2.3 281 2.1
French only 1 0.0 1 0.0 0 0.0 2 0.0
Total 8,401 100 4,651 100 219 100 13,271 100

College of Nurses of Ontario – LHIN Region Report 2016 11
Table 6.4: Nurses employed in the Central East LHIN: Number of nursing
employment positions held in the Central East LHIN
Number of nursing employment positions RN RPN NP Total
# % # % # % # %
1 7,644 91.0 4,096 88.1 187 85.4 11,927 89.9
2 696 8.3 499 10.7 29 13.2 1,224 9.2
3+ 61 0.7 56 1.2 3 1.4 120 0.9
Total nurses employed in the Central East LHIN 8,401 100 4,651 100 219 100 13,271 100
Total nursing employment positions in the Central East LHIN
9,225 5,267 256 14,748
Table 6.5: Nursing employment positions of Central East LHIN nurses who
are also employed in another LHIN
Location of nursing employment positions outside the Central East LHIN RN RPN NP Total
Central 523 343 10 876
Central West 60 42 1 103
Champlain 7 2 0 9
Erie St. Clair 2 2 0 4
Hamilton Niagara Haldimand Brant 15 4 0 19
Mississauga Halton 66 32 4 102
North East 11 3 0 14
North Simcoe Muskoka 30 10 1 41
North West 4 1 1 6
South East 45 16 6 67
South West 7 3 2 12
Toronto Central 796 322 30 1,148
Waterloo Wellington 14 5 3 22
Other Canadian jurisdictions 27 6 0 33
United States 7 0 2 9
International (excluding the U.S.) 1 0 0 1
Total nurses employed in nursing outside the Central East LHIN8 1,343 679 50 2,072
8 This number is not a sum of the column above because a nurse may be employed in multiple LHINs outside the Central East LHIN. This number is only a count of the number of nurses employed outside the Central East LHIN, regardless of how many other LHINs employed them.

College of Nurses of Ontario – LHIN Region Report 2016 12
6.2 Nursing employment positions in the Central East LHIN
Table 6.6: Nursing employment positions in the Central East LHIN: Working
status
Working status RN RPN NP Total
# % # % # % # %
Full-time 5,043 54.7 2,305 43.8 161 62.9 7,509 50.9
Part-time 2,748 29.8 2,085 39.6 58 22.7 4,891 33.2
Casual 1,434 15.5 877 16.7 37 14.5 2,348 15.9
Total 9,225 100 5,267 100 256 100 14,748 100
Table 6.7: Nursing employment positions in the Central East LHIN:
Employment sectors
Employment sector RN RPN NP Total
# % # % # % # %
Community 1,950 21.1 888 16.9 150 58.6 2,988 20.3
Hospital 5,267 57.1 1,859 35.3 75 29.3 7,201 48.8
Long-term care 1,163 12.6 2,266 43.0 14 5.5 3,443 23.3
Other 845 9.2 254 4.8 17 6.6 1,116 7.6
Total 9,225 100 5,267 100 256 100 14,748 100
Table 6.8: Nursing employment positions in the Central East LHIN: Top
three nursing employers9
RN # % RPN # %
Acute care hospital 4,701 51.0 Long-term care facility 1,868 35.5
Long-term care facility 1,097 11.9 Acute care hospital 1,257 23.9
Community care access centre 470 5.1 Retirement home 369 7.0
NP # % Total # %
Acute care hospital 60 23.4 Acute care hospital 6,018 40.8
Family health team 55 21.5 Long-term care facility 2,974 20.2
Community health centre 31 12.1 Addiction & mental health centre/psychiatric hospital
769 5.2
9 For the definition of “nursing employers”, see the Membership Statistics Report at http://www.cno.org/en/what-is-cno/nursing-demographics/statistical-reports/ .
College of Nurses of Ontario – LHIN Region Report 2016 13
7 CENTRAL WEST
7.1 Central West LHIN demographics
For renewal 2016, 5,582 nurses reported being
employed in at least one nursing position in the
Central West LHIN. These nurses held 5,970 nursing
positions there. Of the 5,582 nurses, 1,758 also
reported employment in at least one position outside
the Central West LHIN.
Table 7.1: Nurses employed in the Central West LHIN: Age
Age group RN RPN NP Total
# % # % # % # %
18–29 506 13.0 295 18.5 4 4.9 805 14.4
30–54 2,520 64.5 1,046 65.6 68 84.0 3,634 65.1
55+ 881 22.5 253 15.9 9 11.1 1,143 20.5
Total 3,907 100 1,594 100 81 100 5,582 100
Table 7.2: Nurses employed in the Central West LHIN: Gender
Gender RN RPN NP Total
# % # % # % # %
Female 3,707 94.9 1,466 92.0 75 92.6 5,248 94.0
Male 200 5.1 128 8.0 6 7.4 334 6.0
Total 3,907 100 1,594 100 81 100 5,582 100
Table 7.3: Nurses employed in the Central West LHIN: Official languages in
which they can competently provide nursing care
Language RN RPN NP Total
# % # % # % # %
English only 3,830 98.0 1,563 98.1 78 96.3 5,471 98.0
Bilingual 76 1.9 31 1.9 3 3.7 110 2.0
French only 1 0.0 0 0.0 0 0.0 1 0.0
Total 3,907 100 1,594 100 81 100 5,582 100

College of Nurses of Ontario – LHIN Region Report 2016 14
Table 7.4: Nurses employed in the Central West LHIN: Number of nursing
employment positions held in the Central West LHIN
Number of nursing employment positions RN RPN NP Total
# % # % # % # %
1 3,673 94.0 1,470 92.2 73 90.1 5,216 93.4
2 223 5.7 116 7.3 7 8.6 346 6.2
3+ 11 0.3 8 0.5 1 1.2 20 0.4
Total nurses employed in the Central West LHIN 3,907 100 1,594 100 81 100 5,582 100
Total nursing employment positions in the Central West LHIN
4,153 1,727 90 5,970
Table 7.5: Nursing employment positions of Central West LHIN nurses who
are also employed in another LHIN
Location of nursing employment positions outside the Central West LHIN RN RPN NP Total
Central 374 159 6 539
Central East 62 47 1 110
Champlain 8 0 0 8
Erie St. Clair 0 2 0 2
Hamilton Niagara Haldimand Brant 46 24 2 72
Mississauga Halton 470 233 8 711
North East 6 1 1 8
North Simcoe Muskoka 25 5 2 32
North West 2 0 0 2
South East 2 2 0 4
South West 5 2 0 7
Toronto Central 413 118 15 546
Waterloo Wellington 45 11 0 56
Other Canadian jurisdictions 12 3 0 15
United States 8 1 1 10
International (excluding the U.S.) 2 0 0 2
Total nurses employed in nursing outside the Central West LHIN10 1,218 511 29 1,758
10 This number is not a sum of the column above because a nurse may be employed in multiple LHINs outside the Central West LHIN. This number is only a count of the number of nurses employed outside the Central West LHIN, regardless of how many other LHINs employed them.
College of Nurses of Ontario – LHIN Region Report 2016 15
7.2 Nursing employment positions in the Central West LHIN
Table 7.6: Nursing employment positions in the Central West LHIN:
Working status
Working status RN RPN NP Total
# % # % # % # %
Full-time 2,218 53.4 653 37.8 56 62.2 2,927 49.0
Part-time 1,015 24.4 619 35.8 19 21.1 1,653 27.7
Casual 920 22.2 455 26.3 15 16.7 1,390 23.3
Total 4,153 100 1,727 100 90 100 5,970 100
Table 7.6: Nursing employment positions in the Central West LHIN:
Employment sectors
Employment sector RN RPN NP Total
# % # % # % # %
Community 793 19.1 284 16.4 47 52.2 1,124 18.8
Hospital 2,409 58.0 589 34.1 27 30.0 3,025 50.7
Long-term care 506 12.2 756 43.8 3 3.3 1,265 21.2
Other 445 10.7 98 5.7 13 14.4 556 9.3
Total 4,153 100 1,727 100 90 100 5,970 100
Table 7.7: Nursing employment positions in the Central West LHIN: Top
three nursing employers11
RN # % RPN # %
Acute care hospital 2,308 55.6 Long-term care facility 682 39.5
Long-term care facility 475 11.4 Acute care hospital 512 29.6
Public health unit/department 309 7.4 Other community 80 4.6
NP # % Total # %
Acute care hospital 23 25.6 Acute care hospital 2,843 47.6
Family health team 17 18.9 Long-term care facility 1,160 19.4
Community health centre 15 16.7 Public health unit/department 313 5.2
11 For the definition of “nursing employers”, see the Membership Statistics Report at http://www.cno.org/en/what-is-cno/nursing-demographics/statistical-reports/ .
College of Nurses of Ontario – LHIN Region Report 2016 16
8 CHAMPLAIN
8.1 Champlain LHIN demographics
For renewal 2016, 15,242 nurses reported being
employed in at least one nursing position in the
Champlain LHIN. These nurses held 17,568 nursing
positions there. Of the 15,242 nurses, 556 also
reported employment in at least one position outside
the Champlain LHIN.
Table 8.1: Nurses employed in the Champlain LHIN: Age
Age group RN RPN NP Total
# % # % # % # %
18–29 1,717 15.9 890 21.2 11 4.8 2,618 17.2
30–54 6,393 59.1 2,577 61.4 166 71.9 9,136 59.9
55+ 2,707 25.0 727 17.3 54 23.4 3,488 22.9
Total 10,817 100 4,194 100 231 100 15,242 100
Table 8.2: Nurses employed in the Champlain LHIN: Gender
Gender RN RPN NP Total
# % # % # % # %
Female 10,078 93.2 3,774 90.0 216 93.5 14,068 92.3
Male 739 6.8 420 10.0 15 6.5 1,174 7.7
Total 10,817 100 4,194 100 231 100 15,242 100
Table 8.3: Nurses employed in the Champlain LHIN: Official languages in
which they can competently provide nursing care
Language RN RPN NP Total
# % # % # % # %
English only 6,561 60.7 2,917 69.6 129 55.8 9,607 63.0
Bilingual 4,240 39.2 1,250 29.8 101 43.7 5,591 36.7
French only 16 0.1 27 0.6 1 0.4 44 0.3
Total 10,817 100 4,194 100 231 100 15,242 100
College of Nurses of Ontario – LHIN Region Report 2016 17
Table 8.4: Nurses employed in the Champlain LHIN: Number of nursing
employment positions held in the Champlain LHIN
Number of nursing employment positions RN RPN NP Total
# % # % # % # %
1 9,698 89.7 3,345 79.8 169 73.2 13,212 86.7
2 1,000 9.2 722 17.2 52 22.5 1,774 11.6
3+ 119 1.1 127 3.0 10 4.3 256 1.7
Total nurses employed in the Champlain LHIN 10,817 100 4,194 100 231 100 15,242 100
Total nursing employment positions in the Champlain LHIN
12,075 5,188 305 17,568
Table 8.5: Nursing employment positions of Champlain LHIN nurses who
are also employed in another LHIN
Location of nursing employment positions outside the Champlain LHIN RN RPN NP Total
Central 30 7 1 38
Central East 7 2 0 9
Central West 8 0 0 8
Erie St. Clair 7 1 0 8
Hamilton Niagara Haldimand Brant 10 3 0 13
Mississauga Halton 27 2 0 29
North East 18 0 1 19
North Simcoe Muskoka 14 5 0 19
North West 10 0 3 13
South East 133 74 11 218
South West 20 0 0 20
Toronto Central 45 7 0 52
Waterloo Wellington 7 0 2 9
Other Canadian jurisdictions 139 23 6 168
United States 13 0 1 14
International (excluding the U.S.) 4 0 0 4
Total nurses employed in nursing outside the Champlain LHIN12 425 111 20 556
12 This number is not a sum of the column above because a nurse may be employed in multiple LHINs outside the Champlain LHIN. This number is only a count of the number of nurses employed outside the Champlain LHIN, regardless of how many other LHINs employed them.

College of Nurses of Ontario – LHIN Region Report 2016 18
8.2 Nursing employment positions in the Champlain LHIN
Table 8.6: Nursing employment positions in the Champlain LHIN: Working
status
Working status RN RPN NP Total
# % # % # % # %
Full-time 6,916 57.3 2,314 44.6 146 47.9 9,376 53.4
Part-time 3,414 28.3 1,701 32.8 101 33.1 5,216 29.7
Casual 1,745 14.5 1,173 22.6 58 19.0 2,976 16.9
Total 12,075 100 5,188 100 305 100 17,568 100
Table 8.7: Nursing employment positions in the Champlain LHIN:
Employment sectors
Employment sector RN RPN NP Total
# % # % # % # %
Community 2,299 19.0 1,004 19.4 185 60.7 3,488 19.9
Hospital 7,644 63.3 1,746 33.7 70 23.0 9,460 53.8
Long-term care 997 8.3 2,201 42.4 10 3.3 3,208 18.3
Other 1,135 9.4 237 4.6 40 13.1 1,412 8.0
Total 12,075 100 5,188 100 305 100 17,568 100
Table 8.8: Nursing employment positions in the Champlain LHIN: Top three
nursing employers13
RN # % RPN # %
Acute care hospital 6,710 55.6 Long-term care facility 1,424 27.4
Long-term care facility 857 7.1 Acute care hospital 1,108 21.4
Public health unit/department 428 3.5 Retirement home 713 13.7
NP # % Total # %
Community health centre 70 23.0 Acute care hospital 7,879 44.8
Acute care hospital 61 20.0 Long-term care facility 2,288 13.0
Family health team 50 16.4 Retirement home 820 4.7
13 For the definition of “nursing employers”, see the Membership Statistics Report at http://www.cno.org/en/what-is-cno/nursing-demographics/statistical-reports/ .
College of Nurses of Ontario – LHIN Region Report 2016 19
9 ERIE ST. CLAIR
9.1 Erie St. Clair LHIN demographics
For renewal 2016, 7,241 nurses reported being
employed in at least one nursing position in the Erie
St. Clair LHIN. These nurses held 8,101 nursing
positions there. Of the 7,241 nurses, 369 also reported
employment in at least one position outside the Erie
St. Clair LHIN.
Table 9.1: Nurses employed in the Erie St. Clair LHIN: Age
Age group RN RPN NP Total
# % # % # % # %
18–29 693 15.1 654 26.4 10 6.2 1,357 18.7
30–54 2,832 61.6 1,473 59.4 126 77.8 4,431 61.2
55+ 1,073 23.3 354 14.3 26 16.0 1,453 20.1
Total 4,598 100 2,481 100 162 100 7,241 100
Table 9.2: Nurses employed in the Erie St. Clair LHIN: Gender
Gender RN RPN NP Total
# % # % # % # %
Female 4,285 93.2 2,293 92.4 150 92.6 6,728 92.9
Male 313 6.8 188 7.6 12 7.4 513 7.1
Total 4,598 100 2,481 100 162 100 7,241 100
Table 9.3: Nurses employed in the Erie St. Clair LHIN: Official languages in
which they can competently provide nursing care
Language RN RPN NP Total
# % # % # % # %
English only 4,428 96.3 2,403 96.9 160 98.8 6,991 96.5
Bilingual 170 3.7 78 3.1 2 1.2 250 3.5
French only 0 0.0 0 0.0 0 0.0 0 0.0
Total 4,598 100 2,481 100 162 100 7,241 100

College of Nurses of Ontario – LHIN Region Report 2016 20
Table 9.4: Nurses employed in the Erie St. Clair LHIN: Number of nursing
employment positions held in the Erie St. Clair LHIN
Number of nursing employment positions RN RPN NP Total
# % # % # % # %
1 4,181 90.9 2,146 86.5 127 78.4 6,454 89.1
2 388 8.4 310 12.5 27 16.7 725 10.0
3+ 29 0.6 25 1.0 8 4.9 62 0.9
Total nurses employed in the Erie St. Clair LHIN 4,598 100 2,481 100 162 100 7,241 100
Total nursing employment positions in the Erie St. Clair LHIN
5,051 2,844 206 8,101
Table 9.5: Nursing employment positions of Erie St. Clair LHIN nurses who
are also employed in another LHIN
Location of nursing employment positions outside the Erie St. Clair LHIN RN RPN NP Total
Central 14 3 0 17
Central East 2 2 0 4
Central West 0 1 0 1
Champlain 6 1 0 7
Hamilton Niagara Haldimand Brant 7 5 0 12
Mississauga Halton 4 1 1 6
North East 2 0 3 5
North Simcoe Muskoka 1 0 0 1
North West 1 0 0 1
South East 3 0 0 3
South West 68 33 5 106
Toronto Central 14 3 3 20
Waterloo Wellington 3 6 1 10
Other Canadian jurisdictions 16 0 1 17
United States 178 3 5 186
International (excluding the U.S.) 0 0 0 0
Total nurses employed in nursing outside the Erie St. Clair LHIN14 298 54 17 369
14 This number is not a sum of the column above because a nurse may be employed in multiple LHINs outside the Erie St. Clair LHIN. This number is only a count of the number of nurses employed outside the Erie St. Clair LHIN, regardless of how many other LHINs employed them.

College of Nurses of Ontario – LHIN Region Report 2016 21
9.2 Nursing employment positions in the Erie St. Clair LHIN
Table 9.6: Nursing employment positions in the Erie St. Clair LHIN: Working
status
Working status RN RPN NP Total
# % # % # % # %
Full-time 2,705 53.6 1,203 42.3 135 65.5 4,043 49.9
Part-time 1,731 34.3 1,279 45.0 37 18.0 3,047 37.6
Casual 615 12.2 362 12.7 34 16.5 1,011 12.5
Total 5,051 100 2,844 100 206 100 8,101 100
Table 9.7: Nursing employment positions in the Erie St. Clair LHIN:
Employment sectors
Employment sector RN RPN NP Total
# % # % # % # %
Community 1,165 23.1 647 22.7 107 51.9 1,919 23.7
Hospital 2,689 53.2 898 31.6 64 31.1 3,651 45.1
Long-term care 555 11.0 1,175 41.3 7 3.4 1,737 21.4
Other 642 12.7 124 4.4 28 13.6 794 9.8
Total 5,051 100 2,844 100 206 100 8,101 100
Table 9.8: Nursing employment positions in the Erie St. Clair LHIN: Top
three nursing employers15
RN # % RPN # %
Acute care hospital 2,477 49.0 Long-term care facility 863 30.3
Long-term care facility 521 10.3 Acute care hospital 552 19.4
College/university 293 5.8 Retirement home 297 10.4
NP # % Total # %
Acute care hospital 60 29.1 Acute care hospital 3,089 38.1
Community health centre 34 16.5 Long-term care facility 1,391 17.2
Family health team 26 12.6 Other community 368 4.5
15 For the definition of “nursing employers”, see the Membership Statistics Report at http://www.cno.org/en/what-is-cno/nursing-demographics/statistical-reports/ .

College of Nurses of Ontario – LHIN Region Report 2016 22
10 HAMILTON NIAGARA
HALDIMAND BRANT
10.1 Hamilton Niagara Haldimand Brant LHIN demographics
For the 2016 renewal, 16,308 nurses reported being
employed in at least one nursing position in the
Hamilton Niagara Haldimand Brant LHIN. These
nurses held 18,487 nursing positions there. Of the
16,308 nurses, 1,070 also reported employment in at
least one position outside the Hamilton Niagara
Haldimand Brant LHIN.
Table 10.1: Nurses employed in the Hamilton Niagara Haldimand Brant
LHIN: Age
Age group RN RPN NP Total
# % # % # % # %
18–29 1,777 16.3 1,107 21.6 15 5.4 2,899 17.8
30–54 6,087 55.8 3,069 59.9 218 79.0 9,374 57.5
55+ 3,046 27.9 946 18.5 43 15.6 4,035 24.7
Total 10,910 100 5,122 100 276 100 16,308 100
Table 10.2: Nurses employed in the Hamilton Niagara Haldimand Brant
LHIN: Gender
Gender RN RPN NP Total
# % # % # % # %
Female 10,251 94.0 4,700 91.8 258 93.5 15,209 93.3
Male 659 6.0 422 8.2 18 6.5 1,099 6.7
Total 10,910 100 5,122 100 276 100 16,308 100
Table 10.3: Nurses employed in the Hamilton Niagara Haldimand Brant LHIN:
Official languages in which they can competently provide nursing care
Language RN RPN NP Total
# % # % # % # %
English only 10,638 97.5 4,979 97.2 268 97.1 15,885 97.4
Bilingual 272 2.5 143 2.8 8 2.9 423 2.6
French only 0 0.0 0 0.0 0 0.0 0 0.0
Total 10,910 100 5,122 100 276 100 16,308 100

College of Nurses of Ontario – LHIN Region Report 2016 23
Table 10.4: Nurses employed in the Hamilton Niagara Haldimand Brant
LHIN: Number of nursing employment positions held in Hamilton Niagara
the Haldimand Brant LHIN
Number of nursing employment positions RN RPN NP Total
# % # % # % # %
1 9,828 90.1 4,293 83.8 230 83.3 14,351 88.0
2 959 8.8 753 14.7 44 15.9 1,756 10.8
3+ 123 1.1 76 1.5 2 0.7 201 1.2
Total nurses employed in the Hamilton Niagara Haldimand Brant LHIN
10,910 100 5,122 100 276 100 16,308 100
Total nursing employment positions in the Hamilton Niagara Haldimand Brant LHIN
12,129 6,034 324 18,487
Table 10.5: Nursing employment positions of Hamilton Niagara Haldimand
Brant LHIN nurses who are also employed in another LHIN
Location of nursing employment positions outside the Hamilton Niagara Haldimand Brant LHIN
RN RPN NP Total
Central 89 41 1 131
Central East 14 4 0 18
Central West 47 21 1 69
Champlain 11 3 0 14
Erie St. Clair 6 7 0 13
Mississauga Halton 266 117 10 393
North East 14 1 1 16
North Simcoe Muskoka 14 5 0 19
North West 5 0 0 5
South East 7 3 0 10
South West 62 26 4 92
Toronto Central 174 32 11 217
Waterloo Wellington 125 52 19 196
Other Canadian jurisdictions 31 0 3 34
United States 23 3 0 26
International (excluding the U.S.) 2 1 0 3
Total nurses employed in nursing outside the Hamilton Niagara Haldimand Brant LHIN16
753 272 45 1,070
16 This number is not a sum of the column above because a nurse may be employed in multiple LHINs outside the Hamilton Niagara Haldimand Brant LHIN. This number is only a count of the number of nurses employed outside the Hamilton Niagara Haldimand Brant LHIN, regardless of how many other LHINs employed them.

College of Nurses of Ontario – LHIN Region Report 2016 24
10.2 Nursing employment positions in the Hamilton Niagara Haldimand Brant LHIN
Table 10.6: Working status for nursing employment positions in the
Hamilton Niagara Haldimand Brant LHIN: Working status
Working status RN RPN NP Total
# % # % # % # %
Full-time 6,926 57.1 2,835 47.0 212 65.4 9,973 53.9
Part-time 3,418 28.2 1,879 31.1 78 24.1 5,375 29.1
Casual 1,785 14.7 1,320 21.9 34 10.5 3,139 17.0
Total 12,129 100 6,034 100 324 100 18,487 100
Table 10.7: Nursing employment positions in the Hamilton Niagara
Haldimand Brant LHIN: Employment sectors
Employment sector RN RPN NP Total
# % # % # % # %
Community 2,543 21.0 1,090 18.1 160 49.4 3,793 20.5
Hospital 7,373 60.8 2,387 39.6 132 40.7 9,892 53.5
Long-term care 1,234 10.2 2,343 38.8 11 3.4 3,588 19.4
Other 979 8.1 214 3.5 21 6.5 1,214 6.6
Total 12,129 100 6,034 100 324 100 18,487 100
Table 10.8: Nursing employment positions in the Hamilton Niagara
Haldimand Brant LHIN: Top three nursing employers17
RN # % RPN # %
Acute care hospital 6,653 54.9 Long-term care facility 1,941 32.2
Long-term care facility 1,157 9.5 Acute care hospital 1,525 25.3
College/university 475 3.9 Retirement home 377 6.2
NP # % Total # %
Acute care hospital 109 33.6 Acute care hospital 8,287 44.8
Family health team 63 19.4 Long-term care facility 3,109 16.8
Community health centre 29 9.0 Other community 759 4.1
17 For the definition of “nursing employers”, see the Membership Statistics Report at http://www.cno.org/en/what-is-cno/nursing-demographics/statistical-reports/ .

College of Nurses of Ontario – LHIN Region Report 2016 25
11 MISSISSAUGA HALTON
11.1 Mississauga Halton LHIN demographics
For the 2016 renewal, 10,250 nurses reported being
employed in at least one nursing position in the
Mississauga Halton LHIN. These nurses held 11,107
nursing positions there. Of the 10,250 nurses, 2,319
also reported employment in at least one position
outside the Mississauga Halton LHIN.
Table 11.1: Nurses employed in the Mississauga Halton LHIN: Age
Age group RN RPN NP Total
# % # % # % # %
18–29 1,012 14.0 676 23.2 8 7.0 1,696 16.5
30–54 4,430 61.3 1,881 64.6 92 80.0 6,403 62.5
55+ 1,782 24.7 354 12.2 15 13.0 2,151 21.0
Total 7,224 100 2,911 100 115 100 10,250 100
Table 11.2: Nurses employed in the Mississauga Halton LHIN: Gender
Gender RN RPN NP Total
# % # % # % # %
Female 6,766 93.7 2,644 90.8 109 94.8 9,519 92.9
Male 458 6.3 267 9.2 6 5.2 731 7.1
Total 7,224 100 2,911 100 115 100 10,250 100
Table 11.3: Nurses employed in the Mississauga Halton LHIN: Official
languages in which they can competently provide nursing care
Language RN RPN NP Total
# % # % # % # %
English only 6,966 96.4 2,843 97.7 110 95.7 9,919 96.8
Bilingual 258 3.6 68 2.3 5 4.3 331 3.2
French only 0 0.0 0 0.0 0 0.0 0 0.0
Total 7,224 100 2,911 100 115 100 10,250 100
College of Nurses of Ontario – LHIN Region Report 2016 26
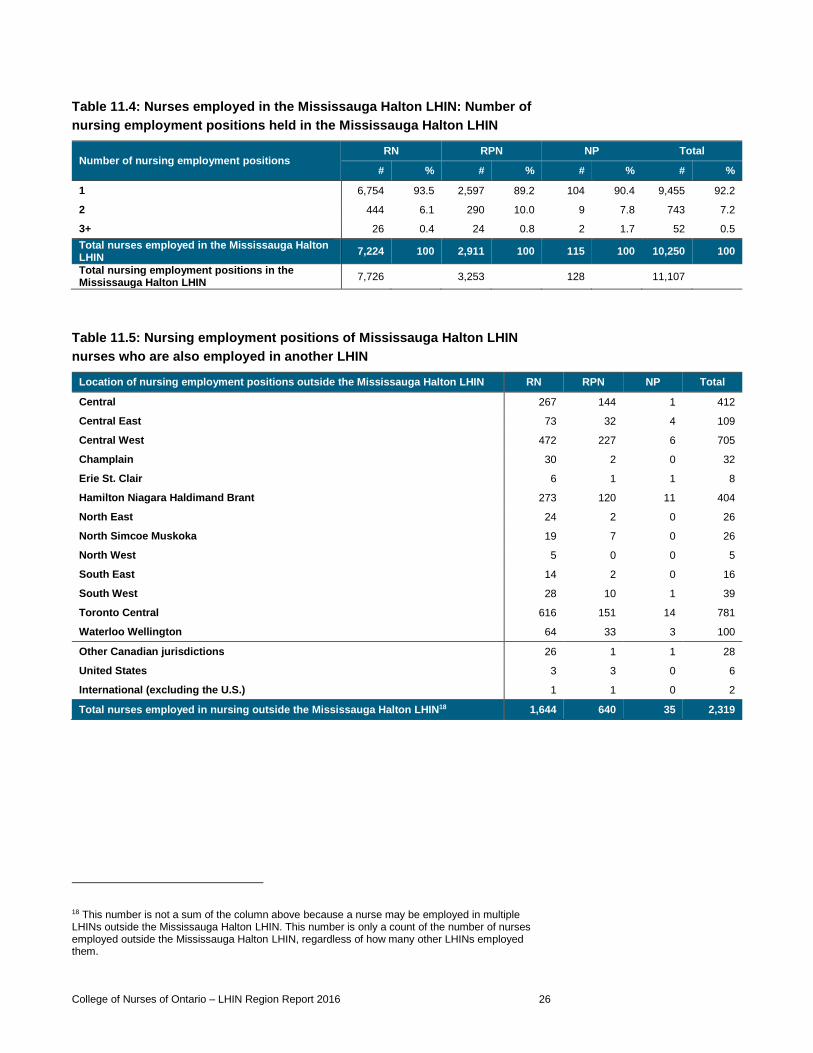
Table 11.4: Nurses employed in the Mississauga Halton LHIN: Number of
nursing employment positions held in the Mississauga Halton LHIN
Number of nursing employment positions RN RPN NP Total
# % # % # % # %
1 6,754 93.5 2,597 89.2 104 90.4 9,455 92.2
2 444 6.1 290 10.0 9 7.8 743 7.2
3+ 26 0.4 24 0.8 2 1.7 52 0.5
Total nurses employed in the Mississauga Halton LHIN
7,224 100 2,911 100 115 100 10,250 100
Total nursing employment positions in the Mississauga Halton LHIN
7,726 3,253 128 11,107
Table 11.5: Nursing employment positions of Mississauga Halton LHIN
nurses who are also employed in another LHIN
Location of nursing employment positions outside the Mississauga Halton LHIN RN RPN NP Total
Central 267 144 1 412
Central East 73 32 4 109
Central West 472 227 6 705
Champlain 30 2 0 32
Erie St. Clair 6 1 1 8
Hamilton Niagara Haldimand Brant 273 120 11 404
North East 24 2 0 26
North Simcoe Muskoka 19 7 0 26
North West 5 0 0 5
South East 14 2 0 16
South West 28 10 1 39
Toronto Central 616 151 14 781
Waterloo Wellington 64 33 3 100
Other Canadian jurisdictions 26 1 1 28
United States 3 3 0 6
International (excluding the U.S.) 1 1 0 2
Total nurses employed in nursing outside the Mississauga Halton LHIN18 1,644 640 35 2,319
18 This number is not a sum of the column above because a nurse may be employed in multiple LHINs outside the Mississauga Halton LHIN. This number is only a count of the number of nurses employed outside the Mississauga Halton LHIN, regardless of how many other LHINs employed them.
College of Nurses of Ontario – LHIN Region Report 2016 27
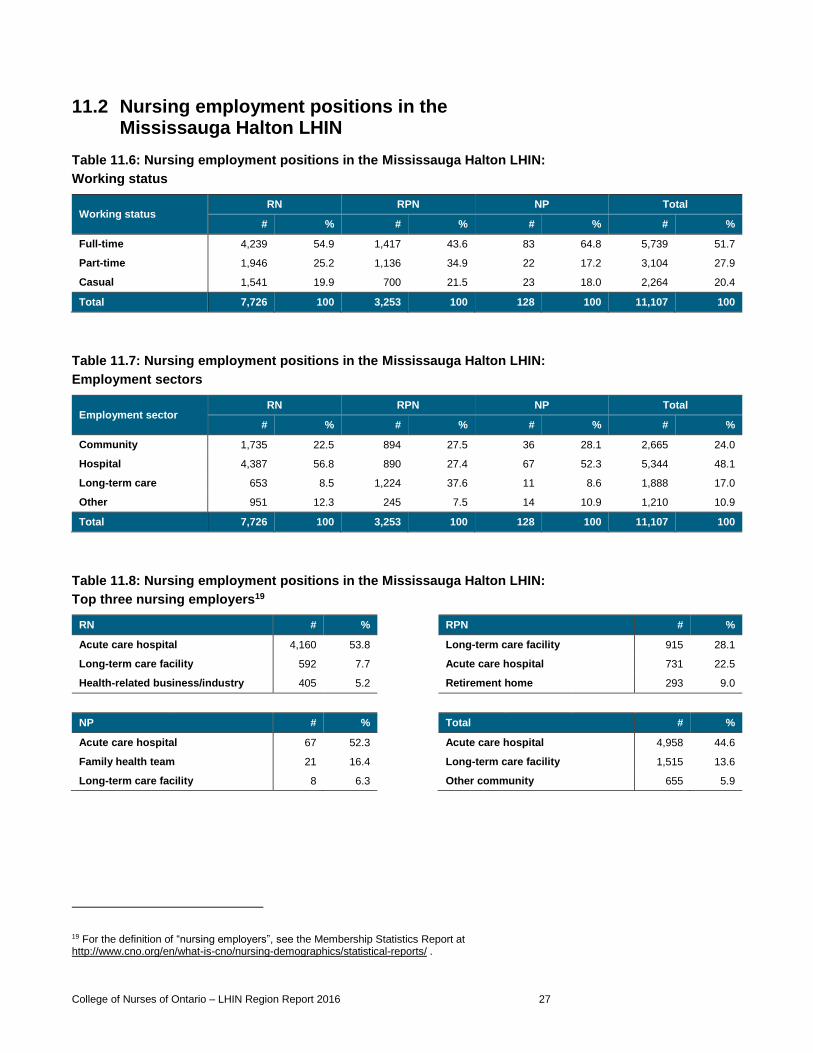
11.2 Nursing employment positions in the Mississauga Halton LHIN
Table 11.6: Nursing employment positions in the Mississauga Halton LHIN:
Working status
Working status RN RPN NP Total
# % # % # % # %
Full-time 4,239 54.9 1,417 43.6 83 64.8 5,739 51.7
Part-time 1,946 25.2 1,136 34.9 22 17.2 3,104 27.9
Casual 1,541 19.9 700 21.5 23 18.0 2,264 20.4
Total 7,726 100 3,253 100 128 100 11,107 100
Table 11.7: Nursing employment positions in the Mississauga Halton LHIN:
Employment sectors
Employment sector RN RPN NP Total
# % # % # % # %
Community 1,735 22.5 894 27.5 36 28.1 2,665 24.0
Hospital 4,387 56.8 890 27.4 67 52.3 5,344 48.1
Long-term care 653 8.5 1,224 37.6 11 8.6 1,888 17.0
Other 951 12.3 245 7.5 14 10.9 1,210 10.9
Total 7,726 100 3,253 100 128 100 11,107 100
Table 11.8: Nursing employment positions in the Mississauga Halton LHIN:
Top three nursing employers19
RN # % RPN # %
Acute care hospital 4,160 53.8 Long-term care facility 915 28.1
Long-term care facility 592 7.7 Acute care hospital 731 22.5
Health-related business/industry 405 5.2 Retirement home 293 9.0
NP # % Total # %
Acute care hospital 67 52.3 Acute care hospital 4,958 44.6
Family health team 21 16.4 Long-term care facility 1,515 13.6
Long-term care facility 8 6.3 Other community 655 5.9
19 For the definition of “nursing employers”, see the Membership Statistics Report at http://www.cno.org/en/what-is-cno/nursing-demographics/statistical-reports/ .

College of Nurses of Ontario – LHIN Region Report 2016 28
12 NORTH EAST
12.1 North East LHIN demographics
For the 2016 renewal, 8,473 nurses reported being
employed in at least one nursing position in the North
East LHIN. These nurses held 9,652 nursing positions
there. Of the 8,473 nurses, 236 also reported
employment in at least one position outside the North
East LHIN.
Table 12.1: Nurses employed in the North East LHIN: Age
Age group RN RPN NP Total
# % # % # % # %
18–29 907 16.9 671 23.4 10 4.3 1,588 18.7
30–54 3,270 60.8 1,754 61.3 175 75.1 5,199 61.4
55+ 1,201 22.3 437 15.3 48 20.6 1,686 19.9
Total 5,378 100 2,862 100 233 100 8,473 100
Table 12.2: Nurses employed in the North East LHIN: Gender
Gender RN RPN NP Total
# % # % # % # %
Female 4,992 92.8 2,649 92.6 216 92.7 7,857 92.7
Male 386 7.2 213 7.4 17 7.3 616 7.3
Total 5,378 100 2,862 100 233 100 8,473 100
Table 12.3: Nurses employed in the North East LHIN: Official languages in
which they can competently provide nursing care
Language RN RPN NP Total
# % # % # % # %
English only 3,872 72.0 1,916 66.9 161 69.1 5,949 70.2
Bilingual 1,506 28.0 946 33.1 72 30.9 2,524 29.8
French only 0 0.0 0 0.0 0 0.0 0 0.0
Total 5,378 100 2,862 100 233 100 8,473 100

College of Nurses of Ontario – LHIN Region Report 2016 29
Table 12.4: Nurses employed in the North East LHIN: Number of nursing
employment positions held in the North East LHIN
Number of nursing employment positions RN RPN NP Total
# % # % # % # %
1 4,753 88.4 2,495 87.2 181 77.7 7,429 87.7
2 545 10.1 331 11.6 45 19.3 921 10.9
3+ 80 1.5 36 1.3 7 3.0 123 1.5
Total nurses employed in the North East LHIN 5,378 100 2,862 100 233 100 8,473 100
Total nursing employment positions in the North East LHIN
6,089 3,269 294 9,652
Table 12.5: Nursing employment positions of North East LHIN nurses who
are also employed in another LHIN
Location of nursing employment positions outside the North East LHIN RN RPN NP Total
Central 20 3 1 24
Central East 11 3 0 14
Central West 7 1 1 9
Champlain 18 0 1 19
Erie St. Clair 2 0 6 8
Hamilton Niagara Haldimand Brant 17 1 1 19
Mississauga Halton 21 2 0 23
North Simcoe Muskoka 24 12 2 38
North West 17 2 9 28
South East 6 0 0 6
South West 5 0 2 7
Toronto Central 38 3 2 43
Waterloo Wellington 8 3 4 15
Other Canadian jurisdictions 20 3 2 25
United States 17 1 0 18
International (excluding the U.S.) 0 0 0 0
Total nurses employed in nursing outside the North East LHIN20 188 30 18 236
20 This number is not a sum of the column above because a nurse may be employed in multiple LHINs outside the North East LHIN. This number is only a count of the number of nurses employed outside the North East LHIN, regardless of how many other LHINs employed them.

College of Nurses of Ontario – LHIN Region Report 2016 30
12.2 Nursing employment positions in the North East LHIN
Table 12.6: Nursing employment positions in the North East LHIN: Working
status
Working status RN RPN NP Total
# % # % # % # %
Full-time 3,566 58.6 1,556 47.6 199 67.7 5,321 55.1
Part-time 1,710 28.1 1,312 40.1 52 17.7 3,074 31.8
Casual 813 13.4 401 12.3 43 14.6 1,257 13.0
Total 6,089 100 3,269 100 294 100 9,652 100
Table 12.7: Nursing employment positions in the North East LHIN:
Employment sectors
Employment sector RN RPN NP Total
# % # % # % # %
Community 1,482 24.3 682 20.9 205 69.7 2,369 24.5
Hospital 3,340 54.9 1,301 39.8 43 14.6 4,684 48.5
Long-term care 538 8.8 1,092 33.4 17 5.8 1,647 17.1
Other 729 12.0 194 5.9 29 9.9 952 9.9
Total 6,089 100 3,269 100 294 100 9,652 100
Table 12.8: Nursing employment positions in the North East LHIN: Top
three nursing employers21
RN # % RPN # %
Acute care hospital 3,115 51.2 Long-term care facility 990 30.3
Long-term care facility 507 8.3 Acute care hospital 903 27.6
College/university 412 6.8 Other community 214 6.5
NP # % Total # %
Family health team 52 17.7 Acute care hospital 4,050 42.0
Community health centre 49 16.7 Long-term care facility 1,513 15.7
Other community 36 12.2 College/university 528 5.5
21 For the definition of “nursing employers”, see the Membership Statistics Report at http://www.cno.org/en/what-is-cno/nursing-demographics/statistical-reports/ .

College of Nurses of Ontario – LHIN Region Report 2016 31
13 NORTH SIMCOE MUSKOKA
13.1 North Simcoe Muskoka LHIN demographics
For the 2016 renewal, 5,437 nurses reported being
employed in at least one nursing position in the North
Simcoe Muskoka LHIN. These nurses held 6,070
nursing positions there. Of the 5,437 nurses, 480 also
reported employment in at least one position outside
the North Simcoe Muskoka LHIN.
Table 13.1: Nurses employed in the North Simcoe Muskoka LHIN: Age
Age group RN RPN NP Total
# % # % # % # %
18–29 394 11.5 478 25.2 2 1.6 874 16.1
30–54 2,065 60.5 1,079 56.8 98 79.7 3,242 59.6
55+ 956 28.0 342 18.0 23 18.7 1,321 24.3
Total 3,415 100 1,899 100 123 100 5,437 100
Table 13.2: Nurses employed in the North Simcoe Muskoka LHIN: Gender
Gender RN RPN NP Total
# % # % # % # %
Female 3,187 93.3 1,712 90.2 118 95.9 5,017 92.3
Male 228 6.7 187 9.8 5 4.1 420 7.7
Total 3,415 100 1,899 100 123 100 5,437 100
Table 13.3: Nurses employed in the North Simcoe Muskoka LHIN: Official
languages in which they can competently provide nursing care
Language RN RPN NP Total
# % # % # % # %
English only 3,277 96.0 1,825 96.1 119 96.7 5,221 96.0
Bilingual 138 4.0 74 3.9 4 3.3 216 4.0
French only 0 0.0 0 0.0 0 0.0 0 0.0
Total 3,415 100 1,899 100 123 100 5,437 100

College of Nurses of Ontario – LHIN Region Report 2016 32
Table 13.4: Nurses employed in the North Simcoe Muskoka LHIN: Number
of nursing employment positions held in the North Simcoe Muskoka LHIN
Number of nursing employment positions RN RPN NP Total
# % # % # % # %
1 3,104 90.9 1,656 87.2 96 78.0 4,856 89.3
2 286 8.4 224 11.8 21 17.1 531 9.8
3+ 25 0.7 19 1.0 6 4.9 50 0.9
Total nurses employed in the North Simcoe Muskoka LHIN
3,415 100 1,899 100 123 100 5,437 100
Total nursing employment positions in the North Simcoe Muskoka LHIN
3,753 2,161 156 6,070
Table 13.5: Nursing employment positions of North Simcoe Muskoka LHIN
nurses who are also employed in another LHIN
Location of nursing employment positions outside the North Simcoe Muskoka LHIN
RN RPN NP Total
Central 142 59 3 204
Central East 31 10 1 42
Central West 24 5 2 31
Champlain 14 5 0 19
Erie St. Clair 1 0 0 1
Hamilton Niagara Haldimand Brant 15 6 0 21
Mississauga Halton 17 8 0 25
North East 22 12 3 37
North West 2 0 0 2
South East 2 1 2 5
South West 19 6 3 28
Toronto Central 69 9 5 83
Waterloo Wellington 11 1 1 13
Other Canadian jurisdictions 36 1 5 42
United States 10 0 2 12
International (excluding the U.S.) 1 0 0 1
Total nurses employed in nursing outside the North Simcoe Muskoka LHIN22 350 110 20 480
22 This number is not a sum of the column above. A nurse may be employed in multiple LHINs outside the North Simcoe Muskoka LHIN. This number is only a count of the number of nurses employed outside the North Simcoe Muskoka LHIN, regardless of how many other LHINs employed them.

College of Nurses of Ontario – LHIN Region Report 2016 33
13.2 Nursing employment positions in the North Simcoe Muskoka LHIN
Table 13.6: Nursing employment positions in the North Simcoe Muskoka
LHIN: Working status
Working status RN RPN NP Total
# % # % # % # %
Full-time 1,990 53.0 1,042 48.2 89 57.1 3,121 51.4
Part-time 1,037 27.6 732 33.9 39 25.0 1,808 29.8
Casual 726 19.3 387 17.9 28 17.9 1,141 18.8
Total 3,753 100 2,161 100 156 100 6,070 100
Table 13.7: Nursing employment positions in the North Simcoe Muskoka
LHIN: Employment sectors
Employment sector RN RPN NP Total
# % # % # % # %
Community 953 25.4 377 17.4 103 66.0 1,433 23.6
Hospital 2,082 55.5 924 42.8 30 19.2 3,036 50.0
Long-term care 395 10.5 755 34.9 4 2.6 1,154 19.0
Other 323 8.6 105 4.9 19 12.2 447 7.4
Total 3,753 100 2,161 100 156 100 6,070 100
Table 13.8: Nursing employment positions in the North Simcoe Muskoka
LHIN: Top three nursing employers23
RN # % RPN # %
Acute care hospital 1,763 47.0 Acute care hospital 599 27.7
Long-term care facility 358 9.5 Long-term care facility 582 26.9
Addiction & mental health centre/psychiatric hospital
273 7.3 Addiction & mental health centre/psychiatric hospital
288 13.3
NP # % Total # %
Family health team 44 28.2 Acute care hospital 2,386 39.3
Acute care hospital 24 15.4 Long-term care facility 943 15.5
Community health centre 19 12.2 Addiction & mental health centre/psychiatric hospital
563 9.3
23 For the definition of “nursing employers”, see the Membership Statistics Report at http://www.cno.org/en/what-is-cno/nursing-demographics/statistical-reports/ .

College of Nurses of Ontario – LHIN Region Report 2016 34
14 NORTH WEST
14.1 North West LHIN demographics
For the 2016 renewal, 3,919 nurses reported being
employed in at least one nursing position in the North
West LHIN. These nurses held 4,578 nursing
positions there. Of the 3,919 nurses, 124 also reported
employment in at least one position outside the North
West LHIN.
Table 14.1: Nurses employed in the North West LHIN: Age
Age group RN RPN NP Total
# % # % # % # %
18–29 524 20.5 296 24.0 7 5.6 827 21.1
30–54 1,414 55.2 729 59.1 85 68.5 2,228 56.9
55+ 623 24.3 209 16.9 32 25.8 864 22.0
Total 2,561 100 1,234 100 124 100 3,919 100
Table 14.2 : Nurses employed in the North West LHIN: Gender
Gender RN RPN NP Total
# % # % # % # %
Female 2,301 89.8 1,125 91.2 108 87.1 3,534 90.2
Male 260 10.2 109 8.8 16 12.9 385 9.8
Total 2,561 100 1,234 100 124 100 3,919 100
Table 14.3: Nurses employed in the North West LHIN: Official languages in
which they can competently provide nursing care
Language RN RPN NP Total
# % # % # % # %
English only 2,471 96.5 1,187 96.2 115 92.7 3,773 96.3
Bilingual 90 3.5 47 3.8 9 7.3 146 3.7
French only 0 0.0 0 0.0 0 0.0 0 0.0
Total 2,561 100 1,234 100 124 100 3,919 100

College of Nurses of Ontario – LHIN Region Report 2016 35
Table 14.4: Nurses employed in the North West LHIN: Number of nursing
employment positions held in the North West LHIN
Number of nursing employment positions RN RPN NP Total
# % # % # % # %
1 2,235 87.3 1,031 83.5 84 67.7 3,350 85.5
2 285 11.1 177 14.3 34 27.4 496 12.7
3+ 41 1.6 26 2.1 6 4.8 73 1.9
Total nurses employed in the North West LHIN 2,561 100 1,234 100 124 100 3,919 100
Total nursing employment positions in the North West LHIN
2,936 1,468 174 4,578
Table 14.5: Nursing employment positions of North West LHIN nurses who
are also employed in another LHIN
Location of nursing employment positions outside the North West LHIN RN RPN NP Total
Central 4 1 0 5
Central East 4 1 1 6
Central West 2 0 0 2
Champlain 8 0 5 13
Erie St. Clair 1 0 0 1
Hamilton Niagara Haldimand Brant 5 0 0 5
Mississauga Halton 5 0 0 5
North East 17 2 3 22
North Simcoe Muskoka 2 0 0 2
South East 1 0 0 1
South West 2 1 0 3
Toronto Central 20 2 0 22
Waterloo Wellington 4 0 1 5
Other Canadian jurisdictions 45 6 4 55
United States 3 0 1 4
International (excluding the U.S.) 0 0 0 0
Total nurses employed in nursing outside the North West LHIN24 104 11 9 124
24 This number is not a sum of the column above because a nurse may be employed in multiple LHINs outside the North West LHIN. This number is only a count of the number of nurses employed outside the North West LHIN, regardless of how many other LHINs employed them.

College of Nurses of Ontario – LHIN Region Report 2016 36
14.2 Nursing employment positions in the North West LHIN
Table 14.6: Nursing employment positions in the North West LHIN: Working
status
Working status RN RPN NP Total
# % # % # % # %
Full-time 1,565 53.3 683 46.5 94 54.0 2,342 51.2
Part-time 785 26.7 446 30.4 29 16.7 1,260 27.5
Casual 586 20.0 339 23.1 51 29.3 976 21.3
Total 2,936 100 1,468 100 174 100 4,578 100
Table 14.7: Nursing employment positions in the North West LHIN:
Employment sectors
Employment sector RN RPN NP Total
# % # % # % # %
Community 680 23.2 276 18.8 121 69.5 1,077 23.5
Hospital 1,784 60.8 671 45.7 38 21.8 2,493 54.5
Long-term care 187 6.4 465 31.7 2 1.1 654 14.3
Other 285 9.7 56 3.8 13 7.5 354 7.7
Total 2,936 100 1,468 100 174 100 4,578 100
Table 14.8: Nursing employment positions in the North West LHIN: Top
three nursing employers25
RN # % RPN # %
Acute care hospital 1,522 51.8 Long-term care facility 449 30.6
Long-term care facility 180 6.1 Acute care hospital 394 26.8
Other community 146 5.0 Complex continuing care hospital 88 6.0
NP # % Total # %
Community health centre 34 19.5 Acute care hospital 1,946 42.5
Acute care hospital 30 17.2 Long-term care facility 631 13.8
Family health team 23 13.2 Other community 233 5.1
25 For the definition of “nursing employers”, see the Membership Statistics Report at http://www.cno.org/en/what-is-cno/nursing-demographics/statistical-reports/ .

College of Nurses of Ontario – LHIN Region Report 2016 37
15 SOUTH EAST
15.1 South East LHIN demographics
For the 2016 renewal, 6,857 nurses reported being
employed in at least one nursing position in the South
East LHIN. These nurses held 7,778 nursing positions
there. Of the 6,857 nurses, 371 also reported
employment in at least one position outside the South
East LHIN.
Table 15.1: Nurses employed in the South East LHIN: Age
Age group RN RPN NP Total
# % # % # % # %
18–29 680 15.1 497 22.7 4 2.4 1,181 17.2
30–54 2,506 55.6 1,241 56.8 131 78.4 3,878 56.6
55+ 1,319 29.3 447 20.5 32 19.2 1,798 26.2
Total 4,505 100 2,185 100 167 100 6,857 100
Table 15.2: Nurses employed in the South East LHIN: Gender
Gender RN RPN NP Total
# % # % # % # %
Female 4,200 93.2 2,025 92.7 159 95.2 6,384 93.1
Male 305 6.8 160 7.3 8 4.8 473 6.9
Total 4,505 100 2,185 100 167 100 6,857 100
Table 15.3: Nurses employed in the South East LHIN: Official languages in
which they can competently provide nursing care
Language RN RPN NP Total
# % # % # % # %
English only 4,306 95.6 2,141 98.0 157 94.0 6,604 96.3
Bilingual 199 4.4 44 2.0 10 6.0 253 3.7
French only 0 0.0 0 0.0 0 0.0 0 0.0
Total 4,505 100 2,185 100 167 100 6,857 100

College of Nurses of Ontario – LHIN Region Report 2016 38
Table 15.4: Nurses employed in the South East LHIN: Number of nursing
employment positions held in the South East LHIN
Number of nursing employment positions RN RPN NP Total
# % # % # % # %
1 4,012 89.1 1,874 85.8 136 81.4 6,022 87.8
2 451 10.0 279 12.8 28 16.8 758 11.1
3+ 42 0.9 32 1.5 3 1.8 77 1.1
Total nurses employed in nursing in the South East LHIN
4,505 100 2,185 100 167 100 6,857 100
Total nursing employment positions in the South East LHIN
5,044 2,530 204 7,778
Table 15.5: Nursing employment positions of South East LHIN nurses who
are also employed in another LHIN
Location of nursing employment positions outside the South East LHIN RN RPN NP Total
Central 10 3 1 14
Central East 48 16 6 70
Central West 2 1 0 3
Champlain 138 75 13 226
Erie St. Clair 5 0 0 5
Hamilton Niagara Haldimand Brant 7 3 0 10
Mississauga Halton 10 2 0 12
North East 4 0 0 4
North Simcoe Muskoka 2 1 2 5
North West 1 0 0 1
South West 4 0 0 4
Toronto Central 25 2 5 32
Waterloo Wellington 11 0 1 12
Other Canadian jurisdictions 21 1 2 24
United States 3 0 0 3
International (excluding the U.S.) 1 0 0 1
Total nurses employed in nursing outside the South East LHIN26 254 92 25 371
26 This number is not a sum of the column above because a nurse may be employed in multiple LHINs outside the South East LHIN. This number is only a count of the number of nurses employed outside the South East LHIN, regardless of how many other LHINs employed them.
College of Nurses of Ontario – LHIN Region Report 2016 39
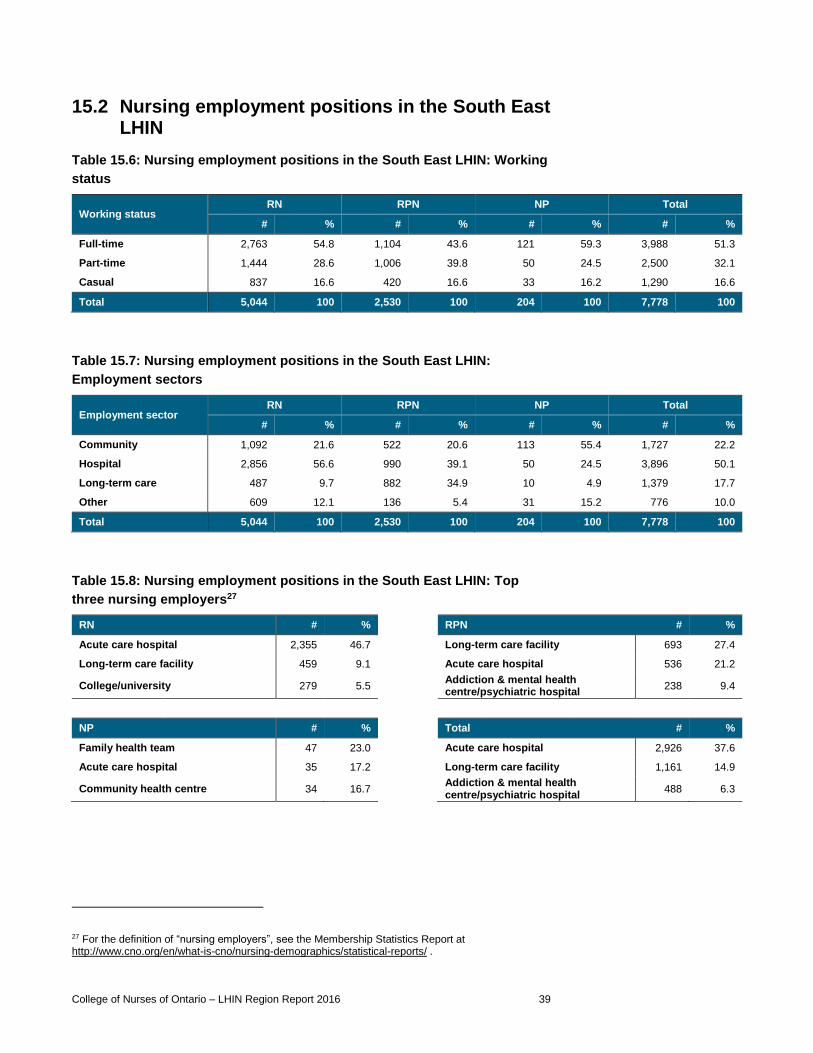
15.2 Nursing employment positions in the South East LHIN
Table 15.6: Nursing employment positions in the South East LHIN: Working
status
Working status RN RPN NP Total
# % # % # % # %
Full-time 2,763 54.8 1,104 43.6 121 59.3 3,988 51.3
Part-time 1,444 28.6 1,006 39.8 50 24.5 2,500 32.1
Casual 837 16.6 420 16.6 33 16.2 1,290 16.6
Total 5,044 100 2,530 100 204 100 7,778 100
Table 15.7: Nursing employment positions in the South East LHIN:
Employment sectors
Employment sector RN RPN NP Total
# % # % # % # %
Community 1,092 21.6 522 20.6 113 55.4 1,727 22.2
Hospital 2,856 56.6 990 39.1 50 24.5 3,896 50.1
Long-term care 487 9.7 882 34.9 10 4.9 1,379 17.7
Other 609 12.1 136 5.4 31 15.2 776 10.0
Total 5,044 100 2,530 100 204 100 7,778 100
Table 15.8: Nursing employment positions in the South East LHIN: Top
three nursing employers27
RN # % RPN # %
Acute care hospital 2,355 46.7 Long-term care facility 693 27.4
Long-term care facility 459 9.1 Acute care hospital 536 21.2
College/university 279 5.5 Addiction & mental health centre/psychiatric hospital
238 9.4
NP # % Total # %
Family health team 47 23.0 Acute care hospital 2,926 37.6
Acute care hospital 35 17.2 Long-term care facility 1,161 14.9
Community health centre 34 16.7 Addiction & mental health centre/psychiatric hospital
488 6.3
27 For the definition of “nursing employers”, see the Membership Statistics Report at http://www.cno.org/en/what-is-cno/nursing-demographics/statistical-reports/ .
College of Nurses of Ontario – LHIN Region Report 2016 40
16 SOUTH WEST
16.1 South West LHIN demographics
For the 2016 renewal, 12,534 nurses reported being
employed in at least one nursing position in the South
West LHIN. These nurses held 14,167 nursing
positions there. Of the 12,534 nurses, 562 also
reported employment in at least one position outside
the South West LHIN.
Table 16.1: Nurses employed in the South West LHIN: Age
Age group RN RPN NP Total
# % # % # % # %
18–29 1,552 17.9 827 23.0 21 8.4 2,400 19.1
30–54 4,832 55.7 2,044 56.7 172 68.5 7,048 56.2
55+ 2,296 26.5 732 20.3 58 23.1 3,086 24.6
Total 8,680 100 3,603 100 251 100 12,534 100
Table 16.2: Nurses employed in the South West LHIN: Gender
Gender RN RPN NP Total
# % # % # % # %
Female 8,147 93.9 3,351 93.0 240 95.6 11,738 93.6
Male 533 6.1 252 7.0 11 4.4 796 6.4
Total 8,680 100 3,603 100 251 100 12,534 100
Table 16.3: Nurses employed in the South West LHIN: Official languages in
which they can competently provide nursing care
Language RN RPN NP Total
# % # % # % # %
English only 8,531 98.3 3,569 99.1 244 97.2 12,344 98.5
Bilingual 149 1.7 33 0.9 7 2.8 189 1.5
French only 0 0.0 1 0.0 0 0.0 1 0.0
Total 8,680 100 3,603 100 251 100 12,534 100

College of Nurses of Ontario – LHIN Region Report 2016 41
Table 16.4: Nurses employed in the South West LHIN: Number of nursing
employment positions held in the South West LHIN
Number of nursing employment positions RN RPN NP Total
# % # % # % # %
1 7,782 89.7 3,038 84.3 220 87.6 11,040 88.1
2 818 9.4 521 14.5 29 11.6 1,368 10.9
3+ 80 0.9 44 1.2 2 0.8 126 1.0
Total nurses employed in the South West LHIN 8,680 100 3,603 100 251 100 12,534 100
Total nursing employment positions in the South West LHIN
9,669 4,214 284 14,167
Table 16.5: Nursing employment positions of South West LHIN nurses who
are also employed in another LHIN
Location of nursing employment positions outside the South West LHIN RN RPN NP Total
Central 26 13 1 40
Central East 7 3 2 12
Central West 5 2 0 7
Champlain 17 0 0 17
Erie St. Clair 73 36 4 113
Hamilton Niagara Haldimand Brant 59 28 4 91
Mississauga Halton 26 9 1 36
North East 6 0 1 7
North Simcoe Muskoka 18 6 2 26
North West 1 1 0 2
South East 3 0 0 3
Toronto Central 50 4 8 62
Waterloo Wellington 108 58 6 172
Other Canadian jurisdictions 19 1 1 21
United States 17 2 1 20
International (excluding the U.S.) 2 0 0 2
Total nurses employed in nursing outside the South West LHIN28 387 146 29 562
28 This number is not a sum of the column above because a nurse may be employed in multiple LHINs outside the South West LHIN. This number is only a count of the number of nurses employed outside the South West LHIN, regardless of how many other LHINs employed them.

College of Nurses of Ontario – LHIN Region Report 2016 42
16.2 Nursing employment positions in the South West LHIN
Table 16.6: Nursing employment positions in the South West LHIN:
Working status
Working status RN RPN NP Total
# % # % # % # %
Full-time 5,470 56.6 1,983 47.1 209 73.6 7,662 54.1
Part-time 2,836 29.3 1,577 37.4 45 15.8 4,458 31.5
Casual 1,363 14.1 654 15.5 30 10.6 2,047 14.4
Total 9,669 100 4,214 100 284 100 14,167 100
Table 16.7: Nursing employment positions in the South West LHIN:
Employment sectors
Employment sector RN RPN NP Total
# % # % # % # %
Community 1,810 18.7 935 22.2 162 57.0 2,907 20.5
Hospital 6,246 64.6 1,461 34.7 99 34.9 7,806 55.1
Long-term care 932 9.6 1,684 40.0 7 2.5 2,623 18.5
Other 681 7.0 134 3.2 16 5.6 831 5.9
Total 9,669 100 4,214 100 284 100 14,167 100
Table 16.8: Nursing employment positions in the South West LHIN: Top
three nursing employers29
RN # % RPN # %
Acute care hospital 5,645 58.4 Long-term care facility 1,360 32.3
Long-term care facility 877 9.1 Acute care hospital 884 21.0
Community care access centre 387 4.0 Retirement home 297 7.0
NP # % Total # %
Acute care hospital 84 29.6 Acute care hospital 6,613 46.7
Family health team 72 25.4 Long-term care facility 2,244 15.8
Community health centre 31 10.9 Other community 577 4.1
29 For the definition of “nursing employers”, see the Membership Statistics Report at http://www.cno.org/en/what-is-cno/nursing-demographics/statistical-reports/ .

College of Nurses of Ontario – LHIN Region Report 2016 43
17 TORONTO CENTRAL
17.1 Toronto Central LHIN demographics
For the 2016 renewal, 23,157 nurses reported being
employed in at least one nursing position in the
Toronto Central LHIN. These nurses held 25,592
nursing positions there. Of the 23,157 nurses, 4,364
also reported employment in at least one position
outside the Toronto Central LHIN.
Table 17.1: Nurses employed in the Toronto Central LHIN: Age
Age group RN RPN NP Total
# % # % # % # %
18–29 2,907 16.1 643 14.4 29 4.9 3,579 15.5
30–54 10,800 59.6 3,024 67.8 477 81.0 14,301 61.8
55+ 4,401 24.3 793 17.8 83 14.1 5,277 22.8
Total 18,108 100 4,460 100 589 100 23,157 100
Table 17.2: Nurses employed in the Toronto Central LHIN: Gender
Gender RN RPN NP Total
# % # % # % # %
Female 16,520 91.2 3,864 86.6 552 93.7 20,936 90.4
Male 1,588 8.8 596 13.4 37 6.3 2,221 9.6
Total 18,108 100 4,460 100 589 100 23,157 100
Table 17.3: Nurses employed in the Toronto Central LHIN: Official
languages in which they can competently provide nursing care
Language RN RPN NP Total
# % # % # % # %
English only 17,553 96.9 4,373 98.0 563 95.6 22,489 97.1
Bilingual 553 3.1 87 2.0 26 4.4 666 2.9
French only 2 0.0 0 0.0 0 0.0 2 0.0
Total 18,108 100 4,460 100 589 100 23,157 100

College of Nurses of Ontario – LHIN Region Report 2016 44
Table 17.4: Nurses employed in the Toronto Central LHIN: Number of
nursing employment positions held in the Toronto Central LHIN
Number of nursing employment positions RN RPN NP Total
# % # % # % # %
1 16,438 90.8 3,934 88.2 494 83.9 20,866 90.1
2 1,574 8.7 502 11.3 84 14.3 2,160 9.3
3+ 96 0.5 24 0.5 11 1.9 131 0.6
Total nurses employed in the Toronto Central LHIN
18,108 100 4,460 100 589 100 23,157 100
Total nursing employment positions in the Toronto Central LHIN
19,883 5,014 695 25,592
Table 17.5: Nursing employment positions of Toronto Central LHIN nurses
who are also employed in another LHIN
Location of nursing employment positions outside the Toronto Central LHIN RN RPN NP Total
Central 1,260 583 36 1,879
Central East 749 324 31 1,104
Central West 394 112 15 521
Champlain 50 7 0 57
Erie St. Clair 15 3 5 23
Hamilton Niagara Haldimand Brant 186 30 11 227
Mississauga Halton 606 155 13 774
North East 45 3 1 49
North Simcoe Muskoka 72 9 6 87
North West 22 1 0 23
South East 26 2 5 33
South West 62 3 8 73
Waterloo Wellington 86 11 9 106
Other Canadian jurisdictions 78 5 6 89
United States 24 0 5 29
International (excluding the U.S.) 9 0 0 9
Total nurses employed in nursing outside the Toronto Central LHIN30 3,154 1,087 123 4,364
30 This number is not a sum of the column above because a nurse may be employed in multiple LHINs outside the Toronto Central LHIN. This number is only a count of the number of nurses employed outside the Toronto Central LHIN, regardless of how many other LHINs employed them.

College of Nurses of Ontario – LHIN Region Report 2016 45
17.2 Nursing employment positions in the Toronto Central LHIN
Table 17.6: Nursing employment positions in the Toronto Central LHIN:
Working status
Working status RN RPN NP Total
# % # % # % # %
Full-time 12,419 62.5 2,200 43.9 431 62.0 15,050 58.8
Part-time 3,821 19.2 1,762 35.1 108 15.5 5,691 22.2
Casual 3,643 18.3 1,052 21.0 156 22.4 4,851 19.0
Total 19,883 100 5,014 100 695 100 25,592 100
Table 17.7: Nursing employment positions in the Toronto Central LHIN:
Employment sectors
Employment sector RN RPN NP Total
# % # % # % # %
Community 2,420 12.2 793 15.8 162 23.3 3,375 13.2
Hospital 14,591 73.4 2,381 47.5 440 63.3 17,412 68.0
Long-term care 903 4.5 1,571 31.3 7 1.0 2,481 9.7
Other 1,969 9.9 269 5.4 86 12.4 2,324 9.1
Total 19,883 100 5,014 100 695 100 25,592 100
Table 17.8: Nursing employment positions in the Toronto Central LHIN: Top
three nursing employers31
RN # % RPN # %
Acute care hospital 11,912 59.9 Long-term care facility 1,234 24.6
Rehabilitation hospital 836 4.2 Rehabilitation hospital 710 14.2
Long-term care facility 811 4.1 Complex continuing care hospital 690 13.8
NP # % Total # %
Acute care hospital 405 58.3 Acute care hospital 12,898 50.4
Community health centre 88 12.7 Long-term care facility 2,051 8.0
College/university 52 7.5 Rehabilitation hospital 1,557 6.1
31 For the definition of “nursing employers”, see the Membership Statistics Report at http://www.cno.org/en/what-is-cno/nursing-demographics/statistical-reports/ .
College of Nurses of Ontario – LHIN Region Report 2016 46
18 WATERLOO WELLINGTON
18.1 Waterloo Wellington LHIN demographics
For renewal, 7,249 nurses reported being employed in
at least one nursing position in the Waterloo
Wellington LHIN. These nurses held 8,165 nursing
positions there. Of the 7,249 nurses, 676 also reported
employment in at least one position outside the
Waterloo Wellington LHIN.
Table 18.1: Nurses employed in the Waterloo Wellington LHIN: Age
Age group RN RPN NP Total
# % # % # % # %
18–29 718 15.8 666 26.3 11 6.2 1,395 19.2
30–54 2,614 57.6 1,522 60.1 141 79.7 4,277 59.0
55+ 1,208 26.6 344 13.6 25 14.1 1,577 21.8
Total 4,540 100 2,532 100 177 100 7,249 100
Table 18.2: Nurses employed in the Waterloo Wellington LHIN: Gender
Gender RN RPN NP Total
# % # % # % # %
Female 4,319 95.1 2,360 93.2 168 94.9 6,847 94.5
Male 221 4.9 172 6.8 9 5.1 402 5.5
Total 4,540 100 2,532 100 177 100 7,249 100
Table 18.3: Nurses employed in the Waterloo Wellington LHIN: Official
languages in which they can competently provide nursing care
Language RN RPN NP Total
# % # % # % # %
English only 4,444 97.9 2,501 98.8 172 97.2 7,117 98.2
Bilingual 96 2.1 31 1.2 5 2.8 132 1.8
French only 0 0.0 0 0.0 0 0.0 0 0.0
Total 4,540 100 2,532 100 177 100 7,249 100

College of Nurses of Ontario – LHIN Region Report 2016 47
Table 18.4: Nurses employed in the Waterloo Wellington LHIN: Number of
nursing employment positions held in the Waterloo Wellington LHIN
Number of nursing employment positions RN RPN NP Total
# % # % # % # %
1 4,088 90.0 2,169 85.7 147 83.1 6,404 88.3
2 417 9.2 336 13.3 25 14.1 778 10.7
3+ 35 0.8 27 1.1 5 2.8 67 0.9
Total nurses employed in the Waterloo Wellington LHIN
4,540 100 2,532 100 177 100 7,249 100
Total nursing employment positions in the Waterloo Wellington LHIN
5,030 2,923 212 8,165
Table 18.5: Nursing employment positions of Waterloo Wellington LHIN
nurses who are also employed in another LHIN
Location of nursing employment positions outside the Waterloo Wellington LHIN RN RPN NP Total
Central 35 14 2 51
Central East 16 5 3 24
Central West 44 11 0 55
Champlain 6 0 2 8
Erie St. Clair 3 7 1 11
Hamilton Niagara Haldimand Brant 122 52 21 195
Mississauga Halton 61 33 3 97
North East 8 3 4 15
North Simcoe Muskoka 11 1 1 13
North West 4 0 5 9
South East 10 0 1 11
South West 110 58 7 175
Toronto Central 89 10 13 112
Other Canadian jurisdictions 35 0 1 36
United States 8 0 1 9
International (excluding the U.S.) 2 0 0 2
Total nurses employed in nursing outside the Waterloo Wellington LHIN32 462 170 44 676
32 This number is not a sum of the column above because a nurse may be employed in multiple LHINs outside the Waterloo Wellington LHIN. This number is only a count of the number of nurses employed outside the Waterloo Wellington LHIN, regardless of how many other LHINs employed them.
College of Nurses of Ontario – LHIN Region Report 2016 48
18.2 Nursing employment positions in the Waterloo Wellington LHIN
Table 18.6: Nursing employment positions in the Waterloo Wellington LHIN:
Working status
Working status RN RPN NP Total
# % # % # % # %
Full-time 2,614 52.0 1,334 45.6 107 50.5 4,055 49.7
Part-time 1,527 30.4 1,094 37.4 60 28.3 2,681 32.8
Casual 889 17.7 495 16.9 45 21.2 1,429 17.5
Total 5,030 100 2,923 100 212 100 8,165 100
Table 18.7: Nursing employment positions in the Waterloo Wellington LHIN:
Employment sectors
Employment sector RN RPN NP Total
# % # % # % # %
Community 1,321 26.3 699 23.9 132 62.3 2,152 26.4
Hospital 2,734 54.4 983 33.6 70 33.0 3,787 46.4
Long-term care 496 9.9 1,120 38.3 2 0.9 1,618 19.8
Other 479 9.5 121 4.1 8 3.8 608 7.4
Total 5,030 100 2,923 100 212 100 8,165 100
Table 18.8: Nursing employment positions in the Waterloo Wellington LHIN:
Top three nursing employers33
RN # % RPN # %
Acute care hospital 2,430 48.3 Long-term care facility 787 26.9
Long-term care facility 451 9.0 Acute care hospital 590 20.2
Community care access centre 225 4.5 Retirement home 287 9.8
NP # % Total # %
Acute care hospital 64 30.2 Acute care hospital 3,084 37.8
Family health team 37 17.5 Long-term care facility 1,240 15.2
Community health centre 28 13.2 Other community 406 5.0
33 For the definition of “nursing employers”, see the Membership Statistics Report at http://www.cno.org/en/what-is-cno/nursing-demographics/statistical-reports/ .

101 Davenport Road Toronto, Ontario Canada M5R 3P1 www.cno.org
Telephone 416 928-0900 Toll Free (Canada) 1 800 387-5526 Facsimile 416 928-6507E-mail [email protected]