lic nomura mf factsheet august 2013 · 2017-12-28 · equity market review rbi in its monetary...
TRANSCRIPT

MUTUAL INTEREST
lWorld-c lass asset management Access to g loba l research Enhanced of fer ings of serv ices & products l
Mutual Fund investments are subject to market risks, read all scheme related documents carefully
August, 2013 Investment Managers: LIC Nomura Mutual Fund Asset Management Company Ltd.

2 MUTUAL INTEREST August, 2013
Mutual Fund investments are subject to market risks, read all scheme related documents carefully
Open-ended Debt scheme providing liquidity and attractive returns.
Growth, Dividend - Reinvestment and Dividend payout option.
T + 1 Redemption facility.
Daily, Weekly, Monthly Dividend.
LIC Nomura MF Income Plus Fundupgraded by ICRA
An open-ended Debt Scheme
A1+mfs
Applicable Criteria is available on ICRA’s website at www.icra.in. All ICRA Credit Ratings are subject to certain Limitations and Disclaimers. Please read these
Limitations and Disclaimers. For Complete rating scale and definitions please refer to ICRA Website or other ICRA rating publications.
l Regular income over short term.l Investment in Debt/Money Market Instrument/Govt.

MARKET REVIEW
3
Shri S. RamasamyCIO - Debt
DEBT MARKET REVIEW
The benchmark indices ended in red in July as it was heavily pulled down by banking names on the back of RBI measures. The BSE Sensex was down 0.26% and Nifty lost 1.72%. In response to the recent fall in the INR, RBI announced liquidity tightening measures - while the moves may have sent strong signal to speculators and traders, they took a toll on banking names whose funding costs got hit. In wake of resurging inflation and falling rupee, the RBI kept policy rates unchanged (repo rate: 7.25%, reverse repo rate: 6.25%) in its July monetary policy review meeting.
Sector-wise, the top gainers were once again IT and FMCG indices which rose by 19.2% and 5.17% respectively. IT sector was up on the back of depreciating rupee coupled with strong quarterly earnings. In the FMCG sector, the parent Unilever Plc raised stake in Hindustan Unilever to ~67% against the desired 75% via the buyback offer. Following this corporate action, the global indices rebalanced and together with the perceived defensiveness of the stock made the share price run up sharply.
On the other hand, Banks, Realty, Metals and Capital Goods index fell by 13.7%, 12.8%, 11.2%, and 9.7% respectively. Bank stocks came off sharply as RBI measures hiked their wholesale funding costs.
Capital flows:
FIIs were net sellers in the equity to the tune of Rs 6,086 crore in the month of July but were still net buyers in equity to the tune of Rs. 66,092 crore from January 2013 to July 2013. (Source: SEBI)
Outlook:
The Q1 results season will come to an end by the mid of August with PSU biggies like SBI and ONGC announcing their results. The results so far have been a mixed bag with IT, telecom and media companies reporting strong set of numbers. In the IT space Infosys surprised positively on strong volumes and deal wins. The highlight of Wipro results was the strong guidance for 2Q, indicating significant improvements ahead. TCS, HCL Tech and Mindtree all delivered robust performances. In the consumer space the staples segment gave inline set of numbers but the discretionary companies continued to witness a slowdown. Major private banks reported decent growth supported by trading gains, but balance sheets of the most banks were stretched as asset quality remained the same or deteriorated. NBFC results reflected the tough environment as margins & asset quality fell.
The domestic macro situation hasn't shown any signs of recovery. India's WPI for June-2013 came at 4.86% Vs 4.70% for May-2013. IIP for May contracted by 1.6% as basic industry showed negative growth of 0.4% reflecting bleak economy outlook.
RBI retained all policy rates in the quarterly meet but issued hawkish statements, lowering FY14 GDP estimate to 5.5% from 5.7% and voicing concern over the CAD. The RBI left the timeline for the tightening measures vague as it said roll back would be contingent on forex market stability. Noticeably, the RBI appears to have shifted policy stance towards managing external risks, side-lining domestic growth concerns. So the current pessimism over poor macroeconomic condition may persist. and could also downplay government's efforts of pushing big-ticket reforms like hiking FDI in dozen sectors, including 100% in telecom and higher caps in insurance and defense sectors to boost the sagging economy.
Shri Nobutaka KitajimaCIO - Equity
EQUITY MARKET REVIEW
RBI in its monetary policy on 29th June 2013, kept all policy rate unchanged with Repo Rate at 7.25%, Reverse repo rate at 6.25%, Marginal Standing Facility(MSF) at 8.25% and Cash Reserve Ratio (CRR) at 4%. RBI kept its March-end inflation forecast unchanged at five per cent, while it lowered its estimate for 2013-14 economic growth to 5.5 per cent, from 5.7 per cent projected in May.
In a move to check the currency's volatility RBI lowered the rupee liquidity in the system by capping the LAF at Rs 75,000 from 17th July 2013 and raised the MSF rate by 200 bps to 10.25 bps, accordingly bank rate also adjusted at 10.25%. Further to suck liquidity out of the system RBI decided to conduct open market sale of Government securities worth Rs 12,000 crores. Because of this bond yields zoomed and overnight rates shoot up.
Further RBI imposed certain restrictions on 22nd July 2013 on the import of various forms of gold by nominated banks/nominated agencies/ premier or star trading houses/SEZ units/EoUs which have been permitted to import gold for use in the domestic sector. RBI also decided to rationalize the import of gold in any form/purity including import of gold coins/dore into the country. Also Nominated banks/ Nominated agencies will ensure that at least one fifth of every lot of import of gold (in any form/purity including import of gold coins/dore) is exclusively made available for the purpose of export.
Measures undertaken on 15th July 2013 by RBI to contain the volatility in the foreign exchange market had a restraining effect on volatility with a concomitant stabilising effect on the exchange rate. Based on a review of the measures, and an assessment of the liquidity and overall market conditions going forward, RBI modified the liquidity tightening measures by capping the overall limit for access to LAF by each individual bank at 0.5 per cent of its NDTL outstanding as on the last Friday of the second preceding fortnight. Further Banks are required to maintain a minimum daily CRR balance of 99 per cent of the requirement.
RBI's policy announcement on 29th July articulated that the recent liquidity tightening measures were only aimed at stemming the volatility in the currency and these measures would be withdrawn when the central bank was convinced stability in the foreign exchange market was restored.
The spillover from the US monetary policy to emerging markets has been widespread since early May, triggering central banks in emerging markets to intervene in foreign exchange markets and resort to some kind of tightening measures to dampen the outflow of capital and a sharp decline in currencies. However, most of them have avoided aggressive rate rises due to 'choppy' growth scenarios. While RBI has reduced its growth forecast for 2013-14 (from 5.7 per cent to 5.5 per cent), citing weaker domestic industrial activity and exports, it expects headline inflation to be controlled at about five per cent (year-on-year) by March 2014. Its forward-looking guidance has a dovish undertone, as it clearly says its recent tightening measures would be rolled back in a calibrated manner, as stability is restored to the foreign exchange market, enabling the monetary policy to revert to supporting growth.
Following movements took place in the month of July 2013:
" The average Call & average CBLO rates were at 9.85% & 10.00% respectively as on 31st July 2013.
" The 1 year and 5 year OIS ended at 9.59% (7.49%) & 8.48% (7.36%) respectively as on 31st July 2013.
" RBI infused Rs.37,698 crores in the repo auction on 31st July 2013, absorbed Rs 392 crores in the reverse repo auction and infused Rs 2,560 Crores under MSF as on 31st July 2013.
" PSU banks issued 3 months CD at an average yield of 11.10% and 1 year CD at an average of 9.80%.
" The 10 year bond traded at an average yield of 8.17% .
" The Rupee Dollar Exchange rate has been in the range of Rupees 59.13 to 61.22 in the month of July 2013 and depreciated compared to the month of June 2013 range of 56.68 to 60.75 and traded at an average of 59.82. The rupee touched all time low of 61.22 against the dollar on 8th July 2013. However, after RBI announced liquidity tightening moves to restrict speculative trade, the rupee stabilized.
" Mibor rate were in the range of 7.25% to 10.20% during the month of July 2013 and closed at 10.17% on 31st July 2013.
Outlook for the month of August 2013:
With the focus on stability in rupee exchange rate, the next month could see higher volatility in the long term yields given by news from the monetary from US and India. The short term yields are likely to stay away at the current levels unless there is direct policy action from RBI.
Benchmark IndexLatest Price
1 month return (%)
3 months return (%)
6 months return (%)
S&P BSE SENSEX 19345.7 -0.26 -0.81 -2.76
CNX Nifty Index 5742 -1.72 -3.17 -4.85
S&P BSE 100 5707.16 -1.64 -3.94 -6.31
S&P BSE 200 2270.93 -2.28 -4.94 -7.73
S&P BSE 500 6985.56 -2.49 -5.41 -8.87
S&P BSE Mid-Cap 5543.13
-7.06
-12.62 -20.48
S&P BSE Small -Cap 5311.06
-5.89
-11.79 -24.92
Benchmark IndexLatest Price
1 month return
(%)
3 months return
(%)6 months return
(%)
BSE IT 7458.19 19.23 30.62 16.65
S&P BSE AUTO Index 10568.8
-1.37
-3.55 -3.87
S&P BSE BANKEX 11440.96
-13.70
-20.35 -21.53
S&P BSE Capital Goods 8227.04
-9.71
-15.35 -21.61
S&P BSE Consumer
Durables6262.38
2.08
-15.74 -17.40
S&P BSE FMCG 6791.78 5.17 3.71 14.69
S&P BSE Health Care 9073.98 2.59 4.40 13.19
S&P BSE METAL Index 6882.46 -11.24 -20.44 -35.11
S&P BSE OIL & GAS Index
8578.6 -3.62 -1.52 -8.34
S&P BSE Power Index 1495.56 -7.83 -15.12 -23.35
S&P BSE Realty Index 1316.95 -12.84 -30.74 -41.17

COLOR CODE
4 MUTUAL INTEREST August, 2013
Scheme/ Plans This product is suitable for investors who are seeking*
LIC NOMURA MF BOND FUND lRegular income over medium to long term.
Investment in Debt/Money Market Instrument/Govt. Securities.
LOW RISK (BLUE)
LIC NOMURA MF FLOATING RATE FUND-SHORT TERM FUND Regular income over short term.
Investment in floating rate instrument swapped for floating rate returns.
LOW RISK (BLUE)
LIC NOMURA MF GOVT SECURITIES FUND Long term capital appreciation and current income.
Investment in sovereign securities issued by Central or state government and Debt Securities issued by PSUs
LOW RISK (BLUE)
LIC NOMURA MF INCOME PLUS FUND Regular income over short term.
Investment in Debt/Money Market Instrument/Govt.
LOW RISK (BLUE)
LIC NOMURA MF LIQUID FUND Income over short term.
Investment in Debt/Money Market Instruments
LOW RISK (BLUE)
LIC NOMURA MF SAVINGS PLUS FUND Regular income over short term.
Investment in Debt/Money Market Instruments
LOW RISK (BLUE)
LIC NOMURA MF BALANCED FUND Long term capital appreciation and regular income.
Investment in equity and equity related securities, fixed income securities (debt and Money market securities)
MEDIUM RISK (YELLOW)
LIC NOMURA MF FLOATER MIP Regular income and capital appreciation
Investment in Debt and money market instruments as well as Equity and equity related instruments
MEDIUM RISK (YELLOW)
LIC NOMURA MF MONTHLY INCOME PLAN Regular income and capital appreciation
Investment in Debt and money market instruments as well as Equity and equity related instruments
MEDIUM RISK (YELLOW)
LIC NOMURA MF CHILDRENS FUND Long term capital appreciation
Investment in Debt and money market instruments as well as Equity and equity related instruments
MEDIUM RISK (YELLOW)
l
l
l
l
l
l
l
l
l
l
l
l
l
l
l
l
l
l
l
l
l
l
l
l
l
l
l
l
l

COLOR CODE
5
Scheme/ Plans This product is suitable for investors who are seeking*
LIC NOMURA MF UNIT LINKED INSURANCE Long term capital appreciation and tax benefits
Investment in equity and equity related instruments fixed income securities (Debt and money Market)
MEDIUM RISK (YELLOW)
LIC NOMURA MF EQUITY FUND Long term capital growth
Investment in equity and equity related securities
HIGH RISK (BROWN)
LIC NOMURA MF GROWTH FUND Long term capital growth
Investment in equity and equity related securities
HIGH RISK (BROWN)
LIC NOMURA MF INDEX-NIFTY PLAN Long term capital growth
Investment in equity Instrument of respective index stock subject to tracking error
HIGH RISK (BROWN)
LIC NOMURA MF INDEX-SENSEX ADVANTAGE PLAN Long term capital growth
Investment in equity Instruments of respective index stock subject to tracking error
HIGH RISK (BROWN)
LIC NOMURA MF INDEX-SENSEX PLAN Long term capital growth
Investment in equity Instrument of respective index stock subject to tracking error
HIGH RISK (BROWN)
LIC NOMURA MF INFRASTRUCTURE FUND Long term capital growth
Investment in equity and equity related instruments related directly or indirectly with the infrastructure sector.
HIGH RISK (BROWN)
LIC NOMURA MF TAX PLAN Long term capital growth
Investment in equity and equity related securities
HIGH RISK (BROWN)
* Investors should consult their financial advisers if in doubt about whether the product is suitable for them.
Note : Risk is represented as :
(BLUE) investors understand that their principal will be at low risk
(YELLOW) investors understand that their principal will be at medium risk
(BROWN) investors understand that their principal will be at high risk
l
l
l
l
l
l
l
l
l
l
l
l
l
l
l
l
l
l
l
l
l
l
l
l

0.00%
93.51%
6.49%
0.00% 20.00% 40.00% 60.00% 80.00% 100.00%
>61 & <92 Days
<61 days
Cash &Other Receivables
* For Dividend History refer to page no. 24
INVESTMENT OBJECTIVE
An open ended scheme which seeks to generate reasonable returns with low risk and high liquidity through judicious mix of investment in money market instruments and quality debt instruments.
SCHEME FEATURES
FUND MANAGER
NAV
EXPENSE RATIO :
PORTFOLIO METRICS
Scheme Type: Debt - Liquid
Launch Date: March 11, 2002
AUM as on 31/07/2013: INR 3223.00 Cr
Load Structure:
Entry Load: Nil
Exit Load: Nil
Benchmark: Crisil Liquid Fund Index
Minimum Investment: Rs. 25000/-
Name: Shri Killol Pandya
For all the plans and options
NAV as on July 31, 2013 Per Unit
Growth 2182.6102
Dividend 1098.0000
Direct Growth 2183.4025
Direct Dividend 1098.0000
0.19%
Average Maturity 20 days
Duration 0.05 yrs
LIC NOMURA MF LIQUID FUND
6 MUTUAL INTEREST August, 2013
DISCRETE 12 MONTHS RETURNS
ANNUALISED PERFORMANCE
As on 28 June 2013
As on 31 July 2013
POINT TO POINT RETURNS
As on 28 June 2013
Lumpsum investment of 10,000 invested
Period Fund C Fund~LX 1 year T-bill
Last 1 Year 10,813
Last 2 Years 10,920 10,868 11,653
Last 3 Years 10,723 10,719 12,168
Since Inception 21,704 NA 18,407
10,865 10,812
Since Inception(CAGR)
7.10% NA 5.55%
Period Fund C Fund~LX 1 year T-bill
Jun 29, 2012 To Jun 28, 2013 8.66% 8.12% 8.17%
Jun 30, 2011 To Jun 29, 2012 9.20% 8.68% 7.76%
Jun 30, 2010 To Jun 30, 2011 7.23% 7.18% 4.43%
Period Fund C Fund~LX 1 yr T-bill
Last 7 Days 11.01% 10.68%
Last 15 Days 8.41% 3.55% -13.25%
Last 30 Days 6.20% 2.61% -21.75%
5.19%
ASSET ALLOCATION
PORTFOLIO
Company Industry/Rating % to Nav
MONEY MARKET INSTRUMENTSCertificate of DepositAXIS BANK LTD CRISIL A1+ 4.63%ALLAHABAD BANK ICRA A1+ 4.47%INDIAN BANK FITCH A1+ 3.08%CENTRAL BANK OF INDIA CARE A1+ 3.07%ALLAHABAD BANK CRISIL A1+ 3.00%ORIENTAL BANK OF COMMERCE CRISIL A1+ 2.78%IDBI BANK LTD CRISIL A1+ 2.76%THE JAMMU & KASHMIR BANK LTD CRISIL A1+ 2.30%CENTRAL BANK OF INDIA ICRA A1+ 1.55%ICICI BANK LTD ICRA A1+ 1.55%VIJAYA BANK CARE A1+ 1.53%DENA BANK CRISIL A1+ 1.53%HDFC BANK LTD CARE A1+ 0.81%ING VYSYA BANK LTD CRISIL A1+ 0.78%ICICI BANK LTD CRISIL A1+ 0.77%STATE BANK OF PATIALA ICRA A1+ 0.77%PUNJAB NATIONAL BANK ICRA A1+ 0.77%ORIENTAL BANK OF COMMERCE CARE A1+ 0.77%Certificate of Deposit Total 36.92%Commercial PaperRELIANCE CAPITAL LTD CRISIL A1+ 5.40%ADITYA BIRLA FINANCE LTD ICRA A1+ 5.38%INDIABULLS HOUSING FINANCE LTD CRISIL A1+ 4.62%NATIONAL BANK FOR AGRICULTURE AND RURAL DEVELOPMENT CRISIL A1+ 3.87%CHAMBAL FERTILIZERS & CHEMICALS LTD CRISIL A1+ 3.84%L & T INFRASTRUCTURE FINANCE CO LTD CARE A1+ 3.84%PIRAMAL ENTERPRISES LTD ICRA A1+ 3.09%MAHINDRA & MAHINDRA FINANCIAL SERVICES LTD CRISIL A1+ 3.08%HOUSING & URBAN DEVELOPMENT CORPN. LTD. CARE A1+ 2.32%EID PARRY INDIA LTD CRISIL A1+ 2.32%TATA MOTORS LTD ICRA A1+ 2.31%BERGER PAINTS (I) LTD CRISIL A1+ 1.55%NIRMA LTD CRISIL A1+ 1.55%TATA CAPITAL HOUSING FINANCE LTD CRISIL A1+ 1.55%KOTAK MAHINDRA PRIME LTD CRISIL A1+ 1.55%HOUSING DEVELOPMENT FINANCE CORPORATION LTD ICRA A1+ 1.54%L AND T FINCORP LIMITED CARE A1+ 1.54%I L & F S LTD CRISIL A1+ 1.54%SUNDARAM FINANCE LTD ICRA A1+ 0.93%IL&FS FINANCIAL SERVICES LTD FITCH A1+ 0.92%GUJARAT NARMADA VALLEY FERTILIZER COMPANY LTD ICRA A1+ 0.92%INFRASTRUCTURE DEVELOPMENT FINANCE COMPANY LTD ICRA A1+ 0.78%L & T HOUSING FINANCE CARE A1+ 0.77%GODREJ INDUSTRIES LTD ICRA A1+ 0.77%BLUE STAR LTD CARE A1+ 0.62%Commercial Paper Total 56.60%MONEY MARKET INSTRUMENTS Total 93.51%Cash & Other ReceivablesCBLO / REPO 6.48%NET RECEIVALBES/(PAYABLES) 0.00%Cash & Other Receivables 6.49%Grand Total 100.00%
MATURITY PROFILE FOR THE PORTFOLIO RATING PROFILE FOR THE PORTFOLIO
CARE A1+, CRISIL A1+,ICRA A1+, FITCH A1+
36.92%
56.60%
6.49%
93.51%
6.49%
12.95%
85.04%
0.00%
2.01%
0.00% 10.00%20.00%30.00%40.00%50.00%60.00%70.00%80.00%90.00%
>92 Days
>61 & <92 Days
<61 days
Cash &Other Receivables
LIC NOMURA MF SAVINGS PLUS FUND
* For Dividend History refer to page no. 24
INVESTMENT OBJECTIVE
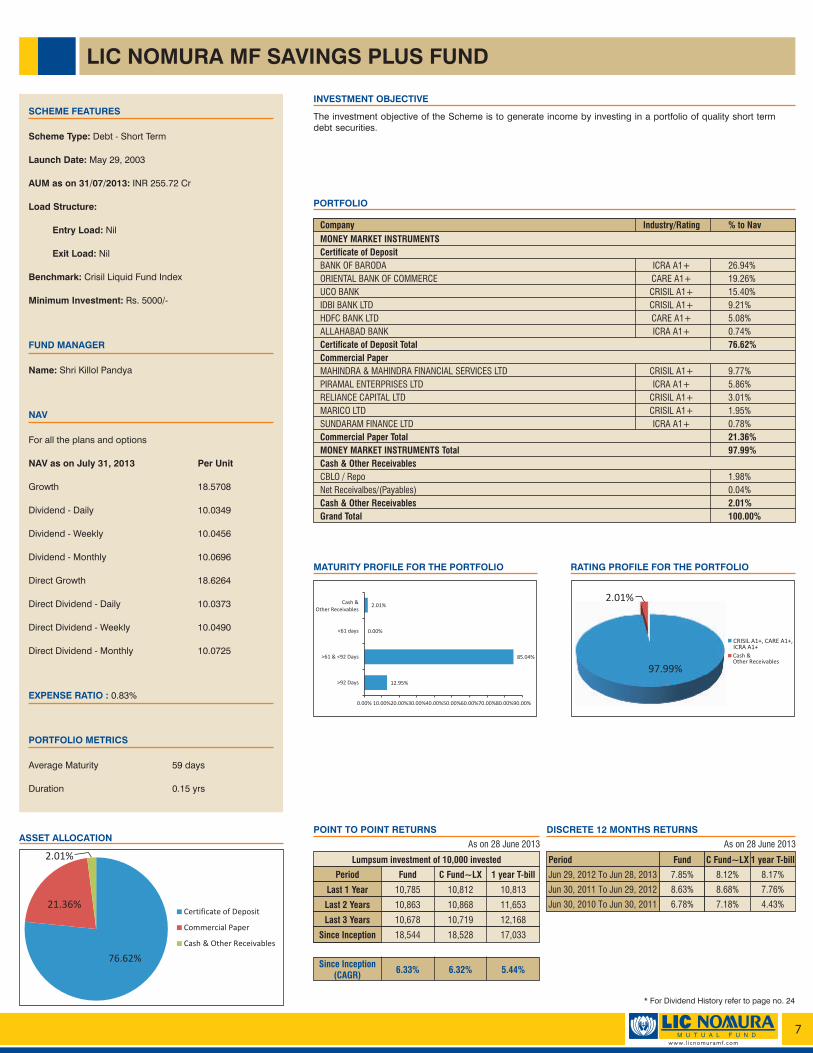
The investment objective of the Scheme is to generate income by investing in a portfolio of quality short term debt securities.
SCHEME FEATURES
FUND MANAGER
NAV
EXPENSE RATIO :
PORTFOLIO METRICS
Scheme Type:
Launch Date: May 29, 2003
AUM as on 31/07/2013: INR 255.72 Cr
Load Structure:
Entry Load: Nil
Exit Load: Nil
Benchmark: Crisil Liquid Fund Index
Minimum Investment: Rs. 5000/-
Name: Shri Killol Pandya
For all the plans and options
NAV as on July 31, 2013 Per Unit
Growth 18.5708
Dividend - Daily 10.0349
Dividend - Weekly 10.0456
Dividend - Monthly 10.0696
Direct Growth 18.6264
Direct Dividend - Daily 10.0373
Direct Dividend - Weekly 10.0490
Direct Dividend - Monthly 10.0725
0.83%
Average Maturity 59 days
Duration 0.15 yrs
Debt - Short Term
7
DISCRETE 12 MONTHS RETURNS
As on 28 June 2013
POINT TO POINT RETURNS
As on 28 June 2013
Lumpsum investment of 10,000 invested
Period Fund C Fund~LX 1 year T-bill
Last 1 Year
Last 2 Years 10,863 10,868 11,653
Last 3 Years 10,678 10,719 12,168
Since Inception 18,544 18,528 17,033
10,785 10,812 10,813
Since Inception6.33% 6.32% 5.44%
(CAGR)
Period Fund C Fund~LX 1 year T-bill
Jun 29, 2012 To Jun 28, 2013 7.85% 8.12% 8.17%
Jun 30, 2011 To Jun 29, 2012 8.63% 8.68% 7.76%
Jun 30, 2010 To Jun 30, 2011 6.78% 7.18% 4.43%
PORTFOLIO
Company Industry/Rating % to Nav
MONEY MARKET INSTRUMENTS
Certificate of Deposit
BANK OF BARODA ICRA A1+ 26.94%
ORIENTAL BANK OF COMMERCE CARE A1+ 19.26%
UCO BANK CRISIL A1+ 15.40%
IDBI BANK LTD CRISIL A1+ 9.21%
HDFC BANK LTD CARE A1+ 5.08%
ALLAHABAD BANK ICRA A1+ 0.74%
Certificate of Deposit Total 76.62%
Commercial Paper
MAHINDRA & MAHINDRA FINANCIAL SERVICES LTD CRISIL A1+ 9.77%
PIRAMAL ENTERPRISES LTD ICRA A1+ 5.86%
RELIANCE CAPITAL LTD CRISIL A1+ 3.01%
MARICO LTD CRISIL A1+ 1.95%
SUNDARAM FINANCE LTD ICRA A1+ 0.78%
Commercial Paper Total 21.36%
MONEY MARKET INSTRUMENTS Total 97.99%
Cash & Other Receivables
CBLO / Repo 1.98%
Net Receivalbes/(Payables) 0.04%
Cash & Other Receivables 2.01%
Grand Total 100.00%
MATURITY PROFILE FOR THE PORTFOLIO RATING PROFILE FOR THE PORTFOLIO
ASSET ALLOCATION
CRISIL A1+, CARE A1+,ICRA A1+
76.62%
21.36%
2.01%
97.99%
2.01%

34.12%
65.88%
34.12%
65.88%
LIC NOMURA MF FLOATING RATE FUND
* For Dividend History refer to page no. 24
INVESTMENT OBJECTIVE
The investment objective of the Scheme is to generate consistent return by investing mainly in a floating rate instruments / fixed rate instruments swapped for floating rate return so as to minimize the interest rate risk for the investor.
SCHEME FEATURES
FUND MANAGER
NAV
EXPENSE RATIO :
PORTFOLIO METRICS
Scheme Type:
Launch Date: March 15, 2004
AUM as on 31/07/2013: INR 30.95 Cr
Load Structure:
Entry Load: Nil
Exit Load: Nil
Benchmark: Crisil Liquid Fund Index
Minimum Investment: Rs. 5000/-
Name: Shri Killol Pandya
For all the plans and options
NAV as on July 31, 2013 Per Unit
Growth 19.1080
Dividend - Daily 10.0500
Dividend - Weekly 10.1883
Direct Growth 19.1338
Direct Dividend - Daily 10.0500
Direct Dividend - Weekly 10.1807
0.55%
Average Maturity 1 days
Duration 0.00 yrs
Debt - Floating
PORTFOLIO
8 MUTUAL INTEREST 2013August,
DISCRETE 12 MONTHS RETURNS
As on 28 June 2013
POINT TO POINT RETURNS
As on 28 June 2013
Lumpsum investment of 10,000 invested
Period Fund C Fund~LX 1 year T-bill
Last 1 Year
Last 2 Years 10,849 10,868 11,653
Last 3 Years 10,638 10,719 12,168
Since Inception 19,006 17,915 16,085
10,750 10,812 10,813
Since Inception7.21% 6.52% 5.29%
(CAGR)
Period Fund 1 year T-bill
Jun 29, 2012 To Jun 28, 2013 7.50% 8.12% 8.17%
Jun 30, 2011 To Jun 29, 2012 8.49% 8.68% 7.76%
Jun 30, 2010 To Jun 30, 2011 6.38% 7.18% 4.43%
C Fund~LX
Company Industry/Rating % to Nav
MUTUAL FUND
Mutual Fund Units
LICMF Liquid Fund-Growth 34.12%
Mutual Fund Units Total 34.12%
MUTUAL FUND TOTAL 34.12%
Cash & Other Receivables
CBLO / Repo 65.55%
Net Receivalbes/(Payables) 0.33%
Cash & Other Receivables 65.88%
Grand Total 100.00%
ASSET ALLOCATION
MATURITY PROFILE FOR THE PORTFOLIO RATING PROFILE FOR THE PORTFOLIO
Mutual Fund Units
Cash &Other Receivables
34.12%
65.88%
0.00% 10.00% 20.00% 30.00% 40.00% 50.00% 60.00% 70.00%
Mutual Fund Units
Cash &Other Receivables

24.54%
0.00%
74.45%
1.00%
0.00% 10.00% 20.00% 30.00% 40.00% 50.00% 60.00% 70.00% 80.00%
>92 Days
>61 & <92 Days
<61 days
Cash &Other Receivables
LIC NOMURA MF INCOME PLUS FUND
* For Dividend History refer to page no. 24
INVESTMENT OBJECTIVE
An open ended debt scheme which seeks to provide reasonable possible current income - consistent with preservation of capital and providing liquidity - from investing in a diversified portfolio of short-term money market and debt securities.
SCHEME FEATURES
FUND MANAGER
NAV
EXPENSE RATIO :
PORTFOLIO METRICS
Scheme Type:
Launch Date: May 28, 2007
AUM as on 31/07/2013: INR 170.42 Cr
Load Structure:
Entry Load: Nil
Exit Load: Nil
Benchmark: Crisil Liquid Fund Index
Minimum Investment: Rs. 500000/-
Name: Shri Killol Pandya
For all the plans and options
NAV as on July 31, 2013 Per Unit
Growth 15.7485
Dividend - Daily 10.0346
Dividend - Weekly 10.0455
Dividend - Monthly 10.0717
Direct Growth 15.7673
Direct Dividend - Daily 10.0359
Direct Dividend - Weekly 10.0474
Direct Dividend - Monthly 10.0739
0.60%
Average Maturity 66 days
Duration 0.16 yrs
Debt
9
DISCRETE 12 MONTHS RETURNS
As on 28 June 2013
POINT TO POINT RETURNS
As on 28 June 2013
Lumpsum investment of 10,000 invested
Period Fund C Fund~LX 1 year T-bill
Last 1 Year
Last 2 Years 10,877 10,868 11,653
Last 3 Years 10,696 10,719 12,168
Since Inception 15,725 15,133 14,237
10,794 10,812 10,813
Since Inception7.72% 7.05% 5.98%
(CAGR)
Period Fund 1 year T-bill
Jun 29, 2012 To Jun 28, 2013 7.94% 8.12% 8.17%
Jun 30, 2011 To Jun 29, 2012 8.77% 8.68% 7.76%
Jun 30, 2010 To Jun 30, 2011 6.96% 7.18% 4.43%
C Fund~LX
PORTFOLIO
Company Industry/Rating % to Nav
MONEY MARKET INSTRUMENTS
Certificate of Deposit
BANK OF BARODA ICRA A1+ 17.33%
HDFC BANK LTD CARE A1+ 15.12%
ALLAHABAD BANK ICRA A1+ 12.71%
UCO BANK CRISIL A1+ 5.78%
ICICI BANK LTD CARE A1+ 3.47%
ANDHRA BANK CARE A1+ 2.25%
AXIS BANK LTD ICRA A1+ 0.59%
Certificate of Deposit Total 57.24%
Commercial Paper
ADITYA BIRLA FINANCE LTD ICRA A1+ 14.62%
RELIANCE CAPITAL LTD CRISIL A1+ 9.58%
TATA MOTORS LTD ICRA A1+ 8.77%
SUNDARAM FINANCE LTD ICRA A1+ 5.86%
MARICO LTD CRISIL A1+ 2.92%
Commercial Paper Total 41.75%
MONEY MARKET INSTRUMENTS Total 99.00%
Cash & Other Receivables
CBLO / Repo 1.37%
Net Receivalbes/(Payables) -0.36%
Cash & Other Receivables 1.00%
Grand Total 100.00%
ASSET ALLOCATION
MATURITY PROFILE FOR THE PORTFOLIO RATING PROFILE FOR THE PORTFOLIO
CARE A1+, CRISIL A1+,ICRA A1+
Cash &Other Receivables
57.24%41.75%
1.00%
99.00%
1.00%

LIC NOMURA MF BOND FUND
* For Dividend History refer to page no. 24
INVESTMENT OBJECTIVE
LIC Nomura MF Bond Fund an open-ended Debt Scheme, will endeavor to generate an attractive return for its investors by investing in a portfolio of quality debt securities and money market instruments.
SCHEME FEATURES
FUND MANAGER
NAV
EXPENSE RATIO :
PORTFOLIO METRICS
Scheme Type:
Launch Date: March 26, 1999
AUM as on 31/07/2013: INR 182.10 Cr
Load Structure:
Entry Load: Nil
Exit Load: 1% if exit within 1 year from the date of allotment of units (w.e.f. 15-07-13)
Benchmark: Crisil Composite Bond Fund Index
Minimum Investment: Rs. 5000/-
Name: Shri Y D Prasanna
For all the plans and options
NAV as on July 31, 2013 Per Unit
Growth 32.4894
Dividend 9.8246
Direct Growth 32.5736
Direct Dividend 9.8546
2.03%
Average Maturity 1,983 days
Duration 2.96 years
Debt
10 MUTUAL INTEREST 2013August,
DISCRETE 12 MONTHS RETURNS
As on 28 June 2013
POINT TO POINT RETURNS
As on 28 June 2013
Lumpsum investment of 10,000 invested
Period Fund C CompBex 10 Year GOI
Last 1 Year 11,210
Last 2 Years 11,040 10,869 12,006
Last 3 Years 10,483 10,457 12,220
Since Inception 33,627 NA NA
10,953 11,072
Since Inception8.95% NA NA
(CAGR)
Period Fund 10 year GOI
Jun 29, 2012 To Jun 28, 2013 9.53% 10.72% 12.10%
Jun 30, 2011 To Jun 29, 2012 10.40% 8.69% 7.10%
Jun 30, 2010 To Jun 30, 2011 4.83% 4.58% 1.79%
C CompBex
PORTFOLIO
Company Industry/Rating % to Nav
CORPORATE DEBT
Non-convertible Debentures
RURAL ELECTRIFICATION CORPORATION LTD CRISIL AAA 11.36%
NATIONAL BANK FOR AGRICULTURE AND RURAL DEVELOPMENT CRISIL AAA 8.67%
INDIAN RAILWAY FINANCE CORP LTD CRISIL AAA 5.50%
EXPORT IMPORT BANK OF INDIA CRISIL AAA 5.45%
INFRASTRUCTURE DEVELOPMENT FINANCE COMPANY LTD ICRA AAA 5.41%
POWER GRID CORPORATION OF INDIA LTD CRISIL AAA 5.29%
SUNDARAM FINANCE LTD ICRA AA+ 5.22%
MAHINDRA & MAHINDRA FINANCIAL SERVICES LTD CRISIL AA+ 5.21%
INDIAN OIL CORPORATION LTD CRISIL AAA 3.41%
POWER FINANCE CORPORATION LTD CRISIL AAA 2.71%
SHRIRAM TRANSPORT FINANCE COMPANY LTD FITCH AA 0.03%
Non-convertible Debentures Total 58.25%
Zero Coupon Bond
DEWAN HOUSING FINANCE CORPORATION LTD CARE AA+ 4.58%
Zero Coupon Bond Total 4.58%
CORPORATE DEBT Total 62.83%
MONEY MARKET INSTRUMENTS
Commercial Paper
SUNDARAM FINANCE LTD ICRA A1+ 7.13%
Commercial Paper Total 7.13%
MONEY MARKET INSTRUMENTS Total 7.13%
GOVERNMENT BOND
Government Bond
9.15% GOI (MD 14/11/2024) SOV 8.52%
8.97% GOI (MD 05/12/2030) SOV 8.44%
8.33% GOI 2026 (M/D 09/07/2026) SOV 2.69%
Government Bond Total 19.65%
GOVERNMENT BOND Total 19.65%
Cash & Other Receivables
CBLO / REPO 7.46%
NET RECEIVALBES/(PAYABLES) 2.93%
Cash & Other Receivables 10.40%
Grand Total 100.00%
ASSET ALLOCATION
MATURITY PROFILE FOR THE PORTFOLIO RATING PROFILE FOR THE PORTFOLIO
CARE AA+, CRISIL AA+,CRISIL AAA, ICRA AA+,ICRA AAA, FITCH AA,SOV
Cash &Other Receivables
Non-convertible Debentures
Zero Coupon Bond
Commercial Paper
Government Bond
Cash & Other Receivables
58.25%
4.58
%7.13%
19.65%
10.40%
89.60%
10.40%
19.11%
70.49%
10.40%
0.00% 10.00%20.00%30.00%40.00%50.00%60.00%70.00%80.00%
<365
>365
Cash &Other Receivables

LIC NOMURA MF G-SEC FUND
INVESTMENT OBJECTIVE
The primary objective of the scheme is to generate credit risk free and reasonable returns for its investors through investments in sovereign securities issued by the central and /or state Government and /or any security unconditionally guaranteed by the central/ state government for repayment of Principal and interest and/or reverse repos in such securities as and when permitted by RBI.
SCHEME FEATURES
FUND MANAGER
NAV
EXPENSE RATIO :
PORTFOLIO METRICS
Scheme Type:
Launch Date: November 15, 1999
AUM as on 31/07/2013: INR 46.15 Cr
Load Structure:
Entry Load: Nil
Exit Load: 1% if exit within 1 year from the date of allotment of units
Benchmark: I-Sec Composite Gilt Index
Minimum Investment: Rs. 10000/-
Name: Shri Y D Prasanna
For all the plans and options
NAV as on July 31, 2013 Per Unit
PF Growth 15.1058
Regular Growth 26.2062
Direct Regular Growth 26.2846
PF Dividend 9.7754
Regular Dividend 9.8482
Direct Regular Dividend 9.8767
2.28%
Average Maturity 2,506 days
Duration 3.58 years
Debt - Gilt
PORTFOLIO
Company Industry/Rating % to Nav
CORPORATE DEBT
Non-convertible Debentures
NATIONAL HOUSING BANK CRISIL AAA 30.24%
INDIAN OIL CORPORATION LTD CRISIL AAA 2.18%
Non-convertible Debentures Total 32.42%
CORPORATE DEBT Total 32.42%
GOVERNMENT BOND
Government Bond
9.15% GOI (MD 14/11/2024) SOV 11.20%
8.97% GOI (MD 05/12/2030) SOV 11.11%
8.33% GOI 2026 (M/D 09/07/2026) SOV 10.61%
8.20% GOI (MD 24/09/2025) SOV 10.52%
8.08% GOI (MD 02/08/2022) SOV 10.31%
Government Bond Total 53.75%
GOVERNMENT BOND Total 53.75%
Cash & Other Receivables
CBLO / REPO 10.71%
NET RECEIVALBES/(PAYABLES) 3.13%
Cash & Other Receivables 13.84%
Grand Total 100.00%
11
DISCRETE 12 MONTHS RETURNS
As on 28 June 2013
POINT TO POINT RETURNS
As on 28 June 2013
Lumpsum investment of 10,000 invested
Period Fund 1O Year GOI
Last 1 Year 4
Last 2 Years 10,796 10,980 12,006
Last 3 Years 10,534 10,489 12,220
Since Inception 27,203 NA NA
10,90 11,164 11,210
Since Inception7.64% NA NA
(CAGR)
Period Fund 10 year GOI
Jun 29, 2012 To Jun 28, 2013 9.04% 11.65% 12.10%
Jun 30, 2011 To Jun 29, 2012 7.96% 9.79% 7.10%
Jun 30, 2010 To Jun 30, 2011 5.34% 4.87% 1.79%
I SecComposite Gilt
I SecComposite Gilt
ASSET ALLOCATION
MATURITY PROFILE FOR THE PORTFOLIO RATING PROFILE FOR THE PORTFOLIO
CRISIL AAA, SOV
Cash &Other Receivables
Non-convertible Debentures32.42%
53.75%
13.84%
86.16%
13.84%
30.24%
55.93%
13.84%
0.00% 10.00% 20.00% 30.00% 40.00% 50.00% 60.00%
<365
>365
Cash &Other Receivables

30.66%
67.81%
2.97%
-1.43%
-10.00% 0.00% 10.00%20.00%30.00%40.00%50.00%60.00%70.00%80.00%
<365
Equity
Mutual Fund Units
Cash & Other Receivables13.93%
11.76%
6.46%5.61%
5.50
%
5.49%
5.35%
3.52%
2.57%
2.39%1.65%
1.42%
0.95%0.81% 0.40%
Banks Software
Pharmaceuticals Finance
Construction Project Telecom - Services
Minerals/Mining Chemicals
Consumer Non Durables Petroleum Products
Auto Cement
Oil Power
Non - Ferrous Metals
Pharmaceuticals 5.50%
Dr. Reddy'S Laboratories Ltd 3.19%
Sun Pharmaceuticals Industries Ltd 1.18%
Cipla Ltd 0.72%
Lupin Ltd 0.40%
Power 1.42%
Power Grid Corporation of India Ltd 1.42%
Software 11.76%
Infosys Ltd 6.32%
Tata Consultancy Services Ltd 3.68%
Tech Mahindra Ltd 1.58%
HCL Technologies Ltd 0.18%
Telecom - Services 2.39%
Bharti Airtel Ltd 2.39%
Equity Holdings Total 67.81%
DISCRETE 12 MONTHS RETRUNS
As on 28 June 2013
POINT TO POINT RETURNS
As on 28 June 2013
Lumpsum investment of 10,000 invested
Period Fund C BalanceEx S&P CNXNifty
Last 1 Year 11,065
Last 2 Years 9,884 9,902 9,349
Last 3 Years 10,067 10,606 10,628
Since Inception 34,897 NA NA
10,277 11,090
Since Inception5.34% NA NA
(CAGR)
Period Fund S&P CNX Nifty
Jun 29, 2012 To Jun 28, 2013 2.77% 10.90% 10.67%
Jun 30, 2011 To Jun 29, 2012 -1.16% -0.99% -6.53%
Jun 30, 2010 To Jun 30, 2011 0.67% 6.04% 6.30%
C BalanceEx
LIC NOMURA MF UNIT LINKED INSURANCE SCHEME
INVESTMENT OBJECTIVE
An open ended scheme which seeks to generate long term capital appreciation and offer Tax benefits u/s 80C of the Income Tax Act as well as additional benefits of a life cover and free accident insurance cover.
SCHEME FEATURES
FUND MANAGER
NAV
EXPENSE RATIO :
ANNUAL PORTFOLIO TURNOVER RATIO :
PORTFOLIO METRICS
RISK MEASURES
Scheme Type: Insurance Linked Tax Saving
Launch Date: June 19,1989
AUM as on 31/07/2013: INR 133.76 Cr
Load Structure:
Entry Load: Nil
Exit Load: Nil
Benchmark: Crisil Balanced Fund Index
Minimum Investment:
Rs.10000/- under Single Premium Option
Rs.1000/- under Regular Premium - Yearly Option
Rs.100/- under Regular Premium - Monthly Option
Name: Mr. Surendra Jalani
For all the plans and options
NAV as on July 31, 2013 Per Unit
Dividend 10.2672
Direct Dividend 10.2793
2.33%
1.18 times
Quantitative Indicators - Debt Component
Average Maturity 46 days
Duration 0.11 years
Standard Deviation 1.10%
Sharpe Ratio 0.03
Portfolio Beta 0.91
R squared 0.11
12 MUTUAL INTEREST 2013August,
PORTFOLIO
Company % of Nav
EQUITY HOLDINGS
Auto 5.35%
Tata Motors Ltd 2.10%
Bajaj Auto Ltd 1.31%
Hero MotoCorp Ltd 0.76%
Maruti Suzuki India Ltd 0.76%
Mahindra & Mahindra Ltd 0.43%
Banks 13.93%
ICICI Bank Ltd 4.87%
HDFC Bank Ltd 3.76%
Kotak Mahindra Bank Ltd 1.74%
Axis Bank Ltd 1.66%
State Bank of India 1.30%
Yes Bank Ltd 0.59%
Indusind Bank Ltd 0.01%
Cement 3.52%
Grasim Industries Ltd 1.53%
ACC Ltd 0.88%
Ultratech Cement Ltd 0.79%
Ambuja Cements Ltd 0.32%
Chemicals 0.81%
Tata Chemicals Ltd 0.81%
Construction Project 2.57%
Larsen & Toubro Ltd 2.57%
Consumer Non Durables 6.46%
ITC Ltd 5.98%
Asian Paints Ltd 0.39%
Tata Global Beverages Ltd 0.09%
Finance 5.49%
Housing Development Finance Corporation 3.76%
Infrastructure Development Finance 1.73%
Minerals/Mining 0.95%
Coal India Ltd 0.95%
Non - Ferrous Metals 0.40%
Hindalco Industries Ltd 0.40%
Oil 1.65%
Oil & Natural Gas Corporation Ltd 0.97%
Cairn India Ltd 0.68%
Petroleum Products 5.61%
Reliance Industries Ltd 5.61%
Company Rating % of Nav
CORPORATE BOND SECURITY
Corporate Bond
DR. REDDY'S LABORATORIES LTD ICRA AA+ 0.01%
Corporate Bond Total 0.01%
CORPORATE BOND SECURITY Total 0.01%
MUTUAL FUND
Mutual Fund Units
LIC NOMURA MF LIQUID FUND-DIRECT PLAN-GR OPTION 2.97%
Mutual Fund Units Total 2.97%
MUTFUND Total 2.97%
MONEY MARKET INSTRUMENTS
Certificate of Deposit
ICICI BANK LTD CARE A1+ 7.37%
ANDHRA BANK CARE A1+ 6.44%
IDBI BANK LTD CRISIL A1+ 2.73%
UNITED BANK OF INDIA ICRA A1+ 0.51%
Certificate of Deposit Total 17.06%
Commercial Paper
INFRASTRUCTURE DEVELOPMENT FINANCE ICRA A1+ 8.09%
HOUSING DEVELOPMENT FINANCE CORP ICRA A1+ 5.49%
Commercial Paper Total 13.58%
MONEY MARKET INSTRUMENTS Total 30.64%
Cash & Other Receivables
CBLO / Repo 0.87%
Net Receivalbes/(Payables) -2.31%
Cash & Other Receivables -1.43%
Grand Total 100.00%PORTFOLIO ANALYSIS : SECTOR WISE
ASSET ALLOCATION MATURITY PROFILE FOR THE PORTFOLIO
67.81%
30.64%
2.97%0.01% -1.43%

LIC NOMURA MF BALANCED FUND
INVESTMENT OBJECTIVE
An open ended Income and Growth scheme which seeks to provide regular returns and capital appreciation according to the selection of plan by investing in equities and debt instruments.
SCHEME FEATURES
FUND MANAGER
NAV
EXPENSE RATIO :
ANNUAL PORTFOLIO TURNOVER RATIO :
PORTFOLIO METRICS
RISK MEASURES
Scheme Type:
Launch Date: January 1, 1991
AUM as on 31/07/2013: INR 17.92 Cr
Load Structure:
Entry Load: Nil
Exit Load: 1% if exit within 1 year from the date of allotment of units
Benchmark: Crisil Balanced Fund Index
Minimum Investment: Rs.1000/-
Name: Mr. Surendra Jalani
For all the plans and options
NAV as on July 31, 2013 Per Unit
Growth 60.8233
Dividend 11.5118
Direct Growth 60.9725
Direct Dividend 11.5475
2.46%
1.24 times
Quantitative Indicators - Debt Component
Average Maturity 37.50 days
Duration 0.09 years
Standard Deviation 1.15%
Sharpe Ratio 0.03
Portfolio Beta 0.87
R squared 0.10
Balanced
13
PORTFOLIO
Company % of Nav
EQUITY HOLDINGS
Auto 5.65%
TATA MOTORS LTD 2.11%
MAHINDRA & MAHINDRA LTD 1.78%
BAJAJ AUTO LTD 1.24%
HERO MOTOCORP LTD 0.41%
MARUTI SUZUKI INDIA LTD 0.11%
Banks 13.50%
HDFC BANK LTD 5.79%
ICICI BANK LTD 4.82%
KOTAK MAHINDRA BANK LTD 1.38%
AXIS BANK LTD 0.84%
YES BANK LTD 0.57%
INDUSIND BANK LTD 0.05%
STATE BANK OF INDIA 0.05%
Cement 2.61%
AMBUJA CEMENTS LTD 0.84%
ULTRATECH CEMENT LTD 0.77%
ACC LTD 0.56%
GRASIM INDUSTRIES LTD 0.44%
Construction Project 3.53%
LARSEN & TOUBRO LTD 3.53%
Consumer Non Durables 9.29%
ITC LTD 9.08%
ASIAN PAINTS LTD 0.21%
Finance 5.69%
HOUSING DEVELOPMENT FINANCE CORPORATION 3.80%
INFRASTRUCTURE DEVELOPMENT FINANCE 1.89%
Oil 1.73%
OIL & NATURAL GAS CORPORATION LTD 1.61%
CAIRN INDIA LTD 0.12%
Petroleum Products 6.45%
RELIANCE INDUSTRIES LTD 6.45%
DISCRETE 12 MONTHS RETRUNS
As on 28 June 2013
POINT TO POINT RETURNS
As on 28 June 2013
Lumpsum investment of 10,000 invested
Period Fund C BalanceEx Nifty
Last 1 Year
Last 2 Years 9,711 9,902 9,349
Last 3 Years 10,620 10,606 10,628
Since Inception 61,120 NA NA
S&P CNX
11,278 11,090 11,065
Since Inception8.38% NA NA
(CAGR)
Period Fund C BalanceEx S&P CNX Nifty
Jun 29, 2012 To Jun 28, 2013 12.78% 10.90% 10.67%
Jun 30, 2011 To Jun 29, 2012 -2.89% -0.99% -6.53%
Jun 30, 2010 To Jun 30, 2011 6.20% 6.04% 6.30%
Pharmaceuticals 5.94%
SUN PHARMACEUTICALS INDUSTRIES LTD 2.21%
DR. REDDY'S LABORATORIES LTD 1.53%
CIPLA LTD 1.23%
LUPIN LTD 0.97%
Power 0.28%
POWER GRID CORPORATION OF INDIA LTD 0.28%
Services 0.88%
ADITYA BIRLA NUVO LTD 0.88%
Software 10.72%
INFOSYS LTD 6.13%
TATA CONSULTANCY SERVICES LTD 3.04%
HCL TECHNOLOGIES LTD 1.41%
TECH MAHINDRA LTD 0.14%
Telecom - Services 0.46%
BHARTI AIRTEL LTD 0.46%
Equity Holdings Total 66.71%
PORTFOLIO ANALYSIS : SECTOR WISE
Company Rating % of Nav
MUTUAL FUND
Mutual Fund Units
LIC NOMURA MF LIQUID FUND-DIRECT PLAN-GR OPTION 9.31%
Mutual Fund Units Total 9.31%
MUTFUND Total 9.31%
MONEY MARKET INSTRUMENTS
Certificate of Deposit
UNITED BANK OF INDIA ICRA A1+ 5.12%
Certificate of Deposit Total 5.12%
Commercial Paper
HOUSING DEV. FINANCE CORP. ICRA A1+ 13.67%
INFRASTRUCTURE DEV. FINANCE ICRA A1+ 5.25%
Commercial Paper Total 18.92%
MONEY MARKET INSTRUMENTS Total 24.04%
Cash & Other Receivables
CBLO / REPO 1.10%
NET RECEIVALBES/(PAYABLES) -1.16%
Cash & Other Receivables -0.07%
Grand Total 100.00%
ASSET ALLOCATION MATURITY PROFILE FOR THE PORTFOLIO13.50%
10.72%
9.29%
6.45
%
5.94%
5.69%
5.65%3.53%
2.61%1.73%
0.88% 0.46%0.28%
Banks Software
Consumer Non Durables Petroleum Products
Pharmaceuticals Finance
Auto Construction Project
Cement Oil
Services Telecom - Services
Power
66.71%
24.04%
9.31%
-0.07%
24.04%
66.71%
9.31%
-0.07%
-10.00% 0.00% 10.00%20.00%30.00%40.00%50.00%60.00%70.00%80.00%
<365
Equity
Mutual Fund Units
Cash & Other Receivables

80.61%
3.04%
14.72%
1.64%
0.00% 20.00% 40.00% 60.00% 80.00%
<365 days
Mutual Fund Units
Equity
Cash & Other Receivables
4.56%
2.14%
1.86%
1.69%
1.57%
0.98%
0.89%
0.81%
0.16% 0.05%0.02%
Banks Consumer Non Durables
Pharmaceuticals Petroleum Products
Finance Cement
Power Oil
Construction Project
Software Auto
Pharmaceuticals 1.57%
CIPLA LTD 0.67%
LUPIN LTD 0.33%
SUN PHARMACEUTICALS INDUSTRIES LTD 0.30%
DR. REDDY'S LABORATORIES LTD 0.26%
Power 0.16%
POWER GRID CORPORATION OF INDIA LTD 0.16%
Software 4.56%
INFOSYS LTD 2.60%
TATA CONSULTANCY SERVICES LTD 1.96%
Equity Holdings Total 14.72%
LIC NOMURA MF MONTHLY INCOME PLAN
* For Dividend History refer to page no. 24
INVESTMENT OBJECTIVE
The investment objective of the Scheme is to generate regular income by investing mainly in a portfolio of quality debt securities and money market instruments. It also seeks to generate capital appreciation by investing some percentage in a mix of equity instruments.
PORTFOLIO
Company % Of Nav
EQUITY HOLDINGS
Auto 2.14%
MAHINDRA & MAHINDRA LTD 1.64%
BAJAJ AUTO LTD 0.26%
TATA MOTORS LTD 0.20%
MARUTI SUZUKI INDIA LTD 0.04%
Banks 1.86%
ICICI BANK LTD 1.06%
HDFC BANK LTD 0.56%
KOTAK MAHINDRA BANK LTD 0.19%
INDUSIND BANK LTD 0.02%
STATE BANK OF INDIA 0.02%
Cement 0.81%
ULTRATECH CEMENT LTD 0.41%
AMBUJA CEMENTS LTD 0.20%
GRASIM INDUSTRIES LTD 0.18%
ACC LTD 0.03%
Construction Project 0.02%
LARSEN & TOUBRO LTD 0.02%
Consumer Non Durables 1.69%
ITC LTD 1.46%
ASIAN PAINTS LTD 0.23%
Finance 0.89%
HOUSING DEVELOPMENT FINANCE CORPORATION 0.86%
INFRASTRUCTURE DEVELOPMENT FINANCE 0.02%
Oil 0.05%
CAIRN INDIA LTD 0.05%
PETROLEUM PRODUCTS 0.98%
RELIANCE INDUSTRIES LTD 0.98%
Company Rating % of Nav
MUTUAL FUND
Mutual Fund Units
LIC NOMURA MF LIQUID FUND-DIRECT PLAN-GR OPTION 3.04%
Mutual Fund Units Total 3.04%
MUTFUND Total 3.04%
MONEY MARKET INSTRUMENTS
Certificate of Deposit
ICICI BANK LTD CARE A1+ 33.23%
BANK OF MAHARASHTRA CRISIL A1+ 11.06%
UNITED BANK OF INDIA ICRA A1+ 5.16%
ANDHRA BANK CARE A1+ 4.30%
Certificate of Deposit Total 53.75%
Commercial Paper
INFRASTRUCTURE DEV. FINANCE ICRA A1+ 15.85%
HOUSING DEV. FINANCE CORP. ICRA A1+ 11.00%
Commercial Paper Total 26.85%
MONEY MARKET INSTRUMENTS Total 80.61%
Cash & Other Receivables
CBLO / REPO 2.31%
NET RECEIVALBES/(PAYABLES) -0.67%
Cash & Other Receivables 1.64%
Grand Total 100.00%
SCHEME FEATURES
FUND MANAGER
NAV
EXPENSE RATIO :
ANNUAL PORTFOLIO TURNOVER RATIO :
PORTFOLIO METRICS
RISK MEASURES
Scheme Type:
Launch Date: June 1, 2003
AUM as on 31/07/2013: INR 44.52 Cr
Load Structure:
Entry Load: Nil
Exit Load: 1% if exit within 1 year from the date of allotment of units
Benchmark: Crisil MIP Blended Index
Minimum Investment: Rs.5000/-
Name: Mr. Surendra Jalani
For all the plans and options
NAV as on July 31, 2013 Per Unit
Growth 36.6600
Dividend - Monthly 10.2109
Dividend - Quarterly 10.4619
Dividend - Yearly 10.9293
Direct Growth 36.7634
Direct Dividend - Monthly 10.2424
Direct Dividend - Quarterly 10.4923
Direct Dividend - Yearly 10.9617
2.16%
1.25 times
Quantitative Indicators - Debt Component
Average Maturity 87 days
Duration 0.22 years
Standard Deviation 1.95%
Sharpe Ratio 0.02
Portfolio Beta 0.30
R squared 0.02
Hybrid
14 MUTUAL INTEREST 2013August,
DISCRETE 12 MONTHS RETRUNS
As on 28 June 2013
POINT TO POINT RETURNS
As on 28 June 2013
Lumpsum investment of 10,000 invested
Period Fund C MIPex 10 Years GOI
Last 1 Year
Last 2 Years 10,187 10,655 12,006
Last 3 Years 10,306 10,503 12,220
Since Inception 36,487 22,156 17,233
10,868 11,084 11,210
Since Inception8.04% 8.21% 5.55%
(CAGR)
Period Fund 10 Yrs GOI
Jun 29, 2012 To Jun 28, 2013 8.68% 10.83% 12.10%
Jun 30, 2011 To Jun 29, 2012 1.87% 6.54% 7.10%
Jun 30, 2010 To Jun 30, 2011 3.06% 5.03% 1.79%
C MIPex
PORTFOLIO ANALYSIS : SECTOR WISE
ASSET ALLOCATION MATURITY PROFILE FOR THE PORTFOLIO
80.61%
14.72%
3.04% 1.64%

14.41%
11.27%
65.21%
7.90%
1.20%
0.00% 10.00% 20.00% 30.00% 40.00% 50.00% 60.00% 70.00%
<365
>365
Equity
Mutual Fund Units
Cash & Other Receivables
14.92%
11.18%
8.15%
7.83
%
5.82%
5.29%
4.29%
2.40%2.29%
1.24%1.08% 0.72%
PORTFOLIO
LIC NOMURA MF CHILDREN'S FUND
INVESTMENT OBJECTIVE
An open ended scheme which seeks to generate long term capital growth through a judicious mix of investment in quality debt securities and equities with relatively low risk levels through research based investments.
Company % of Nav
EQUITY HOLDINGS
Auto 8.15%
TATA MOTORS LTD 3.04%
MAHINDRA & MAHINDRA LTD 2.39%
MARUTI SUZUKI INDIA LTD 1.39%
BAJAJ AUTO LTD 1.13%
HERO MOTOCORP LTD 0.19%
Banks 14.92%
HDFC BANK LTD 6.40%
ICICI BANK LTD 4.28%
AXIS BANK LTD 2.17%
STATE BANK OF INDIA 0.98%
YES BANK LTD 0.68%
KOTAK MAHINDRA BANK LTD 0.20%
INDUSIND BANK LTD 0.20%
Cement 2.29%
AMBUJA CEMENTS LTD 1.40%
ULTRATECH CEMENT LTD 0.38%
GRASIM INDUSTRIES LTD 0.33%
ACC LTD 0.17%
Construction Project 2.40%
LARSEN & TOUBRO LTD 2.40%
Consumer Non Durables 7.83%
ITC LTD 7.30%
ASIAN PAINTS LTD 0.53%
Finance 5.82%
HOUSING DEVELOPMENT FINANCE CORPORATION 5.11%
INFRASTRUCTURE DEVELOPMENT FINANCE 0.71%
Oil 1.24%
CAIRN INDIA LTD 1.24%
Petroleum Products 5.29%
RELIANCE INDUSTRIES LTD 5.29%
Pharmaceuticals 4.29%
DR. REDDY'S LABORATORIES LTD 1.67%
CIPLA LTD 1.09%
LUPIN LTD 0.91%
SUN PHARMACEUTICALS INDUSTRIES LTD 0.62%
Company Rating % of Nav
CORPORATE BOND SECURITY
Corporate Bond
SHRIRAM TRANS FIN COMPANY LTD FITCH AA 11.27%
Corporate Bond Total 11.27%
CORPORATE BOND SECURITY Total 11.27%
MUTUAL FUND
Mutual Fund Units
LIC NOMURA MF LIQUID FUND-DIRECT PLAN-GR OPTION 7.90%
Mutual Fund Units Total 7.90%
MUTFUND Total 7.90%
MONEY MARKET INSTRUMENTS
Certificate of Deposit
UNITED BANK OF INDIA ICRA A1+ 14.41%
Certificate of Deposit Total 14.41%
MONEY MARKET INSTRUMENTS Total 14.41%
Cash & Other Receivables
CBLO / REPO 1.58%
NET RECEIVALBES/(PAYABLES) -0.38%
Cash & Other Receivables 1.20%
Grand Total 100.00%
SCHEME FEATURES
FUND MANAGER
NAV
EXPENSE RATIO :
ANNUAL PORTFOLIO TURNOVER RATIO :
PORTFOLIO METRICS
RISK MEASURES
Scheme Type:
Launch Date: September 26, 2001
AUM as on 31/07/2013: INR 4.78 Cr
Load Structure:
Entry Load: Nil
Exit Load: 1% if exit within 1 year from the date of allotment of units
Benchmark: Crisil Balanced Fund Index
Minimum Investment: Rs.5000/-
Name: Mr. Surendra Jalani
For all the plans and options
NAV as on July 31, 2013 Per Unit
Growth 10.3680
Direct Growth 10.4087
2.33%
0.98 times
Quantitative Indicators - Debt Component
Average Maturity 90 days
Duration 0.19 years
Standard Deviation 1.16%
Sharpe Ratio 0.00
Portfolio Beta 0.99
R squared 0.12
Balanced
15
* For Dividend History refer to page no. 24
DISCRETE 12 MONTHS RETRUNS
As on 28 June 2013
POINT TO POINT RETURNS
As on 28 June 2013
Lumpsum investment of 10,000 invested
Period Fund C BalanceEx S&P CNX Nifty
Last 1 Year
Last 2 Years 9,470 9,902 9,349
Last 3 Years 9,436 10,606 10,628
Since Inception 10,470 NA 57,792
10,945 11,090 11,065
Since Inception0.40% NA 16.28%
(CAGR)
Period Fund S&P CNX Nifty
Jun 29, 2012 To Jun 28, 2013 9.42% 10.90% 10.67%
Jun 30, 2011 To Jun 29, 2012 -5.30% -0.99% -6.53%
Jun 30, 2010 To Jun 30, 2011 -5.64% 6.04% 6.30%
C BalanceEx
Power 0.72%
NTPC LTD 0.55%
POWER GRID CORPORATION OF INDIA LTD 0.17%
Software 11.18%
INFOSYS LTD 5.75%
TATA CONSULTANCY SERVICES LTD 4.85%
HCL TECHNOLOGIES LTD 0.59%
Telecom - Services 1.08%
BHARTI AIRTEL LTD 1.08%
Equity Holdings Total 65.21%
ASSET ALLOCATION MATURITY PROFILE FOR THE PORTFOLIO
PORTFOLIO ANALYSIS : SECTOR WISE
Finance Petroleum Products
Pharmaceuticals Construction Project
Cement Oil
Telecom - Services Power
Consumer Non DurablesAuto
Banks Software
65.21%14.41%
11.27%
7.90%
1.20%

83.40%
13.42%
1.94%
1.24%
0.00% 20.00% 40.00% 60.00% 80.00%
<365
Equity
Mutual Fund Units
Cash & Other Receivables
2.91%
2.52%
2.06%
2.05%
1.58%
1.09%
0.42%
0.35%0
.32
%
0.10% 0.04%
Pharmaceuticals Construction Project
Auto Software
Petroleum Products Cement
Consumer Non Durables Power
Oil
Banks Finance
PORTFOLIO
LIC NOMURA MF FLOATER MIP
INVESTMENT OBJECTIVE
The investment objective of the scheme is to generate regular income by investing mainly in floating rate instruments / fixed rate instruments swapped for floating rate return so as to minimize the interest rate risk and at the same time aiming at generating capital appreciation in a long term investing in equity/equity related instruments.
Company % of Nav
EQUITY HOLDINGS
Auto 1.58%
MAHINDRA & MAHINDRA LTD 1.41%
TATA MOTORS LTD 0.10%
MARUTI SUZUKI INDIA LTD 0.04%
BAJAJ AUTO LTD 0.04%
Banks 2.91%
HDFC BANK LTD 1.89%
ICICI BANK LTD 0.60%
AXIS BANK LTD 0.40%
INDUSIND BANK LTD 0.02%
Cement 0.35%
AMBUJA CEMENTS LTD 0.17%
GRASIM INDUSTRIES LTD 0.15%
ACC LTD 0.02%
Construction Project 2.05%
LARSEN & TOUBRO LTD 2.05%
Consumer Non Durables 0.32%
ASIAN PAINTS LTD 0.20%
ITC LTD 0.12%
Finance 2.52%
INFRASTRUCTURE DEVELOPMENT FINANCE 1.42%
HOUSING DEVELOPMENT FINANCE CORPORATION 1.10%
Oil 0.04%
CAIRN INDIA LTD 0.04%
Petroleum Products 0.42%
RELIANCE INDUSTRIES LTD 0.42%
Company Rating % of Nav
MUTUAL FUND
Mutual Fund Units
LIC NOMURA MF LIQUID FUND-DIRECT PLAN-GR OPTION 1.94%
Mutual Fund Units Total 1.94%
MUTFUND Total 1.94%
MONEY MARKET INSTRUMENTS
Certificate of Deposit
BANK OF MAHARASHTRA CRISIL A1+ 28.60%
ICICI BANK LTD CARE A1+ 26.73%
Certificate of Deposit Total 55.33%
Commercial Paper
HOUSING DEV. FINANCE CORP. ICRA A1+ 18.96%
INFRASTRUCTURE DEV. FINANCE ICRA A1+ 9.11%
Commercial Paper Total 28.07%
MONEY MARKET INSTRUMENTS Total 83.40%
Cash & Other Receivables
CBLO / REPO 2.16%
NET RECEIVALBES/(PAYABLES) -0.92%
Cash & Other Receivables 1.24%
Grand Total 100.00%
SCHEME FEATURES
FUND MANAGER
NAV
EXPENSE RATIO :
ANNUAL PORTFOLIO TURNOVER RATIO :
PORTFOLIO METRICS
RISK MEASURES
Scheme Type:
Launch Date: September 21, 2004
AUM as on 31/07/2013: INR 51.66 Cr
Load Structure:
Entry Load: Nil
Exit Load: 1% if exit within 1 year from the date of allotment of units
Benchmark: Crisil MIP Blended Index
Minimum Investment: Rs.5000/-
Name: Mr. Surendra Jalani
For all the plans and options
NAV as on July 31, 2013 Per Unit
Growth 20.6507
Dividend - Monthly 10.1003
Dividend - Quarterly 10.2288
Dividend - Yearly 10.9374
Direct Growth 19.6644
Direct Dividend - Monthly
Direct Dividend - Quarterly 10.2273
Direct Dividend - Yearly 10.9370
1.69%
1.91 times
Quantitative Indicators - Debt Component
Average Maturity 60 days
Duration 0.15 years
Standard Deviation 0.33%
Sharpe Ratio 0.06
Portfolio Beta 0.39
R squared 0.15
Hybrid
16 MUTUAL INTEREST 2013August,
* For Dividend History refer to page no. 24
DISCRETE 12 MONTHS RETRUNS
As on 28 June 2013
POINT TO POINT RETURNS
As on 28 June 2013
Lumpsum investment of 10,000 invested
Period Fund C MIPex 10 Years GOI
Last 1 Year
Last 2 Years 10,381 10,655 12,006
Last 3 Years 10,607 10,503 12,220
Since Inception 20,723 19,726 16,433
10,746 11,084 11,210
Since Inception8.77% 8.15% 5.90%
(CAGR)
Period Fund 10 Yrs GOI
Jun 29, 2012 To Jun 28, 2013 7.46% 10.83% 12.10%
Jun 30, 2011 To Jun 29, 2012 3.81% 6.54% 7.10%
Jun 30, 2010 To Jun 30, 2011 6.07% 5.03% 1.79%
C MIPex
PORTFOLIO ANALYSIS : SECTOR WISE
ASSET ALLOCATION MATURITY PROFILE FOR THE PORTFOLIO
Pharmaceuticals 2.06%
CIPLA LTD 0.93%
BIOCON LTD 0.64%
SUN PHARMACEUTICALS INDUSTRIES LTD 0.26%
DR. REDDY'S LABORATORIES LTD 0.22%
Power 0.10%
POWER GRID CORPORATION OF INDIA LTD 0.10%
Software 1.09%
INFOSYS LTD 0.80%
TATA CONSULTANCY SERVICES LTD 0.28%
Equity Holdings Total 13.42%
83.40%
13.42%
1.94% 1.24%
DISCRETE 12 MONTHS RETRUNS
As on 28 June 2013
POINT TO POINT RETURNS
As on 28 June 2013
Lumpsum investment of 10,000 invested
Period Fund BSE Sensex Nifty
Last 1 Year
Last 2 Years 9,255 9,255 9,349
Last 3 Years 10,305 10,648 10,628
Since Inception 25,855 46,263 48,805
10,592 11,133 11,065
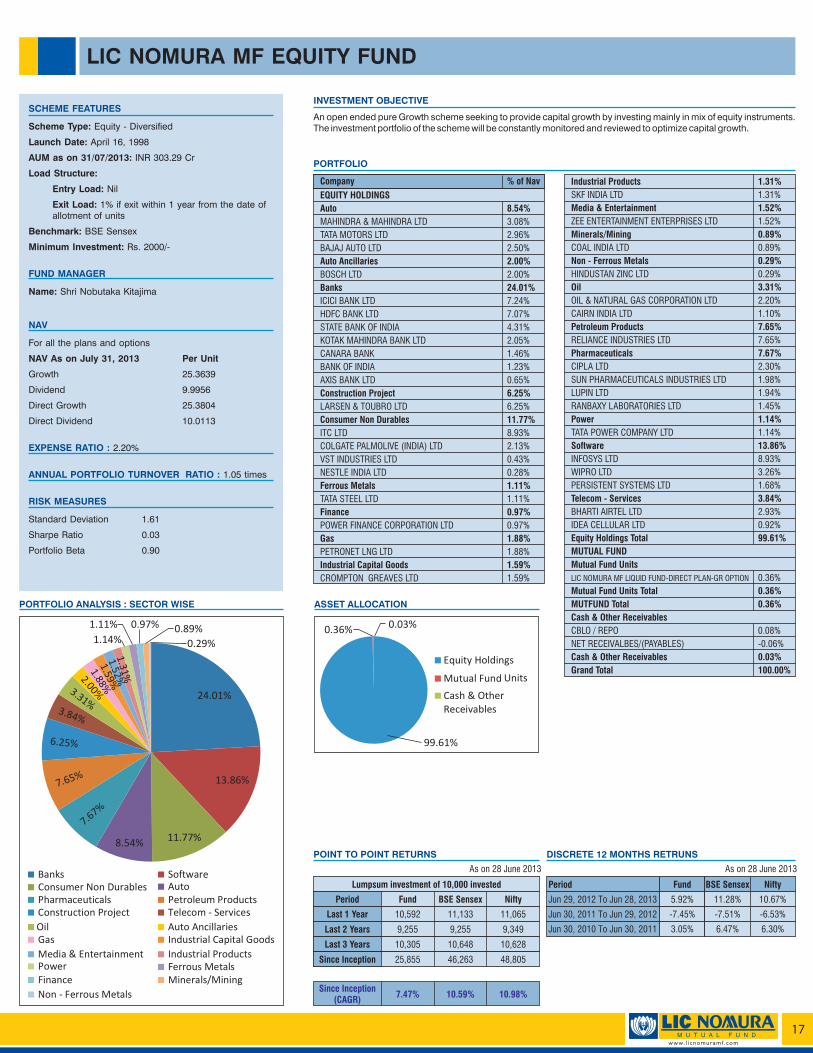
Since Inception7.47% 10.59% 10.98%
(CAGR)
Period Fund BSE Sensex Nifty
Jun 29, 2012 To Jun 28, 2013 5.92% 11.28% 10.67%
Jun 30, 2011 To Jun 29, 2012 -7.45% -7.51% -6.53%
Jun 30, 2010 To Jun 30, 2011 3.05% 6.47% 6.30%
SCHEME FEATURES
FUND MANAGER
NAV
EXPENSE RATIO :
ANNUAL PORTFOLIO TURNOVER RATIO :
RISK MEASURES
Scheme Type:
Launch Date: April 16, 1998
AUM as on 31/07/2013: INR 303.29 Cr
Load Structure:
Entry Load: Nil
Exit Load: 1% if exit within 1 year from the date of allotment of units
Benchmark: BSE Sensex
Minimum Investment: Rs. 2000/-
Name: Shri Nobutaka Kitajima
For all the plans and options
NAV As on July 31, 2013 Per Unit
Growth 25.3639
Dividend 9.9956
Direct Growth 25.3804
Direct Dividend 10.0113
2.20%
1.05 times
Standard Deviation 1.61
Sharpe Ratio 0.03
Portfolio Beta 0.90
Equity - Diversified
LIC NOMURA MF EQUITY FUND
An open ended pure Growth scheme seeking to provide capital growth by investing mainly in mix of equity instruments. The investment portfolio of the scheme will be constantly monitored and reviewed to optimize capital growth.
INVESTMENT OBJECTIVE
PORTFOLIO
Company % of Nav
EQUITY HOLDINGS
Auto 8.54%
MAHINDRA & MAHINDRA LTD 3.08%
TATA MOTORS LTD 2.96%
BAJAJ AUTO LTD 2.50%
Auto Ancillaries 2.00%
BOSCH LTD 2.00%
Banks 24.01%
ICICI BANK LTD 7.24%
HDFC BANK LTD 7.07%
STATE BANK OF INDIA 4.31%
KOTAK MAHINDRA BANK LTD 2.05%
CANARA BANK 1.46%
BANK OF INDIA 1.23%
AXIS BANK LTD 0.65%
Construction Project 6.25%
LARSEN & TOUBRO LTD 6.25%
Consumer Non Durables 11.77%
ITC LTD 8.93%
COLGATE PALMOLIVE (INDIA) LTD 2.13%
VST INDUSTRIES LTD 0.43%
NESTLE INDIA LTD 0.28%
Ferrous Metals 1.11%
TATA STEEL LTD 1.11%
Finance 0.97%
POWER FINANCE CORPORATION LTD 0.97%
Gas 1.88%
PETRONET LNG LTD 1.88%
Industrial Capital Goods 1.59%
CROMPTON GREAVES LTD 1.59%
Industrial Products 1.31%
SKF INDIA LTD 1.31%
Media & Entertainment 1.52%
ZEE ENTERTAINMENT ENTERPRISES LTD 1.52%
Minerals/Mining 0.89%
COAL INDIA LTD 0.89%
Non - Ferrous Metals 0.29%
HINDUSTAN ZINC LTD 0.29%
Oil 3.31%
OIL & NATURAL GAS CORPORATION LTD 2.20%
CAIRN INDIA LTD 1.10%
Petroleum Products 7.65%
RELIANCE INDUSTRIES LTD 7.65%
Pharmaceuticals 7.67%
CIPLA LTD 2.30%
SUN PHARMACEUTICALS INDUSTRIES LTD 1.98%
LUPIN LTD 1.94%
RANBAXY LABORATORIES LTD 1.45%
Power 1.14%
TATA POWER COMPANY LTD 1.14%
Software 13.86%
INFOSYS LTD 8.93%
WIPRO LTD 3.26%
PERSISTENT SYSTEMS LTD 1.68%
Telecom - Services 3.84%
BHARTI AIRTEL LTD 2.93%
IDEA CELLULAR LTD 0.92%
Equity Holdings Total 99.61%
MUTUAL FUND
Mutual Fund Units
LIC NOMURA MF LIQUID FUND-DIRECT PLAN-GR OPTION 0.36%
Mutual Fund Units Total 0.36%
MUTFUND Total 0.36%
Cash & Other Receivables
CBLO / REPO 0.08%
NET RECEIVALBES/(PAYABLES) -0.06%
Cash & Other Receivables 0.03%
Grand Total 100.00%
17
PORTFOLIO ANALYSIS : SECTOR WISE ASSET ALLOCATION
24.01%
13.86%
11.77%8.54%
7.67%
7.65%
6.25%
3.84%
3.31%
2.00%1.88%
1.59%1.52%
1.31%
1.14%
1.11% 0.97% 0.89%
0.29%
Banks SoftwareConsumer Non Durables AutoPharmaceuticals Petroleum ProductsConstruction Project Telecom - Services
Oil Auto AncillariesGas Industrial Capital Goods
Media & Entertainment Industrial ProductsPower Ferrous MetalsFinance Minerals/Mining
Non - Ferrous Metals
99.61%
0.36% 0.03%

22.67%
18.59%
14.34%
8.56%
6.13%
5.54%
5.33%
4.87%
4.65%2.55%
2.23%
2.19% 1.03%
SCHEME FEATURES
FUND MANAGER
NAV
EXPENSE RATIO :
ANNUAL PORTFOLIO TURNOVER RATIO:
RISK MEASURES
Scheme Type:
Launch Date: September 1, 1999
AUM as on 31/07/2013: INR 69.04 Cr
Load Structure:
Entry Load: Nil
Exit Load: 1% if exit within 1 year from the date of allotment of units
Benchmark: BSE Sensex
Minimum Investment: Rs. 2000/-
Name: Shri Nobutaka Kitajima
For all the plans and options
NAV As on July 31, 2013 Per Unit
Growth 12.7455
Dividend 11.3027
Direct Growth 12.7812
Direct Dividend 11.3056
2.47%
0.72 times
Standard Deviation 1.58
Sharpe Ratio 0.04
Portfolio Beta 0.86
Equity - Diversified
LIC NOMURA MF GROWTH FUND
An open ended pure Growth scheme seeking to provide capital growth by investing mainly in equity instruments and also in debt and other permitted instruments of capital and money markets. The investment portfolio of the scheme will be constantly monitored and reviewed to optimize capital growth.
INVESTMENT OBJECTIVE
18 MUTUAL INTEREST 2013August,
PORTFOLIO
Company % of Nav
EQUITY HOLDINGS
Auto 5.54%
TATA MOTORS LTD 3.52%
BAJAJ AUTO LTD 2.02%
Auto Ancillaries 2.19%
BOSCH LTD 2.19%
Banks 22.67%
ICICI BANK LTD 7.49%
HDFC BANK LTD 7.15%
KOTAK MAHINDRA BANK LTD 3.16%
STATE BANK OF INDIA 2.56%
AXIS BANK LTD 2.31%
Chemicals 1.03%
PIDILITE INDUSTRIES LTD 1.03%
Construction Project 4.65%
LARSEN & TOUBRO LTD 4.65%
Consumer Non Durables 14.34%
ITC LTD 9.35%
COLGATE PALMOLIVE (INDIA) LTD 2.25%
NESTLE INDIA LTD 2.15%
ASIAN PAINTS LTD 0.59%
Finance 2.55%
HOUSING DEVELOPMENT FINANCE CORP LTD 2.55%
Gas 2.23%
PETRONET LNG LTD 2.23%
Media & Entertainment 6.13%
ZEE ENTERTAINMENT ENTERPRISES LTD 3.62%
D.B.CORP LTD 1.40%
DISH TV INDIA LTD 1.10%
Oil 4.87%
OIL & NATURAL GAS CORPORATION LTD 2.58%
CAIRN INDIA LTD 2.29%
Pharmaceuticals 8.56%
LUPIN LTD 3.50%
SUN PHARMACEUTICALS INDUSTRIES LTD 2.79%
CIPLA LTD 2.27%
Software 18.59%
TATA CONSULTANCY SERVICES LTD 4.75%
INFOSYS LTD 4.58%
HCL TECHNOLOGIES LTD 4.49%
WIPRO LTD 2.85%
PERSISTENT SYSTEMS LTD 1.93%
Telecom - Services 5.33%
BHARTI AIRTEL LTD 2.86%
IDEA CELLULAR LTD 2.47%
Equity Holdings Total 98.67%
Cash & Other Receivables
CBLO / REPO 2.00%
NET RECEIVALBES/(PAYABLES) -0.67%
Cash & Other Receivables 1.33%
Grand Total 100.00%
DISCRETE 12 MONTHS RETRUNS
As on 28 June 2013
POINT TO POINT RETURNS
As on 28 June 2013
Lumpsum investment of 10,000 invested
Period Fund BSE Sensex Nifty
Last 1 Year
Last 2 Years 9,341 9,255 9,349
Last 3 Years 10,353 10,648 10,628
Since Inception 12,710 40,203 41,413
10,617 11,133 11,065
Since Inception7.55% 10.58% 10.82%
(CAGR)
Period Fund BSE Sensex Nifty
Jun 29, 2012 To Jun 28, 2013 6.17% 11.28% 10.67%
Jun 30, 2011 To Jun 29, 2012 -6.59% -7.51% -6.53%
Jun 30, 2010 To Jun 30, 2011 3.53% 6.47% 6.30%
PORTFOLIO ANALYSIS : SECTOR WISE ASSET ALLOCATION
Banks Software
Consumer Non Durables Pharmaceuticals
Media & Entertainment Auto
Telecom - Services Oil
Construction Project Finance
Gas Auto Ancillaries
Chemicals
98.67%
1.33%

Consumer Non Durables Petroleum Products
Telecom - Services Pharmaceuticals
Auto Oil
Construction Project Finance
Media & Entertainment Chemicals
Power Non - Ferrous Metals
Gas Transportation
Banks Software
19.06%
18.08%
13.38%8.26
%
5.78%
5.72%
5.38%
5.25%
5.09%
4.02%3.90%
1.28%
0.95% 0.74% 0.63%0.00%
SCHEME FEATURES
FUND MANAGER
NAV
EXPENSE RATIO :
ANNUAL PORTFOLIO TURNOVER RATIO:
RISK MEASURES
Scheme Type:
Launch Date: April 17, 2000
AUM as on 31/07/2013: INR 28.20 Cr
Load Structure:
Entry Load: Nil
Exit Load: Nil
Benchmark: BSE Sensex
Minimum Investment: Rs. 500/-
Offered under ELSS - 3 years lock-in period
Name: Shri Nobutaka Kitajima
For all the plans and options
NAV as on July 31, 2013 Per Unit
Growth 28.7224
Dividend 10.2834
Direct Growth 28.8968
Direct Dividend 10.3454
2.49%
0.37 times
Standard Deviation 1.91%
Sharpe Ratio 0.03
Portfolio Beta 0.86
Equity Linked Savings Scheme
LIC NOMURA MF TAX PLAN
To provide capital growth along with tax rebate and tax relief to our investors through prudent investments in the stock markets.
INVESTMENT OBJECTIVE
PORTFOLIO
Company % of Nav
EQUITY HOLDINGS
Auto 5.38%
MAHINDRA & MAHINDRA LTD 3.46%
BAJAJ AUTO LTD 1.92%
Banks 19.06%
ICICI BANK LTD 6.96%
HDFC BANK LTD 5.91%
STATE BANK OF INDIA 4.21%
KOTAK MAHINDRA BANK LTD 1.98%
Chemicals 1.28%
PIDILITE INDUSTRIES LTD 1.28%
Construction Project 5.09%
LARSEN & TOUBRO LTD 5.09%
Consumer Non Durables 13.38%
ITC LTD 9.28%
NESTLE INDIA LTD 1.50%
COLGATE PALMOLIVE (INDIA) LTD 1.42%
VST INDUSTRIES LTD 1.18%
Finance 4.02%
HOUSING DEVELOPMENT FINANCE CORP LTD 4.02%
Gas 0.63%
PETRONET LNG LTD 0.63%
Media & Entertainment 3.90%
D.B.CORP LTD 2.00%
ZEE ENTERTAINMENT ENTERPRISES LTD 1.89%
Non - Ferrous Metals 0.74%
HINDUSTAN ZINC LTD 0.74%
Oil 5.25%
OIL & NATURAL GAS CORPORATION LTD 3.14%
CAIRN INDIA LTD 2.10%
Petroleum Products 8.26%
RELIANCE INDUSTRIES LTD 8.26%
Pharmaceuticals 5.72%
SUN PHARMACEUTICALS INDUSTRIES LTD 1.80%
CIPLA LTD 1.74%
DIVI'S LABORATORIES LTD 1.00%
LUPIN LTD 0.62%
DR. REDDY'S LABORATORIES LTD 0.57%
Power 0.95%
POWER GRID CORPORATION OF INDIA LTD 0.95%
Software 18.08%
INFOSYS LTD 9.90%
TATA CONSULTANCY SERVICES LTD 5.86%
WIPRO LTD 1.39%
PERSISTENT SYSTEMS LTD 0.93%
Telecom - Services 5.78%
IDEA CELLULAR LTD 4.12%
BHARTI AIRTEL LTD 1.66%
Equity Holdings Total 97.52%
Cash & Other Receivables
CBLO / REPO 3.60%
NET RECEIVALBES/(PAYABLES) -1.12%
Cash & Other Receivables 2.48%
Grand Total 100.00%
19
DISCRETE 12 MONTHS RETRUNS
As on 28 June 2013
POINT TO POINT RETURNS
As on 28 June 2013
Lumpsum investment of 10,000 invested
Period Fund BSE Sensex Nifty
Last 1 Year
Last 2 Years 9,261 9,255 9,349
Last 3 Years 10,426 10,648 10,628
Since Inception 28,808 39,740 40,471
10,629 11,133 11,065
Since Inception5.37% 11.01% 11.17%
(CAGR)
Period Fund BSE Sensex Nifty
Jun 29, 2012 To Jun 28, 2013 6.29% 11.28% 10.67%
Jun 30, 2011 To Jun 29, 2012 -7.39% -7.51% -6.53%
Jun 30, 2010 To Jun 30, 2011 4.26% 6.47% 6.30%
PORTFOLIO ANALYSIS : SECTOR WISE
ASSET ALLOCATION
97.52%
2.48%

16.67%
16.09%
15.32%
9.62%
9.32%
7.45%
5.76%
4.24%
3.74%
2.90%2.46%
1.39%1.37%
1.06% 0.90%0.81%
Consumer Non Durables Auto
Petroleum Products Finance
Pharmaceuticals Construction Project
Oil Telecom - Services
Power Non - Ferrous Metals
Ferrous Metals Minerals/Mining
Gas Industrial Capital Goods
Software Banks
SCHEME FEATURES
FUND MANAGER
NAV
EXPENSE RATIO :
ANNUAL PORTFOLIO TURNOVER RATIO :
RISK MEASURES
Scheme Type:
Launch Date: November 15, 2002
AUM as on 31/07/2013: INR 14.99 Cr
Load Structure:
Entry Load: Nil
Exit Load: 1% if exit within 1 month from the date of allotment of units (w.e.f. 15-07-13)
Benchmark: BSE Sensex
Minimum Investment: Rs. 2000/-
Name: Shri Nobutaka Kitajima
For all the plans and options
NAV as on July 31, 2013 Per Unit
Growth 36.6067
Dividend 12.5470
Direct Growth 36.7073
Direct Dividend 12.3459
1.70%
0.02 times
Tracking error 0.40%
Standard Deviation 1.57%
Sharpe Ratio 0.03
Portfolio Beta 0.94
Equity - Index
LIC NOMURA MF INDEX FUND - SENSEX PLAN
The main investment objective of the fund is to generate returns commensurate with the performance of the index either Nifty / Sensex based on the plans by investing in the respective index stocks subject to tracking errors.
INVESTMENT OBJECTIVE
PORTFOLIO
Company % of Nav
EQUITY HOLDINGS
Auto 9.62%
TATA MOTORS LTD 3.34%
MAHINDRA & MAHINDRA LTD 2.51%
BAJAJ AUTO LTD 1.66%
HERO MOTOCORP LTD 1.07%
MARUTI SUZUKI INDIA LTD 1.04%
Banks 16.09%
HDFC BANK LTD 6.99%
ICICI BANK LTD 6.28%
STATE BANK OF INDIA 2.82%
Construction Project 4.24%
LARSEN & TOUBRO LTD 4.24%
Consumer Non Durables 15.32%
ITC LTD 11.36%
HINDUSTAN UNILEVER LTD 3.96%
Ferrous Metals 1.37%
TATA STEEL LTD 0.87%
JINDAL STEEL & POWER LTD 0.49%
Finance 7.45%
HOUSING DEVELOPMENT FINANCE CORP LTD 7.45%
Gas 0.90%
GAIL (INDIA) LTD 0.90%
Industrial Capital Goods 0.81%
BHARAT HEAVY ELECTRICALS LTD 0.81%
Minerals/Mining 1.06%
COAL INDIA LTD 1.06%
Non - Ferrous Metals 1.39%
HINDALCO INDUSTRIES LTD 0.71%
STERLITE INDUSTRIES ( INDIA ) LTD 0.68%
Oil 3.74%
OIL & NATURAL GAS CORPORATION LTD 3.74%
Petroleum Products 9.32%
RELIANCE INDUSTRIES LTD 9.32%
Pharmaceuticals 5.76%
SUN PHARMACEUTICALS INDUSTRIES LTD 2.78%
DR. REDDY'S LABORATORIES LTD 1.73%
CIPLA LTD 1.25%
Power 2.46%
NTPC LTD 1.60%
TATA POWER COMPANY LTD 0.86%
Software 16.67%
INFOSYS LTD 8.67%
TATA CONSULTANCY SERVICES LTD 6.40%
WIPRO LTD 1.59%
Telecom - Services 2.90%
BHARTI AIRTEL LTD 2.90%
Equity Holdings Total 99.08%
Cash & Other Receivables
CBLO / REPO 0.86%
NET RECEIVALBES/(PAYABLES) 0.06%
Cash & Other Receivables 0.92%
Grand Total 100.00%
20 MUTUAL INTEREST 2013August,
DISCRETE 12 MONTHS RETRUNS
As on 28 June 2013
POINT TO POINT RETURNS
As on 28 June 2013
Lumpsum investment of 10,000 invested
Period Fund BSE Sensex Nifty
Last 1 Year
Last 2 Years 9,295 9,255 9,349
Last 3 Years 10,682 10,648 10,628
Since Inception 36,680 60,054 55,855
11,183 11,133 11,065
Since Inception13.45% 18.48% 17.67%
(CAGR)
Period Fund BSE Sensex Nifty
Jun 29, 2012 To Jun 28, 2013 11.83% 11.28% 10.67%
Jun 30, 2011 To Jun 29, 2012 -7.05% -7.51% -6.53%
Jun 30, 2010 To Jun 30, 2011 6.82% 6.47% 6.30%
PORTFOLIO ANALYSIS : SECTOR WISE ASSET ALLOCATION
99.08%
0.92%

Consumer Non Durables Auto
Petroleum Products Finance
Pharmaceuticals Construction Project
Oil Power
Cement Telecom - Services
Minerals/Mining Ferrous Metals
Gas Industrial Capital Goods
Non - Ferrous Metals Construction
Banks Software
19.27%
14.25%
13.71%
8.41%
8.28%
7.52%
6.29%
3.76%
3.74%
3.25%3.16%
2.22%1.63%
1.19%
0.73% 0.67% 0.62%0.53%
PORTFOLIO ANALYSIS : SECTOR WISE
SCHEME FEATURES
FUND MANAGER
NAV
EXPENSE RATIO :
ANNUAL PORTFOLIO TURNOVER RATIO :
RISK MEASURES
Scheme Type:
Launch Date: November 15, 2002
AUM as on 31/07/2013: INR 25.39 Cr
Load Structure:
Entry Load: Nil
Exit Load: 1% if exit within 1 month from the date of allotment of units (w.e.f. 15-07-13)
Benchmark: S&P CNX Nifty
Minimum Investment: Rs. 2000/-
Name: Shri Nobutaka Kitajima
For all the plans and options
NAV as on July 31, 2013 Per Unit
Growth 32.1083
Dividend 11.8439
Direct Growth 32.2018
Direct Dividend 11.8723
1.67%
0.30 times
Tracking error 0.69%
Standard Deviation 1.54%
Sharpe Ratio 0.03
Portfolio Beta 0.87
Equity - Index
LIC NOMURA MF INDEX FUND - NIFTY PLAN
The main investment objective of the fund is to generate returns commensurate with the performance of the index either Nifty / Sensex based on the plans by investing in the respective index stocks subject to tracking errors.
INVESTMENT OBJECTIVE
21
DISCRETE 12 MONTHS RETRUNS
As on 28 June 2013
POINT TO POINT RETURNS
As on 28 June 2013
Lumpsum investment of 10,000 invested
Period Fund Nifty Sensex
Last 1 Year
Last 2 Years 9,425 9,349 9,255
Last 3 Years 10,661 10,628 10,648
Since Inception 32,610 55,855 60,054
11,066 11,065 11,133
Since Inception12.24% 17.67% 18.48%
(CAGR)
Period Fund Nifty
Jun 29, 2012 To Jun 28, 2013 10.66% 10.67% 11.28%
Jun 30, 2011 To Jun 29, 2012 -5.75% -6.53% -7.51%
Jun 30, 2010 To Jun 30, 2011 6.61% 6.30% 6.47%
Sensex
PORTFOLIO ANALYSIS : SECTOR WISE
PORTFOLIO
Company % of Nav
EQUITY HOLDINGS
Auto 8.41%
TATA MOTORS LTD 2.84%
MAHINDRA & MAHINDRA LTD 2.30%
BAJAJ AUTO LTD 1.40%
MARUTI SUZUKI INDIA LTD 0.94%
HERO MOTOCORP LTD 0.94%
Banks 19.27%
HDFC BANK LTD 6.15%
ICICI BANK LTD 5.74%
STATE BANK OF INDIA 2.38%
AXIS BANK LTD 1.73%
KOTAK MAHINDRA BANK LTD 1.36%
INDUSIND BANK LTD 0.89%
BANK OF BARODA 0.57%
PUNJAB NATIONAL BANK 0.46%
Cement 3.16%
ULTRATECH CEMENT LTD 0.99%
GRASIM INDUSTRIES LTD 0.90%
AMBUJA CEMENTS LTD 0.68%
ACC LTD 0.59%
Construction 0.53%
DLF LTD 0.30%
JAIPRAKASH ASSOCIATES LTD 0.23%
Construction Project 3.76%
LARSEN & TOUBRO LTD 3.76%
Consumer Non Durables 13.71%
ITC LTD 10.10%
HINDUSTAN UNILEVER LTD 2.37%
ASIAN PAINTS LTD 1.24%
Ferrous Metals 1.19%
TATA STEEL LTD 0.77%
JINDAL STEEL & POWER LTD 0.41%
Finance 7.52%
HOUSING DEVELOPMENT FINANCE CORP LTD 6.80%
INFRASTRUCTURE DEV FINANCE COMPANY LTD 0.71%
Gas 0.73%
GAIL (INDIA) LTD 0.73%
Industrial Capital Goods 0.67%
BHARAT HEAVY ELECTRICALS LTD 0.67%
Minerals/Mining 1.63%
COAL INDIA LTD 0.96%
NMDC LTD 0.41%
SESA GOA LTD 0.26%
Non - Ferrous Metals 0.62%
HINDALCO INDUSTRIES LTD 0.62%
Oil 3.74%
OIL & NATURAL GAS CORPORATION LTD 2.78%
CAIRN INDIA LTD 0.95%
Petroleum Products 8.28%
RELIANCE INDUSTRIES LTD 7.83%
BHARAT PETROLEUM CORPORATION LTD 0.45%
PHARMACEUTICALS 6.29%
SUN PHARMACEUTICALS INDUSTRIES LTD 2.31%
DR. REDDY'S LABORATORIES LTD 1.55%
LUPIN LTD 1.10%
CIPLA LTD 1.09%
RANBAXY LABORATORIES LTD 0.24%
Power 3.25%
NTPC LTD 1.47%
POWER GRID CORPORATION OF INDIA LTD 0.77%
TATA POWER COMPANY LTD 0.76%
RELIANCE INFRASTRUCTURE LTD 0.25%
Software 14.25%
INFOSYS LTD 7.83%
TATA CONSULTANCY SERVICES LTD 5.06%
HCL TECHNOLOGIES LTD 1.36%
Telecom - Services 2.22%
BHARTI AIRTEL LTD 2.22%
Equity Holdings Total 99.23%
Cash & Other Receivables
CBLO / REPO 1.42%
NET RECEIVALBES/(PAYABLES) -0.66%
Cash & Other Receivables 0.77%
Grand Total 100.00%
ASSET ALLOCATION
99.23%
0.77%

18.33%
16.42%
13.04%8.51%
7.80%
7.53%
6.30%
4.24%
4.04%
3.83%2.12%
1.99%
1.30% 1.27% 0.98%
0.65%
Minerals/Mining Industrial Capital Goods
Non - Ferrous Metals Ferrous Metals
Gas Power
Oil Telecom - Services
Finance Construction Project
Petroleum Products Pharmaceuticals
Consumer Non Durables Auto
Software Banks
SCHEME FEATURES
FUND MANAGER
NAV
EXPENSE RATIO :
ANNUAL PORTFOLIO TURNOVER RATIO :
RISK MEASURES
Scheme Type:
Launch Date: November 15, 2002
AUM as on 31/07/2013: INR 3.28 Cr
Load Structure:
Entry Load: Nil
Exit Load: 1% if exit within 1 month from the date of allotment of units (w.e.f. 15-07-13)
Benchmark: BSE Sensex
Minimum Investment: Rs. 2000/-
Name: Shri Nobutaka Kitajima
For all the plans and options
NAV as on July 31, 2013 Per Unit
Growth 34.1759
Dividend 12.0894
Direct Growth 34.2303
Direct Dividend 12.1270
1.70%
0.08 times
Tracking error 0.51%
Standard Deviation 1.44%
Sharpe Ratio 0.03
Portfolio Beta 0.85
Equity - Index
LIC NOMURA MF INDEX FUND - SENSEX ADVANTAGE PLAN
The main investment objective of the fund is to generate returns commensurate with the performance of the index either Nifty / Sensex based on the plans by investing in the respective index stocks subject to tracking errors.
INVESTMENT OBJECTIVE
PORTFOLIO
Company % of Nav
EQUITY HOLDINGS
Auto 8.51%
TATA MOTORS LTD 2.78%
MAHINDRA & MAHINDRA LTD 2.13%
BAJAJ AUTO LTD 1.54%
MARUTI SUZUKI INDIA LTD 1.05%
HERO MOTOCORP LTD 1.01%
Banks 16.42%
HDFC BANK LTD 5.99%
ICICI BANK LTD 5.30%
KOTAK MAHINDRA BANK LTD 2.85%
STATE BANK OF INDIA 2.28%
Construction Project 4.24%
LARSEN & TOUBRO LTD 3.56%
SADBHAV ENGINEERING LTD 0.68%
Consumer Non Durables 13.04%
ITC LTD 9.66%
HINDUSTAN UNILEVER LTD 3.38%
Ferrous Metals 1.27%
TATA STEEL LTD 0.81%
JINDAL STEEL & POWER LTD 0.46%
Finance 6.30%
HOUSING DEVELOPMENT FINANCE CORP LTD 6.30%
Gas 2.12%
PETRONET LNG LTD 1.28%
GAIL (INDIA) LTD 0.85%
Industrial Capital Goods 0.65%
BHARAT HEAVY ELECTRICALS LTD 0.65%
Minerals/Mining 0.98%
COAL INDIA LTD 0.98%
Non - Ferrous Metals 1.30%
HINDALCO INDUSTRIES LTD 0.67%
STERLITE INDUSTRIES ( INDIA ) LTD 0.63%
Oil 4.04%
OIL & NATURAL GAS CORPORATION LTD 3.05%
CAIRN INDIA LTD 0.99%
Petroleum Products 7.80%
RELIANCE INDUSTRIES LTD 7.80%
Pharmaceuticals 7.53%
LUPIN LTD 2.79%
SUN PHARMACEUTICALS INDUSTRIES LTD 2.38%
DR. REDDY'S LABORATORIES LTD 1.20%
CIPLA LTD 1.15%
Power 1.99%
NTPC LTD 1.18%
TATA POWER COMPANY LTD 0.81%
Software 18.33%
INFOSYS LTD 7.31%
TATA CONSULTANCY SERVICES LTD 5.56%
HCL TECHNOLOGIES LTD 4.11%
WIPRO LTD 1.35%
Telecom - Services 3.83%
BHARTI AIRTEL LTD 2.22%
IDEA CELLULAR LTD 1.60%
Equity Holdings Total 98.35%
Cash & Other Receivables
CBLO / REPO 3.77%
NET RECEIVALBES/(PAYABLES) -2.12%
Cash & Other Receivables 1.65%
Grand Total 100.00%
22 MUTUAL INTEREST August 2013,
DISCRETE 12 MONTHS RETRUNS
As on 28 June 2013
POINT TO POINT RETURNS
As on 28 June 2013
Lumpsum investment of 10,000 invested
Period Fund BSE Sensex Nifty
Last 1 Year
Last 2 Years 9,301 9,255 9,349
Last 3 Years 10,532 10,648 10,628
Since Inception 34,300 60,054 55,855
11,144 11,133 11,065
Since Inception12.82% 18.48% 17.67%
(CAGR)
Period Fund BSE Sensex Nifty
Jun 29, 2012 To Jun 28, 2013 11.44% 11.28% 10.67%
Jun 30, 2011 To Jun 29, 2012 -6.99% -7.51% -6.53%
Jun 30, 2010 To Jun 30, 2011 5.32% 6.47% 6.30%
PORTFOLIO ANALYSIS : SECTOR WISE
ASSET ALLOCATION
98.35%
1.65%

Consumer Non Durables
Industrial Capital Goods Gas
Transportation Power
Construction Project Oil
Banks Finance
Petroleum Products Telecom - Services
Minerals/Mining Industrial Products
Ferrous Metals Cement
21.13%
13.39%
10.00%
8.68%
8.30
%
8.25%
6.67%
6.21%
4.03%
3.73%3.11%
2.60%
1.75%1.01%
0.31%
SCHEME FEATURES
FUND MANAGER
NAV
EXPENSE RATIO :
ANNUAL PORTFOLIO TURNOVER RATIO :
RISK MEASURES
Scheme Type:
Launch Date: January 31, 2008
AUM as on 31/07/2013: INR 65.28 Cr
Load Structure:
Entry Load: Nil
Exit Load: 1% if exit within 1 year from the date of allotment of units
Benchmark: BSE 100
Minimum Investment: Rs. 2000/-
Shri Nobutaka Kitajima
Shri Sachin Relekar
For all the plans and options
NAV as on July 31, 2013 Per Unit
Growth 7.0674
Dividend 7.0673
Direct Growth 7.0851
Direct Dividend 7.0838
2.70%
0.35 times
Standard Deviation 1.65%
Sharpe Ratio -0.02
Portfolio Beta 0.83
Equity - Diversified
LIC NOMURA MF INFRASTRUCTURE FUND
PORTFOLIO ANALYSIS : SECTOR WISE
The investment objective of the scheme is to provide long term growth from a portfolio of equity / equity related instruments of companies engaged either directly or indirectly in the infrastructure sector.
INVESTMENT OBJECTIVE
PORTFOLIO
Company % of Nav
EQUITY HOLDINGS
Banks 21.13%
HDFC BANK LTD 8.68%
ICICI BANK LTD 7.35%
STATE BANK OF INDIA 5.10%
Cement 1.01%
ULTRATECH CEMENT LTD 1.01%
Construction Project 10.00%
LARSEN & TOUBRO LTD 8.37%
SADBHAV ENGINEERING LTD 1.63%
Consumer Non Durables 0.31%
ASIAN PAINTS LTD 0.31%
Ferrous Metals 1.75%
TATA STEEL LTD 1.75%
Finance 13.39%
HOUSING DEVELOPMENT FINANCE CORP LTD 9.21%
INFRASTRUCTURE DEV. FINANCE COMPANY LTD 2.85%
POWER FINANCE CORPORATION LTD 1.33%
Gas 2.60%
PETRONET LNG LTD 2.60%
Industrial Capital Goods 3.11%
CROMPTON GREAVES LTD 2.62%
THERMAX LTD 0.49%
23
Industrial Products 3.73%
SKF INDIA LTD 2.23%
CUMMINS INDIA LTD 1.01%
BHARAT FORGE LTD 0.49%
Minerals/Mining 4.03%
NMDC LTD 2.19%
GUJARAT MINERAL DEVELOPMENT CORP LTD 1.83%
Oil 8.68%
OIL & NATURAL GAS CORPORATION LTD 6.80%
CAIRN INDIA LTD 1.88%
Petroleum Products 8.30%
RELIANCE INDUSTRIES LTD 8.30%
Power 6.21%
NTPC LTD 4.03%
TATA POWER COMPANY LTD 2.18%
Telecom - Services 8.25%
IDEA CELLULAR LTD 4.25%
BHARTI AIRTEL LTD 4.01%
Transportation 6.67%
GUJARAT PIPAVAV PORT LTD 2.64%
CONTAINER CORPORATION OF INDIA LTD 2.34%
ADANI PORTS AND SPECIAL ECONOMIC ZONE LTD 1.69%
Equity Holdings Total 99.18%
Cash & Other Receivables
CBLO / REPO 1.09%
NET RECEIVALBES/(PAYABLES) -0.27%
Cash & Other Receivables 0.82%
Grand Total 100.00%
DISCRETE 12 MONTHS RETRUNS
As on 28 June 2013
POINT TO POINT RETURNS
As on 28 June 2013
Lumpsum investment of 10,000 invested
Period Fund BSE 100 Nifty
Last 1 Year
Last 2 Years 8,377 9,286 9,349
Last 3 Years 9,482 10,383 10,628
Since Inception 7,651 11,905 12,099
10,214 10,990 11,065
Since Inception-4.96% 3.37% 3.69%
(CAGR)
Period Fund BSE 100 Nifty
Jun 29, 2012 To Jun 28, 2013 2.14% 9.91% 10.67%
Jun 30, 2011 To Jun 29, 2012 -16.23% -7.16% -6.53%
Jun 30, 2010 To Jun 30, 2011 -5.18% 3.83% 6.30%
PORTFOLIO ANALYSIS : SECTOR WISE ASSET ALLOCATION
99.18%
0.82%

DIVIDEND HISTORY
DIVIDEND HISTORY OF LIC NOMURA MF LIQUID FUND
Frequency Record Date Face Value NAV Gross Dividend
Daily June, 2013 6.5723
July, 2013 6.1364
Daily Direct June, 2013 6.6566
July, 2013 6.2357
(Rs.) (Rs.) (Rs.)/unit
DIVIDEND HISTORY OF LIC NOMURA MF G-SEC FUND PF PLAN
Frequency Record Date Face Value (Rs.) Nav (Rs.) Gross Dividend (Rs.)/unit
Quarterly
June 26, 2013 10.0000 0.30
March 28, 2013 10.0000 1.00
DIVIDEND HISTORY OF LIC NOMURA MF BOND FUND
Frequency Record Date Face Value (Rs.) Nav (Rs.) Gross Dividend (Rs.)/unit
Quarterly March 28, 2013 10.0000 0.50
June 25, 2013 10.0000 0.30
Qtrly Direct June 25, 2013 10.0000 0.30
DIVIDEND HISTORY OF LIC NOMURA MF G-SEC FUND REG. PLAN
Frequency Record Date Face Value (Rs.) Nav (Rs.) Gross Dividend (Rs.)/unit
Quarterly March 28, 2013 10.0000 0.50
June 26, 2013 10.0000 0.25
Qtrly Dir June 25, 2013 10.0000 0.25
DIVIDEND HISTORY OF LIC NOMURA MF BALANCED FUND - DIVIDEND PLAN
Frequency Record Date Face Value (Rs.) Nav (Rs.) Gross Dividend (Rs.)/unit
Monthly ,
Monthly Dir March 28, 2013 10.0000 0.2500
March 28 2013 10.0000 0.2500
24 MUTUAL INTEREST 2013August,
DIVIDEND HISTORY OF LIC NOMURA MF FLOATER MIPFrequency Record Date Face Value (Rs.) Nav (Rs.) Gross Dividend (Rs.)/unit
Monthly May 22, 2013 10.0000 0.1000
June 25, 2013 10.0000 0.0500
July 24, 2013 10.0000 0.0500
Quarterly March 28, 2013 10.0000 0.3000
June 26, 2013 10.0000 0.2000
Qtrly Direct June 25, 2013 10.0000 0.2000
Yearly March 27, 2012 10.0000 10.5661 0.3000
March 28, 2013 10.0000 0.3000
Yearly Direct March 28, 2013 10.0000 0.3000
Fund Manager’s PerformanceFund Manager - Mr. Killol Pandya
Scheme Name 1-year Return
LIC Nomura MF Qtly-Inv-2-Reg(G) 8.6590
LIC Nomura MF Mthly-Inv-1-Reg(G) 8.5772
LIC Nomura MF Qtly-Inv-1-Reg(G) 8.4344
Scheme Name 1-year Return
LIC Nomura MF Income Plus(G) 7.3261
LIC Nomura MF FRF-STP(G) 7.3013
LIC Nomura MF Savings Plus(G) 7.2260
Top 3
Bottom 3
Fund Manager - Mr. Y. D. Prasanna
Scheme Name 1-year Return
LIC Nomura MF Annual-Inv-1-Reg(G) 7.1248
LIC Nomura MF Bond(G) 4.9755
LIC Nomura MF G-Sec-Reg(G) 4.2688
Scheme Performance
Fund Manager - Mr. Nobutaka Kitajima
Scheme Name 1-year Return
LIC Nomura MF Index Fund-Sensex plan(G) 12.7067
LIC Nomura MF Index Fund-Sensex Adv Plan(G) 11.9127
LIC Nomura MF Index Fund-Nifty Plan(G) 9.8587
Scheme Name 1-year Return
LIC Nomura MF Growth Fund(G) 7.6133
LIC Nomura MF Equity Fund(G) 5.0113
LIC Nomura MF Infra Fund(G) -4.6647
Top 3
Bottom 3
Fund Manager - Mr. Surendra Jalani
Scheme Name 1-year Return
LIC Nomura MF Balanced Fund(G) 11.3128
LIC Nomura MF ULIS 9.5469
LIC Nomura MF MIP(G) 8.7469
LIC Nomura MF Children(G) 8.6337
LIC Nomura MF Floater MIP(G) 6.7302
Top 3
Bottom 2
DIVIDEND HISTORY OF LIC NOMURA MF SAVINGS PLUS FUND
Frequency Record Date Face Value (Rs.) Nav (Rs.) Gross Dividend (Rs.)/unit
Daily June, 2013 0.0557
July, 2013 0.0296
Daily Direct June, 2013 0.0599
July, 2013 0.0313
Weekly June, 2013 0.0541
July, 2013 0.0260
Weekly Direct June, 2013 0.0583
July, 2013 0.0282
Monthly June, 2013 10.0000 0.0677
July, 2013
Monthly Direct June, 2013 10.0000 0.0732
July, 2013 10.0000 0.0025
DIVIDEND HISTORY OF LIC NOMURA MF FLOATING RATE FUND - STP
Frequency Record Date Face Value (Rs.) Nav (Rs.) Gross Dividend (Rs.)/unit
Daily June, 2013 0.0504
July, 2013 0.0537
Daily Direct June, 2013 0.0524
July, 2013 0.0560
Weekly June, 2013 0.0326
July, 2013 0.0385
Weekly Direct June, 2013 0.0364
July, 2013 0.0413
DIVIDEND HISTORY OF LIC NOMURA MF MONTHLY INCOME PLAN
Frequency Record Date Face Value Nav Gross Dividend (Rs.)/unit
Monthly July 24, 2013 10.0000 0.1000
Monthly Dir. July 24, 2013 10.0000 0.1000
Quarterly June 26, 2013 10.0000 0.1500
Quarterly Dir. June 25, 2013 10.0000 0.1500
Yearly June 14, 2011 10.0000 10.5401 0.3500
March 28, 2013 10.0000 0.5000
Yearly Direct March 28, 2013 10.0000 0.5000
(Rs.) (Rs.)
DIVIDEND HISTORY OF LIC NOMURA MF INCOME PLUS FUND
Frequency Record Date Face Value (Rs.) Nav (Rs.) Gross Dividend (Rs.)/unit
Daily June, 2013 0.0585
July, 2013 0.0306
Daily Direct June, 2013 0.0608
July, 2013 0.0320
Weekly June, 2013 0.0554
July, 2013 0.0282
Weekly Direct June, 2013 0.0577
July, 2013 0.0294
Monthly June, 2013 0.0692
July, 2013
Monthly Direct June, 2013 0.0720
July, 2013 0.0007

GLOSSARY OF TERMS :
Sharpe Ratio: Sharpe Ratio is a measure of the excess return (or Risk Premium) per unit of risk in an investment asset. It is the average return minus the risk-free return divided by the standard deviation of return on an investment.
Tracking error: Tracking error is a measure of how closely a portfolio follows the index to which it is benchmarked. The most common measure is the root-mean-square of the difference between the portfolio and index returns.
Volatility: Volatility is a measure for variation of price of a financial instrument over time. It is a representation of the risk associated with price-fluctuations of a given asset or the risk of a portfolio of assets.
Portfolio Beta: Beta of a portfolio is a number describing the relation of its returns with those of the financial market as a whole. It is a measure of systematic risk.
R-Squared: It describes the fraction of investment risk in a portfolio that can be associated with market or systematic risk
Average maturity: The average maturity of a portfolio equals weighted average of maturities for all instruments in the portfolio.
Duration: Duration measures price sensitivity of the portfolio to changes in the yield.
Systematic Investment PlanBig happiness comes in small investments with
4th Floor, Industrial Assurance Bldg., Opp. Churchgate Station, Mumbai - 400 020. Tel.: 022 - 22851661
Mutual Fund investments are subject to market risks, read all scheme related documents carefully.

Investment Manager:
LIC NOMURA MUTUAL FUND ASSET MANAGEMENT COMPANY LIMITED
AREA OFFICES
BUSINESS CENTRE
Pri
nte
d a
t:
Pri
nta
nia
Offse
t P
vt.
Ltd
.
PLACE ADDRESS LANDLINE MOBILE
AHMEDABAD Jeevan Sadan, 3rd Flr, LIC Bldg, Opp. Capital Commercial Center, AHMEDABAD - 380006. 079-26588301 9375090006 / 9924403147 / 9328638838
BANGALORE No.4, Canara Mutual Building (Opp. Cash Pharmacy), 2nd Floor, Residency Rd, BANGALORE-560025. 080-22210180 / 22118478 9845172957 / 9972092957 / 9986500721 / 9880058223 /
9902088717 / 9844750711 / 9482081121
BHUBANESHWAR SCR-B/19, Indradhanu Market, IRC Village, BHUBANESHWAR-751015. 0674-2554094 9437569719
CHENNAI 15, Anna Salai, Next to V.G.P. Bldg., CHENNAI - 600002. 044-28411984 / 28555883 9382315850 / 9500038285 / 9361555562
DEHRADUN 110, Tagore Villa, Chakrata Road, DEHRADUN - 248 001 0135 - 2650749 9412965570 / 9410702598 / 8410010025 / 9897056231
ERNAKULAM 11th Floor, Jeevan Prakash, M.G. Road, Ernakulam, KOCHI - 682011 0484-2367643 9895036554 / 9745612888 / 9388755722
GOA T 9/10, 3rd floor, Alfran Plaza, Opp. Don Bosco High School, M. G. Road, Panaji, GOA-403001. 0832-2420561 8600107698 / 9890711551 / 9370643076 / 9763129289
GUWAHATI LIC of India, Jeevan Deep Building, M. L. Nehru Road, Panbazar, GUWAHATI -781 001 0361 - 2735323 9435769432
HUBLI 2nd Floor, LIC Bldg., Beside HPO, Lamington Road, HUBLI - 580020. 0836 - 4260523 / 4262092 980058223 / 9845205168
HYDERABAD House No. 5-9-57, 4th Floor, Jeevan Jyoti Building, Basheerbagh, HYDERABAD - 500029. 040-23244445 / 23210572 8897656665 / 9000444850 / 9000550850
INDORE U.V. House, 1st Floor, Snehil 9/1-A South Tukoganj, INDORE - 452001. 0731-2520262 / 4069162 9589050250 / 8827344195 / 9981511435
JAIPUR 327 - A, 3rd floor, Ganpati Plaza, M. I. Road, JAIPUR - 1. 0141-5112620 9461658875 / 9829098323 / 9929095005
KANPUR Jeevan Vikas, Ground Floor, 16/98, M.G. Road, KANPUR - 208001. 0512-2360240 / 3244949 7275430214 / 9451448305 / 9984006600 / 9838038440 /
9389052340 / 9889085736
KOLKATA Ground Floor, Hindustan Building Annexe, 4, Chittaranjan Avenue, KOLKATA - 700072. 033-22129455 / 22128680 9474424374 / 9932877925 / 9432391810 / 9339531895 /
9830689965 / 9903495703 / 9051068127
LUCKNOW 7th Floor, Jeevan Bhavan 2, Naval Kishore Road, Hazrat Ganj, LUCKNOW - 226 001 0522-2231186 / 4045203 9651534267 / 8858235350 / 9455060457
LUDHIANA Rm No. 102-103, 1st Fl, S.C.O. 18, Opp. Stock Exch., Feroze Gandhi Mkt, LUDHIANA-141 001. 0161 - 2405805 9888111190 / 9915099333 / 9914720500
MADURAI 2nd Floor, LIC Bldg., Door No. 3, West Marret Street, MADURAI - 625 001 0452 - 2345700 9094687733
MANGALORE No. 6, Gr. Floor, Popular Building, K S Rao Road, MANAGALORE - 575 001 0824 - 2411482 9845190466 / 9742726012
MUMBAI Gr. Floor, Industrial Assurance Bldg., Opp. Churchgate Station, MUMBAI - 400020. 022-22885971 / 22817162 / 63 9930718555 / 9325523480 / 9769028905 / 9820137844 /
9930957772 / 9820469996
NAGPUR Jeevan Seva Bldg., Mount Road, Sadar, NAGPUR - 440 001. 0712 - 2542497 9422113800 / 9021426397 / 9011412206 / 9373539939 /
9422104130 / 9423406727 / 9860207510
NASHIK Shop No.2, Ground Floor, Rajvee Enclave, New Pandit Colony, NASHIK - 422002. 0253-2579507 9922996155 / 9823366379 / 9595075700
NEW DELHI 7th Floor, Jeevan Prakash, 25 K.G. Marg, NEW DELHI - 110001. 011-64663650/ 9811464244 / 9818610867 / 9818630124 / 9811464244 /
23359190 / 23314396 9891736008 / 9971672830 / 9717765151 / 7838637303 /
9891785037 / 9818280698
PATNA Ground floor, Jeevan Jyothi Bldg. Exhibition Road, PATNA - 800001. 0612-2501157 9431447848 / 9431023274 / 9507151965
PUNE LIC of India, Pune D.O.-I,6/7, Shivaji Nagar,University Road, PUNE - 411 005 020 - 25537301 9423447604 / 9767868611
RAIPUR C-29/A, Sector 1, Besides City Centre Mall, Devendra Nagar, RAIPUR - 492001 C.G. 0771-2236780/4051137 9425026437 / 9329100009
RAJKOT 703, Star Chamber, Harihar Chowk, RAJKOT - 360 001. 0281 - 2230626 8690444022 / 9898733233
RANCHI Narsaria Tower, 2nd Floor, Opp. Lalpur Police Station, Post Lalpur, RANCHI -834001. 0651-2206372 8986771069 / 9835197681 / 9835708803
AGRA : 9927888854AHMEDNAGAR : 9422238925AJMER : 9829077674AKOLA : 9422862120ALAPUZHA : 9447367160ALLAHABAD : 9918971258AMRAVATI : 9923025535 /
8657045588AMRITSAR : 9814299747AURANGABAD : 9923797207BANKURA : 9378330300BEHRAMPORE : 9861546580BELGAUM : 9916140315BELLARY : 9900026952BILASPUR : 9302606248BHAGALPUR : 9431609765BHILAI : 9303808855BHILWARA : 9829287273BHOPAL : 9302441980BHUJ : 9377713665
Mobile No.Name of Place Mobile No.Name of Place Mobile No.Name of Place Mobile No.Name of PlaceMobile No.Name of Place
BIKANER : 9829791132BOKARO : 9955189443BURDWAN : 9831712244CHANDIGARH : 9316065681
9817232224CHANDRAPUR : 9422180081COIMBATORE : 0422-4393989DALTONGANJ : 9162780200DAVANGERE : 9900026952DEOGHAR : 9430155378DHANBAD : 9835334495FAIZABAD : 9935448800GAYA : 9470854005GONDIA : 9890435020GORAKHPUR : 9336833448GULBARGA : 9900144196GURGAON : 9654228220/
9555542768GWALIOR : 9406586454HALDWANI : 9839976747
HASSAN : 9986125091JABALPUR : 9407606313JAGDALPUR : 9303354452JALGAON : 9422211343JAMMU : 9419213201JAMSHEDPUR : 9234620669JHANSI : 9760016559JODHPUR : 9829947974KARIMNAGAR : 9000444853KARWAR : 9611111028KHARAGPUR : 9531509342KOLHAPUR : 9822851948KOTA : 9829905879KOTTAYAM : 9656010033KOZHIKODE : 9349739890MADIKERI : 9742707041MALDA : 9832635563MEERUT : 9319267811MEHSANA : 9979533536MORADABAD : 9454993170
MYSORE : 9986117183MUZAFFARPUR : 9431813155NANDED : 9822203503 /
9890691021NELLORE : 9000444854NOIDA : 0120-2544423PANIPAT : 0180-2648709PONDHICHERRY : 7708007363RAJAHMUNDRY : 9000171857SAHARANPUR : 9896455020SALEM : 9944744424SAMBALPUR : 9937040031SATARA : 9423192029SATNA : 9300757593SHAHDOL : 9303822916SHILLONG : 8575020727
8721942675SHIMLA : 9318960005SHIMOGA : 9902007686
08182-228386
SURAT : 99788626269925027406
SILIGURI : 98830967679641022228
THANE : 9702882224THRISSUR : 9388110220TIRUNELVELI : 9655505105TRICHY : 9842524130TRIVANDRUM : 9388088066UDAIPUR : 9784011432UDUPI : 9742726012VADODARA : 9327494916VAPI : 9377566652VARANASI : 9336501004VISHAKHAPATNAM : 9000444851VIJAYWADA : 9000444856WARANGAL : 9000171858YAVATAMAL : 9503736144
Mutual Fund investments are subject to market risks, read all scheme related documents carefully.
V i s i t u s a t w w w . l i c n o m u r a m f . c o m l T o l l F r e e N o . 1 8 0 0 2 5 8 5 6 7 8
4th Floor, Industrial Assurance Bldg., Opp. Churchgate Station, Mumbai 400 020. Tel. : 22851661Fax : 22880633 E-mail: [email protected]