licensing versus direct investment: implications for ...people.tamu.edu/~aglass/ldijie.pdf ·...
TRANSCRIPT

Journal of International Economics 56 (2002) 131–153www.elsevier.com/ locate /econbase
Licensing versus direct investment: implications foreconomic growth
a , bAmy Jocelyn Glass *, Kamal SaggiaDepartment of Economics, Ohio State University, Columbus, OH 43210, USA
bDepartment of Economics, Southern Methodist University, Dallas, TX 75275, USA
Abstract
We develop a symmetric two country model of foreign direct investment (FDI) thatcaptures the internalization decision and its implications for both the rate and magnitude ofinnovations. When mode choice (licensing versus FDI) is fixed, a subsidy to multinationalproduction increases the rate but decreases the size of innovations. When mode can switch,the rate and size of innovations both increase, provided the subsidy is not too large.Although innovation size decreases for industries where firms already were choosing FDI,innovation size increases for industries where firms switch from licensing to FDI becausemultinationals choose larger innovations than licensors. 2002 Elsevier Science B.V. Allrights reserved.
Keywords: Innovation; Licensing; Foreign direct investment; Multinational firms
JEL classification: F21; F43; O31; O34
1. Introduction
For several decades, foreign direct investment (FDI) flows have been growingmuch faster than world trade, and worldwide sales of foreign affiliates ofmultinationals now exceed exports (UNCTAD, 1997). Part of this expansion inFDI can be attributed to the policy shift of many governments toward attractingFDI or restricting it less. Between 1991 and 1998, some 58 countries began to take
*Corresponding author. Tel.: 11-614-292-1149; fax: 11-614-292-3906.E-mail address: [email protected] (A. J. Glass).
0022-1996/02/$ – see front matter 2002 Elsevier Science B.V. All rights reserved.PI I : S0022-1996( 01 )00106-4

132 A. J. Glass, K. Saggi / Journal of International Economics 56 (2002) 131 –153
a proactive approach toward attracting FDI, roughly doubling the number of suchcountries from 60 to 118 (Moran, 1998).
Despite the growing importance of FDI and the increased desire of manycountries to attract FDI, the consequences of FDI for economic growth havereceived scant attention in the theoretical literature – a void noted by Grossmanand Helpman (1995). Empirical evidence on the effects of FDI on growth doessuggest that, on balance, FDI has a positive impact on growth: recent studiesinclude Borensztein et al. (1998) and Balasubramanyam et al. (1996).
Almost all existing theories of FDI and licensing have been developed in either1static or partial equilibrium models. A few dynamic general equilibrium models
do explore the effect of FDI on growth but these models have ignored the2possibility of licensing. This omission is significant: as Ethier (1986) notes, the
study of FDI must be foremost a study of internalization – the decision to keepactivities within the firm. Historically (and even today), some countries have notallowed foreign firms to choose their mode of supply, preferring technology
3licensing (or joint ventures) over fully owned subsidiaries of foreign firms. Howdo such policy interventions affect economic growth?
We build a symmetric two 2 country model of FDI that captures the internaliza-tion decision and its implications for both the rate and magnitude of innovation.We examine how policy interventions (taxes or subsidies to FDI) that alter the
4incentive to internalize production within the firm affect economic growth. To ourknowledge, ours is the first work to analyze these issues in a setting where firms
5can choose between FDI and licensing. We find that the ability of firms to switchmodes from licensing to FDI in response to policy changes is vital for ensuring
6that a subsidy to FDI leads to faster economic growth.Markusen (1995) provides several stylized facts about FDI that are central to
our model. First, FDI is mostly horizontal, where multinationals create local
1See Markusen (1984, 1989); Ethier (1986); Horstmann and Markusen (1987, 1992, 1996); Saggi(1996, 1999); Markusen and Venables (1998); Wright (1993) and Vishwasrao (1994).
2 ¨See Wang and Blomstrom (1992); Helpman (1993); Walz (1997); Glass and Saggi (1998, 1999),and Petit and Sanna-Randaccio (2000). The main exception is Ethier and Markusen (1996) but theirfocus is on mode choice rather than innovation.
3Licensing can also be interpreted as a joint venture between a local firm and a foreign firm. Thecrucial distinction is that, unlike FDI, arms length arrangements such as licensing force foreign firms toshare rents with local firms.
4In our model, a subsidy to FDI can also be interpreted as a decline in the cost disadvantage sufferedby multinationals due to some other factors such as improvements in communications technology thatfacilitate coordination across countries.
5Horstmann and Markusen (1992) consider shifts in the mode firms choose of serving marketsabroad, but in a setting without growth. Aghion and Howitt (1990) determine the innovationmagnitude, but in a model without FDI or licensing.
6Our model also shares a feature similar to the inefficient entry in Horstmann and Markusen (1986):parameter changes that lead to more FDI do so by drawing in (from licensing) firms with higherproduction costs than existing multinationals.
A. J. Glass, K. Saggi / Journal of International Economics 56 (2002) 131 –153 133
production facilities within each country or region. Second, multinationals havesubstantial intangible assets and arise in industries with large R&D expendituresrelative to sales – see also Brainard (1997) and Caves (1996). Third, multination-als suffer cost disadvantages relative to their local rivals due to operating inunfamiliar environments or logistical difficulties of coordination.
As Davies (1977) noted, foreign firms typically suffer a cost disadvantagerelative to local firms due to lack of familiarity with local conditions. As a result,local firms will enjoy greater present value in a given project than foreign firms aslong as they employ the same technology. If a foreign firm with a superiortechnology could appropriate the entire rent using technology licensing, it wouldalways prefer licensing to FDI. However, empirical evidence indicates that, onaverage, licensors can appropriate less than half of the surplus associated with thelicense transaction (Caves, 1996; Caves et al., 1983). This aspect of technologylicensing serves as an important assumption in our analysis.
Since our interest is in aggregate implications, we abstract from the details of7why licensors are forced to share rents. We assume that the share of rents captured
by licensees is the same in the two countries. If rent sharing is primarily due toinformation asymmetries, then roughly the same rent shares should applyeverywhere. Legal systems and protection of intellectual property rights may alsoaffect the share of rents that licensees retain – see Markusen (2001); Vishwasrao(1994) and Yang and Maskus (2001) for models that capture such effects.
Our model is based on the familiar ownership, location and internalization(OLI) paradigm where exports, licensing, or multinational production can arise asthe chosen method of serving markets abroad. In our model, ownership advantageresults from investments in innovation. There is a continuum of industries andfirms may attempt to improve the product in any industry – they pick aninnovation intensity and an innovation size as well as which industry to target withtheir innovation.
Once a firm is successful in innovation, it chooses its market mode: whether toserve the market abroad by establishing a local production subsidiary or bylicensing its technology to a local firm (a location advantage such as transportationcosts rules out exports). Our model uses two parameters to capture the tradeoffbetween incomplete extraction of rents as a licensor and greater costs as amultinational. An increase in the share of profits retained by licensees or adecrease in the cost disadvantage suffered by multinationals strengthen theincentives for internalization, thus making FDI more attractive relative tolicensing.
While our primary interest is in understanding how adjustments in the marketmode between licensing and multinational production contribute to changes in thespeed and size of innovation, we begin with a base case where the mode and size
7See Gallini and Wright (1990); Rockett (1990); Horstmann and Markusen (1987, 1996) and Wright(1993) for models generating this outcome based on informational considerations.

134 A. J. Glass, K. Saggi / Journal of International Economics 56 (2002) 131 –153
of innovations are fixed. In this benchmark, a decrease in licensee profit retentionor in the cost disadvantage of multinationals increases the rate of innovation.
Next, we examine how internalization advantage affects the size and speed ofinnovation when firms can choose their modes of serving markets abroad. Weassume that industries inherently differ with respect to their multinational costdisadvantage because technologies in some industries are harder to adapt todifferent economic environments or to coordinate across geographically separatedlocations. As a consequence, some industries serve markets abroad throughmultinational production while others choose licensing. In this general model, asubsidy to multinational production causes multinationals to reduce the magnitudeof their innovations by reducing their need to generate ownership advantage.
However, the subsidy also makes FDI more attractive relative to licensingthereby increasing the extent of FDI, the fraction of all industries that choose toserve markets abroad through multinational production. Since multinationalschoose larger innovations than firms that license their technologies, firmsswitching from licensing to FDI raise the magnitude of their innovations. Providedthe subsidy is not too large, the average innovation magnitude (across bothmultinationals and licensors) rises. Thus, host country policies that attract FDIthrough financial incentives increase both the rate and average magnitude ofinnovations, clearly increasing economic growth.
Mode switching also has the potential to alter the effect of licensee rentretention on economic growth. Policy, either directly or indirectly, can affect theallocation of rents between the licensor and the licensee. With mode fixed, anincrease in the licensee’s share of rents reduces the speed of innovations withoutaltering their size, so economic growth necessarily declines. However, when someindustries switch their mode from licensing to multinational production, theaverage innovation size increases due to multinationals choosing larger innova-tions than licensors. The larger size of innovations can dominate their less frequentoccurrence, leading to an increase in economic growth.
Section 2 establishes the behavior of firms. Section 3 characterizes how theparameters central to the internalization decision influence the rate of innovationfor the base case where innovation size and the mode of serving markets abroadare fixed. Section 4 examines the effect of internalization advantage on themagnitude as well as the rate of innovation when firms may switch market modesbetween FDI and licensing and contrasts these findings with the base case. Section5 concludes. All proofs appear in Appendix A.
2. Dynamic OLI model
We build a dynamic OLI model based on the quality ladders model ofinnovation by Grossman and Helpman (1991a,b), but with two symmetricinnovating countries. Assuming symmetric countries greatly simplifies our analysis

A. J. Glass, K. Saggi / Journal of International Economics 56 (2002) 131 –153 135
and may not be too far from reality for similarly developed countries. Our modelformalizes the view that ownership, location and internalization advantages dictatewhether firms serve markets abroad through export, FDI (establishing a productionsubsidiary abroad), or licensing their technology to local firms.
Ownership advantage refers to some aspect, such as a unique product design,8that a firm does better than others. Location advantage refers to some aspect, such
as tariffs or transportation costs, that makes producing in the same location asconsumption preferable to producing in one place and shipping to whereverdemand is located. Internalization advantage refers to some aspect, such asincomplete contracts, that makes keeping transactions within the firm preferable to
9arms-length transactions between firms.We are primarily interested in FDI and licensing, so we assume that tariffs or
transportation costs are sufficiently high that FDI and licensing are the onlyrelevant options remaining for serving markets abroad. Initially, we assume that anexogenous fraction h of all industries use multinational production to servemarkets abroad, while the remaining 1 2h use licensing. We will refer to h as theextent of FDI and 1 2h as the extent of licensing. In this base case of exogenousinternalization, we explore how parameters that affect the profitability of licensingand FDI alter the rate of innovation. Later, we will allow the extent of FDI h andthe innovation magnitude l to vary, but for now they are fixed.
2.1. Product market
A continuum of products j [ 0,1 are each available in different quality levels.f gAssume consumers are willing to pay a premium l for a one-quality-levelimprovement in a product, where l is the innovation size or magnitude. Consumerpreferences giving rise to these properties are the same as in Grossman andHelpman (1991a,b) – details are provided in Appendix A. Let E be aggregateexpenditure, the amount consumers that spend on each product. Consumers live ineither the domestic or the foreign country. Of the total spending, E 5 f E is spentD D
by domestic consumers and E 5 f E is spent by foreign consumers, where theF F
expenditure shares sum to one f 1 f 5 1.D F
Normalize the unit labor requirement in production of any quality level of anyproduct to one in each country. Let the labor requirement in innovation be givenby a in both countries. Further, let L denote the total world labor supply so thateach country’s labor supply equals L /2. As a result, the countries have the samewage, and the expenditure shares both equal one-half f 5 f 5 1/2. Altogether,D F
these assumptions make the two countries exactly identical.Also, normalize the common wage to one. Thus, the marginal cost of producing
8See Horstmann and Markusen (1989) and Markusen (1984).9See Markusen (1995); Saggi (1996, 1999); Ethier and Markusen (1996) and Horstmann and
Markusen (1996).

136 A. J. Glass, K. Saggi / Journal of International Economics 56 (2002) 131 –153
one unit of output (of any quality) is 1 in either country. Assuming Bertrandbehavior, suppose in each industry, one firm can produce the highest quality level
10and another firm can produce the quality level one below. Firms maximize profitsby engaging in limit pricing. Each firm that invented the highest quality levelavailable of a product charges the highest price that keeps its rival (the firm able toproduce the next highest quality level of that product) out of the market.
Thus, prices will be p 5 l, a mark-up of the quality increment relative tomarginal costs. A rival could sell the lower quality level at no less than itsmarginal cost of one and make non-negative profits. Consumers view the higherquality level sold at price l to be equivalent to the lower quality level sold at aprice of one, so l is the limit price. With these prices, sales are x 5 Ed, wheredefine the inverse innovation magnitude as d ; 1/l. A firm’s instantaneous profittakes the form p 5 p 2 c x (where c is marginal cost), which depends on how thes dmarket abroad is served.
Let z . 0 be the cost disadvantage of multinationals operating abroad. AMmultinational has marginal cost c 5 1 1 z /2 and thus earns instantaneous profits.
zM ]F S D Gp 5 E 1 2 1 1 d (1)2
The downside of FDI is the additional costs z of operating in an unfamiliar11location.
While multinationals face a cost disadvantage, licensors do not capture the fullrents created by an ownership advantage. Let u . 0 be the fraction of profitscollected by licensees, with the remaining 1 2u collected by the licensor. A
Llicensor has marginal cost c 5 1 and thus earns instantaneous profits.
uL ]S Dp 5 E 1 2 d 1 2 (2)s d 2
The two countries have the same u and z to keep them symmetric. We do notpermit u to be a function of the innovation size l because we will develop analternative explanation of why larger innovations are kept within the firm; we willshow that multinationals develop larger innovations than licensors.
2.2. Ownership advantage through innovation
Firms must have some ownership advantage to offset the difficulty of servingforeign markets. Ownership advantage here takes the form of the uniqueknowledge of how to produce a higher quality level of a product relative to anyother firm.
Innovation resembles a lottery: costs are born up front with an uncertain payoff.
10A description of the innovation process yielding these properties follows in Section 2.2.11A subsidy to multinational production is a reduction in multinational cost disadvantage.

A. J. Glass, K. Saggi / Journal of International Economics 56 (2002) 131 –153 137
The innovation process is the same as in Grossman and Helpman (1991a,b).Assume innovation races occur simultaneously for all products, with all firms able
12to attempt to invent the quality level above the current highest quality level.kFurther assume undertaking innovation intensity i for a time interval dt requires
k kai dt units of labor and leads to success with probability i dt, where k [ M,Lh jdenotes industries whose market mode is multinational production or licensing.Since price competition yields no profits when firms have the same technology, noquality level is ever invented twice.
Each non-producing firm chooses its intensity of innovation to maximize its13expected value, given the innovation intensities of other firms. To generate finite
rates of innovation, expected gains must not exceed their cost, with equality wheninnovation occurs with positive intensity
k k kv # a, i . 0 ⇔ v 5 a, (3)
kwhere v is the value a firm gains from successful innovation if it serves themarket abroad using mode k. This reward to innovation is the discounted stream ofprofits from production. We focus on equilibria with positive innovation intensitiesfor both modes: innovation targets industries that serve markets abroad throughmultinational production as well as those that use licensing.
All producing firms are exposed to further innovation that ultimately ends thestream of profits earned from an innovation. Firms that successfully innovate earnthe reward
kpk ]]v 5 , (4)k
r 1 i
kwhere p denotes instantaneous profits defined in Eqs. (1) and (2), r the discountkrate, and i the innovation intensity targeting industries that engage in market
mode k.The aggregate (or average) rate of innovation i is the extent of FDI h times the
Minnovation intensity targeting industries that engage in multinational production i
plus the extent of licensing 1 2h times the innovation intensity targeting industriesLthat engage in licensing i .
M Li ;hi 1 1 2h i (5)s d
Once we characterize the labor constraints, we can describe the general equilib-rium in the next section.
12See also Segerstrom (1991); Segerstrom et al. (1990); and Taylor (1993).13Innovation is done by followers – see Grossman and Helpman (1991b).

138 A. J. Glass, K. Saggi / Journal of International Economics 56 (2002) 131 –153
3. Rate of innovation for the base case
Initially, we assume that the innovation magnitude l and the extent of FDI h are14exogenous. To hold mode fixed, we assume that the fraction h of industries
engage in multinational production, while the others engage in licensing. Wedetermine the equilibrium aggregate expenditure E and rate of innovation i, aswell the composition of innovation between targeting industries that conduct FDIand those that conduct licensing.
3.1. Labor constraint
By the assumed symmetry, each country performs half of the world’s innova-tion, does half of the world’s spending and provides half of the world’s laborforce. Each country’s labor constraint is therefore equivalent to the world labor
M Lconstraint. In the world, ai 5 afhi 1 1 2h i g units of labor are needed fors dinnovation, and x 5 Ed units of labor are needed for production. The world laborconstraint requires world labor demand for innovation and production to equal theworld labor supply.
M Lafhi 1 1 2h i g 1 Ed 5 L (6)s d
The labor constraints, together with innovation conditions for multinationals andlicensors derived next, provide the three key equations in our model, which will
M Ldetermine the variables i , i , and E.
3.2. Innovation conditions
In industries that conduct FDI, the valuation condition for firms is given by Eq.(3). Substituting the producing firm valuation Eq. (4) and multinational profits Eq.(1) into Eq. (3) yields the valuation condition for multinationals.
z M]F S D GE 1 2 1 1 d 5 asr 1 i d (7)2
Decreases in multinational cost disadvantage z increase profits and thus the rewardto innovation.
Substituting the producing firm valuation Eq. (4) and licensor profits Eq. (2)into Eq. (3) yields the valuation condition for licensors.
u L]S DE 1 2 1 2 d 5 asr 1 i d (8)s d2
14The proof of Proposition 1 allows the exogenous innovation magnitude for multinationals toexceed that for licensors, for later use.
A. J. Glass, K. Saggi / Journal of International Economics 56 (2002) 131 –153 139
Decreases in licensee profit retention u also increase profits and thus the reward toinnovation.
3.3. Solution
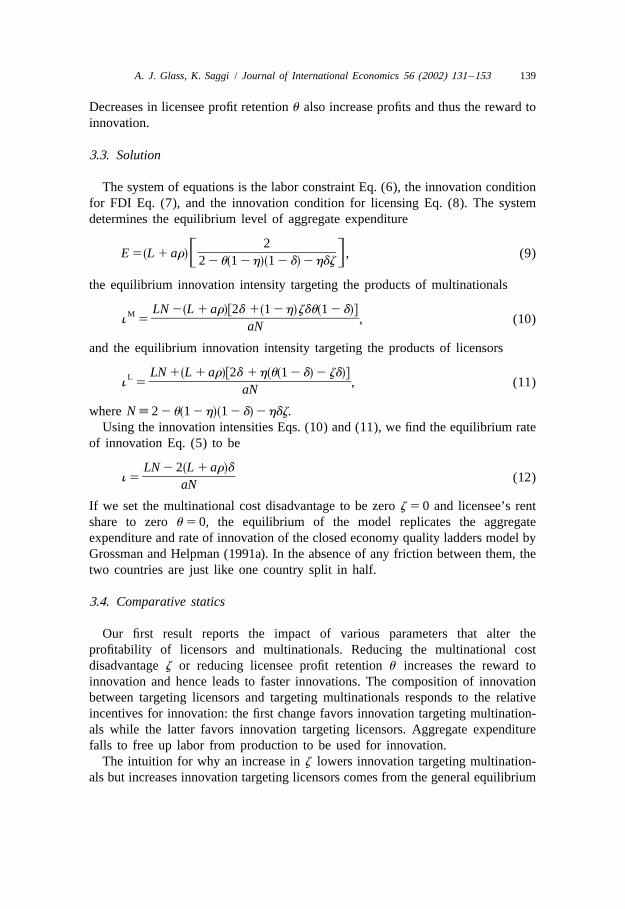
The system of equations is the labor constraint Eq. (6), the innovation conditionfor FDI Eq. (7), and the innovation condition for licensing Eq. (8). The systemdetermines the equilibrium level of aggregate expenditure
2]]]]]]]E 5 L 1 ar , (9)s dF G2 2u 1 2h 1 2 d 2hdzs ds d
the equilibrium innovation intensity targeting the products of multinationals
LN 2 L 1 ar 2d 1 1 2h zdu 1 2 ds df s d s dgM ]]]]]]]]]]]i 5 , (10)aN
and the equilibrium innovation intensity targeting the products of licensors
LN 1 L 1 ar 2d 1h u 1 2 d 2 zds df s s d dgL ]]]]]]]]]]]i 5 , (11)aN
where N ; 2 2u 1 2h 1 2 d 2hdz.s ds dUsing the innovation intensities Eqs. (10) and (11), we find the equilibrium rate
of innovation Eq. (5) to be
LN 2 2 L 1 ar ds d]]]]]i 5 (12)aN
If we set the multinational cost disadvantage to be zero z 5 0 and licensee’s rentshare to zero u 5 0, the equilibrium of the model replicates the aggregateexpenditure and rate of innovation of the closed economy quality ladders model byGrossman and Helpman (1991a). In the absence of any friction between them, thetwo countries are just like one country split in half.
3.4. Comparative statics
Our first result reports the impact of various parameters that alter theprofitability of licensors and multinationals. Reducing the multinational costdisadvantage z or reducing licensee profit retention u increases the reward toinnovation and hence leads to faster innovations. The composition of innovationbetween targeting licensors and targeting multinationals responds to the relativeincentives for innovation: the first change favors innovation targeting multination-als while the latter favors innovation targeting licensors. Aggregate expenditurefalls to free up labor from production to be used for innovation.
The intuition for why an increase in z lowers innovation targeting multination-als but increases innovation targeting licensors comes from the general equilibrium

140 A. J. Glass, K. Saggi / Journal of International Economics 56 (2002) 131 –153
nature of our model. An increase in z makes multinationals less attractivecandidates as innovation targets so that resources shift into innovation targetinglicensors. Alternatively, for both licensing and FDI to occur in equilibrium bothlicensors and multinationals must earn the same rate of return: if multinationalsbecome less profitable, they must face a lower risk of being innovated over relativeto licensors. Of course, innovators face reduced profitability overall when eithermode becomes less desirable (due to an increase in u or z ) so that the aggregaterate of innovation must fall.
Proposition 1. (Fixed mode and innovation size) A decrease in the costdisadvantage of multinationals z increases the aggregate rate of innovation andthe innovation intensity targeting multinationals, while decreasing the innovationintensity targeting licensors and aggregate expenditure. Similarly, an increase inthe share of profits retained by licensees u decreases the aggregate rate ofinnovation, increases aggregate expenditure, and also shifts innovation towardtargeting multinationals and away from targeting licensors.
Empirical evidence supports this result. A survey by Mansfield et al. (1979)found that large US companies drew 29 to 34% of the returns from their R&Dprojects from foreign markets. Furthermore, the firms indicated that if they were tocollect no returns from abroad, they would reduce their R&D anywhere from 16 to26%, and if they were forced to use other methods than foreign subsidiaries, theywould reduce their R&D anywhere from 12 to 15%.
4. Endogenous mode and innovation size
Now we allow the multinational cost disadvantage z to vary across industriesand examine how the extent of FDI as well as the magnitude of innovationschosen by multinationals responds to incentives to FDI. Then we describe how theinnovation conditions and resource constraint can accommodate this general caseand show that the effects on the rate of innovation resemble those for the basecase.
4.1. Mode choice
Now suppose the continuum of industries differ in the degree of costdisadvantage suffered by multinationals. Industries may differ in the difficulties ofcoordinating decisions over considerable distances; also, the technology involvedin some industries may be less perfectly adaptable to different economicenvironments. For simplicity, assume the multinational cost disadvantage is
]uniformly distributed z j [ z,z .s d f g
]A firm serves the market abroad through multinational production rather thanlicensing if its profits as a multinational Eq. (1) exceed those as a licensor Eq. (2).

A. J. Glass, K. Saggi / Journal of International Economics 56 (2002) 131 –153 141
This condition holds if licensee profit retention is larger than the reduction inprofits due to the multinational cost disadvantage.
z˜ ˜]]u . u ; ⇔ z , z ;u l 2 1 (13)s dl 2 1
The measure of industries conducting FDI is the extent of FDI
z̃ 2z]]]h 5 , (14)]
z 2z]
15with the remaining 1 2h conducting licensing. We focus on parameters such that]˜0 ,h , 1 so that both FDI and licensing occur (for different industries): z , z ,z.
]˜Fig. 1 depicts the maximum licensee profit retention u that leads to licensing fora range of multinational cost disadvantages z, given the innovation magnitude l.The boundary (13) is an upward-sloping line through the origin with slope1/ l 2 1 : above the line, FDI arises and below it licensing. Drawing a horizontals dline to represent a given level of licensee profit retention u, the intersection with
˜the boundary line (13) indicates the threshold z for that value of u. Industries with˜a low value of multinational cost disadvantage z # z choose multinational
˜production, while those with high values z . z choose licensing.
Fig. 1. Licensing versus direct investment decision.
15If FDI dominates licensing based on the innovation size chosen under licensing, then FDI will alsodominate for any larger l. Hence the expression for h is a lower bound when l can be chosen.

142 A. J. Glass, K. Saggi / Journal of International Economics 56 (2002) 131 –153
4.2. Innovation size for multinationals versus licensors
Following the technique of Aghion and Howitt (1990) and Grossman andHelpman (1991a), suppose the resource requirement in innovation a l depends ons dthe magnitude of the innovation attempted. We assume that the resource require-ment in innovation increases with the size of the quality improvement a9 l . 0 ats dan increasing rate a0 l . 0.s d
The optimal quality increment equates the increase in the value of theinnovation with the increase in the cost of the innovation.
v9 l 5 a9 l (15)s d s d
Multiply each side of Eq. (15) by l and, using the equilibrium condition (3),divide each side by v and a, respectively.
lv9 l la9 ls d s d]] ]]5 (16)v l a ls d s d
The left-hand side is the elasticity of the reward to innovation with respect to themagnitude of the innovation attempted, which depends on how a firm serves themarket abroad. The right-hand side is the elasticity of the resource requirement ininnovation with respect to the magnitude of the innovation attempted.
M M L LCalculate ≠v /≠l and similarly ≠v /≠l and then multiply each by theM Lquality increment divided by the reward to innovation l /v or l /v to find the
condition for determining the quality increment for multinationals
1 1 z /2 la9 ls d]]]] ]]5 (17)l 2 1 2 z /2 a ls d
and for licensors
1 la9 ls d]] ]]5 . (18)l 2 1 a ls d
The condition for licensors is identical to the condition found by Grossman andHelpman (1991a) in their single country model.
The profits dissipated by the licensee act like a tax on profits earned in theforeign market: licensee profit retention does not distort the quality level chosen by
16a licensor. In contrast, for any z . 0, the quality increment chosen by aM Lmultinational exceeds the quality increment chosen by a licensor: l . l .
Multinationals choose larger innovations because larger innovations shrink theimportance of their cost disadvantage and because they collect the entire increasein profits that results from an improvement in the quality of their products. If
16If u were to increase in l, the quality increment under licensing would be depressed: this propertywould reinforce our result that multinationals choose larger innovations than licensors. An increase inprofit taxes abroad would act like an increase in u.

A. J. Glass, K. Saggi / Journal of International Economics 56 (2002) 131 –153 143
Llicensing will occur, firms pick the innovation magnitude l . If multinationalMproduction will occur, firms picks an innovation magnitude l z that increases ins d
Mthe multinational cost disadvantage ≠l /≠z . 0.Fig. 2 illustrates the equilibrium quality increments chosen by multinationals
and licensors. The upward-sloping curve A represents the increase in cost la9 /a,while the downward sloping curves L and M represent the increase in rewardlv9 /v for licensors and multinationals. The M curve lies above the L curve
Lprovided z . 0. Licensors choose quality increment l while multinationalsM Lchoose l . l . The larger the cost disadvantage faced by multinationals, the
larger the magnitude of ownership advantage they create through innovation.When the multinational cost disadvantage is reduced (such as if multinationalproduction is subsidized), the reward line shifts down to M9 and multinationals
M9 M 17decrease their quality increment to l , l .
Proposition 2. Multinationals choose larger innovations than licensors. Adecrease in multinational cost disadvantage reduces the magnitude of innovationschosen by multinationals. An increase in the share of profits retained by licenseesdoes not affect the magnitude of innovation chosen by licensors.
The trait that multinationals invent larger improvements than licensors matches
Fig. 2. Subsidy shrinks innovations when mode fixed.
17A reduction in the fixed costs of multinational production, or equivalently a lump-sum subsidy toFDI, would increase i but not affect l.

144 A. J. Glass, K. Saggi / Journal of International Economics 56 (2002) 131 –153
empirical evidence (see Mansfield and Romeo, 1980). We relate this property tothe disadvantages faced by multinationals due to operating in unfamiliar economicenvironments and having to coordinate production over larger distances (seeMarkusen, 1995).
4.3. Composition effects with mode shifts
What happens if production by multinationals is subsidized so that themultinational cost disadvantage falls? Let 2 Dz j 5 s so that the multinationals dcost disadvantage for each industry (net of any subsidy) falls by the amount of thesubsidy to multinational production. Industries with multinational cost disadvan-
˜ ˜ ˜ ˜tage in the range sz,z9g will switch from licensing to FDI, where z9 ; z 1 s, as thesubsidy is sufficient to make FDI attractive relative to licensing. This switch fromlicensing to FDI is depicted in Fig. 1 by the segment labeled New FDI betweenthe old boundary line and the new one. Thus the extent of FDI rises and the extent
]of licensing falls: ≠h /≠s 5 s / z 2z .s d
] LIndustries that continue to license still pick the same innovation magnitude l .Industries that continue with FDI reduce their chosen innovation magnitude
M9 Ml j , l j : an industry with multinational cost disadvantage z j picks thes d s d s dinnovation magnitude based on z 9 j ; z j 2 s. But the industries that newlys d s dserve the market abroad through FDI (that originally licensed local firms) increasetheir innovation magnitude as the innovation magnitude for multinationals exceeds
]M9 L ˜that for firms that license l j . l . We additionally require z 1 s #z so thats dthere are enough industries that were licensing to switch to FDI. Table 1 capturesthe effects on innovation size.
Fig. 3 helps visualize that the average innovation magnitude must rise. The areaunder ML indicates the average innovation size chosen initially, and the areaunder M9L is that with the subsidy. Thus, comparing areas amounts to comparingthe average innovation size. The shaded triangle indicates the degree that theaverage innovation size increases due to the subsidy. The innovation magnitude
˜ ˜chosen over z 1 s,z 1 s with the subsidy matches that chosen over z,z in thef g f g] ]absence of the subsidy. Provided s ,z so that some multinational cost dis-
] Madvantage remains net of the subsidy, the smallest innovation magnitude l must]Lstill exceed the innovation magnitude under licensing l . Thus, the degree that
innovation magnitude for the range z,z 1 s exceeds the innovation magnitudef g] ]
Table 1Adjustment in innovation size
˜FDI [z,z ] Dl , 0]˜ ˜Switch (z,z9] Dl . 0
]˜License (z9,z ] Dl 5 0

A. J. Glass, K. Saggi / Journal of International Economics 56 (2002) 131 –153 145
Fig. 3. Subsidy expands innovations when mode adjusts.
under licensing (the shaded area) is positive and represents the degree that the18overall innovation magnitude increases due to the FDI subsidy.
Proposition 3. A subsidy to multinational production expands the extent of FDIand contracts the extent of licensing. Each industry conducting FDI shrinks itsinnovation magnitude, but some industries switch from licensing to FDI and theseindustries increase their innovation magnitude. The average innovation magnitudeunder FDI falls but the overall average innovation magnitude (under FDI andlicensing) rises, provided the subsidy is not too large.
Similar analysis can be performed for the case of an increase in licensee profit˜retention u. An increase in u increases the extent of FDI as the threshold z defined
in Eq. (13) increases. Firms in industries that switch from licensing to FDI picklarger innovations than before. In fact, they have larger multinational costdisadvantages z than firms in industries that were already engaged in FDI;consequently, the firms that switch pick larger innovations than existing multina-tionals. Thus, the average innovation size for multinationals increases, as does theoverall average innovation size. In this case, the increase in innovation size isgenerated entirely by firms that switch mode from licensing to multinationalproduction.
Proposition 4. An increase in the share of profits retained by licensees expands
18In effect, we shift the innovation magnitude curve M9L with the subsidy to the left by the amountof the subsidy to overlap the innovation magnitude curve ML without the subsidy, wrapping the rangefrom z to z 1 s around to the right.
] ]
146 A. J. Glass, K. Saggi / Journal of International Economics 56 (2002) 131 –153
the extent of FDI and contracts the extent of licensing. Industries that switch fromlicensing to FDI increase their innovation magnitude. The average innovationmagnitude under FDI and the overall average innovation magnitude (under FDIand licensing) both rise.
When the mode (licensing versus FDI) is exogenous, subsidizing multinationalproduction leads to smaller innovations and increasing licensee profit retentionleaves innovation size unchanged. However, allowing firms to choose their modeof serving foreign markets drastically alters those conclusions: any force thatincreases internalization advantage (subsidies to multinational production or anincrease in the licensee’s share of profits) necessarily increases the average size ofinnovations. Yet allowing for the mode to shift does not alter the sign of ourcomparative static results for the speed of innovation.
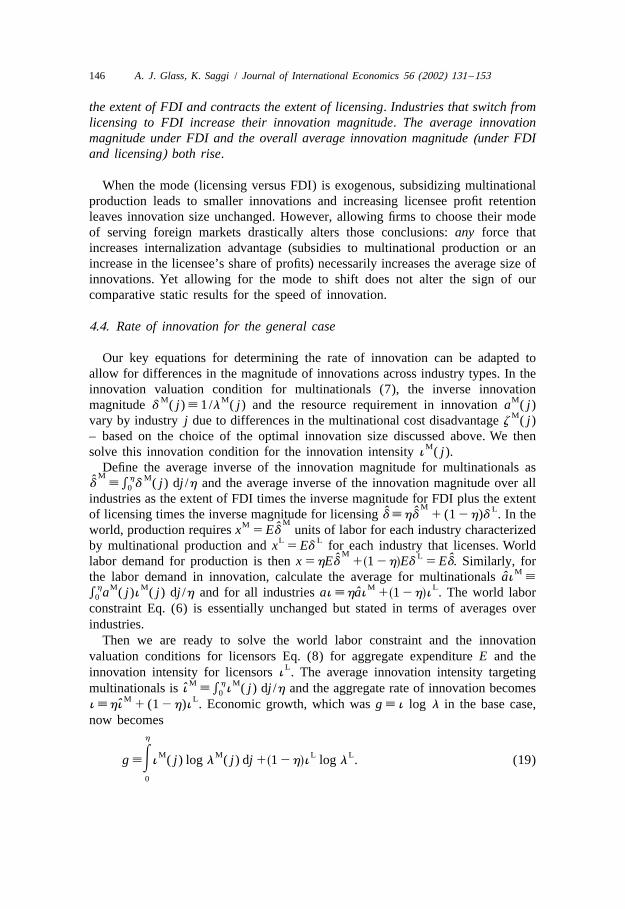
4.4. Rate of innovation for the general case
Our key equations for determining the rate of innovation can be adapted toallow for differences in the magnitude of innovations across industry types. In theinnovation valuation condition for multinationals (7), the inverse innovation
M M Mmagnitude d ( j) ; 1/l ( j) and the resource requirement in innovation a ( j)Mvary by industry j due to differences in the multinational cost disadvantage z ( j)
– based on the choice of the optimal innovation size discussed above. We thenMsolve this innovation condition for the innovation intensity i ( j).
Define the average inverse of the innovation magnitude for multinationals asM h M
d̂ ; e d ( j) dj /h and the average inverse of the innovation magnitude over all0
industries as the extent of FDI times the inverse magnitude for FDI plus the extentM Lˆ ˆof licensing times the inverse magnitude for licensing d ;hd 1 (1 2h)d . In the
MM ˆworld, production requires x 5 Ed units of labor for each industry characterizedL Lby multinational production and x 5 Ed for each industry that licenses. World
M Lˆ ˆlabor demand for production is then x 5hEd 1 1 2h Ed 5 Ed. Similarly, fors dMˆthe labor demand in innovation, calculate the average for multinationals ai ;
h M M M Lˆe a ( j)i ( j) dj /h and for all industries ai ;hai 1 1 2h i . The world labors d0
constraint Eq. (6) is essentially unchanged but stated in terms of averages overindustries.
Then we are ready to solve the world labor constraint and the innovationvaluation conditions for licensors Eq. (8) for aggregate expenditure E and the
Linnovation intensity for licensors i . The average innovation intensity targetingM h Mˆmultinationals is i ; e i ( j) dj /h and the aggregate rate of innovation becomes0
M Lˆi ;hi 1 (1 2h)i . Economic growth, which was g ; i log l in the base case,now becomes
h
M M L Lg ;Ei ( j) log l ( j) dj 1 1 2h i log l . (19)s d0
A. J. Glass, K. Saggi / Journal of International Economics 56 (2002) 131 –153 147
Parameter changes can affect economic growth through effects on the innovationM L M Lintensities i ( j) and i , the innovation magnitudes l ( j) and l , or on the
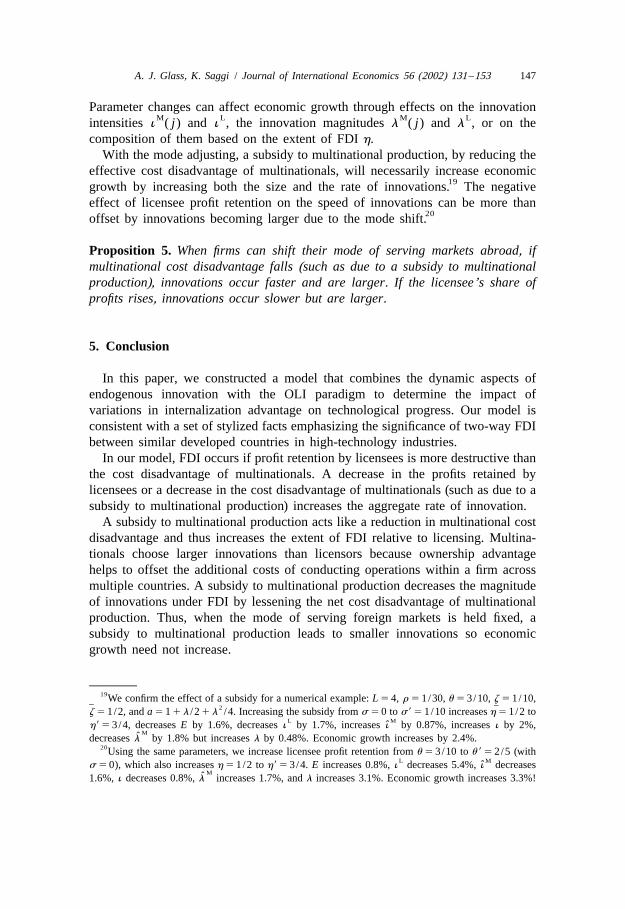
composition of them based on the extent of FDI h.With the mode adjusting, a subsidy to multinational production, by reducing the
effective cost disadvantage of multinationals, will necessarily increase economic19growth by increasing both the size and the rate of innovations. The negative
effect of licensee profit retention on the speed of innovations can be more than20offset by innovations becoming larger due to the mode shift.
Proposition 5. When firms can shift their mode of serving markets abroad, ifmultinational cost disadvantage falls (such as due to a subsidy to multinationalproduction), innovations occur faster and are larger. If the licensee’s share ofprofits rises, innovations occur slower but are larger.
5. Conclusion
In this paper, we constructed a model that combines the dynamic aspects ofendogenous innovation with the OLI paradigm to determine the impact ofvariations in internalization advantage on technological progress. Our model isconsistent with a set of stylized facts emphasizing the significance of two-way FDIbetween similar developed countries in high-technology industries.
In our model, FDI occurs if profit retention by licensees is more destructive thanthe cost disadvantage of multinationals. A decrease in the profits retained bylicensees or a decrease in the cost disadvantage of multinationals (such as due to asubsidy to multinational production) increases the aggregate rate of innovation.
A subsidy to multinational production acts like a reduction in multinational costdisadvantage and thus increases the extent of FDI relative to licensing. Multina-tionals choose larger innovations than licensors because ownership advantagehelps to offset the additional costs of conducting operations within a firm acrossmultiple countries. A subsidy to multinational production decreases the magnitudeof innovations under FDI by lessening the net cost disadvantage of multinationalproduction. Thus, when the mode of serving foreign markets is held fixed, asubsidy to multinational production leads to smaller innovations so economicgrowth need not increase.
19We confirm the effect of a subsidy for a numerical example: L 5 4, r 5 1/30, u 5 3/10, z 5 1/10,] ]2z 5 1/2, and a 5 1 1 l /2 1 l /4. Increasing the subsidy from s 5 0 to s9 5 1/10 increases h 5 1/2 to
L Mˆh9 5 3/4, decreases E by 1.6%, decreases i by 1.7%, increases i by 0.87%, increases i by 2%,Mˆdecreases l by 1.8% but increases l by 0.48%. Economic growth increases by 2.4%.
20Using the same parameters, we increase licensee profit retention from u 5 3/10 to u 9 5 2/5 (withL Mˆs 5 0), which also increases h 5 1/2 to h9 5 3/4. E increases 0.8%, i decreases 5.4%, i decreases
Mˆ1.6%, i decreases 0.8%, l increases 1.7%, and l increases 3.1%. Economic growth increases 3.3%!

148 A. J. Glass, K. Saggi / Journal of International Economics 56 (2002) 131 –153
Nevertheless, when firms can shift their mode, a subsidy to multinationalproduction increases the average innovation magnitude over all industries, sinceinnovations are larger under FDI than licensing and the extent of FDI rises inresponse to the subsidy. So when the mode is endogenous, a subsidy tomultinational production leads to faster and larger innovations, and thus clearlyfaster economic growth.
Adjustment in mode also has key implications for the effects of licensee profitretention on economic growth. If mode were fixed, an increase in licensee profitretention makes innovations slower but has no effect on their size, so economicgrowth must necessarily decline. However, the shift in mode from licensing tomultinational production leads to bigger innovations (since multinationals picklarger innovations than licensors). The impact of larger innovations can more thanoffset their reduced frequency, leading to the possibility of increased economicgrowth. We confirm through a numerical example that the size effect can indeeddominate the frequency effect, and thereby reverse the effect on economic growthcompared to holding mode fixed.
While we pose our questions in terms of the choice between multinationalproduction and licensing, our results apply more broadly to the decision whether tokeep production within the firm. Any innovator might face a tradeoff betweenhigher production costs if produce by itself or profit sharing if license productionto a firm with better production abilities. The production cost disadvantage is aptto be less severe when operating abroad is not involved. Yet, some firms may bebetter suited for innovating than for producing, and thus license their technologiesrather than produce in-house.
Acknowledgements
We thank Rick Bond, Bill Ethier, Eric Fisher, Peter Howitt, Jane Ihrig, RonJones, Jim Markusen, Jim Melvin, Usha Nair, Peter Neary, Francesca Sanna-Randaccio, Pam Smith, Diana Weinhold, two anonymous referees, and participantsat Ohio State University, Southern Methodist University, the Midwest Internation-al Economics Meetings, the Canadian Economic Association Meetings, the TaipeiInternational Conference on Economic Growth, an IEFS Session of the ASSAmeetings, and the Dynamics of International Trade and Economic Growth for theircomments.
Appendix A
A.1. Consumer’s problem
mQuality level m of product j provides quality q j ; l . All products start ats dm0time t 5 0 at quality level m 5 0, so the base quality is q j 5 l 5 1. Alls d0
A. J. Glass, K. Saggi / Journal of International Economics 56 (2002) 131 –153 149
consumers value quality: l . 1. For quality level m to provide higher quality thanm m21the previous quality level m 2 1, q j . q j → l . l → l . 1. As d s dm m21
representative consumer in country i [ D,F has additively separable intertemporalh jpreferences given by lifetime utility
`
2r tU 5Ee log u (t) dt (A.1)i i
0
where r is the common subjective discount factor. Instantaneous utility is1
mlog u (t) 5E log Ol x ( j,t) dj (A.2)i imm
0
mwhere l is the assessment of quality level m and x ( j,t) is consumption ofim
quality level m of product j at time t by consumers in country i.The representative consumer maximizes lifetime utility subject to an inter-
temporal budget constraint. Since preferences are homothetic, aggregate demand isfound by maximizing lifetime utility subject to the aggregate intertemporal budgetconstraint
` `
2R(t ) 2R(t )E e E (t) dt # A (0) 1E e Y (t) dt (A.3)i i i
0 0
twhere R(t) 5 e r(s) ds is the cumulative interest rate up to time t and A (0) 50 i
f A 0 is the aggregate value of initial asset holdings. Individuals hold assets in thes di
form of ownership in firms, but with a diversified portfolio, any capital lossesappear as capital gains elsewhere so only initial asset holdings remain. Aggregatelabor income is Y (t) 5 L , where L is the labor supply in country i. Aggregatei i i
spending is1
E (t) 5E Op ( j,t)x ( j,t) dj. (A.4)F Gi m imm
0
where p ( j,t) is the price of quality level m of product j at time t.m
The representative consumer’s maximization problem can be broken into threestages: the allocation of lifetime wealth across time, the allocation of expenditureat each instant across products, and the allocation of expenditure at each instant foreach product across available quality levels. In the final stage, the representativeconsumer allocates spending for each product at each instant to the quality level
mm̃( j,t) offering the lowest quality-adjusted price, p ( j,t) /l . Settle indifference inm
favor of the higher quality level so the quality level selected is unique.In the second stage, the representative consumer then evenly spreads spending
across the unit measure of all products, E j,t 5 E t , as the elasticity ofs d s di i
substitution is constant at unity. Consumers demand x ( j,t) 5 E (t) /p ( j,t) units of˜ ˜m i m
150 A. J. Glass, K. Saggi / Journal of International Economics 56 (2002) 131 –153
˜quality level m( j,t) of product j and no units of other quality levels of that product.Thus lifetime utility (A.1) becomes
` 1
2r t ˜U 5Ee log E (t) 1E m j,t log l 2 log p ( j,t) dj dt (A.5)s df g˜i i m3 40 0
by substituting for instantaneous utility (and demand).In the first stage, the representative consumer evenly spreads lifetime spending
across time, E t 5 E , as the utility function is time separable and the aggregates di i
price level does not vary across time log p ( j,t) 5 log p ( j). Since aggregate˜ ˜m m
spending is constant across time, the interest rate at each point in time reflects thediscount rate r t 5 r, so R(t) 5 rt in the intertemporal budget constraint.s d
A.2. Proof of Proposition 1
After taking the derivatives, we evaluate them at z 5 0 and u 5 0 for simplicityM L(we permit d , d for use in the more general case below). Let ≠s ; 2 ≠z
represent a reduction in multinational cost disadvantage due to a subsidy tomultinational production. A decrease in multinational cost disadvantage (orincrease in the subsidy to multinational production) increases the aggregate rate ofinnovation
≠i 1 LM] ] ]S D5 hd d 1 r . 0 (A.6)≠s 2 a
increases the innovation intensity targeting multinationals
M≠i 1 LM M]] ] ]S D5 d s1 2h 1hd d 1 r . 0 (A.7)≠s 2 a
decreases the innovation intensity targeting licensors
L≠i 1 LM L] ] ]S D5 2 hd s1 2 d d 1 r , 0 (A.8)≠s 2 a
and decreases aggregate expenditure.
≠E 1 LM] ] ]S D5 2 hd 1 r , 0 (A.9)≠s 2 a
An increase in licensee profit retention decreases the aggregate rate ofinnovation
≠i 1 LL] ] ]S D5 2 d 1 2h s1 2 d d 1 r , 0 (A.10)s d≠u 2 a
increases the innovation intensity targeting multinationals

A. J. Glass, K. Saggi / Journal of International Economics 56 (2002) 131 –153 151
M≠i 1 LL M]] ] ]S D5 1 2h s1 2 d ds1 2 d d 1 r . 0 (A.11)s d≠u 2 a
decreases the innovation intensity targeting licensorsL
≠i 1 LL] ] ]S D5 2 ds1 2 d d 1 r , 0 (A.12)≠u 2 a
and increases aggregate expenditure.
≠E 1 LL] ] ]S D5 1 2h s1 2 d d 1 r . 0 (A.13)s d≠u 2 a
A.3. Proof of Proposition 2
Define M ; 1 1 z /2 / l 2 1 2 z /2 and A ; la9 /a. Note thats d s d
≠M l /2 ≠M 1 1 z /2] ]]]] ] ]]]]5 2 , 5 2 ,
2 2≠s ≠ll 2 1 2 z /2 l 2 1 2 z /2s d s d≠A a9 la9] ] ]S D5 1 2 (A.14)≠l a a
and ≠A /≠z 5 0, when totally differentiating the condition (17), so a decrease in l
is required to restore the equality when s increases (z decreases).2≠l 1 la9
2] ] ]S D5 2 1 1 z /2 , 0 (A.15)s d≠s 2 a
A.4. Proof of Proposition 3
The extent of FDI rises and industries that conduct FDI pick smaller innovationswith an decrease in the multinational cost disadvantage, but the mode effectdominates so the average innovation size rises. A decrease in multinational costdisadvantage still unambiguously raises the rate of innovation
Mˆdi ≠i ≠i ≠h ≠i ≠d] ] ]] ]]]]5 1 1 . 0 (A.16)M≠s ≠h ≠s ≠sds ˆ≠d#"!$ #"!$ #"!$#"!$ #%"!%$
1 1 121#%%%%"!%%%%$
1
]L Mwhere ≠i /≠h 5sd 2 d d L /a 1 r . 0 and ≠h /≠s 5 s / z 2z .s d s d]
A.5. Proof of Proposition 4
The negative effect of an increase in licensee profit retention on the rate ofinnovation is in part mitigated by the ability of firms to switch to FDI and thelarger average innovation size.

152 A. J. Glass, K. Saggi / Journal of International Economics 56 (2002) 131 –153
Mˆdi ≠i ≠i ≠h ≠i ≠d] ] ]] ]]]]5 1 1 , 0 (A.17)M≠hdu ≠u ≠u ˆ ≠u≠d#"!$ #"!$ #"!$#"!$ #%"!%$
2 2211 #%%"!%%$#%"!%$11
References
Aghion, P., Howitt, P., 1990. A model of growth through creative destruction. Econometrica 60,323–351.
Balasubramanyam, V.N., Salisu, M.A., Sapsford, D., 1996. Foreign direct investment and growth in EPand IS countries. Economic Journal 106, 92–105.
Borensztein, E., De Gregorio, J., Lee, J.-W., 1998. How does foreign direct investment affect economicgrowth? Journal of International Economics 45, 115–135.
Brainard, S.L., 1997. An empirical assessment of the proximity-concentration trade-off betweenmultinational sales and trade. American Economic Review 87, 520–544.
Caves, R.E., 1996. Multinational Enterprise and Economic Analysis. Cambridge University Press,Cambridge.
Caves, R.E., Crookell, H., Killing, J.P., 1983. The imperfect market for technology licenses. OxfordBulletin of Economics and Statistics 45, 249–267.
Davies, H., 1977. Technology transfer through commercial transactions. Journal of IndustrialEconomics 26, 161–175.
Ethier, W.J., 1986. The multinational firm. Quarterly Journal of Economics 101, 805–833.Ethier, W.J., Markusen, J.R., 1996. Multinational firms, technology diffusion and trade. Journal of
International Economics 41, 1–28.Gallini, N.T., Wright, B.D., 1990. Technology transfer under asymmetric information. Rand Journal of
Economics 21, 147–160.Glass, A.J., Saggi, K., 1999. Foreign direct investment and the nature of R&D. Canadian Journal of
Economics 32, 92–117.Glass, A.J., Saggi, K., 1998. International technology transfer and the technology gap. Journal of
Development Economics 55, 369–398.Grossman, G.M., Helpman, E., 1995. In: Grossman, G.M., Rogoff, K. (Eds.), Handbook of
International Economics. Technology and Trade,Vol. 3. North Holland, Amsterdam, pp. 1279–1337.Grossman, G.M., Helpman, E., 1991a. Quality ladders in the theory of growth. Review of Economic
Studies 58, 43–61.Grossman, G.M., Helpman, E., 1991b. Quality ladders and product cycles. Quarterly Journal of
Economics 106, 557–586.Helpman, E., 1993. Innovation, imitation, and intellectual property rights. Econometrica 61, 1247–
1280.Horstmann, I.J., Markusen, J.R., 1996. Exploring new markets: direct investment, contractual relations
and the multinational enterprise. International Economic Review 3, 1–19.Horstmann, I.J., Markusen, J.R., 1992. Endogenous market structures in international trade (natura facit
saltum). Journal of International Economics 32, 109–129.Horstmann, I.J., Markusen, J.R., 1987. Licensing versus direct investment: a model of internationaliza-
tion by the multinational enterprise. Canadian Journal of Economics 20, 464–481.Horstmann, I.J., Markusen, J.R., 1986. Up the average cost curve: inefficient entry and the new
protectionism. Journal of International Economics 20, 225–247.Mansfield, E., Romeo, A., 1980. Technology transfer to overseas subsidiaries by US-based firms.
Quarterly Journal of Economics 95, 737–750.Mansfield, E., Romeo, A., Wagner, S., 1979. Foreign trade and US research and development. Review
of Economics and Statistics 61, 49–57.

A. J. Glass, K. Saggi / Journal of International Economics 56 (2002) 131 –153 153
Markusen, J.R., 2001, Contracts, intellectual property rights, and multinational investment in develop-ing countries, Journal of International Economics, 53, 189–204.
Markusen, J.R., 1995. The boundaries of multinational enterprises and the theory of international trade.Journal of Economic Perspectives 9, 169–189.
Markusen, J.R., 1984. Multinationals, multi-plant economies, and the gains from trade. Journal ofInternational Economics 16, 205–226.
Markusen, J.R., Venables, A.J., 1998. Multinational firms and the new trade theory. Journal ofInternational Economics 46, 183–203.
Moran, T.H., 1998. Foreign Direct Investment and Development: The New Policy Agenda ForDeveloping Countries and Economies in Transition. Institute for International Economics, Washing-ton DC.
Petit, M.-L., Sanna-Randaccio, F., 2000. Endogenous R&D and foreign direct investment ininternational oligopolies. International Journal of Industrial Organization 18, 339–367.
Rockett, K., 1990. The quality of licensed technology. International Journal of Industrial Organization8, 559–574.
Saggi, K., 1999. Foreign direct investment, licensing, and incentives for innovation. Review ofInternational Economics 7, 699–714.
Saggi, K., 1996. Entry into a foreign market: foreign direct investment versus licensing. Review ofInternational Economics 4, 99–104.
Segerstrom, P.S., 1991. Innovation, imitation, and economic growth. Journal of Political Economy 99,807–827.
Segerstrom, P.S., Anant, T.C.A., Dinopoulos, E., 1990. A Schumpeterian model of the product lifecycle. American Economic Review 80, 1077–1091.
Taylor, M.S., 1993. Quality ladders and Ricardian trade. Journal of International Economics 34,225–243.
UNCTAD, 1997. World Investment Report: Transnational Corporations, Market Structure, AndCompetition Policy. United Nations, New York.
Vishwasrao, S., 1994. Intellectual property rights and the mode of technology transfer. Journal ofDevelopment Economics 44, 381–402.
Walz, U., 1997. Innovation, foreign direct investment and growth. Economica 64, 63–79.¨Wang, J.-Y., Blomstrom, M., 1992. Foreign investment and technology transfer: a simple model.
European Economic Review 36, 137–155.Wright, D.J., 1993. International technology transfer with an information asymmetry and endogenous
research and development. Journal of International Economics 35, 47–67.Yang, G., Maskus, K.E., 2001. Intellectual property rights, licensing and innovation in an endogenous
product2cycle model, Journal of International Economics, 53, 169–187.