lidar-based collision-free space estimation approach
TRANSCRIPT

HUNGARIAN JOURNAL OFINDUSTRY AND CHEMISTRYVol. 48(1) pp. 25–31 (2020)hjic.mk.uni-pannon.huDOI: 10.33927/hjic-2020-05
LIDAR-BASED COLLISION-FREE SPACE ESTIMATION APPROACH
MIKLÓS UNGER∗1, ERNO HORVÁTH1, AND CSABA HAJDU1
1Research Center of Vehicle Industry, Széchenyi István University, Egyetem tér 1, Gyor, 9026, HUNGARY
As autonomous technologies flourish within the vehicle industry, an increasing number of academic autonomous com-petitions are appearing. One of them is the Shell Eco-marathon Autonomous Urban Concept competition (SEM AUC)which seeks to provide hands-on experience for the academic community to design, build and test their own driverlessvehicles within a realistic infrastructure. The team at our university participates in this competition and our concept isto rely on simple and robust algorithms. This paper presents a simple collision-free space estimation algorithm for theLiDAR sensor.
Keywords: Autonomous vehicle, Voronoi, Delaunay
1. Introduction
Nowadays autonomous technology is not only importantin the automotive industry but increasingly in the fields ofacademia and reasearch as well. A sign of this tendencyis the increasing number of academic competitions, oneof which is the Shell Eco-marathon Autonomous UrbanConcept competition (SEM AUC).
1.1 Shell Eco-marathon
The Shell Eco-marathon is a competition for engineeringstudents to design and build the most ultra-efficient car.The participating teams come from all over the world.Two main classes of vehicles compete, namely UrbanConcepts and prototypes. Both classes can participate inthe Autonomous category where five different challengesawait the teams as follows:
• Complex track section
• Maneuverability
• Obstacle avoidance
• The unknown challenge
• Autonomous distance
In this paper, a simple solution for the autonomous dis-tance challenge is presented.
1.2 Our team
The SZEnergy Team is comprised of students fromSzéchenyi István University, assisted by tutors and re-searchers from the fields of the development and con-struction of electric vehicles. Since 2008, the Team has
∗Correspondence: [email protected]
Figure 1: Our car - SZEmission.
been competing each year in the Shell Eco-marathon,the biggest fuel-efficiency competition in the world. OurTeam participates in the electric vehicle category of theUrban Concept class by performing autonomous chal-lenges and regular races using the same car. Since 2019,a new car called SZEmission has been used as shown inFig. 1.
2. The challenge
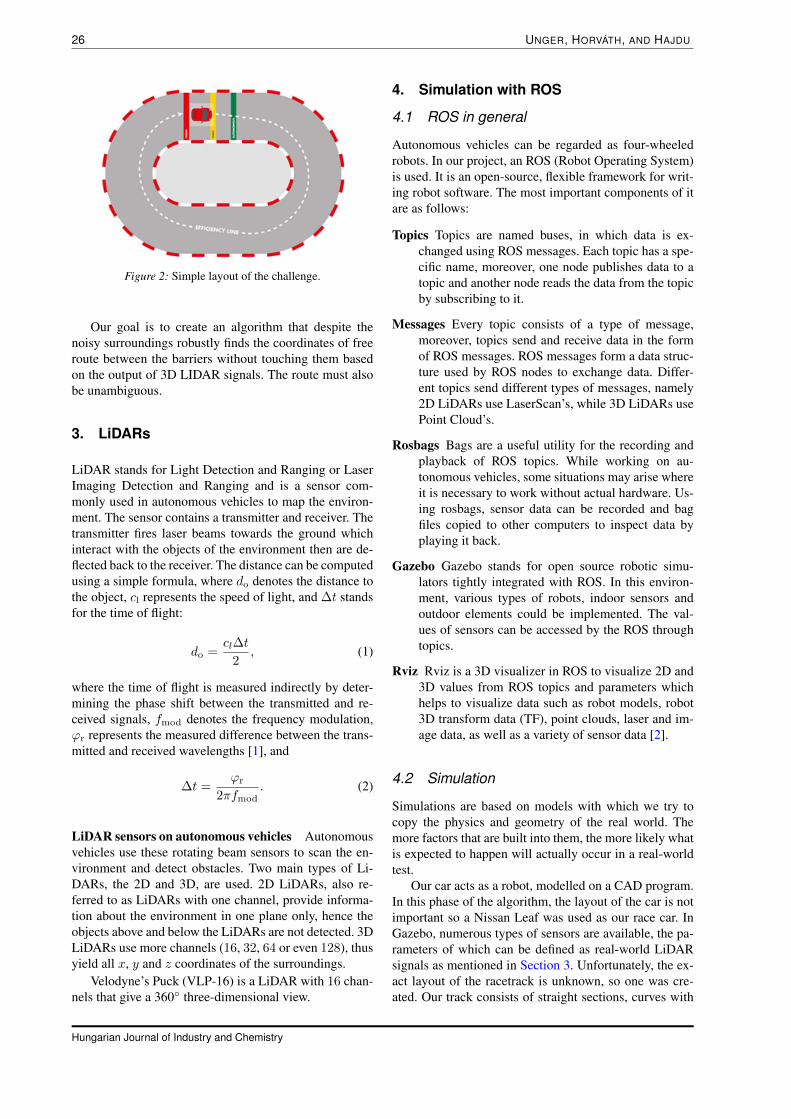
Challenges of the AUC will be undertaken on the samestandard track as the other competitions at the SEM or onsimilar but modified track sections. The track is 970 mlong and includes inclines since the track partially con-sists of closed-off roads (Fig. 2). For all five challenges,protective barriers are installed on both sides of the track.
The barriers are 0.5 m high separated by small gaps,though the size of these gaps is unspecified. Contact withthese barriers is forbidden, cars are limited to a top speedof 25 km/h and every car is driven separately on the track.The minimum width of the track is 6 meters unless other-wise specified.
26 UNGER, HORVÁTH, AND HAJDU
Figure 2: Simple layout of the challenge.
Our goal is to create an algorithm that despite thenoisy surroundings robustly finds the coordinates of freeroute between the barriers without touching them basedon the output of 3D LIDAR signals. The route must alsobe unambiguous.
3. LiDARs
LiDAR stands for Light Detection and Ranging or LaserImaging Detection and Ranging and is a sensor com-monly used in autonomous vehicles to map the environ-ment. The sensor contains a transmitter and receiver. Thetransmitter fires laser beams towards the ground whichinteract with the objects of the environment then are de-flected back to the receiver. The distance can be computedusing a simple formula, where do denotes the distance tothe object, cl represents the speed of light, and ∆t standsfor the time of flight:
do =cl∆t
2, (1)
where the time of flight is measured indirectly by deter-mining the phase shift between the transmitted and re-ceived signals, fmod denotes the frequency modulation,ϕr represents the measured difference between the trans-mitted and received wavelengths [1], and
∆t =ϕr
2πfmod. (2)
LiDAR sensors on autonomous vehicles Autonomousvehicles use these rotating beam sensors to scan the en-vironment and detect obstacles. Two main types of Li-DARs, the 2D and 3D, are used. 2D LiDARs, also re-ferred to as LiDARs with one channel, provide informa-tion about the environment in one plane only, hence theobjects above and below the LiDARs are not detected. 3DLiDARs use more channels (16, 32, 64 or even 128), thusyield all x, y and z coordinates of the surroundings.
Velodyne’s Puck (VLP-16) is a LiDAR with 16 chan-nels that give a 360◦ three-dimensional view.
4. Simulation with ROS
4.1 ROS in general
Autonomous vehicles can be regarded as four-wheeledrobots. In our project, an ROS (Robot Operating System)is used. It is an open-source, flexible framework for writ-ing robot software. The most important components of itare as follows:
Topics Topics are named buses, in which data is ex-changed using ROS messages. Each topic has a spe-cific name, moreover, one node publishes data to atopic and another node reads the data from the topicby subscribing to it.
Messages Every topic consists of a type of message,moreover, topics send and receive data in the formof ROS messages. ROS messages form a data struc-ture used by ROS nodes to exchange data. Differ-ent topics send different types of messages, namely2D LiDARs use LaserScan’s, while 3D LiDARs usePoint Cloud’s.
Rosbags Bags are a useful utility for the recording andplayback of ROS topics. While working on au-tonomous vehicles, some situations may arise whereit is necessary to work without actual hardware. Us-ing rosbags, sensor data can be recorded and bagfiles copied to other computers to inspect data byplaying it back.
Gazebo Gazebo stands for open source robotic simu-lators tightly integrated with ROS. In this environ-ment, various types of robots, indoor sensors andoutdoor elements could be implemented. The val-ues of sensors can be accessed by the ROS throughtopics.
Rviz Rviz is a 3D visualizer in ROS to visualize 2D and3D values from ROS topics and parameters whichhelps to visualize data such as robot models, robot3D transform data (TF), point clouds, laser and im-age data, as well as a variety of sensor data [2].
4.2 Simulation
Simulations are based on models with which we try tocopy the physics and geometry of the real world. Themore factors that are built into them, the more likely whatis expected to happen will actually occur in a real-worldtest.
Our car acts as a robot, modelled on a CAD program.In this phase of the algorithm, the layout of the car is notimportant so a Nissan Leaf was used as our race car. InGazebo, numerous types of sensors are available, the pa-rameters of which can be defined as real-world LiDARsignals as mentioned in Section 3. Unfortunately, the ex-act layout of the racetrack is unknown, so one was cre-ated. Our track consists of straight sections, curves with
Hungarian Journal of Industry and Chemistry

LIDAR-BASED COLLISION-FREE SPACE ESTIMATION APPROACH 27
Figure 3: Simulation in Rviz. Different topics can be visualized at the same time. It can be seen that the 3D LiDAR pointcloud originates from two 2D beams, one above the other.
different radii as well as white and red protective barrierson both sides.
As 3D sensors are used, not only the track but its sur-roundings are also important. Therefore, buildings, treesin addition to cones between and beyond the two barrierswere implemented. When the simulation was completed,it was possible to drive a lap of the track in the simula-tion and collect the ROS topics data via rosbags. More-over, with Rviz, the following points could be visualizedas presented in Fig. 3.
5. Steps of the algorithm
5.1 Filtering
Our LiDAR sensor gives information over 360 degreeswhich is very useful in many cases, however, in this chal-lenge, only information about points in front of the car isneeded. If information about displacement of the sensorson the car is available, it can be assumed that the front ofthe car and all points smaller than the linear equation
x =−b+ y
m(3)
will be deleted, where b denotes the y-intercept and mrepresents the gradient.
5.2 Clustering
As from our simulation only raw data (only x, y and zcoordinates) are obtained, which points belong to eachobject has to be defined. Clustering is the task of divid-ing the population or data points into a number of groupssuch that the data points in a group are more similar toother data points in the same group than to data points
in other groups. It is basically a collection of objects ar-ranged according to how similar or dissimilar they are toeach other.
For us the most effective method is DBSCAN(Density-Based Spatial Clustering of Applications withNoise), a well-known data clustering algorithm that iscommonly used in data mining and machine learning.Based on a set of points, DBSCAN groups together pointsthat are in close proximity to each other based on a dis-tance measurement (usually the Euclidean distance) anda minimum number of points. It also marks as outliers thepoints that are in low-density regions [3]. The DBSCANalgorithm basically requires two parameters:
eps specifies how close points should be to each other tobe considered as parts of a cluster. This means that ifthe distance between two points is smaller or equalto this value (eps), these points are considered to beneighbors.
minPoints the minimum number of points to form adense region. For example, if the minPoints param-eter is set as 5, then at least 5 points are needed toform a dense region.
After clustering, all of the points belong to a group asshown in Fig. 4.
5.3 Convex hull
Even though the point cloud of a 3D LiDAR stands formore than one thousand points, only a proportion of themis needed, thus points should be filtered. The clusteredpoints have to be packed by each group into a convexhull. The convex hull of a set of points is defined as the
48(1) pp. 25–31 (2020)

28 UNGER, HORVÁTH, AND HAJDU
Figure 4: The different clusters denoted by different col-ors.
smallest convex polygon that encloses all of the points inthe set [4].
For the purposes of clarification, only the vertices of aconvex polygon are used as shown in Fig. 5. Vertices areside points which form the simplified shape of a polygon.
5.4 Delaunay triangulation and Voronoi dia-gram
The Delaunay triangulation for a given set P of discretepoints in a plane is a triangulation DT(P ) such that nopoint in P is inside the circumcircle of any triangle inDT(P ) [5]. Delaunay triangulations maximize the mini-mum angle of all the angles of the triangles in the trian-gulation as presented in Fig. 6.
The circumcenters of Delaunay triangles are the ver-tices of the Voronoi diagram. In the 2D case, the Voronoivertices are connected via edges that can be derived fromadjacency relations of the Delaunay triangles. If two tri-angles share an edge in the Delaunay triangulation, theircircumcenters are to be connected with an edge in theVoronoi tessellation as shown in Fig. 7.
For a set of points in 2D space, the Voronoi diagramcreates cells whose edges are the same distance from twoneighboring points. This property grants that all refer-ence points are exactly between two detected items andthe edges of Voronoi cells are ideal for the representationof a reference line. Unfortunately, real environments arenever ideal and this method would provide more routeoptions in the presence of noise as presented in Fig. 8.
Figure 5: To clarify the large number of points, only thevertices of the convex hull were used.
Figure 6: The Delaunay triangulation with all the circum-circles and their centers (marked in red).
5.5 RANSAC
At this stage of the algorithm, no information is availableabout which side of the car the detected points are on. Asthe reference lines should only be between the two middlebarriers, this information is important. For this process,an estimator must be implemented.
RANSAC (random sample consensus) is an iterativemethod to estimate parameters of a mathematical modelfrom a set of observed data that contains outliers whichdo not influence the values of the estimated parameters.The input to the RANSAC algorithm is a set of observeddata values, a method of fitting some kind of modelto the observations and several confidence parameters.RANSAC achieves its goal by repeating the followingsteps [6]:
1. Selecting a random subset of the original data, re-
Figure 7: A Voronoi diagram is constructed by connectingthe centers of the circumstances.
Hungarian Journal of Industry and Chemistry

LIDAR-BASED COLLISION-FREE SPACE ESTIMATION APPROACH 29
Figure 8: A real scenario from the algorithm. The detectedpoints are denoted in orange, the green points representthe centers of the circumstances, and the black lines standfor the Voronoi edges which also represent the referencelines.
ferred to as the hypothetical inliers;
2. Fitting a model to the set of hypothetical inliers;
3. Then testing all other data against the fitted model.Those points that fit the estimated model well, ac-cording to a model-specific loss function, are con-sidered to be part of the consensus set.
4. The estimated model is reasonably good if a suffi-cient number of points are classified as part of theconsensus set.
5. Finally, the model may be improved by re-estimating it using all members of the consensus set.
If RANSAC is used for the set of Voronoi midpoints, aline is obtained between the protective barriers on eitherside of the track (Fig. 9). Now the linear equation for ywith its gradient can be written:
y = mx+ b, (4)
where b denotes the y-intercept and m represents the gra-dient.
Points with higher and lower values of y belong to theleft- and right-hand sides, respectively.
As RANSAC is an estimator, sometimes it yieldswrong results as shown in Fig. 10.
Figure 9: The RANSAC line (denoted in blue) splits thespace into two parts.
Figure 10: The estimator sometimes yields wrong results.
To avoid producing wrong results, some criteria mustbe declared:
• The starting point of the line should be between theprotective barriers.
• The line must be sufficiently long over the full rangeof the x-axis.
• If the RANSAC line intersects any of the lines ofthe convex hull, it must be rotated until it no longerintersects them.
5.6 Delete unnecessary reference lines
One of our main criteria is that the reference line shouldexclusively be between the two barriers. To ensure thatour car moves in such a way, all unnecessary Voronoimidpoints must be eliminated. Now all the points that be-long to each side can be collected, however, since they areunsorted, an Andrew’s monotone chain convex hull algo-rithm was used [7]. This algorithm sorted the points into alexicographical order (first by x-coordinates, and shouldany be equal, by y-coordinates) and then constructed up-per and lower hulls of the points as seen in Fig. 11.
Some naive approaches concerning how to use the up-per and lower sides of the convex hulls exist. Firstly, anattempt was made to copy the shape of the upper hull witha single line using Equation (Eq. 4), but was not possiblewhen used at corners.
Figure 11: The left- and right-hand sides were packed intoanother convex hull.
48(1) pp. 25–31 (2020)

30 UNGER, HORVÁTH, AND HAJDU
Figure 12: The reference line along straight sections af-fected by noise.
Another idea was that since the borderline was nota single straight line, it could be divided into as manysections as the number of vertices found in the upper hull,however, this resulted in a wavy line which in some casesalso deleted inlier Voronoi points. Then it was realizedthat the easiest solution would be to delete all the Voronoimidpoints which lie inside the left and right convex hulls.
6. Results and future works
By following the aforementioned steps, the algorithmdrew an unambiguous reference line by connectingVoronoi midpoints which lie in the middle of the roadof the required territory. Furthermore, this method alsoworks along straight sections and at corners as shown inFigs. 12 and 13.
For safety reasons, vehicle speed is limited to 25km/h. Our algorithm is designed to operate at this speedrange. The algorithm is based on Voronoi cells so its com-plexity is O(n) [8]. In our test environment the algorithmcould estimate the free space with 90 % confidence.
With the aid of Voronoi diagrams, every detected ob-ject has an effect on our reference line. Fortunately, themajority of these points are filtered by the steps outlinedin Section 5.6, however, outliers between the barriers can-not be dealt with. These points have a detrimental ef-fect on the unambiguity of the reference line and lead tothe creation of several nodes resulting in some multiple-choice decisions that need to be made by our car. To makeour algorithm robust, these points should be eliminated.
Now a single RANSAC line divides the sides ofthe road and works well for the layouts of simple cor-ners, however, one simple line cannot satisfy the crite-ria for more difficult layouts, e.g. chicanes, because theRANSAC line is unable to intersect any lines of the con-vex hull. To avoid this, the line should be divided intosmaller sections that need to follow on from each otherand determine if any parts of the linked line intersect theline of the convex hull.
Our path-following algorithm requires that the refer-ence points which follow on from each other are the samedistance apart. For this purpose, our reference points mustbe joined into one line and as many points as the algo-rithm requires must be generated.
Figure 13: The reference line at corners.
This algorithm has only been examined using test dataand has yet to be tested in real environments.
7. Conclusion
In 2020, our team will participate in the autonomous dis-tance challenge of the Shell Eco-marathon. The resultsof this algorithm are promising but a significant amountof research and development has yet to be done untilthis algorithm can operate and lead our car around a sin-gle lap. One of the benefits of the proposed method isthat it involves widely used and, over time, highly im-proved geometric algorithms like Delaunay triangulationand Voronoi diagrams.
Acknowledgements
The research was carried out as part of the “AutonomousVehicle Systems Research related to the AutonomousVehicle Proving Ground of Zalaegerszeg (EFOP-3.6.2-16-2017-00002)” project in the framework of the NewSzéchenyi Plan. The completion of this project is fundedby the European Union and co-financed by the EuropeanSocial Fund.
REFERENCES
[1] Veroné Wojtaszek, M.: Fotointerpretáció éstávérzékelés 3., A lézer alapú távérzékelés. 2010Nyugat-magyarországi Egyetem
[2] Lentin, J.: ROS robotic projects. (Packt PublishingLtd., Birmingham, UK) 2017, ISBN: 978-1-783-55471-3
[3] Kriegel, H.-P.; Kröger, P.; Sander, J.; Zimek,A.: Density-based clustering, WIREs Data Min-ing Knowl. Discov., 2011, 1 231–240 DOI:10.1002/widm.30
[4] Chazelle, B.: An optimal convex hull algorithmin any fixed dimension, Discrete Comput. Geom.,1993, 10 377–409 DOI: 10.1007/BF02573985
[5] de Berg, M.; Cheong, O.; van Kreveld, M.; Over-mars, M.: Computational geometry: Algorithms andapplications (Springer-Verlag, Berlin, Germany)2008, DOI: 10.1007/978-3-540-77974-2
Hungarian Journal of Industry and Chemistry

LIDAR-BASED COLLISION-FREE SPACE ESTIMATION APPROACH 31
[6] Fischler, M. A.; Bolles, R. C.: Random sample con-sensus: A paradigm for model fitting with appli-cations to image analysis and automated cartog-raphy, Commun. ACM, 1981, 24(6) 381–395 DOI:10.1145/358669.358692
[7] Andrew, A. M.: Another efficient algorithm for con-
vex hulls in two dimensions, Inf. Process. Lett.,1979, 9(5) 216–219 DOI: 10.1016/0020-0190(79)90072-3
[8] Seidel, R.; Adamy, U.; On the exaxt worst casequery complexity of planar point location, J. Algo-rithms, 2000, 37 189–217 DOI: 10.1006/jagm.2000.1101
48(1) pp. 25–31 (2020)