liechtenstein in figures 2016 - llv.li · of schellenberg; purchase of the earldom of vaduz in 1712...
TRANSCRIPT
Liechtenstein in Figures2016
OFFICE OF STATISTICSPRINCIPALITY OF LIECHTENSTEIN

Published and distributed by
Office of StatisticsÄulestrasse 519490 VaduzLiechtensteinT +423 236 68 76F +423 236 69 [email protected]
Layout
Karin Knöller
Photo credits
Thomas Erhart p. 1 - 8 and 30 - 42, Wilfried Oehry p. 10 - 22
Printed by
Wolf Druck AG, Schaan
Copyright
© Office of Statistics, December 2015Reproduction is authorised, provided publisher is mentioned.
Key
A dash (-) in place of a figure indicates absolute zero.A dot (.) in place of a figure indicates that the figure is not available or has been omitted for other reasons.
3
Liec
hten
stei
n in
Fig
ures
201
6
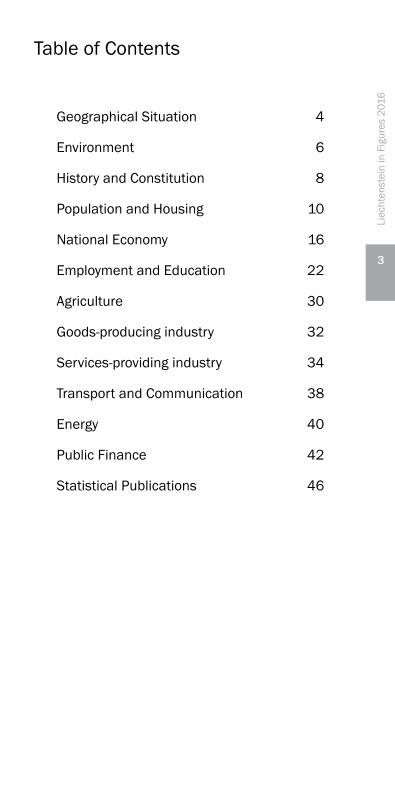
Table of Contents
Geographical Situation 4
Environment 6
History and Constitution 8
Population and Housing 10
National Economy 16
Employment and Education 22
Agriculture 30
Goods-producing industry 32
Services-providing industry 34
Transport and Communication 38
Energy 40
Public Finance 42
Statistical Publications 46

4
In geographical terms, Liechtenstein is situated between Switzerland and Austria in the centre of the Alpine arc. With a total area of only 160 km2, it is the fourth smallest coun-try in Europe. Its western neighbour Switzerland is around 260 times larger than Liechtenstein. In the west and south, the national frontier runs alongside the Swiss cantons of St. Gallen and Graubünden for 41 km. In the north and east, Liechtenstein shares a 37 km long frontier with the Austrian federal state of Vorarlberg.
Area
Total area 160 km2 100%Wooded area 66 km2 41%Agricultural area 53 km2 33%Non-productive area 24 km2 15%Settlement area 17 km2 11%
Geographical limits
North: 47° 16’ 08’’ northSouth: 47° 02’ 58’’ northWest: 9° 28’ 16’’ eastEast: 9° 38’ 34’’ east
Geographical Situation
Switzerland
Germany
AustriaVaduz
ZurichSt. Gallen
Chur
Bregenz
Constance
Liechtenstein

5
Liec
hten
stei
n in
Fig
ures
201
6Liechtenstein is the sixth smallest country in the world.
Dimensions
24.8 km at longest distance, 12.4 km at widest distance.
Highest mountain
Grauspitz: 2 599 m
Lowest point
Ruggeller Riet: 430 m
Frontiers
41.2 km with Switzerland, 36.7 km with Austria.
Municipalities area, height and population density, 2014
District/ municipality
Area (km2)
Height above sea level (m)
Population density (inhabitants/km2)
Liechtenstein
UplandVaduzTriesenBalzersTriesenbergSchaanPlanken
LowlandEschenMaurenGamprinRuggellSchellenberg
160.5 233
125.5 19117.3 460 31326.5 512 18919.7 477 23329.7 886 8826.9 462 222
5.3 786 8035.0 38210.4 452 415
7.5 472 5596.2 468 2677.4 433 2903.6 630 293

6Environment
In Liechtenstein, the altitudinal vegetation zones range from the foothill to the alpine zones (430 m to 2 599 m above sea level). As a result, a wide variety of ecological systems can be found. This is also reflected in a very diverse flora und fauna. Due to population growth and the associated land use, these ecological systems, as well as the animal and plant species living within, are put under pressure.
Threatened native speciesby species groups
Biodiversity
(2006 data)
(2006 data)
(2006 data)
(2012 data)
(2011 data)
(2012 data)
0% 20% 40% 60% 80% 100%
Not evaluated
Least Concern
Near threatened
Vulnerable
Endangered
Critically endangered
Regionally extinct
Breeding birds (149)
Reptiles (6)
Amphibians (10)
Fishes (28)
Crustaceans (3)
Vascularplants (1 447)

7
Liec
hten
stei
n in
Fig
ures
201
6
Greenhouse gas emissions Target 2011 2012 2013
Tons CO2-equivalents 183 500 220 600 230 300 236 500
Air
Immissions Austrasse Vaduz Unit
Limit value
Nitrogen oxide Micrograms per cubic meter 30Particulate matter Micrograms per cubic meter 20Ozone Hours > 120 μg/m3 1
2013 2014
22 1818 13
157 68
Water
Concentrations UnitQuality target
Nitrate in groundwater Milligrams per liter < 10Nitrate in rivers Milligrams per liter < 20
Consumption per capita
Drinking water Liters per day .
2013 2014
6.6 5.53.4 7.9
807 803
Waste
Urban waste Unit
Total Tons
Per capita KilogramsRecycling rate
2010 2011 2012
32 799 28 569 28 226
914 790 77460.3% 64.1% 64.6%
Climate
Despite its mountainous location, Liechtenstein’s climate can be described as mild. It is strongly influenced by the effect of the Föhn (a warm, dry downslope wind in the Alps), which lengthens the vegetation period in spring and autumn. Annual precipitation ranges from 900 to 1 200 millimetres. In the alpine region, annual precipitation can reach 1 900 millimetres. Whereas in the winter temperatures sometimes drop below minus 10 degrees Celsius, summer daytime temperatures generally fluctuate between 20 and 28 degrees.

8History and Constitution
History
1342 Creation of the earldom of Vaduz1396 The earldom of Vaduz becomes directly subject to
the Holy Roman Emperor1434–37 Unification of upland (earldom of Vaduz) and low-
land (domain of Schellenberg)1699 Prince Johann Adam Andreas purchases the domain
of Schellenberg; purchase of the earldom of Vaduz in 1712
1719 Vaduz and Schellenberg become the Imperial Princi-pality of Liechtenstein
1806 Inclusion in the Confederation of the Rhine: Liechtenstein becomes a sovereign state
1815 Accession to the German Confederation1852 Customs treaty with the Austrian Empire1862 A new constitution comes into force which provides
for a parliament to represent the people1868 Abolition of the Liechtenstein army1919 Cancellation of the customs treaty with Austria1921 Amendment of the constitution; democratic rights
are strengthened1924 Customs treaty with Switzerland, introduction of the
Swiss franc as the official currency1950 Membership of the International Court of Justice at
The Hague1960 Supplementary protocol on participation in EFTA1972 Supplementary agreement on inclusion in Switzer-
land’s EC and ECSC agreements1978 Member of the Council of Europe1980 Currency treaty with Switzerland

9
Liec
hten
stei
n in
Fig
ures
201
6
1990 Liechtenstein becomes the 160th member of the UN1991 Member of EFTA1995 Liechtenstein joins the EEA and the WTO1997 Foundation of Archbishopric of Vaduz2003 Amendment of the constitution
Constitution
Constitution The principality is a constitutional, hereditary mo-narchy on a democratic and parliamentary basis; the power of the state is embodied in the reigning prince and the people and is exercised by both un-der the conditions set forth in the provisions of the constitution (Article 2 of the constitution).
Head of State HSH Prince Hans-Adam II. von und zu Liechtenstein succeeded Prince Franz Josef II. on 13 November 1989. On 15 August 2004, Prince Hans-Adam II. has entrusted Hereditary Prince Alois to exercise his sovereign powers as his representative.
Government Five-member government nominated by parliament and appointed by the Prince for four years.
Head of Government Adrian Hasler (FBP)
Deputy Head of Government Thomas Zwiefelhofer (VU)
Other members: Aurelia Frick (FBP)
Mauro Pedrazzini (FBP)
Marlies Amann-Marxer (VU)
Parliament 25 members of parliament elected by the peo-ple for four years in universal, direct and secret elections.
Distribution of seats 2013–2017
10 seats Progressive Citizens’ Party (FBP) 8 seats Patriotic Union (VU) 4 seats The Independents (DU) 3 seats Free List (FL)
Courts Civil and criminal cases are heard initially by the Landgericht, at appeal by the Obergericht and at supreme court level by the Oberster Gerichtshof. Public law cases are dealt with by the Administra-tive Court and the Staatsgerichtshof. The courts are all located in Vaduz.
10Population and Housing
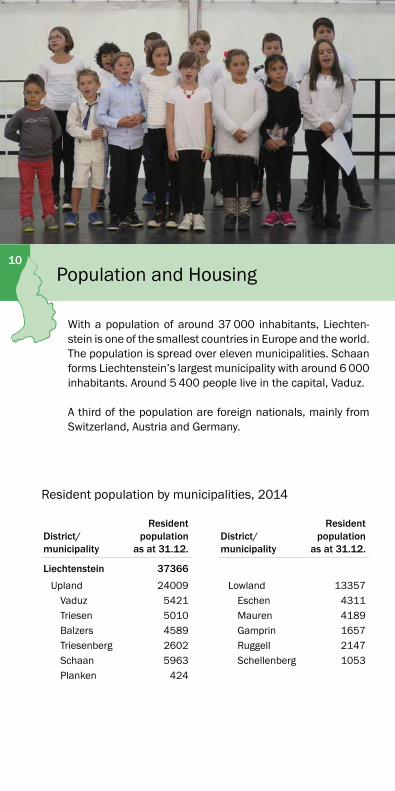
With a population of around 37 000 inhabitants, Liechten-stein is one of the smallest countries in Europe and the world. The population is spread over eleven municipalities. Schaan forms Liechtenstein’s largest municipality with around 6 000 inhabitants. Around 5 400 people live in the capital, Vaduz.
A third of the population are foreign nationals, mainly from Switzerland, Austria and Germany.
Resident population by municipalities, 2014
District/ municipality
Resident population
as at 31.12.District/ municipality
Resident population
as at 31.12.
Liechtenstein
Upland LowlandVaduz EschenTriesen MaurenBalzers GamprinTriesenberg RuggellSchaan SchellenbergPlanken
37366
2400954215010458926025963
424
1335743114189165721471053

11
Liec
hten
stei
n in
Fig
ures
201
6
Resident population
Year
Inhabitants
Share of foreign
population
LiechtensteinersOther
nationalities
1901 7 531 6 419 1 112 14.8%1911 8 693 7 343 1 350 15.5%1921 8 841 7 845 996 11.3%1930 9 948 8 257 1 691 17.0%1941 11 094 9 309 1 785 16.1%1950 13 757 11 006 2 751 20.0%1960 16 628 12 494 4 134 24.9%1970 21 350 14 304 7 046 33.0%1980 25 215 15 913 9 302 36.9%1990 29 032 18 123 10 909 37.6%2000 32 863 21 543 11 320 34.4%2010 36 149 24 145 12 004 33.2%2013 37 129 24 610 12 519 33.7%2014 37 366 24 787 12 579 33.7%
0
5000
10000
15000
20000
25000
30000
35000
40000
20142013
20102000
19901980
1970
19601950
19411930
19211911
1901
Resident population
Liechtensteiners
Other nationalities

12
Liec
hten
stei
n in
Fig
ures
201
6
Resident foreign population by nationality
Year
Foreigners
Swiss Austrian Italian German Others
1980 9 302 4 055 1 945 894 1 029 1 3791990 10 909 4 459 2 069 1 071 1 026 2 2842000 11 320 3 805 2 006 1 028 1 131 3 3502010 12 004 3 586 2 057 1 148 1 319 3 8942013 12 519 3 598 2 165 1 164 1 448 4 1442014 12 579 3 592 2 179 1 175 1 474 4 159
Resident population by age
Year
Total resident population Age
0–14 15–64 65+
1980 25 215 5 788 17 160 2 2671990 29 032 5 522 20 619 2 8912000 32 863 6 088 23 335 3 4402010 36 149 5 775 25 352 5 0222013 37 129 5 648 25 710 5 7712014 37 366 5 649 25 743 5 974
400 300 200 100 0 100 200 300 400
0
10
20
30
40
50
60
70
80
90
100
Age distribution of resident population (31.12.2014)
Liechtensteiners
Other nationalities

13
Liec
hten
stei
n in
Fig
ures
201
6
Resident population by marital status
Year
Single
Married, registered partnership
Separated, divorced, widowed
Men Women Men Women Men Women
1980 6 215 5 920 5 320 5 320 984 1 4561990 7 034 6 476 6 884 6 468 547 1 6232000 7 490 7 070 7 555 7 423 993 2 3322010 8 179 7 356 8 272 8 074 1 435 2 8332013 8 322 7 408 8 512 8 318 1 566 3 0032014 8 369 7 398 8 593 8 392 1 591 3 023
Marriages, 2014
Number of persons who got married
Liechtenstein man/Liechtenstein womanLiechtenstein man/Woman of other nationalityMan of other nationality/Liechtenstein womanMan of other nationality/Woman of other nationality
403 100.0%
114 28.3%115 28.5%
76 18.9%98 24.3%
4.5%
7.8%
45.5%
42.2%
Marital status (31.12.2014)
widowed
separated, divorced
single
married, registered partnership
Deaths by cause, 2014
Cause of death Deaths Men Women
Total
InfectionsMalignant cancerDementiaCirculatory systemRespiratory organsDigestive organsInfirmityAccidents and violent deathsOthers/Unknown
268 121 147
6 3 369 36 3311 3 875 36 3921 7 1413 4 930 9 2111 8 332 15 17

14
Liec
hten
stei
n in
Fig
ures
201
6
0
50
100
150
200
250
300
2014201320102000199019801970
Liechtensteiners
Other nationalities
Total
Deaths
0
50
100
150
200
250
300
350
400
450
2014201320102000199019801970
Births
Liechtensteiners
Other nationalities
Total
0
50
100
150
200
250
300
2014201320102000199019801970
Surplus of births
Liechtensteiners
Other nationalities
Total

15
Liec
hten
stei
n in
Fig
ures
201
6
Households by type
Population Census
2000 2010 Change
Total
Private householdsOne person householdCouple without childrenCouple with childrenLone parentOthers
Collective households (retirement homes etc.)
13 325 15 474 16.1%
13 282 15 463 16.4%4 321 5 284 22.3%2 978 3 810 27.9%4 656 4 825 3.4%
926 1 253 35.3%401 291 –27.4%
43 11 –74.4%
Occupied buildings and dwellings
Housing census
2000 2010 Change
Total buildingsSingle family housesApartment blocksMixed-use residential buildings Others
Total occupied dwellingsOwner occupiedRentedOthers
8 903 10 337 16.6%5 961 6 161 4.0%1 576 2 135 37.1%
804 1 705 112.4%562 336 –43.6%
12 601 15 474 22.8%6 385 7 884 23.5%6 006 7 321 21.9%
210 269 28.1%

16
Liechtenstein has an extremely diverse national economy with a large number of small and medium-sized enterprises. The high value-added generated can mainly be attributed to a strong industrial sector and to financial service providers. At the same time, the contribution of the public sector to the national economy is comparatively small.
On 26 May 1924, Liechtenstein declared the Swiss franc (CHF) the legal currency of Liechtenstein. All coins, bank notes and other means of payment used in Switzerland were recognised as official legal tender in Liechtenstein.
National Economy

17
Liec
hten
stei
n in
Fig
ures
201
6
The income from gainful activity is the sum of the income of all persons employed in Liechtenstein contributing to the compulsory old-age and survivors insurance (including cross-border commu-ters from abroad).
Assets of the old age pension schemes
Year
Old-age and survivors' insurance (AHV)
Company pension scheme
in million CHF in million CHF
2010 2 414 4 118 2011 2 414 4 349 2012 2 596 4 698 2013 2 747 4 968 2014 2 937 5 280
In Liechtenstein, the Swiss consumer price index applies.
0.7%
0.2%
–0.2%
1.0%
0.6% 0.8%
1.2% 1.1%
0.7%
2.4%
0.6%
–0.5%–0.7%
-1.0%
-0.5%
0.0%
0.5%
1.0%
1.5%
2.0%
2.5%
3.0%
20142013
20122011
20102009
20082007
20062005
20042003
20022001
0.0%
Rate of price changes
Income from gainful activity
Year in million CHF
1980 5501990 1 0932000 1 8672010 2 7022013 2 7942014 2 902

18
Liec
hten
stei
n in
Fig
ures
201
6
A distinctive feature of Liechtenstein’s national economy is the large number of inward cross-border commuters. In 2014, 53% of Liechtenstein’s work force consisted of this group. Since GDP is generated by the entire work force, country comparsions of GDP per capita may in the case of Liechtenstein lead to misleading conclusions. Hence, GDP per person employed may be consid-ered a more appropriate figure to compare Liechtenstein across countries.
GDP and GNI at current prices
Year
Gross domestic product (GDP)
GDP per emplo-yed person
Gross national income (GNI)
GNI per inhabitant
in billion CHF in CHF in billion CHF in CHF
2009 4.9 166 580 4.2 117 7902010 5.3 180 810 4.5 122 8502011 5.1 171 040 4.0 110 8402012 5.1 168 570 3.6 97 4102013 5.3 172 800 4.0 108 830
GDP at current prices in comparison, 2013
CountryNational currency
in billion in billion CHF
LiechtensteinSwitzerlandAustriaGermany
Euro converted at yearly average rate (1 EUR = 1.230793 CHF).
CHF 5.3 5.3CHF 634.9 634.9EUR 322.9 397.4EUR 2 809.5 3 457.9

19
Liec
hten
stei
n in
Fig
ures
201
6Number of enterprises by sector and size
2013 2014 Change
Total
Economic sectorSector 1 Agriculture Sector 2 GoodsSector 3 Services
Size class1–9 employees10–49 employees50–249 employees250+ employees
4 165 4 331 4.0%
100 102 2.0%604 593 -1.8%
3 461 3 636 5.1%
3 621 3 766 4.0%442 468 5.9%
85 80 -5.9%17 17 0.0%
24%
8%
40%
28%
Gross value added in 2013By economic activity
Agriculture and households
Goods production
General services
Financial services
The value added by agriculture and households mainly corres-ponds to the rental activities of real estates and the imputed ren-tal of owner occupied dwellings.

20
Liec
hten
stei
n in
Fig
ures
201
6
Social protection in Liechtenstein
• sickness and maternity insurance (1910)• occupational accident insurance (1910)• non-occupational accident insurance (1932)• old-age and survivors insurance (1952)• family allowance (1957)• bad weather compensation in the construction industry (1957)• subsidy for the building of houses (1958)• disability insurance (1959)• occupational illnesses protection (1961)• supplementary allowances for old-age, survivors and disability
insurance (1965)• social assistance for individual cases (1966)• unemployment insurance (1970)• blind persons allowance (1971)• widowers pension (1981)• maternity benefits (1982)• insolvency compensation (1985)• company pension scheme (1989)
Bilateral social security agreements were signed with Switzerland, Austria, Germany and Italy.
Through the EEA Agreement, various European legal acts in the field of social security also apply in Liechtenstein.

21
Liec
hten
stei
n in
Fig
ures
201
6
Sustainable development
The update of the indicator system in the year 2015 shows in two areas an improvement and in one area a deterioration in the evaluation.
The areas of social cohesion and natural resources were evaluat-ed higher than in the previous year. The area of living conditions was evaluated lower than in the year before.
The other areas remained unchanged.
-
-
-
-
-
-
-
-
-
-
+
+
+
+
+
+
+
+
+
+
Indicators of sustainable development 2015
Living Conditions
Health
Social Cohesion
International Cooperation
Education and Culture
Employment
Economy
Mobility
Energy and Climate
Natural Resources
Positive (sustainable trend)
Negative (non-sustainable trend)
NeutralEvaluation 2015
Evaluation 2014

22
For many years, Liechtenstein’s national economy has expe-rienced an above-average growth in employment. Due to the strong economic growth over the past decades and the small size of the country, an increasing input of labour from neigh-bouring countries is required. More than half of the persons employed in Liechtenstein do not actually live there.
Employment and Education
Employment
Resident population in gainful employment
Inward commuters Total employed
Year
of which outward
commuters
of which other
nationalities
Inward commuters 1930–1960 and outward commuters 1990 are estimates.
1930 4 436 . 150 4 586 .1941 4 874 723 10 4 161 6761950 6 018 380 700 6 338 2 0071960 7 575 179 1 700 9 096 3 8931970 9 336 368 2 601 11 569 6 2401980 12 266 723 3 297 14 840 8 2121990 13 970 950 6 885 19 905 11 9332000 16 710 1 105 11 192 26 797 16 9602010 18 280 1 516 17 570 34 334 23 1872013 18 994 1 910 19 140 36 224 24 9212014 19 007 1 878 19 551 36 680 25 315

23
Liec
hten
stei
n in
Fig
ures
201
6
Persons employed by economic sector, 2014compared with neighbouring countries
Liechtenstein Switzerland Austria Germany
Sector 1 AgricultureSector 2 GoodsSector 3 Services
0.8% 3.6% 4.8% 1.5%38.8% 22.2% 25.8% 24.6%60.4% 74.3% 69.4% 73.9%
0
5000
10000
15000
20000
25000
30000
35000
40000Sektor 1 Landwirtschaft
Sektor 2 Industrie
Sektor 3 Dienstleistungen
2014201320102000199019801970
Employment by economic sector
Sector 1Agriculture
Sector 2Goods
Sector 3Services
0.8%
38.8%
60.4%
Employment by economic sector (31.12.2014)
Sector 1Agriculture
Sector 2Goods
Sector 3Services

24
Liec
hten
stei
n in
Fig
ures
201
6
53.7%
42.1%
3.1%1.1% Others
Inward commuters by residence
Switzerland
Austria
Germany
31.0%
69.0%
Employees by nationality
Liechtensteiners
Other nationalities
18 699
19 007
1 878
17 129
554
19 551
6 318
10 811
19 007 36 680
37 706
37 366340
Total employment as at 31 December 2014 - Summary
not in gainful employment
in gainful employment
Outward commuters
employed in Liechtenstein
Inward commuters
Other nationali-ties resident in Liechtenstein
thereofLiechtensteiners
Liechtensteiners resident in Liechtenstein
Residents Inhabitants in gainful employment
Employed in Liechtenstein
non-permanentpermanent

25
Liec
hten
stei
n in
Fig
ures
201
6
Employment by economic branch, 2014
Resident population in gainful employment
Inward commu-
ters
Employed in Liech-tenstein
Share in %
of which outward
commuters
Total
Sector 1 Agriculture
Sector 2 GoodsMining & quarryingManufacturing
Energy & Water supply; sewerage & waste remediationConstruction
Sector 3 Services
Wholesale & retail trade; repair of motor vehicles & motorcyclesTransportation & storage
Accommodation & food service activitiesInformation & communicationFinancial & insurance activitiesReal estate activitiesLegal & accounting activities
Activities of head offices; management consultancy activities
Architectural & engineering activities; technical testing & analysis
Scientific research & development; other technical activities
Administrative & support service activities
Public administration; compulsory social securityEducation
Human health & social work activitiesArts, entertainment, recreationOther service activitiesHouseholds as employers
Activities of extraterritorial organisations
19 007 1 878 19 551 36 680 100.0
271 11 23 283 0.8
5 589 606 9 258 14 241 38.831 - 21 52 0.1
3 772 506 7 995 11 261 30.7
217 15 121 323 0.91 569 85 1 121 2 605 7.1
13 147 1 261 10 270 22 156 60.4
1 718 330 1 430 2 818 7.7521 71 573 1 023 2.8
634 62 429 1 001 2.7423 60 383 746 2.0
1 551 90 1 781 3 242 8.890 10 48 128 0.3
1 480 26 1 232 2 686 7.3
321 38 293 576 1.6
506 48 407 865 2.4
209 20 129 318 0.9
811 44 1 201 1 968 5.4
1 474 45 311 1 740 4.7845 111 448 1 182 3.2
1 648 229 959 2 378 6.5246 17 126 355 1.0503 43 189 649 1.8137 1 288 424 1.2
30 16 43 57 0.2

26
Liec
hten
stei
n in
Fig
ures
201
6
Gross monthly wage by sex and age, 2012 (median)
Gross monthly wage in CHF
Both sexes Men Women
Total
20–29 years30–39 years40–49 years50–59 years60+ years
6 380 6 875 5 694
4 978 5 092 4 8646 584 6 930 6 1347 094 7 792 6 1257 017 7 908 6 0006 798 7 445 5 950
0 2 000 4 000 6 000 8 000
6 380
6 436
6 347
3 754
Gross monthly wage by economic sector, 2012 (median)in CHF
Agriculture
Total economy
Goods
Services
27
Liec
hten
stei
n in
Fig
ures
201
6
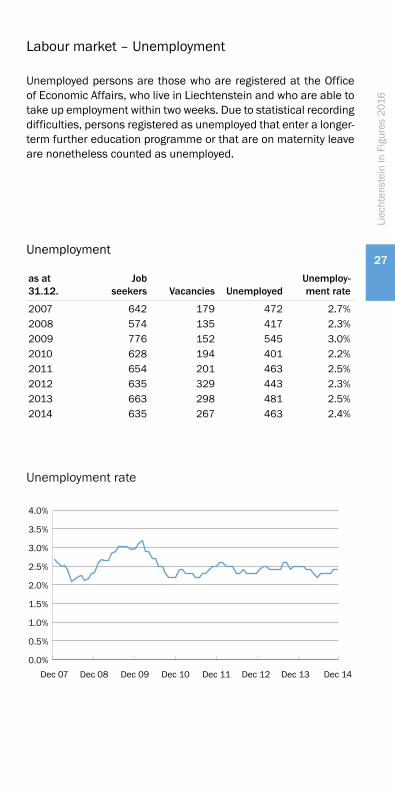
Labour market – Unemployment
Unemployed persons are those who are registered at the Office of Economic Affairs, who live in Liechtenstein and who are able to take up employment within two weeks. Due to statistical recording difficulties, persons registered as unemployed that enter a longer-term further education programme or that are on maternity leave are nonetheless counted as unemployed.
0.0%
0.5%
1.0%
1.5%
2.0%
2.5%
3.0%
3.5%
4.0%
Unemployment rate
Dec 09 Dec 10 Dec 11 Dec 12 Dec 13Dec 08Dec 07 Dec 14
Unemployment
as at 31.12.
Job seekers Vacancies Unemployed
Unemploy-ment rate
2007 642 179 472 2.7%2008 574 135 417 2.3%2009 776 152 545 3.0%2010 628 194 401 2.2%2011 654 201 463 2.5%2012 635 329 443 2.3%2013 663 298 481 2.5%2014 635 267 463 2.4%
28
Liec
hten
stei
n in
Fig
ures
201
6
Education
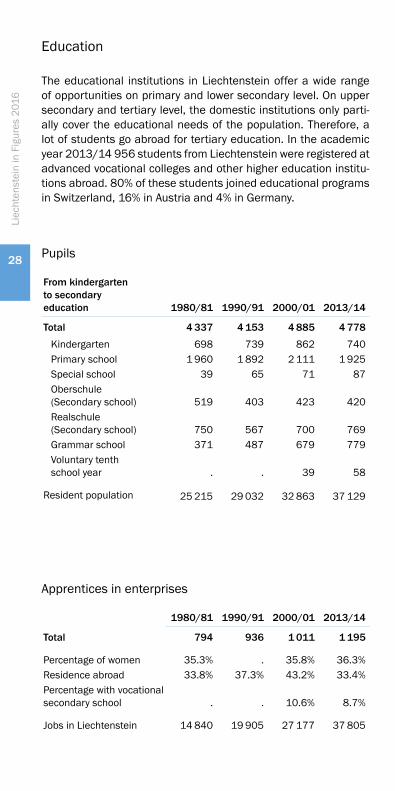
The educational institutions in Liechtenstein offer a wide range of opportunities on primary and lower secondary level. On upper secondary and tertiary level, the domestic institutions only parti-ally cover the educational needs of the population. Therefore, a lot of students go abroad for tertiary education. In the academic year 2013/14 956 students from Liechtenstein were registered at advanced vocational colleges and other higher education institu-tions abroad. 80% of these students joined educational programs in Switzerland, 16% in Austria and 4% in Germany.
Pupils
From kindergarten to secondary education
Total
KindergartenPrimary schoolSpecial schoolOberschule (Secondary school)Realschule (Secondary school)Grammar schoolVoluntary tenth school year
Resident population
1980/81 1990/91 2000/01 2013/14
4 337 4 153 4 885 4 778
698 739 862 7401 960 1 892 2 111 1 925
39 65 71 87
519 403 423 420
750 567 700 769371 487 679 779
. . 39 58
25 215 29 032 32 863 37 129
Apprentices in enterprises
Total
Percentage of womenResidence abroadPercentage with vocational secondary school
Jobs in Liechtenstein
1980/81 1990/91 2000/01 2013/14
794 936 1 011 1 195
35.3% . 35.8% 36.3%33.8% 37.3% 43.2% 33.4%
. . 10.6% 8.7%
14 840 19 905 27 177 37 805

29
Liec
hten
stei
n in
Fig
ures
201
6
Students at universities in Liechtenstein
Consecutive programmes
Total
ManagementArchitectureLawMedicine and pharmacy
Percentage of women
2011/12 2012/13 2013/14
775 661 677
474 421 403215 177 176
35 31 4951 32 49
39.1% 36.5% 36.0%
Students from Liechtenstein at universities
Place of study
Total
LiechtensteinSwitzerlandAustriaGermany
Percentage of women
2011/12 2012/13 2013/14
1 082 1 037 1 032
128 95 76760 755 769161 150 152
33 37 35
47.2% 45.9% 48.6%
30
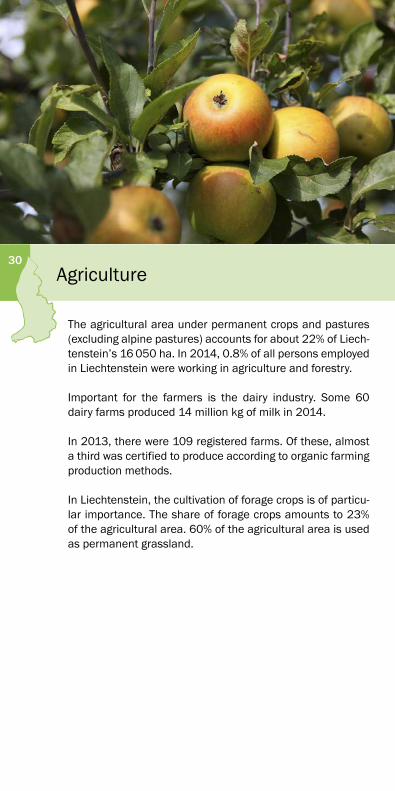
The agricultural area under permanent crops and pastures (excluding alpine pastures) accounts for about 22% of Liech-tenstein’s 16 050 ha. In 2014, 0.8% of all persons employed in Liechtenstein were working in agriculture and forestry.
Important for the farmers is the dairy industry. Some 60 dairy farms produced 14 million kg of milk in 2014.
In 2013, there were 109 registered farms. Of these, almost a third was certified to produce according to organic farming production methods.
In Liechtenstein, the cultivation of forage crops is of particu-lar importance. The share of forage crops amounts to 23% of the agricultural area. 60% of the agricultural area is used as permanent grassland.
Agriculture

31
Liec
hten
stei
n in
Fig
ures
201
6
Livestock and milk production
Cattleof which cows
EquidaePigsSheepGoatsPoultryBee colonies
Milk production (in 1000 kg)
Livestock of all livestock owners (including agricultural units receiving agricultural subsidies in form of direct payments).Milk delivery to dairy (excluding milk from alpine pastures).
1990 2000 2010 2014
6 328 5 054 5 993 6 2122 827 2 562 2 807 2 819
239 379 489 4873 251 2 013 1 690 1 7122 781 3 319 3 656 3 581
171 239 416 283. . 12 626 12 557
1 058 953 1 173 975
13 158
12 968 13 493 13 671
0
100
200
300
400
500
600 > 20 ha
10–20 ha
5–10 ha
< 5 ha
20132010200520001995199019851980
Farms by size
Farms by size
Year
Total Size in ha
< 5 5–10 10–20 > 20
Since 2010: Only farms receiving agricultural subsidies in form of direct payments.
< 5 5–10 10–20 > 201980 494 286 80 70 581990 417 248 43 45 812000 199 73 23 29 742010 118 7 13 20 782013 109 6 12 14 77

32
Liechtenstein’s economy is still heavily shaped by its goods production. In 2014, the goods-producing sector provided 37% of total employment. This represents a remarkably high proportion, compared to other European countries.
Employment in the goods-producing industry is provided by a total of 593 enterprises. These enterprises are mainly small companies with less than 50 persons employed. They are engaged in a large number of specialised market niches and contribute to the broad diversification of Liechtenstein’s economy. The most important branches include mechanical engineering, manufacturing of electrical machinery, vehicle components, dental technology, and food products as well as construction work.
Due to Liechtenstein’s limited domestic market, especially larger enterprises are heavily export-oriented. A vast majority of their goods production is sold abroad.
The most important export destinations for Liechtenstein’s goods-producing industry are Switzerland, Germany and the USA.
Goods-producing industry

33
Liec
hten
stei
n in
Fig
ures
201
6
0
1000
2000
3000
4000
5000
201420102005200019951990
Direct goods exports and imports (without Switzerland)in million CHF
Direct exports
Direct imports
Direct goods exports (without Switzerland)
Year in million CHF Change
2005 3 227 0.8%2006 3 604 11.7%2007 4 182 16.0%2008 4 245 1.5%2009 3 081 -27.4%2010 3 325 7.9%2011 3 329 0.1%2012 3 368 1.2%2013 3 389 0.0%2014 3 453 1.9%
Direct goods imports (without Switzerland)
Year in million CHF Change
Data of the Swiss Federal Customs Administration. Goods exchange with Switzerland is not included.
2005 1 909 1.5%2006 2 164 13.3%2007 2 416 11.7%2008 2 461 1.8%2009 1 924 -21.8%2010 1 882 -2.2%2011 1 965 4.4%2012 1 852 -5.7%2013 1 909 2.6%2014 2 040 6.9%
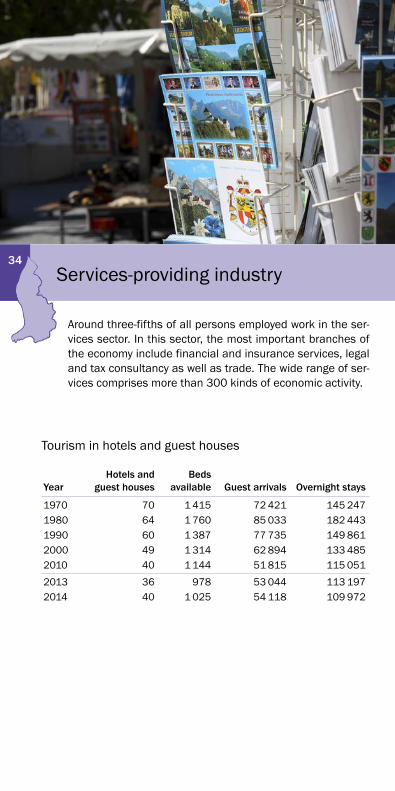
34Services-providing industry
Tourism in hotels and guest houses
YearHotels and
guest housesBeds
available Guest arrivals Overnight stays
1970 70 1 415 72 421 145 2471980 64 1 760 85 033 182 4431990 60 1 387 77 735 149 8612000 49 1 314 62 894 133 4852010 40 1 144 51 815 115 0512013 36 978 53 044 113 1972014 40 1 025 54 118 109 972
Around three-fifths of all persons employed work in the ser-vices sector. In this sector, the most important branches of the economy include financial and insurance services, legal and tax consultancy as well as trade. The wide range of ser-vices comprises more than 300 kinds of economic activity.

35
Liec
hten
stei
n in
Fig
ures
201
6
0
50
100
150
200
20142013
20122011
20102009
20082007
20062005
20042003
20022001
2000
Client assets of the banks in billion CHF
Client assets of the banks
in billion CHF (as at 31.12.)
Total client assets
Net client deposits Relevant capitalTrusts
Net client deposits means client deposits offset against items relevant to balance. Custody-Assets are included.
2000 2010 2013 2014
112.7 121.3 120.2 127.7
70.6 81.3 79.0 84.028.4 35.4 39.2 41.813.7 4.6 2.0 1.9
Banks
in million CHF
Nominal balanceNet profit
Number of persons em-ployed in Liechtenstein
2000 2010 2013 2014
36 964 52 466 57 082 63 354549 570 471 580
1 773
2 117 2 049 1 927

36
Liec
hten
stei
n in
Fig
ures
201
6
Domestic investment companies
in billion CHF
Net assets
Individual portfoliosInvestment companies
2010 2011 2012 2013 2014
37.7 35.4 37.2 38.4 46.2
693 785 791 779 735469 535 557 549 532
0
10
20
30
40
50
20142013
20122011
20102009
20082007
20062005
20042003
20022001
2000
Net assets of domestic investment companiesin billion CHF
37
Liec
hten
stei
n in
Fig
ures
201
6
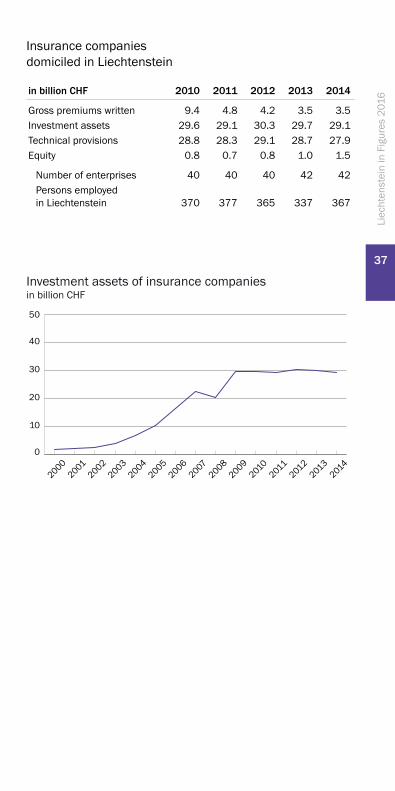
Insurance companies domiciled in Liechtenstein
in billion CHF
Gross premiums writtenInvestment assetsTechnical provisionsEquity
Number of enterprisesPersons employed in Liechtenstein
2010 2011 2012 2013 2014
9.4 4.8 4.2 3.5 3.529.6 29.1 30.3 29.7 29.128.8 28.3 29.1 28.7 27.9
0.8 0.7 0.8 1.0 1.5
40 40 40 42 42
370 377 365 337 367
0
10
20
30
40
50
20142013
20122011
20102009
20082007
20062005
20042003
20022001
2000
Investment assets of insurance companiesin billion CHF
38
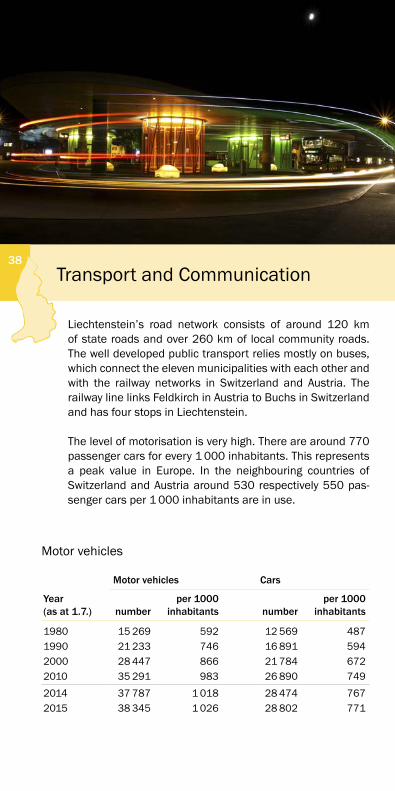
Liechtenstein’s road network consists of around 120 km of state roads and over 260 km of local community roads. The well developed public transport relies mostly on buses, which connect the eleven municipalities with each other and with the railway networks in Switzerland and Austria. The railway line links Feldkirch in Austria to Buchs in Switzerland and has four stops in Liechtenstein.
The level of motorisation is very high. There are around 770 passenger cars for every 1 000 inhabitants. This represents a peak value in Europe. In the neighbouring countries of Switzerland and Austria around 530 respectively 550 pas-senger cars per 1 000 inhabitants are in use.
Transport and Communication
Motor vehicles
Year (as at 1.7.)
Motor vehicles Cars
numberper 1000
inhabitants numberper 1000
inhabitants
1980 15 269 592 12 569 4871990 21 233 746 16 891 5942000 28 447 866 21 784 6722010 35 291 983 26 890 7492014 37 787 1 018 28 474 7672015 38 345 1 026 28 802 771
39
Liec
hten
stei
n in
Fig
ures
201
6
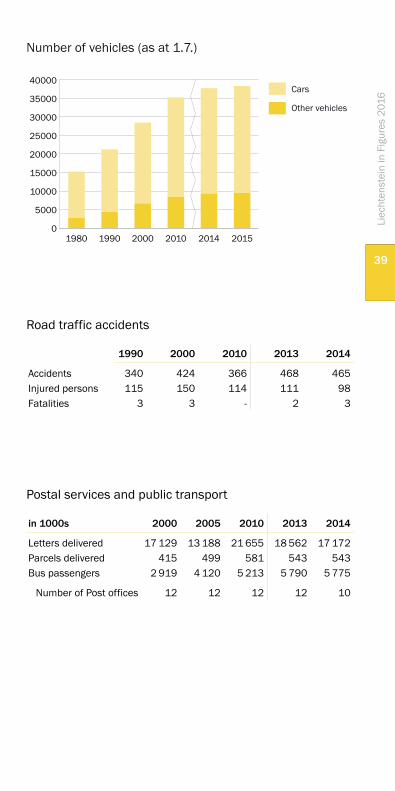
Postal services and public transport
in 1000s
Letters deliveredParcels deliveredBus passengers
Number of Post offices
2000 2005 2010 2013 2014
17 129 13 188 21 655 18 562 17 172415 499 581 543 543
2 919 4 120 5 213 5 790 5 775
12 12 12 12 10
0
5000
10000
15000
20000
25000
30000
35000
40000
201520142010200019901980
Number of vehicles (as at 1.7.)
Other vehicles
Cars
Road traffic accidents
AccidentsInjured personsFatalities
1990 2000 2010 2013 2014
340 424 366 468 465115 150 114 111 98
3 3 - 2 3

40
Electricity, natural gas, heating oil and petrol are amongst the major energy sources in Liechtenstein, which is strong-ly dependent upon energy imports. The proportion of own energy supply to total energy consumption is 8%. Energy production in Liechtenstein is limited to the energy sources electricity, firewood and biogas.
Energy
32.2%
19.4%10.6%
11.6%
8.6%
3.7%0.1%
0.8%12.5%
Energy consumption/imports in 2014
Natural gas
Electricity
Fuel oil
Petrol
Long distance heating(waste incineration)
FirewoodLiquid gas
Solar panelsDiesel oil

41
Liec
hten
stei
n in
Fig
ures
201
6
0
100
200
300
400
500
201520102005200019951990
Energy consumption/importsin GWh
Electricity
Natural gas
Fuel oil
Petrol
Diesel oil
Energy consumption/imports
in GWh 1990 2000 2013 2014
Total 1 081.5 1 207.2 1 356.6 1 228.3
Electricity 221.9 302.0 403.9 395.3Petrol 227.6 271.3 156.6 142.3Diesel oil 69.6 79.8 160.6 153.5Fuel oil 419.9 259.5 190.5 130.6Natural gas 126.6 267.3 286.8 238.5Liquid gas 3.7 1.5 1.1 1.0Firewood 11.9 24.4 47.9 46.0Solar panel . 1.0 9.9 10.1Long distance-heating (waste incineration) . . 98.9 105.1Others 0.3 0.2 0.4 5.8
Self supply 67.3 103.5 133.6 93.3
Consumption per inhabitant in MWh 37.3 36.7 36.5 32.9
42
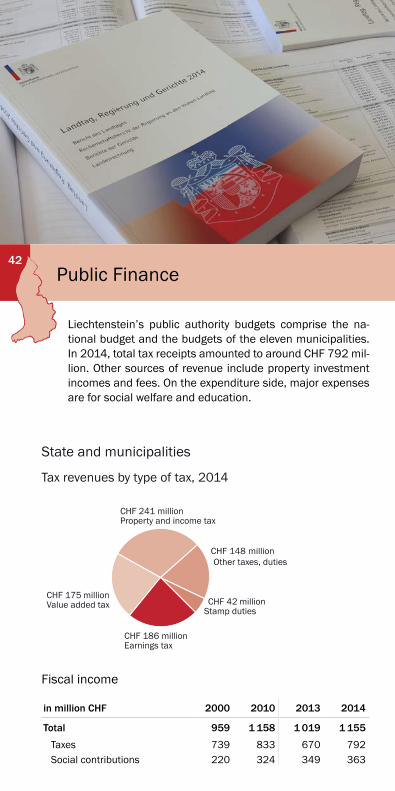
Liechtenstein’s public authority budgets comprise the na-tional budget and the budgets of the eleven municipalities. In 2014, total tax receipts amounted to around CHF 792 mil-lion. Other sources of revenue include property investment incomes and fees. On the expenditure side, major expenses are for social welfare and education.
Public Finance
Fiscal income
in million CHF
Total
TaxesSocial contributions
2000 2010 2013 2014
959 1 158 1 019 1 155
739 833 670 792220 324 349 363
CHF 186
CHF 148
CHF 175CHF 42
CHF 241
Tax revenues by type of tax, 2014
million
Value added taxmillion
million
million
million
Property and income tax
Other taxes, duties
Stamp duties
Earnings tax
State and municipalities
43
Liec
hten
stei
n in
Fig
ures
201
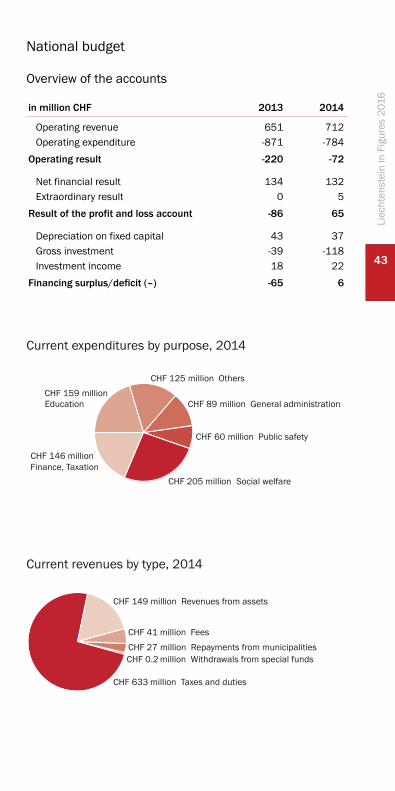
6 CHF 125
CHF 89
CHF 205
CHF 146
CHF 159
CHF 60
Allgemeine Verwaltung
Current expenditures by purpose, 2014
million Others
million Public safety
million
million
million General administration
million Social welfareFinance, Taxation
Education
CHF 149
CHF 633
CHF 41
CHF 27 CHF 0.2
Current revenues by type, 2014
million Withdrawals from special fundsmillion Repayments from municipalities
million Fees
million Revenues from assets
million Taxes and duties
National budget
Overview of the accounts
in million CHF
Operating revenueOperating expenditure
Operating result
Net financial resultExtraordinary result
Result of the profit and loss account
Depreciation on fixed capitalGross investmentInvestment income
Financing surplus/deficit (–)
2013 2014
651 712-871 -784-220 -72
134 1320 5
-86 65
43 37-39 -11818 22-65 6

44
Liec
hten
stei
n in
Fig
ures
201
6
Local budgets – Municipalities
Current accounts
in million CHF
Current expenditureCurrent revenueCash flow
Depreciation on fixed capitalSurplus current accounts
2000 2010 2013 2014
139 179 187 179288 314 277 317149 135 89 138
65 94 72 7684 41 17 63
Capital accounts
in million CHF
Gross investmentInvestment incomeNet investments
Financing surplus/deficit (–)
2000 2010 2013 2014
130 135 78 8726 26 6 8
103 110 72 80
45 26 17 59
CHF 19
CHF 23
CHF 46
CHF 32
CHF 27CHF 31
Current expenditures by purpose, 2014
million
million
million
Generaladministration
million million
Environment, land development
EducationCulture, leisure
Social welfare
Others
million
CHF 194
CHF 2
CHF 55
CHF 26
CHF 4
CHF 28
CHF 8
Current revenues by type, 2014
million Internal transfers
million Revenues from assets
million Fiscal equalisation
million Taxes
million Charges, fees
million Service charges
million Other revenues

45
Liec
hten
stei
n in
Fig
ures
201
6
International Humanitarian Cooperation and Development (IHCD)
The official development assistance (ODA) encompasses all dis-bursements of a country for development cooperation and hu-manitarian assistance according to the criteria of the OECD. In Liechtenstein, the total ODA amounted to CHF 25 million in 2014. As a percentage of GNI (Gross National Income), total ODA spend-ing for 2013 was 0.63%.
0
5
10
15
20
25
30
0.0%
0.1%
0.2%
0.3%
0.4%
0.5%
0.6%
0.7%
0.8%
20142013
20122011
20102009
20082007
20062005
Expenditures
ODA rate
Official development assistance
in million CHF % of GNI

46
Liec
hten
stei
n in
Fig
ures
201
6
Statistical Publications
Frequency of publication
Accident insurance statistics AnnuallyAgriculture statistics PeriodicallyBanking statistics AnnuallyBuilding and housing statistics AnnuallyConstruction statistics Annually/quarterlyConsumer price index MonthlyCurrent development QuarterlyEconomic report BiannuallyEconomic survey QuarterlyEducation statistics AnnuallyEmployment statistics AnnuallyEnergy statistics AnnuallyEnvironment statistics AnnuallyFamily name statistics 10-yearlyFirst name statistics AnnuallyGovernment finance statistics AnnuallyHealth insurance statistics AnnuallyHealth interview survey UndefinedIndicators of sustainable development AnnuallyLiechtenstein in figures AnnuallyMarital status statistics AnnuallyMigration statistics AnnuallyMotor vehicle statistics – inventory AnnuallyMotor vehicle statistics – new registrations Annually/monthlyNational accounts AnnuallyNaturalisation statistics AnnuallyPopulation and housing census 5-yearlyPopulation statistics Half-yearlyRevenue statistics AnnuallyStatistical yearbook AnnuallyTourism statistics Annually/seasonsUnemployment statistics AnnuallyWage statistics 2-yearly
All publications are available online ( www.as.llv.li ).
The statistical publications are more detailed and up-to-date than the corresponding tables in this brochure.

Ruggell
GamprinEschen
Schellenberg
Schaan
Vaduz
Triesenberg
Triesen
Balzers
Planken
Mauren
Malbun
Steg
Schaanwald
Nendeln
Bendern
Mäls
Gaflei
© 2009 Land Vorarlberg
47
Liec
hten
stei
n in
Fig
ures
201
6

Äulestrasse 519490 VaduzLiechtensteinT +423 236 68 76F +423 236 69 [email protected]
www.as.llv.li
Office of Statistics