lifac sorbent injection desulfurization demonstration ... library/research/coal/major... · lifac...
TRANSCRIPT
1
DOE/NETL-2001/1141
LIFAC Sorbent Injection DesulfurizationDemonstration Project: A DOE Assessment
January 2001
U.S. Department of EnergyNational Energy Technology Laboratory
P.O. Box 880, 3610 Collins Ferry RoadMorgantown, WV 26507-0880andP.O. Box 10940, 626 Cochrans Mill RoadPittsburgh, PA 15236-0940
website: www.netl.doe.gov
Disclaimer

2
Disclaimer
This report was prepared as an account of work sponsored by anagency of the United States Government. Neither the United StatesGovernment nor any agency thereof, nor any of their employees,makes any warranty, express or implied, or assumes any legal liabilityor responsibility for the accuracy, completeness, or usefulness of anyinformation, apparatus, product, or process disclosed, or representsthat its use would not infringe privately owned rights. Referencetherein to any specific commercial product, process, or service by tradename, trademark, manufacturer, or otherwise does not necessarilyconstitute or imply its endorsement, recommendation, or favoring bythe United States Government or any agency thereof. The views andopinions of authors expressed therein do not necessarily state or reflectthose of the United States Government or any agency thereof.
3
Contents
Executive Summary ....................................................................................................................... 5
Introduction................................................................................................................................... 6
II Technical and Environmental Assessment ....................................................................... 7
II.A Promise of the Technology ................................................................................... 7II.B Process Description............................................................................................... 7II.C Project Objectives/Results .................................................................................... 9II.D Environmental Performance ................................................................................. 10II.E Post-Demonstration Achievements....................................................................... 10
III Operating Capabilities Demonstrated ............................................................................... 11
III.A Size of Unit Demonstrated.................................................................................... 11III.B Performance Level Demonstrated......................................................................... 12III.C Major Operating and Design Variables Studied ................................................... 12III.D Boiler Impacts ....................................................................................................... 16III.E Commercialization of the Technology.................................................................. 16
IV Market Analysis ................................................................................................................ 17
IV.A Potential Markets .................................................................................................. 17IV.B Economic Assessment .......................................................................................... 17
V Conclusions....................................................................................................................... 20
VI Abbreviations.................................................................................................................... 21
VII Bibliography...................................................................................................................... 22
4
List of Figures and Tables
Figure 1 Overall Flow Sheet of LIFAC Process ............................................................................. 8
2 Schematic Flow Sheet of LIFAC Process ........................................................................ 9
3 Effect of Limestone Grind Size on SO2 Removal ............................................................ 13
4 Effect of Ca/S Ratio on SO2 Removal ............................................................................. 13
5 Effect of Approach-to-Saturation Temperature on SO2 Removal .................................... 14
6 Effect of Ash Recycle Ratio on SO2 Removal ................................................................. 15
7 Effect of Boiler Load on SO2 Removal ............................................................................ 15
Table 1 Typical Coal Properties .................................................................................................... 11
2 Process Parameters and Ranges ....................................................................................... 12
3 LIFAC Demonstration Capital Cost at Richmond Power & Light .................................. 18
4 Estimated Operating Cost of LIFAC at RP&L ................................................................ 18
5 Estimated Costs for 150 MWe LIFAC System for Commercial Application .................. 19
5
Executive Summary
This document serves as the U.S. Department of Energy (DOE) post-project assessmentof the Clean Coal Technology (CCT) Round III project LIFAC Sorbent Injection DesulfurizationDemonstration Project. In 1990, LIFAC North America, Inc. entered into cooperative agreementno. DE-FC22-90PC90548 with Richmond Power and Light Company (RP&L), which providedthe host site and served as a cofunder. DOE provided 50 percent of the total project cost of $21million. Other cofunders were ICF Kaiser Engineers, Tampella Power Corporation, ElectricPower Research Institute (EPRI), Black Beauty Coal Company, and the State of Indiana. Thedemonstration was conducted in Richmond, Wayne County, Indiana, at RP&L’s WhitewaterValley Station Unit 2 (a 60-MWe boiler) between September 1992 and June 1994.
The abbreviation LIFAC refers to the process, which involves limestone injected into thefurnace with activation of untreated calcium oxide. LIFAC technology is designed to removesulfur dioxide (SO2) produced in a coal-fired utility boiler, using a limestone sorbent at acalcium/sulfur molar ratio of 2.0-2.5/1. A unique feature of this technology is humidification ofthe flue gas in a separate activation reactor, which increases SO2 removal. An electrostaticprecipitator downstream from the point of injection captures the reaction products, along with thefly ash entrained in the flue gas.
The primary objectives of this project were to:
C Achieve a total SO2 removal rate of up to 85 percent.
C Demonstrate successful operation of the LIFAC process in a retrofit application in apower plant burning high sulfur U.S. coals.
C Produce a dry solid waste suitable for disposal in a landfill.
These goals were partially met in this project, which was conducted using medium sulfurcoals ranging in sulfur content from 2.0 to 2.8 percent. Coals containing over 3 percent sulfur,which are generally considered high sulfur, were not tested because the unit operation could notbe stabilized. However, the LIFAC technology could well be applicable to higher sulfur coals. Overall SO2 removal of about 70 percent was achieved in long term testing; the capability ofincreasing SO2 removal to 85 percent was inferred from parametric studies but was not actuallydemonstrated.
LIFAC system availability and mechanical operation were very good, and there were noadverse effects on boiler or auxiliaries. The waste product was a dry, stable solid, which wasdisposed of in a landfill. LIFAC technology has not been further commercialized. In the UnitedStates, compliance with SO2 emissions regulations has been achieved primarily through fuelswitching or purchase of emission allowances. If a market develops for flue gas desulfurization(FGD) processes with less SO2 emissions reduction capability than conventional wet scrubbing,LIFAC could potentially find a niche.

6
I Introduction
The goal of the U.S. Department of Energy (DOE) Clean Coal Technology (CCT)program is to furnish the energy marketplace with a number of advanced, more efficient, andenvironmentally responsible coal utilization technologies through demonstration projects. Thepurpose of these projects is to establish the commercial feasibility of the most promisingadvanced coal technologies that have developed beyond the proof-of-concept stage.
This document serves as the DOE post-project assessment of the CCT Round III projectLIFAC Sorbent Injection Desulfurization Demonstration Project, described in a report toCongress (LIFAC North America, Inc. 1990). LIFAC North America, Inc. entered into acooperative agreement with DOE to conduct the demonstration in 1990. Richmond Power andLight Company (RP&L) provided the host site and served as a cofunder. Other cofunders wereICF Kaiser Engineers, Tampella Power Corporation, Electric Power Research Institute (EPRI),Black Beauty Coal Company, and the State of Indiana. DOE provided 50 percent of the totalproject cost of $21 million.
LIFAC North America, Inc. is a partnership of Tampella Power Corporation and ICFKaiser Engineers. Tampella initiated work on the LIFAC process in Finland in the 1980s inresponse to increasingly stringent environmental regulations enacted in that country. Tampella’sefforts included laboratory and pilot-plant tests, culminating in a full-scale demonstration inFinland in 1986. In 1988, Tampella tested high sulfur U.S. coals in its pilot plant in Finland,demonstrating over 70 percent removal of sulfur dioxide (SO2) from the flue gas.
The CCT demonstration was conducted at RP&L’s Whitewater Valley Station Unit 2, a60-MWe boiler, between September 1992 and June 1994. This report is an independentevaluation, and is based on information from LIFAC’s final report (ICF North America 1998)and other listings in the Bibliography.

7
II Technical and Environmental Assessment
II.A Promise of the Technology
The LIFAC process involves limestone injected into the furnace with activation ofuntreated calcium oxide. This project was undertaken to evaluate the technical and economicfeasibility of using the LIFAC technology in a coal-fired utility system to reduce emissions ofSO2 by up to 85 percent. This commercial scale demonstration was supported by the results ofprevious studies and proof-of-concept (POC) tests by LIFAC and its parent company, Tampella. LIFAC is a method of flue gas desulfurization (FGD) that uses a limestone sorbent and removesthe waste as a dry solid product in an electrostatic precipitator (ESP). The process involvesconventional furnace sorbent injection coupled with a unique, patented activation reactor thatconverts unreacted sorbent to hydrated lime for increased SO2 removal.
The developers intended to offer a process that was less expensive than wet process FGDsystems, which provide higher levels of SO2 removal (>90 percent). Advantages claimed forLIFAC compared with other furnace sorbent injection processes include: (a) higher SO2 removalrates; (b) use of relatively inexpensive limestone as sorbent rather than lime; (c) ease of disposalof dry solid wastes; and (d) the capability of being easily retrofitted into a relatively small spacein a typical power plant, enabling installation during a normal scheduled outage.
II.B Process Description
Finely pulverized limestone (CaCO3) is injected into the furnace at a point wheretemperatures range from 1,800 to 2,000 EF, which results in decomposition to lime (CaO), whichis more reactive:
CaCO3 → CaO + CO2
About 25 percent of the SO2 in the flue gas reacts with the lime to form calcium sulfite(CaSO3) and calcium sulfate (CaSO4):
SO2 + CaO → CaSO3
SO2 + CaO + 1/2 O2 → CaSO4
As a result the SO2 oxidizing, the flue gas also contains a small amount of sulfur trioxide(SO3), essentially all of which reacts with lime, yielding additional CaSO4:
SO3 + CaO → CaSO4
8
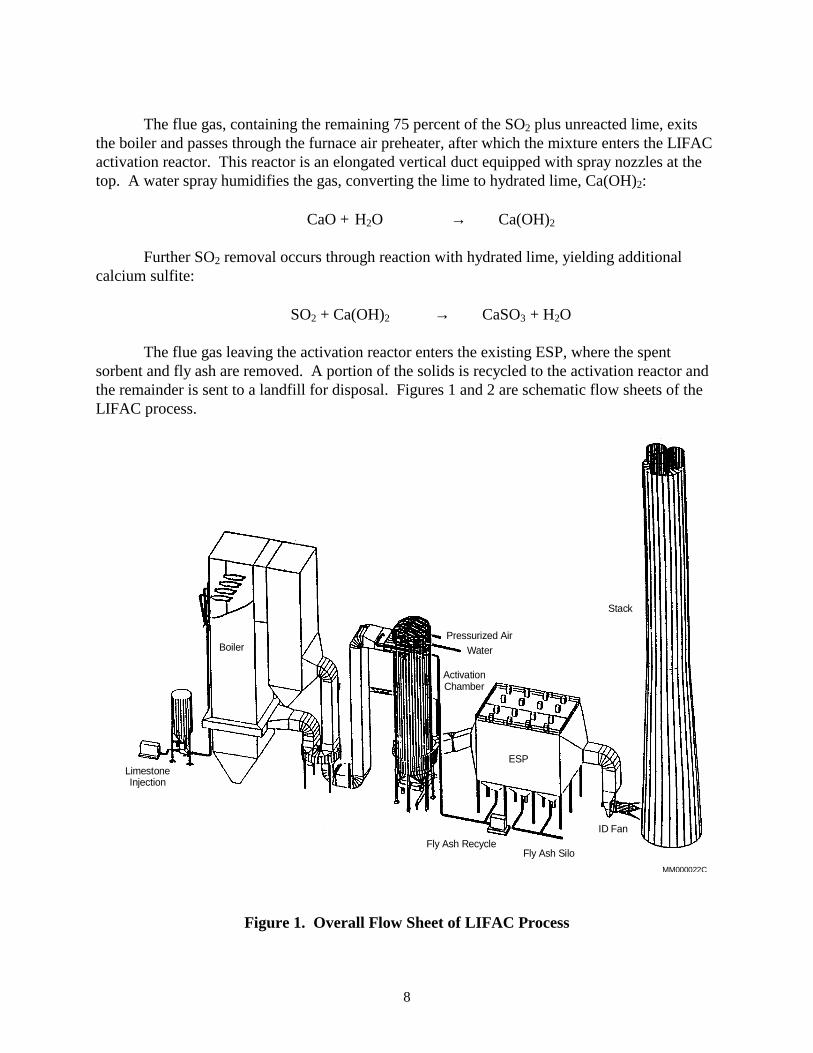
The flue gas, containing the remaining 75 percent of the SO2 plus unreacted lime, exitsthe boiler and passes through the furnace air preheater, after which the mixture enters the LIFACactivation reactor. This reactor is an elongated vertical duct equipped with spray nozzles at thetop. A water spray humidifies the gas, converting the lime to hydrated lime, Ca(OH)2:
CaO + H2O → Ca(OH)2
Further SO2 removal occurs through reaction with hydrated lime, yielding additionalcalcium sulfite:
SO2 + Ca(OH)2 → CaSO3 + H2O
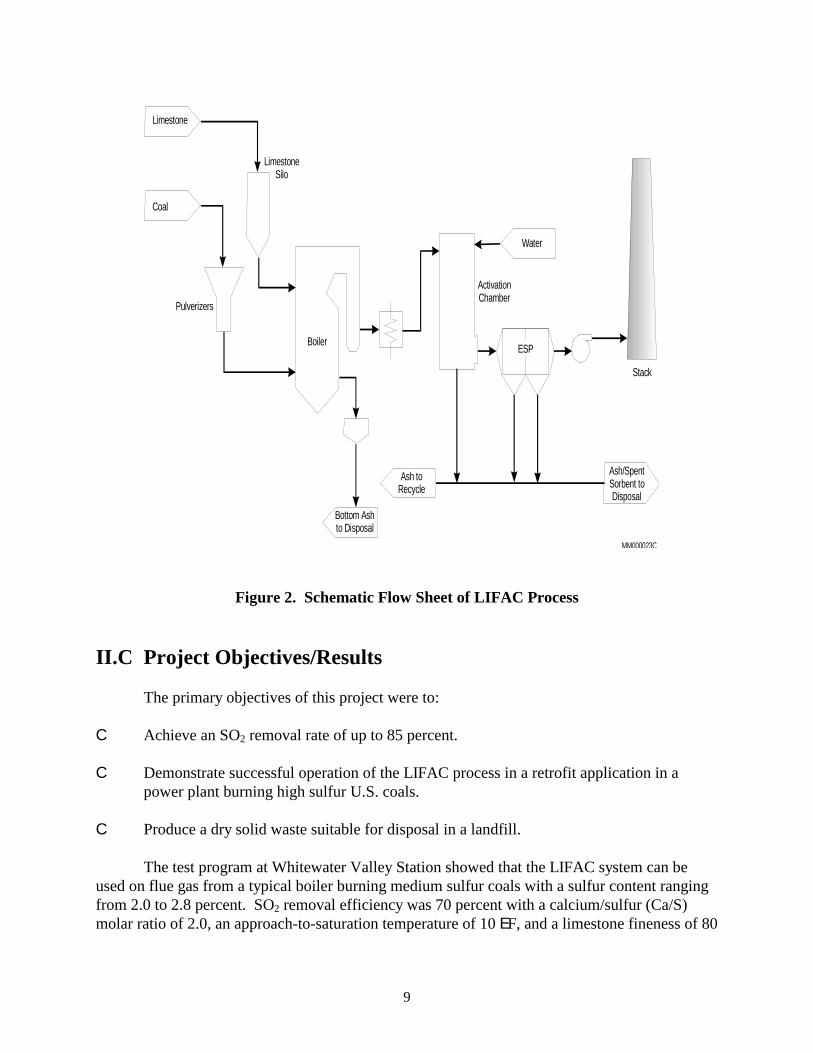
The flue gas leaving the activation reactor enters the existing ESP, where the spentsorbent and fly ash are removed. A portion of the solids is recycled to the activation reactor andthe remainder is sent to a landfill for disposal. Figures 1 and 2 are schematic flow sheets of theLIFAC process.
Figure 1. Overall Flow Sheet of LIFAC Process
MM000022C
Stack
ID Fan
Fly Ash SiloFly Ash Recycle
Boiler
LimestoneInjection
Pressurized Air
Water
ActivationChamber
ESP
9
Figure 2. Schematic Flow Sheet of LIFAC Process
II.C Project Objectives/Results
The primary objectives of this project were to:
C Achieve an SO2 removal rate of up to 85 percent.
C Demonstrate successful operation of the LIFAC process in a retrofit application in apower plant burning high sulfur U.S. coals.
C Produce a dry solid waste suitable for disposal in a landfill.
The test program at Whitewater Valley Station showed that the LIFAC system can beused on flue gas from a typical boiler burning medium sulfur coals with a sulfur content rangingfrom 2.0 to 2.8 percent. SO2 removal efficiency was 70 percent with a calcium/sulfur (Ca/S)molar ratio of 2.0, an approach-to-saturation temperature of 10 EF, and a limestone fineness of 80
Bottom Ashto Disposal
Ash toRecycle
Ash/SpentSorbent toDisposal
Pulverizers
LimestoneSilo
Coal
Limestone
Boiler
Water
ESP
Stack
ActivationChamber
MM000023C

10
percent < 325 mesh. Extrapolation of the test data indicates that the target SO2 removalefficiency of 85 percent can be achieved with the appropriate selection of operating variables.
II.D Environmental Performance
The demonstration project had a beneficial impact on the environment, reducing SO2
emissions by at least 70 percent. Other emissions, including particulates in the stack gas andsolids in the water effluent, met state and local requirements as specified in the environmentalmonitoring plan. The ash by-product does not require additional treatment before being disposedof in a landfill.
Two areas of potential concern were uncovered. Arsenic in the ash, derived from the feedcoal, while at acceptable levels, could become a problem if more stringent regulations areimposed in the future. In addition, methylene chloride was found in the ash. Although there isno regulatory limit for methylene chloride at present, it could become an issue in the future. TheLIFAC final report states that the source of this compound is unknown.
II.E Post-Demonstration Achievements
There has been no additional work on developing or commercializing the LIFAC processsince completion of the demonstration project. The LIFAC equipment is not presently beingused at the Whitewater Valley Station. SO2 emissions limits at that plant are being met usinglower sulfur coal. Worldwide, a total of nine full-scale LIFAC units are in operation, in Canada,China, Finland, and Russia.

11
III Operating Capabilities Demonstrated
III.A Size of Unit Demonstrated
The demonstration project was conducted at RP&L’s Whitewater Valley Station Unit 2,rated at 65 MWe gross (60 MWe net) and firing Indiana bituminous coals having sulfur contentsof 2.0 to 2.8 percent. The first major full-scale test of the LIFAC process was performed inFinland in 1986 on a 70-MWe sidestream from a 250-MWe boiler burning 1.5-percent sulfurcoal. A second LIFAC reactor was constructed to handle an additional 125-MWe sidestream. The Whitewater Valley CCT project was the first commercial scale application of the LIFACprocess at a typical coal-fired boiler in the United States.
Whitewater Valley Unit 2, which began service in 1971, is a tangentially fired boiler, oneof the smallest existing boilers of this type in the United States. As such, it has a hightemperature profile, which requires injecting the limestone sorbent relatively high in the boilerwhere the appropriate reaction temperature exists. As a result, only a very short residence timefor SO2 sorption is provided. This challenge for the LIFAC system was one of the reasons thatWhitewater Valley Unit 2 was chosen for the test program.
In 1980, the unit was fitted with a low-NOx concentric firing system for NOx control. TheESP is a Lodge Cottrell unit with a specific collection area (SCA) of 198 ft3/1,000 acfm of fluegas, which is relatively low compared to typical power plant installations. An averagecomposition of the coals burned in the demonstration project is given in Table 1.
Table 1. Typical Coal Properties
Coal Source Indiana BituminousProximate Analysis, wt% (as received) Fixed Carbon 44.12 Volatile Matter 33.36 Moisture 11.74 Ash 10.78 Total 100.00Sulfur, wt% 2.24Higher Heating Value Btu/lb 11,345 MJ/kg 25.5
12
III.B Performance Level Demonstrated
In long-term testing, the LIFAC demonstration unit achieved 70 percent SO2 emissionsreduction at a Ca/S molar ratio of 2.0, with an approach-to-saturation temperature of about 10 EFand a limestone fineness of 80 percent < 325 mesh. Increasing the recycle rate and sustaining a5 EF approach-to-saturation temperature at a Ca/S ratio of 2.0 was projected to be capable ofincreasing SO2 removal efficiency to 85 percent. The significance of these variables is discussedin the following section.
III.C Major Operating and Design Variables Studied
A number of parametric studies were performed to determine the effects of variables onSO2 removal. The major parameters studied are shown in Table 2, and the results aresummarized following the table.
Table 2. Process Parameters and Ranges
Process Parameter Unit of Measure Test Range
Coal quality Wt% S (as received) 2.0-2.8
Limestone grind Mesh 85%<32585%<200
Boiler load MWe 43-60
Ca/S ratio Mol/mol 1.0-2.8
Reactor outlettemperature
EF above saturation 4-11
Ash recycle ratio lb/lb 0.0-1.0
At a given Ca/S molar ratio, SO2 removal efficiency is significantly higher for a finelimestone grind (80 percent < 325 mesh) than for a coarser limestone grind (80 percent < 200mesh). This difference ranges from less than 10 to over 20 percentage points. These data areshown graphically in Figure 3. This result is not unexpected, since the finer grind has a highersurface area per unit weight and hence is likely to be more reactive. The finer limestone grind ismore expensive because of the higher grinding cost. Both of the limestones had a high CaCO3
content, ranging from 90 to 95 percent.

13
Figure 3. Effect of Limestone Grind Size on SO2 Removal
In another series of parametric tests, SO2 removal efficiency was shown to increaselinearly from about 60 percent at a 1.5 Ca/S ratio to about 80 percent at a 2.8 Ca/S ratio. Theincrease in SO2 removal is at the expense of sorbent consumption, which has a significant effecton the economics. Normal operation in long-term testing was at a Ca/S ratio of 2.0. The effectof the Ca/S ratio is shown in Figure 4.
Figure 4. Effect of Ca/S Ratio on SO2 Removal
Fine Limestone(80% < 325 mesh)
Coarse Limestone(80% < 200 mesh)
0.0 0.5 1.0 1.5 2.0 2.5 3.0 3.5
100
90
80
70
60
50
40
30
20
10
0
MM000024CCa/S Molar Ratio
Tota
l SO
Red
uct
ion (
%)
2
MM000025CCa/S (mol/mol)
Tota
l SO
Rem
oval
(%)
2
0.0 0.5 1.0 1.5 2.0 2.5 3.0
100
80
60
40
20
0
14
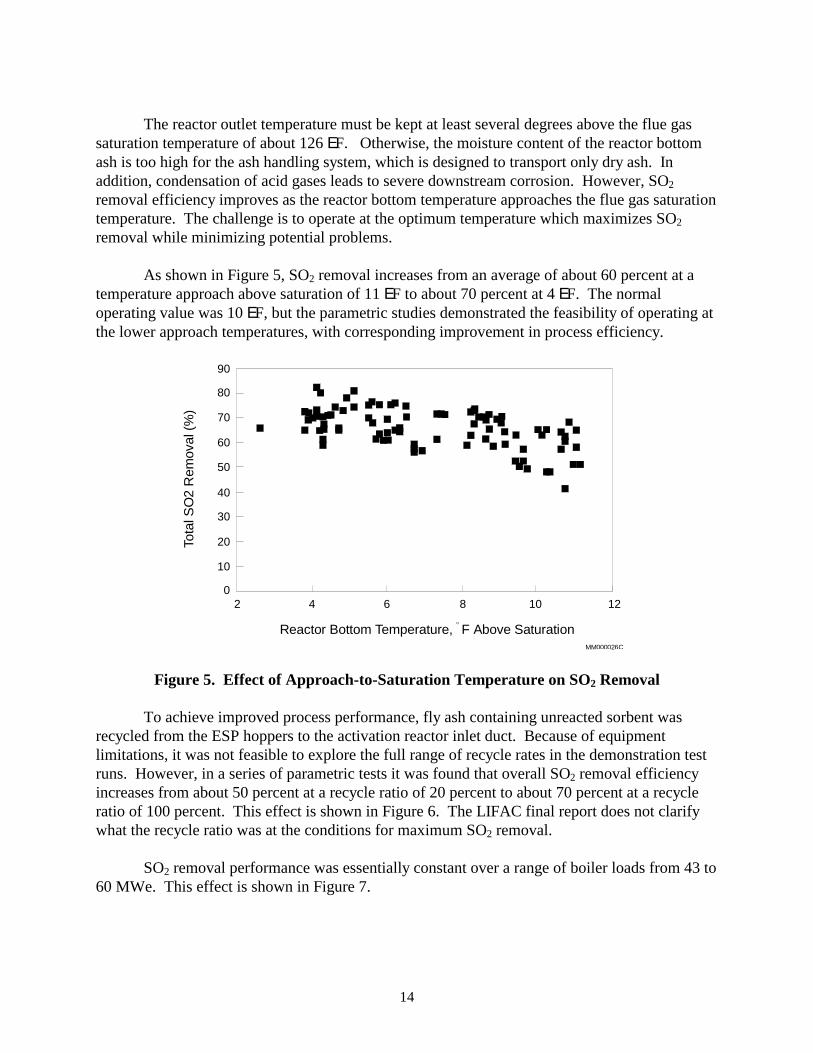
The reactor outlet temperature must be kept at least several degrees above the flue gassaturation temperature of about 126 EF. Otherwise, the moisture content of the reactor bottomash is too high for the ash handling system, which is designed to transport only dry ash. Inaddition, condensation of acid gases leads to severe downstream corrosion. However, SO2
removal efficiency improves as the reactor bottom temperature approaches the flue gas saturationtemperature. The challenge is to operate at the optimum temperature which maximizes SO2
removal while minimizing potential problems.
As shown in Figure 5, SO2 removal increases from an average of about 60 percent at atemperature approach above saturation of 11 EF to about 70 percent at 4 EF. The normaloperating value was 10 EF, but the parametric studies demonstrated the feasibility of operating atthe lower approach temperatures, with corresponding improvement in process efficiency.
Figure 5. Effect of Approach-to-Saturation Temperature on SO2 Removal
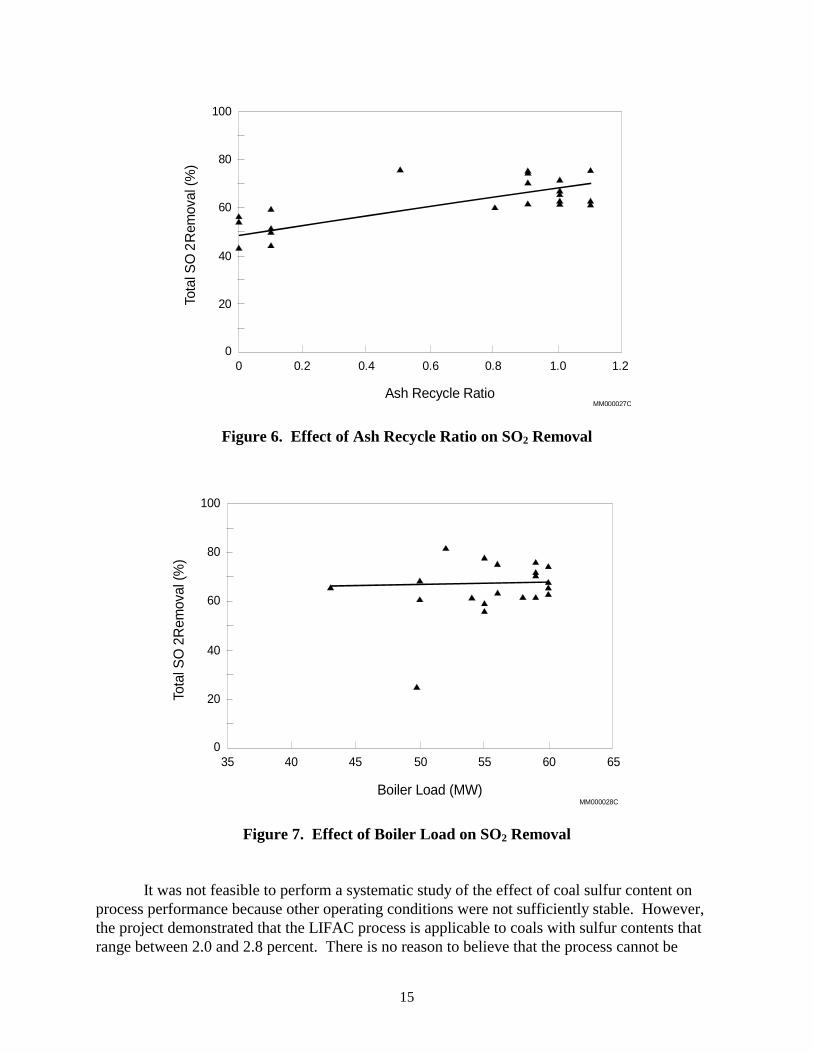
To achieve improved process performance, fly ash containing unreacted sorbent wasrecycled from the ESP hoppers to the activation reactor inlet duct. Because of equipmentlimitations, it was not feasible to explore the full range of recycle rates in the demonstration testruns. However, in a series of parametric tests it was found that overall SO2 removal efficiencyincreases from about 50 percent at a recycle ratio of 20 percent to about 70 percent at a recycleratio of 100 percent. This effect is shown in Figure 6. The LIFAC final report does not clarifywhat the recycle ratio was at the conditions for maximum SO2 removal.
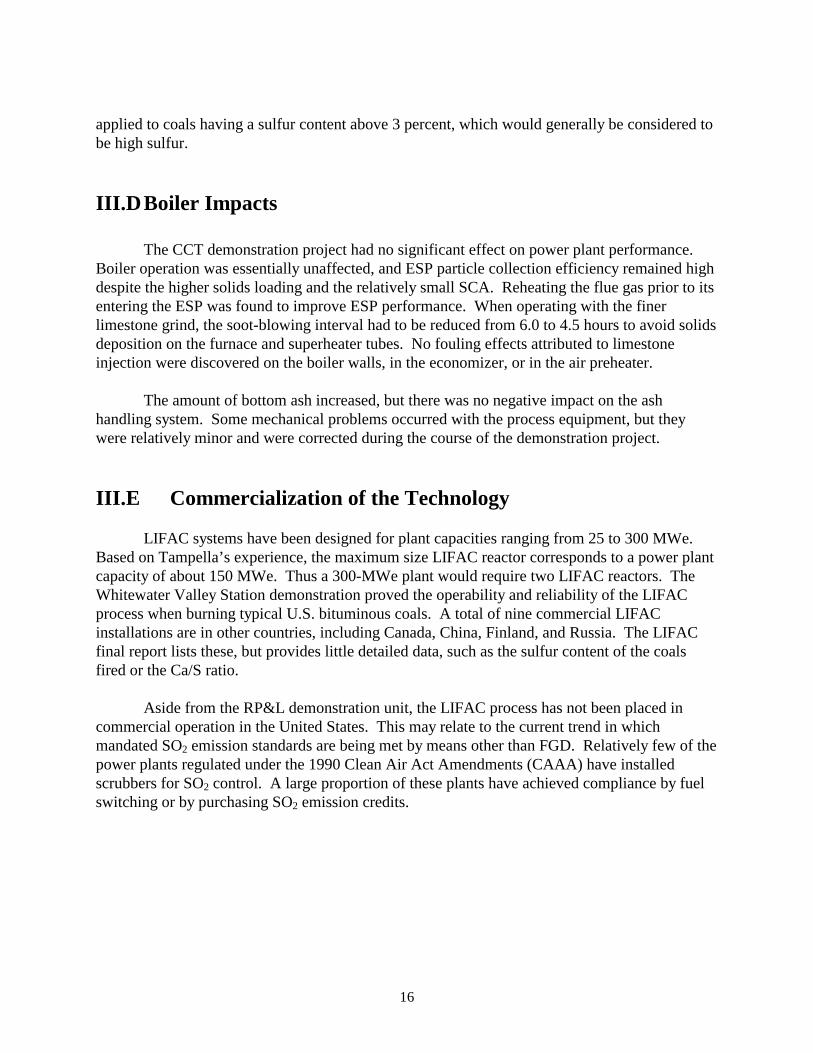
SO2 removal performance was essentially constant over a range of boiler loads from 43 to60 MWe. This effect is shown in Figure 7.
MM000026C
Reactor Bottom Temperature, F Above SaturationO
Tota
l SO
Rem
ova
l (%
)2
2 4 6 8 10 12
90
80
70
60
50
40
30
20
10
0
15
Figure 6. Effect of Ash Recycle Ratio on SO2 Removal
Figure 7. Effect of Boiler Load on SO2 Removal
It was not feasible to perform a systematic study of the effect of coal sulfur content onprocess performance because other operating conditions were not sufficiently stable. However,the project demonstrated that the LIFAC process is applicable to coals with sulfur contents thatrange between 2.0 and 2.8 percent. There is no reason to believe that the process cannot be
MM000027CAsh Recycle Ratio
Tota
l SO
Rem
oval
(%
)2
0 0.2 0.4 0.6 0.8 1.0 1.2
100
80
60
40
20
0
MM000028CBoiler Load (MW)
Tota
l SO
Rem
oval
(%)
2
35 40 45 50 55 60 65
100
80
60
40
20
0
16
applied to coals having a sulfur content above 3 percent, which would generally be considered tobe high sulfur.
III.DBoiler Impacts
The CCT demonstration project had no significant effect on power plant performance. Boiler operation was essentially unaffected, and ESP particle collection efficiency remained highdespite the higher solids loading and the relatively small SCA. Reheating the flue gas prior to itsentering the ESP was found to improve ESP performance. When operating with the finerlimestone grind, the soot-blowing interval had to be reduced from 6.0 to 4.5 hours to avoid solidsdeposition on the furnace and superheater tubes. No fouling effects attributed to limestoneinjection were discovered on the boiler walls, in the economizer, or in the air preheater.
The amount of bottom ash increased, but there was no negative impact on the ashhandling system. Some mechanical problems occurred with the process equipment, but theywere relatively minor and were corrected during the course of the demonstration project.
III.E Commercialization of the Technology
LIFAC systems have been designed for plant capacities ranging from 25 to 300 MWe. Based on Tampella’s experience, the maximum size LIFAC reactor corresponds to a power plantcapacity of about 150 MWe. Thus a 300-MWe plant would require two LIFAC reactors. TheWhitewater Valley Station demonstration proved the operability and reliability of the LIFACprocess when burning typical U.S. bituminous coals. A total of nine commercial LIFACinstallations are in other countries, including Canada, China, Finland, and Russia. The LIFACfinal report lists these, but provides little detailed data, such as the sulfur content of the coalsfired or the Ca/S ratio.
Aside from the RP&L demonstration unit, the LIFAC process has not been placed incommercial operation in the United States. This may relate to the current trend in whichmandated SO2 emission standards are being met by means other than FGD. Relatively few of thepower plants regulated under the 1990 Clean Air Act Amendments (CAAA) have installedscrubbers for SO2 control. A large proportion of these plants have achieved compliance by fuelswitching or by purchasing SO2 emission credits.

17
IV Market Analysis
IV.A Potential Markets
The LIFAC process can be used for retrofitting existing boilers or installing new boilers,and is not dependent on boiler type, age, or size, or rank and sulfur content of the coal burned. Whereas conventional wet scrubbers are designed for SO2 removal of 90 percent or more, theLIFAC process achieves more limited removal at a potentially lower cost. Although SO2
emissions standards are becoming increasingly more stringent requiring at least 90-percentremoval when firing most medium- to high-sulfur coals utilities could choose to over-controlsome of their power plants and thereby allowing some other plants in the system to operate atlower levels of SO2 removal.
The acid rain provisions of the CAAA give utilities the option of selecting the most cost-effective approach to control SO2 emissions to required levels. On this basis, there are a largenumber of candidate plants in the United States suitable for application of the LIFAC process. An internal marketing study by LIFAC identified about 850 boilers having a capacity of 500MWe or less that could use the process. LIFAC could obtain a share of the market because of itscost competitiveness in certain applications. However, as indicated above, switching to lowsulfur fuels and purchasing SO2 emissions allowances have become widely used strategies in theelectric power industry, with the result that few if any FGD units are currently being installed.
Technologies competing with LIFAC are likely to be other sorbent injection processesthat also have limited SO2 removal capability compared with conventional wet scrubbingprocesses. Comparative performance and costs on a site-specific basis will determine processchoice.
IV.B Economic Assessment
LIFAC Costs
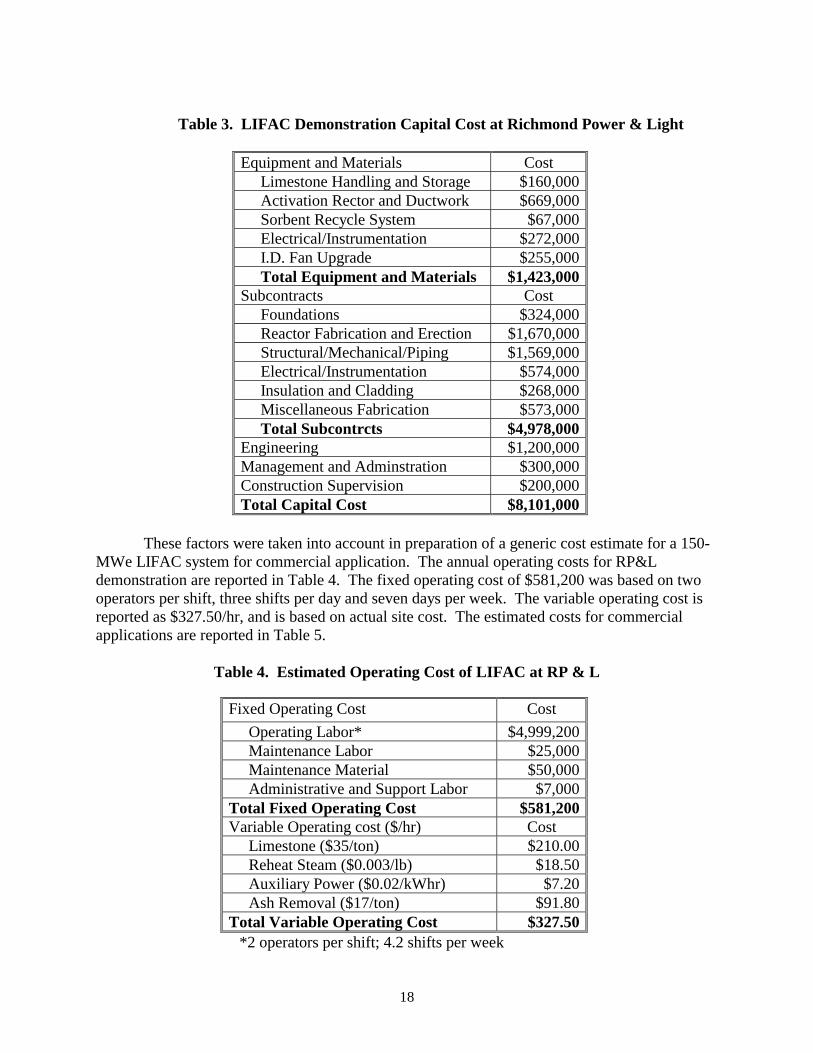
A preliminary economic assessment of the LIFAC process is included in the company’sfinal report (ICF North America 1998). The economic estimate was derived from costs forRP&L’s Whitewater Valley demonstration project as applied to a commercial design. RP&L’scapital cost of $8.1 million or $125/kW is summarized in Table 3. In addition to the cost ofconducting the demonstration, the RP&L project required special equipment, especiallyinstrumentation for test work, which would not be required for a commercial facility. On theother hand, some process equipment was available on site as a result of an earlier FGDdemonstration at that plant and this was donated to the LIFAC test project.
18
Table 3. LIFAC Demonstration Capital Cost at Richmond Power & Light
Equipment and Materials Cost Limestone Handling and Storage $160,000 Activation Rector and Ductwork $669,000 Sorbent Recycle System $67,000 Electrical/Instrumentation $272,000 I.D. Fan Upgrade $255,000 Total Equipment and Materials $1,423,000Subcontracts Cost Foundations $324,000 Reactor Fabrication and Erection $1,670,000 Structural/Mechanical/Piping $1,569,000 Electrical/Instrumentation $574,000 Insulation and Cladding $268,000 Miscellaneous Fabrication $573,000 Total Subcontrcts $4,978,000Engineering $1,200,000Management and Adminstration $300,000Construction Supervision $200,000Total Capital Cost $8,101,000
These factors were taken into account in preparation of a generic cost estimate for a 150-MWe LIFAC system for commercial application. The annual operating costs for RP&Ldemonstration are reported in Table 4. The fixed operating cost of $581,200 was based on twooperators per shift, three shifts per day and seven days per week. The variable operating cost isreported as $327.50/hr, and is based on actual site cost. The estimated costs for commercialapplications are reported in Table 5.
Table 4. Estimated Operating Cost of LIFAC at RP & L
Fixed Operating Cost Cost
Operating Labor* $4,999,200 Maintenance Labor $25,000 Maintenance Material $50,000 Administrative and Support Labor $7,000Total Fixed Operating Cost $581,200Variable Operating cost ($/hr) Cost Limestone ($35/ton) $210.00 Reheat Steam ($0.003/lb) $18.50 Auxiliary Power ($0.02/kWhr) $7.20 Ash Removal ($17/ton) $91.80Total Variable Operating Cost $327.50
*2 operators per shift; 4.2 shifts per week
19
Table 5. Estimated Costs for 150 MWe LIFAC Systemfor Commercial Application
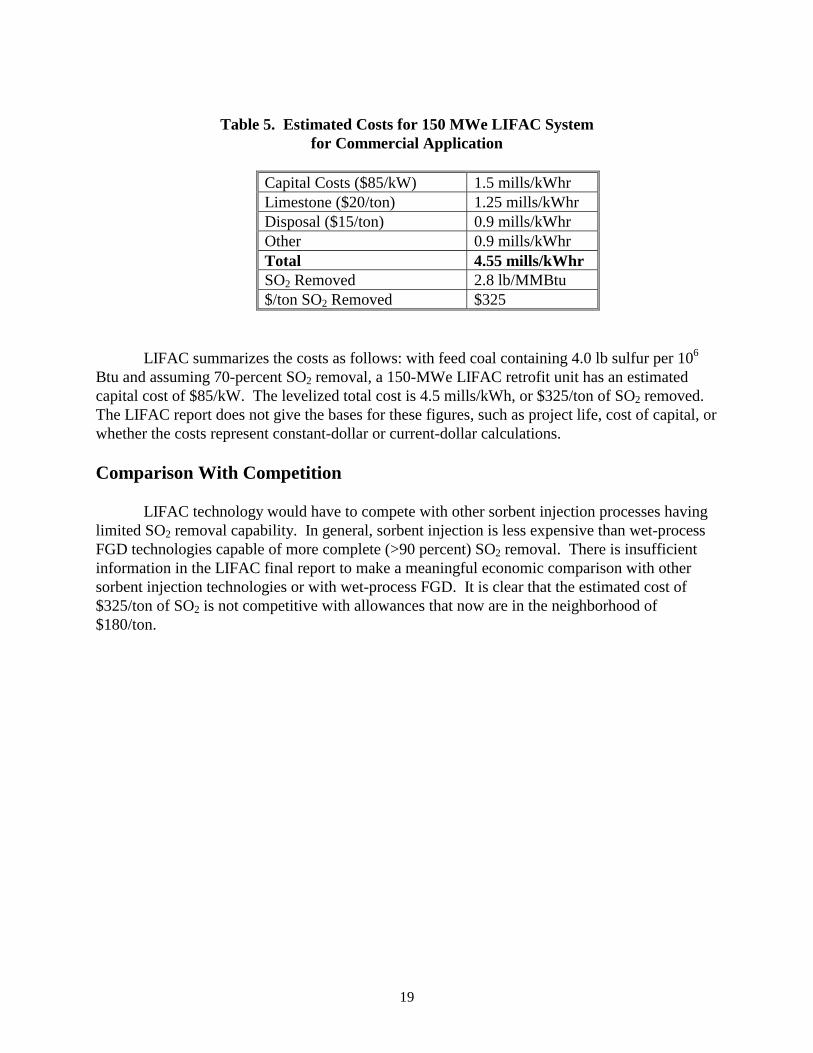
Capital Costs ($85/kW) 1.5 mills/kWhrLimestone ($20/ton) 1.25 mills/kWhrDisposal ($15/ton) 0.9 mills/kWhrOther 0.9 mills/kWhrTotal 4.55 mills/kWhrSO2 Removed 2.8 lb/MMBtu$/ton SO2 Removed $325
LIFAC summarizes the costs as follows: with feed coal containing 4.0 lb sulfur per 106
Btu and assuming 70-percent SO2 removal, a 150-MWe LIFAC retrofit unit has an estimatedcapital cost of $85/kW. The levelized total cost is 4.5 mills/kWh, or $325/ton of SO2 removed. The LIFAC report does not give the bases for these figures, such as project life, cost of capital, orwhether the costs represent constant-dollar or current-dollar calculations.
Comparison With Competition
LIFAC technology would have to compete with other sorbent injection processes havinglimited SO2 removal capability. In general, sorbent injection is less expensive than wet-processFGD technologies capable of more complete (>90 percent) SO2 removal. There is insufficientinformation in the LIFAC final report to make a meaningful economic comparison with othersorbent injection technologies or with wet-process FGD. It is clear that the estimated cost of$325/ton of SO2 is not competitive with allowances that now are in the neighborhood of$180/ton.
20
V Conclusions
The results of the LIFAC CCT demonstration project are summarized as follows:
C Overall SO2 removal of 70 percent was demonstrated in long-term testing at a Ca/S molarratio of 2.0, an approach-to-saturation temperature of about 10 EF, and a limestonefineness of 80 percent < 325 mesh.
C Extrapolating the performance data indicates that reducing the approach-to-saturationtemperature to 5 EF and increasing the ash recycle ratio would result in higher overallSO2 removal, potentially up to the target level of about 85 percent.
C The projected levelized cost for a commercial 150-MWe LIFAC retrofit unit is about$325/ton of SO2 removed, assuming 70-percent SO2 removal, a Ca/S molar ratio of 2.0,and an approach-to-saturation temperature of 10 EF with a limestone fineness of 80percent < 325 mesh.
LIFAC technology may find a niche in the marketplace, but is unlikely to do so at presentsince there is very little activity in installing FGD systems in the United States.
21
VI Abbreviations
CAAA Clean Air Act Amendments (of 1990)
CaCO3 limestone, calcium sulfite
Ca(OH)2 hydrated lime
CaSO4 calcium sulfate
CaO lime
CCT clean coal technology
DOE U.S. Department of Energy
EPRI Electric Power Research Institute
ESP electrostatic precipitator
FGD flue gas desulfurization
LIFAC limestone injected into the furnace with activation of untreated calcium oxide
POC proof of concept
RP&L Richmond Power and Light Company
SCA specific collection area
SO2 sulfur dioxide
SO3 sulfur trioxide

22
VII References
Hervol, J., R. Easler, J. Rose, and J. Viiala, 1992, LIFAC Sorbent Injection for Flue GasDesulfurization, ICF Kaiser and Tampella, presented First Annual Clean Coal TechnologyConference, Cleveland, OH, September 1992.
ICF North America, 1998, LIFAC Demonstration at Richmond Power and Light WhitewaterValley Unit No. 2, Final Report, Volume 1: Public Design, and Volume 2: Project Performanceand Economics.
LIFAC North America, Inc., 1990, LIFAC Sorbent Injection Desulfurization DemonstrationProject, Comprehensive Report to Congress, Clean Coal Technology Program, proposed byLIFAC North America, Inc., U.S. Department of Energy.
Viiala, J., T. Pokki, J. Hervol, and I. Huffman, 1993, LIFAC Sorbent Injection for Flue GasDesulfurization, Tampella, ICF Kaiser, and RP&L, presented at the Second Annual Clean CoalTechnology Conference, Atlanta, GA, September 1993.
U.S. Department of Energy, 1996, Clean Coal Today, U.S. Department of Energy, Issue No. 21.
U.S. Department of Energy, 1999, Clean Coal Technology Demonstration Program, ProgramUpdate, March 1999.
Viiala, J., J. Hervol, and C. Keating, 1994, Commercialization of the LIFAC Sorbent InjectionProcess in North America, Tampella and ICF Kaiser, presented at the Third Annual Clean CoalTechnology Conference, Chicago, IL, September 1994.