life cycle assessment of disposable and reusable nappies
TRANSCRIPT
Delivering sustainable solutions in a more competitive world
Life Cycle Assessment of Disposable and Reusable Nappies Draft Final Report September 2007

Environment Agency
Life Cycle Assessment of Disposable and Reusable Nappies: Draft Final Report
September 2007
Reference: 0043870
This report has been prepared by Environmental Resources Management the trading name of Environmental Resources Management Limited, with all reasonable skill, care and diligence within the terms of the Contract with the client, incorporating our General Terms and Conditions of Business and taking account of the resources devoted to it by agreement with the client. We disclaim any responsibility to the client and others in respect of any matters outside the scope of the above. This report is confidential to the client and we accept no responsibility of whatsoever nature to third parties to whom this report, or any part thereof, is made known. Any such party relies on the report at their own risk.

CONTENTS
1 INTRODUCTION AND SCOPE OF THE STUDY 1
1.1 PRODUCT SYSTEMS AND SYSTEM BOUNDARIES 2 1.2 DISPOSABLE NAPPY SYSTEM 2 1.3 HOME LAUNDERED REUSABLE NAPPY SYSTEMS – SHAPED AND PREFOLD 5 1.4 INCLUSIONS/EXCLUSIONS 10 1.5 KEY ASSUMPTIONS AND LIMITATIONS 11 1.6 DATA REQUIREMENTS 11 1.7 INVENTORY ANALYSIS AND IMPACT ASSESSMENT 12
2 INVENTORY DATA FOR SHAEPED REUSABLE 13
2.1 SHAPED NAPPY NUMBER, WEIGHT AND MANUFACTURE 13 2.2 WRAPS 13 2.3 WASHING DATA 13
3 INVENTORY DATA FOR DISPOSABLE NAPPY 20
3.1 DISPOSABLE NAPPY NUMBER, WEIGHT AND MANUFACTURE 20 3.2 WASTE MANAGEMENT 20
4 RESULTS 22
4.1 SHAPED NAPPIES 22 4.2 DISPOSABLE NAPPIES 25 4.3 COMPARISON 25 4.4 SCALE OF IMPACTS 28
ENVIRONMENTAL RESOURCES MANAGEMENT DEFRA/EA/WRAP
1
1 INTRODUCTION AND SCOPE OF THE STUDY
This study builds on the Environment Agency’s Life Cycle Assessment of Disposable and Reusable Nappies in the UK, ISBN: 1-84-432427-3. Environmental Resources Management (ERM) has been asked by Department for Environment, Food and Rural Affairs (Defra), the Environment Agency and Waste Resources Action Programme (WRAP) to update the study by assessing the changes in the environmental profile of disposable and reusable nappies that have resulted from developments in the manufacture and use of disposable and reusable nappies systems in the UK since 2002/03. Developments and issues to be addressed in the study include: further weight reduction of disposable nappies; the inclusion of shaped nappies; the changed energy efficiency and different usage of washing machines and driers; and changes to waste disposal options including the use of reusable nappies for a second child. For this study we are aiming to obtain: • updated energy generation data; • updated energy consumption data for washing machines and tumble
driers; • updated manufacturing data for disposables and prefold nappies; • updated waste management data for disposables; and • new manufacturing data for shaped nappies. The goal of the study has been split into the following objectives: • to update the previous study (1) with changes in the market place between
2002/03 and 2006, and to include an assessment of the effects of a range of behavioural assumptions on the life cycle environmental impacts of the re-usable nappy types and to compare these with each other and with modern disposable nappies;
• to compile a detailed life cycle inventory of the environmental burdens
associated with the production, use and disposal of shaped and prefold reusable nappies and disposable nappies; and
• to use the life cycle inventory data to compare the environmental impacts
arising from reusable and disposable nappies under the various scenarios considered.
(1) Life Cycle Assessment of Disposable and Reusable Nappies in the UK, Environment Agency, ISBN: 1-84-432427-3

ENVIRONMENTAL RESOURCES MANAGEMENT DEFRA/EA/WRAP
2
The study will help to inform the audience about the significance and scale of the environmental impact of nappies generally, as well as and how actions that can be and have been undertaken by manufacturers and users of nappies affect the environmental profiles. The project board has agreed that we will consider up to 10 scenarios; four for disposable nappies and six for reusable nappies. The scope of the study is consistent with the previous study with the exception of the updated data above and that the study is to reflect potential impacts in 2006. The functional unit used is the same as that used in the previous study (1), is appropriate to the goals of the study, and is defined as “the use of nappies during the first two and a half years of a child’s life”. This functional unit will result in a specific quantity of disposable and reusable nappies used within the time period of two and a half years. The reason for focussing on the first two and a half years is that by this point nappy use is tailing off, and beyond this point nappy use varies considerably because children are at different stages of toilet training. Although they may still use training pants and or overnight nappies for a period beyond this point, the use of these types of products is outside the scope of this study.
1.1 PRODUCT SYSTEMS AND SYSTEM BOUNDARIES
The nappy systems assessed will include all life cycle stages. All energy and materials used will be traced back to the extraction of resources. Emissions from each life cycle stage will be quantified. Waste management and waste water treatment processes and their environmental releases will be included.
1.2 DISPOSABLE NAPPY SYSTEM
Disposable nappies typically consist of a plastic outer layer with integral fastenings, a core of absorbent materials with a protective top layer. The nappy core is composed of fluff pulp (cellulose fibre) and a water absorbant polymer, sodium polyacrylate (SAP). The function of the core is to absorb liquid excreta. The top layer is made up of a ‘non-woven’ polymer-based material with a textile structure. From the top layer, the fluids flow through a pulp-based tissue layer down to the core. Leakage is prevented by a plastic bottom layer and by elastic barriers. The nappy is prevented from falling off by rubber waist elastics and is fastened around the child’s waist by velcro like materials. The different materials in the nappies are glued together with polymer-based adhesives. The packaging consists of polyethylene plastic bags and corrugated board boxes.
(1) Life Cycle Assessment of Disposable and Reusable Nappies in the UK, Environment Agency, ISBN: 1-84-432427-3

ENVIRONMENTAL RESOURCES MANAGEMENT DEFRA/EA/WRAP
3
The nappies are distributed from the manufacturers either directly to retailers, or via distribution centres maintained by the manufacturers. The retailers are grocery chains, independent grocers or chemists. Customers pick up their nappies at the retailer and transport them home for use. Used nappies (containing excreta) are discarded along with other municipal waste and will later on end up disposed either to landfill, mechanical and biological treatment (MBT) or to incineration. The main disposable nappies in the UK are very similar in terms of composition and use. We combined the composition and weight of nappies sold in the UK in a particular year and calculated the ‘average nappy’. This average nappy will take into account the fact that the size of the nappies used over the baby’s first two and a half years will change depending on the baby’s age and size. Most of the disposable nappies that are sold in the UK are also manufactured in the UK, although several raw materials are acquired from other European countries or from North America. These considerations will be included in the study. Table 1.1 presents the average composition of a UK disposable nappy for 2006.
Table 1.1 Average UK Disposable Nappy Composition and Weight (2006)
Average unit weight
Fluff pulp SAP PP LDPE Adhesives PET/polyester Other
g % % % % % % % 38.6 34.1 32.4 16.6 6.0 3.8 2.2 4.8
Using the average of 4.16 nappies used per day from the previous study and an average nappy weight of 38.6g, this would amount to an average child using 146.5kg of nappies over the two and a half years. The manufacturers of disposable nappies have provided manufacturing data which represents 2006. This was used to generate an average manufacturing plant based on market share. The study will include all the significant processes, tracing material and energy flows to the point where material and energy are extracted or emitted to the natural environment. Due to the complexity of the product system it is impractical to draw a full system diagram that includes all processes where human influence occurs. Figure 1.1 details the main life cycle stages that will be included in the life cycle of disposable nappies.

ENVIRONMENTAL RESOURCES MANAGEMENT DEFRA/EA/WRAP
4
1.2.1 Disposable Scenarios
For the disposable nappy systems alternative scenarios are limited as these would require action from the manufacturers and or action from local authorities for alternative waste management provision. The manufacturers have reduced the environmental impact of nappies through product design and development. Since 2001-2002 the industry has achieved a 11.3% weight reduction through nappy design and development of materials. It is expected by the industry that this scale of reduction will continue in the short term. We have assessed the potential implication of future light weighting as a sensitivity analysis. Alternative waste management routes available for disposable nappies include separate collection for anaerobic digestion or recycling and diversion with household waste through MBT. Examples of operators of recycling or digestion schemes include: • Almere (diaper biowaste household collection and biodigesting) project in
Holland; and • Knowaste LLC who have reported diaper recycling programs in the
European Union, Asia and North America. Due to a lack of detailed process data for nappies in these processes we have been unable to model and assess the impacts of these.

ENVIRONMENTAL RESOURCES MANAGEMENT DEFRA/EA/WRAP
5
Figure 1.1 System Boundary for the Disposable Nappy System
1.3 HOME LAUNDERED REUSABLE NAPPY SYSTEMS – SHAPED AND PREFOLD
In the previous study Terry and Prefold nappies were assessed as these were found to be the most popular in 2001. However, subsequent market analysis by WRAP (pers. comm. Julian Parfitt, WRAP) indicates that shaped and prefold
Nb. the main transport steps between processes and life cycle stages will be included in the assessment. Waste management associated with production and the supply chain will also be included in the assessment.
T
Packaging Production
Disposable Nappy Production
Electricity Generation
LandfillWaste Recycling
TRetail
Use
Waste Recycling
T
LandfillIncineration
Environment: Resources
Environment: Air, Land and Water
ENERGY
SUPPLY
SYSTEMS
OTHER
PRODUCT
SYSTEMS
Timber production
Pulp Production & Bleaching
Production of Feedstock Polymers
SAP Production
Production of Plastic
Components
Acrylic Acid Production
NaOH Production
T
T
T TT
T T
T
T
T
T
T
Packaging Production
Disposable Nappy Production
Electricity Generation
LandfillWaste Recycling
TRetail
Use
Waste Recycling
T
LandfillIncineration
Environment: Resources
Environment: Air, Land and Water
ENERGY
SUPPLY
SYSTEMS
OTHER
PRODUCT
SYSTEMS
Environment: Resources
Environment: Air, Land and Water
ENERGY
SUPPLY
SYSTEMS
OTHER
PRODUCT
SYSTEMS
Environment: Resources
Environment: Air, Land and Water
ENERGY
SUPPLY
SYSTEMS
OTHER
PRODUCT
SYSTEMS
Timber production
Pulp Production & Bleaching
Production of Feedstock Polymers
SAP Production
Production of Plastic
Components
Acrylic Acid Production
NaOH Production
T
T
T TT
T T
T
T
T
T

ENVIRONMENTAL RESOURCES MANAGEMENT DEFRA/EA/WRAP
6
nappies are now the market leaders. This study considers home laundered shaped nappies. It was intended to include prefolds, however no updated manufacturing data was forthcoming. Reusable cotton nappies come in a number of types. Nearly all fitted and fastened with poppers and or velcro straps instead of pins. The different nappy systems that can be divided into the following categories: • all-in-ones - shaped, fitted nappies with velcro or popper fastenings,
which include a waterproof cover. No folding or pinning is required. • shaped nappies - similar to all-in-ones, but wraps or pants have to be
purchased separately to provide the waterproof cover. These do not require folding. They are fastened by velcro or poppers.
• prefolds - requires folding and a separate waterproof wrap/pant, with
fasteners used in some cases. All-in-ones and shaped nappies are generally considered easier to use than flat/prefold nappies, in that no folding is required. Shaped nappies either have velcro or popper fastenings, or rely solely on the wrap/pant to hold them in place. Prefold nappies are made from woven cotton and consist of a large rectangle of fabric that has been folded and stitched into three panels, the centre panel being thicker than the two outer panels. Prefolds are considered to be easier to dry than all-in-ones and shaped nappies. Wraps/pants are used to hold up nappies and to prevent leakage. They are made from different materials and combinations of materials, such as: nylon; polyester; cotton; wool; PVC; EVA; hemp; and polyurethanes. Wraps/pants are not considered as durable as nappies to washing, drying and wear, and hence they may need to be replaced. For any given size, the frequency is dependent on the care they receive. Following manufacturers’ care guidance is essential for maximising their life. Some wraps/pants are adjustable and are designed for use from birth to potty; others are replaced when necessary to fit a growing baby. Generally, three different sizes will be needed over the two and a half years. In combination with the nappies and wraps/pants, parents can use liners and booster pads to improve performance and ease of cleaning. Liners are used to provide a drier layer between the baby and the absorbent nappy and assist in containment of faecal matter for ease of cleaning. Liners come in reusable or disposable forms. Materials used include paper, polypropylene, fleece and silk. It is sometimes necessary to boost the performance of a nappy by using booster pads. The study has not considered booster pads in the assessment.

ENVIRONMENTAL RESOURCES MANAGEMENT DEFRA/EA/WRAP
7
The major retail routes for reusables appear to be through high street shops, mail order and via the internet. Figure 1.2 details the main life cycle stages that will be included in the life cycle of home laundered shaped (sized) nappies. All key material, energy and waste streams will be traced to the point at which environmental flows cross the boundary. Reusable nappies are sold in birth to potty packs and we will use samples of these packs together with data provided by suppliers to specify reusable nappy consumption. Table 1.2 and Table 1.3 detail the contents of two examples of birth to potty packs, prefold and shaped. Manufacturers of each type of reusable nappies were contacted for manufacturing data through the Nappy Alliance.
Figure 1.2 System Boundary For Home Laundered Reusable Nappy System`
Nb. the main transport steps between processes and life cycle stages will be included in the assessment. Waste disposal associated with production and the supply chain will also be included in the assessment.
Detergent Manufacture
Consumer Use
Retail and Distribution
Packaging Waste Disposal
Nappy Construction
Sewage Treatment
Cotton Cultivation and
HarvestingCotton Ginning Cotton
Spinning
Fabric Production and Wet Processing
Wrap and Liner Manufacture
Other Nappy Construction
Materials
Packaging Production
Water Treatment and
Supply
Fertiliser and Pesticide
Production
Environment: Resources
Environment: Air, Land and Water
ENERGY
SUPPLY
SYSTEMS
OTHER
PRODUCT
SYSTEMS
T
T
T T
T
T
T
T

ENVIRONMENTAL RESOURCES MANAGEMENT DEFRA/EA/WRAP
8
Table 1.2 Prefold Birth to Potty Pack
Item Weight per item
(grams) No of items Material Total
(grams) Nappy pads size 1 67.3 24 cotton 1616 Nappy pads size 2 101.7 24 cotton 2440 Nappy pads size 3 118 18 cotton 2124 Packaging pads size 1 8 4 LDPE 32 Packaging pads size 2 10 4 LDPE 40 Packaging pads size 3 10 3 LDPE 30
Nappy cover size 1 38 8 80% Polyester/ 20% Polyurethane 304
Nappy cover size 2 46 8 80% Polyester/ 20% Polyurethane 368
Nappy cover size 3 58 6 80% Polyester/ 20% Polyurethane 348
Cotton bottoms Liner x 200 290 4 200 liners per roll 1160
Trainer pants 64 2 65% Polyester/35% Polyurethane 128
Waterproof bag 72 1 100% Nylon, Polyurethane coating 72
Nappy cleanser powder 544 2
Sodium carbonate 15-30% Sodium percarbonate 15-30% Organic sequestering agents 5-15% Anionic surfactant <5% Cellulose colloids <5% T.A.E.D activator <5% 1088
Nappy cleanser powder packaging 24.5 2
cardboard (looks like recycled content) 49
Night-time booster pads 200 1 no material labelling 200
Box 450 1 corrugated board, brown, 1 layer 450
Total 112
10449

ENVIRONMENTAL RESOURCES MANAGEMENT DEFRA/EA/WRAP
9
Table 1.3 Shaped Birth to Potty Pack
Weight per item
(grams) No of items Material Total
(grams) Nappy size 1 132 15 95.5% Cotton 4.5% velcro 1980 Nappy size 2 164 15 96.7% Cotton 3.7% velcro 2460 Packaging size 1 42 1 LDPE (15 nappies/bag) 42 Packaging size 2 38 1 LDPE (15 nappies/bag) 38
Wrap size S 54 4 Same composition assumed as for size L, see below 216
Packaging wrap size S 8 1 LDPE (4 wraps per package) 8
Wraps size M 58 4 Same composition assumed as for size L, see below 232
Packaging wraps size M 8 1 LDPE (4 wraps per package) 8
Wraps size L 58 4
Analysed: 6 g velcro; 4g lining (unidentified plastic material); 30 g unidentified plastic laminated fabric material; 18 g cotton (all per wrap) 232
Packaging wraps size L 8 1 LDPE (4 wraps per package) 8
Liners 138 20 Paper; 14 gram/10 liners = 100 liners per roll 2760
Packaging liners 42 1 LDPE (20 rolls/bag) 42 Total 68 8026
1.3.1 Home Laundered Scenarios to be Assessed
Using the survey results previously commissioned by the Environment Agency and supplier recommendations, a number of use scenarios have been developed with the agreement of the Project Board. These scenarios are presented in Table 1.4. The scenarios demonstrate the environmental benefits is separate user choices, such as reduced temperature washing, using more energy efficient appliances and high/low utilisation of tumble driers.

ENVIRONMENTAL RESOURCES MANAGEMENT DEFRA/EA/WRAP
10
Table 1.4 Cloth Behaviour Scenarios to be Assessed
Dry Pailing Pre-Rinse Nappy Wash Temp
Tumble Drying
Load Energy Efficiency
Wrap Washing with Nappies
Wrap Washing at 40 with other clothes
Scenario 1 Baseline
Yes Yes 60C MTP average??
tbc MTP average Yes No
High efficiency Yes Yes 60C MTP average Tbc A+ rated Yes No Full load Yes Yes 60C MTP average MTP average
full load MTP average Yes No
High Temp Yes Yes 90C MTP average Tbc MTP average No Yes 100% Tumble Drying
Yes Yes 60C 100% Tbc MTP average Yes No
0% Tumble drying
Yes Yes 60C No Tbc MTP average Yes No
50% reused Yes Yes 60C MTP average Tbc MTP average Yes No Note: Unlike the previous study where 9.5% of users were found to iron nappies we have assumed for this assessment that no ironing occurs.
1.4 INCLUSIONS/EXCLUSIONS
As in the previous study, and in line with accepted LCA practice, we have excluded capital equipment and workforce burdens from both reusable and disposable systems.
1.4.1 Excreta
Excreta is considered within the system boundaries when comparing disposable and reusable nappy systems. The main reason for this is that both nappies and the excreta undergo completely different types of waste treatment due to the different characteristics of the systems. For disposable nappies we believe it is reasonable to assume that all excreta will be disposed together with the nappies. Consequently, excreta will follow the household waste stream all the way from the nappy waste bin in the home to landfill and incineration facilities in the UK. For users of home laundered reusable nappies a proportion of the excreta will be flushed down the toilet, together with soiled disposable liners, before the nappies are washed. This effluent will enter the sewerage system. The remaining excreta will also enter the sewerage system through the washing machine outflow. Sewage treatment has been modelled on the basis of typical sewage treatment processes in the UK.

ENVIRONMENTAL RESOURCES MANAGEMENT DEFRA/EA/WRAP
11
1.5 KEY ASSUMPTIONS AND LIMITATIONS
Changes to the assumptions in the previous study have been recorded and reported in this report.
1.6 DATA REQUIREMENTS
In addition to collecting data describing the manufacture of the nappy types to be assessed, the following are identified as key elements for which new inventory data were required: • UK electricity generation (2005-2006) by type (eg coal, gas, nuclear, hydro,
wind etc.); • washing machine performance; • tumble drier performance; and • waste management.
1.6.1 Disposable Nappy Systems
The manufacturers of disposable nappies have supplied data describing the average composition and weight of a disposable nappy in 2006, and the average manufacture of disposable nappies. Material life cycle inventories associated with the manufacture of disposables are the same as those provided previously by EDANA. The WRATE software and supporting literature has been used to model the disposal of disposable nappies, replacing the WISARD software previously used.
1.6.2 Home Laundered Reusable Nappy System
In agreement of the Project Board, ERM has agreed the type of nappies to be assessed and the use scenarios to be assessed. For the specified nappy types, shaped and prefold, ERM has purchased birth to potty packs. These have been used along with manufacturing data to specify a typical composition and weight of each nappy type and their associated wraps. To assist ERM in defining the manufacturing process for the reusable nappy system, a survey of nappy manufactures has been undertaken. ERM provided questionnaires to manufactures, WRAP and the reusable industry representatives. ERM has sourced data from the Market Transformation Programme (MTP) UK data for washing machine and tumble drier performance. The data collection for reusable nappies for this study has been limited to:

ENVIRONMENTAL RESOURCES MANAGEMENT DEFRA/EA/WRAP
12
• manufacturing data for nappies, wraps and liners; and • updated energy and water consumption data for washing machines and
tumble driers. We have amended the behavioural data that the Environment Agency found from the surveys it commissioned for the previous study to reflect the scenarios as described. All other data used to model the scenarios described above has been extracted from the previous study.
1.6.3 Data Quality Requirements
The key requirements regarding data quality are that data are as accurate and representative as possible of nappies used in the UK in 2006. Data have been collected from the following sources: • questionnaires and interviews with experts regarding the foreground
system;
• validated life cycle inventory databases for the background system;
• literature for the background system;
• Time to Change?: A Study of How Parents and Carers Use Disposable and Reusable Nappies (Environment Agency Science Report), ISBN: 978-1844324521; and
• Life Cycle Assessment of Disposable and Reusable Nappies in the UK, Environment Agency, ISBN: 1-84-432427-3.
The data collected and used for this study have been documented and assessed with regards to quality. The data used have been selected on the basis of availability and on how representative they are of nappy systems in the UK in 2006.
1.7 INVENTORY ANALYSIS AND IMPACT ASSESSMENT
Similar inventory analysis and impact assessment methods as in the previous study will be used for this study. We have reported significant inventory items such as energy and water use separately. All new data and assumptions will be documented.

ENVIRONMENTAL RESOURCES MANAGEMENT DEFRA/EA/WRAP
13
2 INVENTORY DATA FOR SHAEPED REUSABLE
2.1 SHAPED NAPPY NUMBER, WEIGHT AND MANUFACTURE
Based on two complete sets of manufacturing data for shaped nappies and the specifications of further popular shaped nappies, an average weight of 139.3g per nappy has been assumed. The nappies are 100% cotton. We have assumed, based on the birth to potty pack and guidance from other suppliers that a minimum of thirty nappies are required over the 2.5 year period that a child is in nappies.
2.2 WRAPS
Based on the birth to potty pack for shaped and a survey of two other wrap types, we have assumed an average wrap weight of 47.6g and that 12 are required for the 2.5 years. Only one complete set of manufacturing data for wraps was obtained and has been used in the assessment. The composition of these wraps was: 21% cotton; 39%; polyester; and 40% polyurethane.
2.3 WASHING DATA
We have used data relating domestic washing and drying using data that represent 2005 and 2006 in the UK. These data were primarily sourced from Defra’s Market Transformation Programme (MTP) from the online ‘What if? Tool’. The tool provides forecast data from 1999 up to 2020 for the consumption of electricity and water for washing machines (WMs), washer/driers (WDs) and tumble driers (TDs). Based on these data, ERM has calculated domestic washing and drying performance in the UK for the following: • UK stock average performance for:
- water use; and - electricity use.
• UK most efficient performance for:
- water use; and - electricity use.

ENVIRONMENTAL RESOURCES MANAGEMENT DEFRA/EA/WRAP
14
2.3.1 Summary of Washing and Drying Performance
Table 2.1 shows the electricity and water use figures for washing used by ERM in the study. We have calculated these figures based on more detailed data shown in Section 2.3.2. The stock average figures represent the market average performance for washing machines and washer/driers based on electricity and water consumption per energy label class. The numbers in Table 2.1 exclude electricity and water consumption for a pre-rinse cycle. We have estimated an average pre-wash cycle, based on an Öko-Institut (2005) life cycle assessment study of washing machines in Germany. We have assumed a pre-wash is run as cold wash and consumes a minimum quantity of electricity and water, as shown in Table 2.2. We have assumed a pre-wash is used before every washing cycle.
Table 2.1 Summary of UK Washing Performance
Washing Temperature
Electricity Use: Stock Average
Water Use: Stock Average
Electricity Use: A+ Rated Washing
Machine
Water Use: A+ Rated Washing
Machine oC kWh per load litres per load Kwh per load litres per load 40 0.74 78 0.60 53 60 1.04 78 1.00 53 90 1.85 78 1.66 53
Table 2.2 Pre- Washing Performance
Washing Temperature Electricity Use: Average
Water Use: Average
oC kWh per load litres per load 20 0.25 35
Source: (Öko-Institut, 2005) Note: Data provided in the Öko-Institut report provides an estimate for a minimum electricity and water consumption per load. We have assumed this to be equivalent to a pre-rinse cycle. Table 2.3 shows the electricity and water use figures for drying. We have calculated these figures based on more detailed data shown in Section2.3.3. The stock average figures represent the market average performance for washer/driers and tumble driers based on electricity and water consumption per energy label class.
Table 2.3 Summary of UK Drying Performance
Electricity Use: Stock Average
Water Use: Stock Average
Electricity Use: A-Rated Tumble
Drier
Electricity Use: Stock Average A-Rated Drier
kWh per load litres per load kwh per load kwh per load 2.99 19 1.71 1.88

ENVIRONMENTAL RESOURCES MANAGEMENT DEFRA/EA/WRAP
15
2.3.2 UK Washing Data and Assumptions
We have presented here the data used to calculate the UK washing performance, including data for the following: • washer stocks; • washer energy consumption; • washer water consumption; and • washer load size. Washer Stocks
Table 2.4 shows a breakdown of stocks of washing machines and washer/driers for the UK in 2005/06 according to energy class.
Table 2.4 UK Washer Stocks 2006
Type Model Stock 2006 Washing machines A+ rated 720 011 A rated 7 724 644 B rated 4 018 681 C rated 3 135 109 D rated 663 254 E rated 234 888 F rated 110 332 Other 3 734 567 Total 20 341 485 Washer/driers A+ rated - A rated 32 962 B rated 541 715 C rated 1 086 161 D rated 1 103 089 E rated 150 972 F rated 826 237 G rated 239 938 Total 3 981 075 Source: (MTP, 2007) Washer Water and Energy Consumption
Table 2.5 shows the consumption of electricity for washing machines per load according to energy class in 2006. Table 2.6 shows the water consumption of washing machines by energy class. UK stock average consumption figures were calculated based on these data.
Table 2.5 Washing Machine Energy Consumption per Load by Energy Class
Energy Class A+ A B C D E F kWh kWh kWh kWh kWh kWh kWh 90°C 1.66 1.77 1.77 1.86 2.32 2.5 2.69 60°C 1.00 1.06 1.06 1.12 1.39 1.50 1.61 40°C 0.60 0.64 0.64 0.67 0.83 0.90 0.97 Source: (MTP, 2007a)

ENVIRONMENTAL RESOURCES MANAGEMENT DEFRA/EA/WRAP
16
Table 2.6 Washing Machine Water Consumption per Load by Energy Class
Energy class A+ A B C D E F G litres litres litres litres litres litres litres litres 60° - 53 61 75 86 94 109 163 Adjusted for reduced load
- 46 53 65 75 82 95 142
Source: (MTP, 2007a) From testing conducted by MTP, a typical consumer wash is usually less than a full load, using 13% less water. Table 2.6 accounts for this reduced water use. Washer/Driers
Table 2.7 and Table 2.8 shows the consumption of electricity and water for washer driers per load according to energy class in 2005/06. Data were not available for washing energy consumption. We have assumed that an average washer/drier has the same electricity consumption as a B-rated washing machine per load. Additionally, water consumption data only covers energy ratings B to D. When calculating stock average water consumption we have only considered these energy ratings. Other ratings were excluded. This assumption covers approximately 70% of washer/driers on the market.
Table 2.7 Washer/Drier Energy Consumption for Washing per Load by Energy Class
Stock Average kWh 90°C 1.77 60°C 1.06 40°C 0.64 Note: We have assumed that an average washer/drier has the same electricity consumption as a B-rated washing machine per load.
Table 2.8 Washer/Drier Water Consumption for Washing per Load by Energy Class
Energy class A+ A B C D E F G litres litres litres litres litres litres litres litres 60° - - 51 61 61 - - -
Source: (MTP, 2007a) Washing Load
In terms of washing load, according to MTP (2007a) the UK average washing machine load capacity is 5.6kg. Additionally, Table 2.9 shows the loads
ENVIRONMENTAL RESOURCES MANAGEMENT DEFRA/EA/WRAP
17
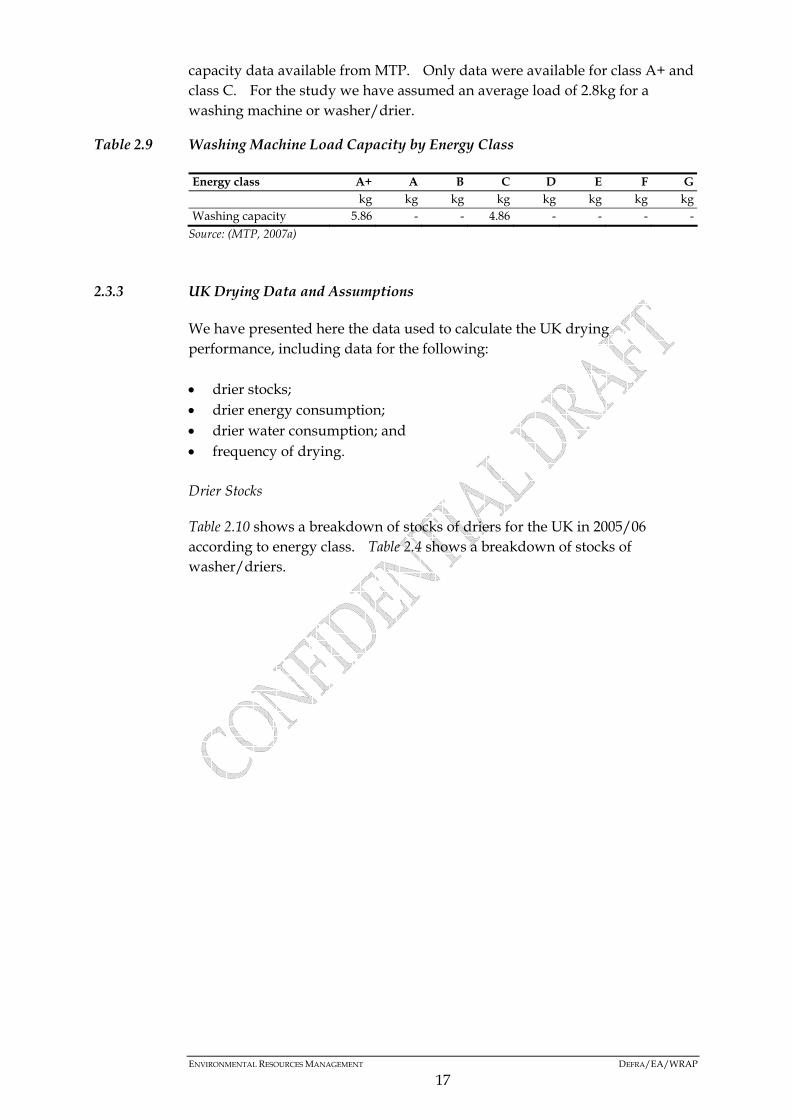
capacity data available from MTP. Only data were available for class A+ and class C. For the study we have assumed an average load of 2.8kg for a washing machine or washer/drier.
Table 2.9 Washing Machine Load Capacity by Energy Class
Energy class A+ A B C D E F G kg kg kg kg kg kg kg kg Washing capacity 5.86 - - 4.86 - - - -
Source: (MTP, 2007a)
2.3.3 UK Drying Data and Assumptions
We have presented here the data used to calculate the UK drying performance, including data for the following: • drier stocks; • drier energy consumption; • drier water consumption; and • frequency of drying. Drier Stocks
Table 2.10 shows a breakdown of stocks of driers for the UK in 2005/06 according to energy class. Table 2.4 shows a breakdown of stocks of washer/driers.

ENVIRONMENTAL RESOURCES MANAGEMENT DEFRA/EA/WRAP
18
Table 2.10 UK Drier Stocks 2006
Source: (MTP, 2007) Drier Water and Energy Consumption
Table 2.11 and Table 2.12 show the consumption of electricity for tumble driers and washer/driers per load according to energy class in 2006. Table 2.13 shows the water consumption of washer/dyers for the drying cycle. Washer/dyers consume water to aid the condensing process when drying. UK stock average consumption figures were calculated based on these data.
Table 2.11 Tumble Drier Energy Consumption per Load by Energy Class
Energy Class A B C D E F G kWh kWh kWh kWh kWh kWh kWh Vented 1.71 1.98 2.24 2.51 2.78 3.05 3.35 Condenser 1.84 2.14 2.45 2.75 3.05 3.35 3.69 Source: (MTP, 2007a)
Type Model Stock 2006 Condenser A+ rated - A rated B rated - C rated 2 202 156 D rated 543 447 E rated - F rated - Other - Total 2 745 605 Vented A+ rated - A rated 58 763 B rated - C rated 2 295 130 D rated 2 912 330 E rated 654 654 F rated - Other - Total 5 920 878 Vented compact A+ rated - A rated - B rated - C rated - D rated 236 685 E rated - F rated 337 092 Other 136 841 Total 710 618

ENVIRONMENTAL RESOURCES MANAGEMENT DEFRA/EA/WRAP
19
Table 2.12 Washer/Drier Energy Consumption for Drying per Load by Energy Class
Energy class A+ A B C D E F G kWh kWh kWh kWh kWh kWh kWh kWh Drying - 2.18 2.92 3.52 4.12 4.72 5.32 5.88
Source: (MTP, 2007a)
Table 2.13 Washer/Drier Water Consumption for Drying per Load by Energy Class
Energy class A+ A B C D E F G litres litres litres litres litres litres litres litres Drying - - 29 65 79 - - -
Source: (MTP, 2007a) Frequency of Drying
The total number of washing machines in the UK is 21 341 485 and 3 981 075 washer/driers. The total number of washing cycles per year per machine is predicted at 274 by MTP. Additionally, the total amount of tumble driers in the UK is 9 377 101. The total number of drying cycles per year per machine is predicted at 148 for tumble driers and 97 for washer/driers. Based on these data, ERM estimated that on average 26.6% of all washing cycles are followed by a drying cycle.
ENVIRONMENTAL RESOURCES MANAGEMENT DEFRA/EA/WRAP
20
3 INVENTORY DATA FOR DISPOSABLE NAPPY
3.1 DISPOSABLE NAPPY NUMBER, WEIGHT AND MANUFACTURE
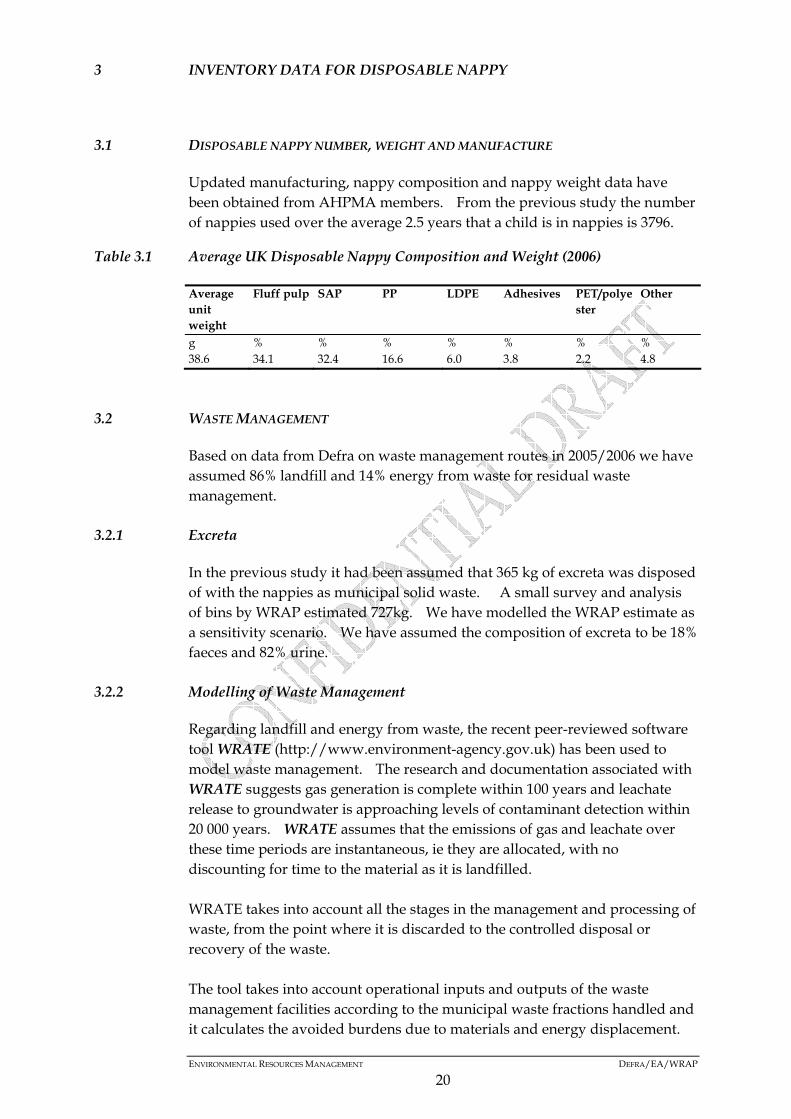
Updated manufacturing, nappy composition and nappy weight data have been obtained from AHPMA members. From the previous study the number of nappies used over the average 2.5 years that a child is in nappies is 3796.
Table 3.1 Average UK Disposable Nappy Composition and Weight (2006)
Average unit weight
Fluff pulp SAP PP LDPE Adhesives PET/polyester
Other
g % % % % % % % 38.6 34.1 32.4 16.6 6.0 3.8 2.2 4.8
3.2 WASTE MANAGEMENT
Based on data from Defra on waste management routes in 2005/2006 we have assumed 86% landfill and 14% energy from waste for residual waste management.
3.2.1 Excreta
In the previous study it had been assumed that 365 kg of excreta was disposed of with the nappies as municipal solid waste. A small survey and analysis of bins by WRAP estimated 727kg. We have modelled the WRAP estimate as a sensitivity scenario. We have assumed the composition of excreta to be 18% faeces and 82% urine.
3.2.2 Modelling of Waste Management
Regarding landfill and energy from waste, the recent peer-reviewed software tool WRATE (http://www.environment-agency.gov.uk) has been used to model waste management. The research and documentation associated with WRATE suggests gas generation is complete within 100 years and leachate release to groundwater is approaching levels of contaminant detection within 20 000 years. WRATE assumes that the emissions of gas and leachate over these time periods are instantaneous, ie they are allocated, with no discounting for time to the material as it is landfilled. WRATE takes into account all the stages in the management and processing of waste, from the point where it is discarded to the controlled disposal or recovery of the waste. The tool takes into account operational inputs and outputs of the waste management facilities according to the municipal waste fractions handled and it calculates the avoided burdens due to materials and energy displacement.

ENVIRONMENTAL RESOURCES MANAGEMENT DEFRA/EA/WRAP
21
The upstream limit of the system is the production of municipal waste. The model does not account for the energy and material costs of producing the products that make up the waste. The model covers municipal solid waste (MSW), which is comprised of household collected waste and the main civic amenity/bring system wastes. The tool takes account of waste collection and processing stages and their associated sub stages.
Table 3.2 Disposable Nappy Composition
Scenario Urine Faeces Plastics Pulp Miscellaneous kg Kg kg kg kg Original 299 66 84 50 13 WRAP Estimate* 596 131 84 50 13 *The same urine to faeces split is assumed

ENVIRONMENTAL RESOURCES MANAGEMENT DEFRA/EA/WRAP
22
4 RESULTS
4.1 SHAPED NAPPIES
Table 4.1 and Table 4.2 summarise a selection of the life cycle inventory environmental consumptions and flows for the manufacture and use of shaped nappies for each scenario.
Table 4.1 Electricity and Water Consumption
Electricity consumption Water consumption Washing Drying Ironing Washing Flushing Drying kWh kWh kWh l l l
1 Baseline 443.8 150.5 0 38879 12853 1576 2 High efficiency 430.1 86.1 0 18235 12853 1576 3 Full load 285.8 150.5 0 17311 12853 1576 4 High Temp 686.6 150.5 0 26886 12853 1576 5 100% Tumble Drying 443.8 565.7 0 26886 12853 5923 6 0% Tumble drying 443.8 0.0 0 26886 12853 0 7 50% Reuse 443.8 150.5 0 38879 12853 1576
These results indicate that the high temperature and 100% tumble drying scenarios, overall, have the largest inventory flows. This is primarily due to increased electricity consumption for washing or drying in consumer use. The scenario for 0% tumble drying generates the lowest profile in terms of inventory flows. This is primarily due to lower electricity consumption compared to other scenarios. Table 4.3 and Table 4.4 show the whole life impact profile for each of the shaped nappy scenarios. A similar pattern to the inventory results is followed. The high temperature and 100% tumble drying scenarios show the least beneficial environmental profile across all impact category indicators, compared to the baseline. The global warming potential has increased by 25% for the high temperature scenario and by 43% for 100% tumble drying scenario. The most beneficial scenarios, in terms of reduced global warming potential, relate to the full load and 0% tumble drying scenarios, which show a decrease in global warming potential of 20% and 19%, respectively. If an A+ rated washer and an A-rated drier are used, as shown by the high efficiency scenario, then the global warming potential is reduced by 12%, compared to baseline.

Table 4.2 Inventory Analysis for Each Shaped Nappy Scenario (manufacture and use excluding disposal)
Inventory Flow Coal (hard) Oil Natural gas Carbon dioxide (fossil)
Methane SOx NOx N2O Total water*
Water (direct)
kg kg m3 kg kg kg kg kg m3 m3 1 - Baseline 169.7 29 80 551 1.8 1.2 1.1 0.03 1263 53 2 - High efficiency 150.2 28 73 498 1.6 1.2 1.0 0.03 1166 33 3 - Full load 133.0 28 66 451 1.5 1.1 1.0 0.03 1087 32 4 - High temperature 219.7 30 101 688 2.2 1.3 1.2 0.04 1489 41 5 - 100% Tumble Dry 257.7 31 116 791 2.5 1.4 1.4 0.04 1662 46 6 - 0% Tumble Dry 135.5 28 67 458 1.5 1.1 1.0 0.03 1102 40 7 - 50% Re-use 162.4 27 75 520 1.7 1.1 1.0 0.03 959 53
*includes, hydro power requirements, power station cooling
Table 4.3 Impact Profile for Each Shaped Nappy Scenario (whole life – includes disposal)
Impact category Abiotic depletion Acidification Eutrophication Fresh water aquatic ecotoxicity
Global warming potential
Human toxicity Photochemical oxidation
kg Sb eq kg SO2 eq kg PO4--- eq kg 1,4-DB eq kg CO2 eq kg 1,4-DB eq kg C2H4 1 - Baseline 4.46 2.08 0.35 6.81 607 108 0.123 2 - High efficiency 4.04 1.98 0.34 6.02 550 98 0.118 3 - Full load 3.67 1.91 0.33 5.42 499 90 0.115 4 - High temperature 5.55 2.26 0.37 8.49 756 133 0.134 5 - 100% Tumble Dry 6.37 2.42 0.40 9.85 870 152 0.142 6 - 0% Tumble Dry 3.72 1.93 0.33 5.54 506 91 0.115 7 - 50% Re-use 4.21 1.88 0.32 6.57 575 105 0.116

Table 4.4 Impact Change (%) for Each Shaped Nappy Scenario Compared with Baseline
Impact category Abiotic depletion Acidification Eutrophication Fresh water aquatic ecotoxicity
Global warming potential
Human toxicity Photochemical oxidation
kg Sb eq kg SO2 eq kg PO4--- eq kg 1,4-DB eq kg CO2 eq kg 1,4-DB eq kg C2H4 1 - Baseline 4.46 2.08 0.35 6.81 607 108 0.12 2 - High efficiency -9% -5% -3% -12% -9% -9% -4% 3 - Full load -18% -8% -5% -20% -18% -17% -7% 4 - High temperature 24% 9% 6% 25% 25% 23% 8% 5 - 100% Tumble Dry 43% 17% 15% 45% 43% 41% 16% 6 - 0% Tumble Dry -17% -7% -6% -19% -17% -16% -6% 7 - 50% Re-use -6% -10% -8% -4% -5% -3% -6%
Note: red text indicates where impacts have increased compared to baseline.

ENVIRONMENTAL RESOURCES MANAGEMENT ENVIRONMENT AGENCY
4.2 DISPOSABLE NAPPIES
Table 4.5 summarises a selection of the life cycle inventory flows for the manufacture and use of disposable nappies for baseline and sensitivity scenarios. These results compare the baseline with the 10% light weighting sensitivity scenario. Unlike nappy care changes that can be made by users of reusable nappies, light weighting is not a change that can be achieved immediately and the results should be considered in this context. For all inventory flows, the results directly relate to the reduction in manufacturing material inputs, where a 10% reduction in weight gives a comparable reduction in the inventory flow. Table 4.6 and Table 4.7 shows the whole life impact profile for the disposable nappy baseline and sensitivity scenarios. As with the inventory results, all impact category indicators reduce for the 10% light weighting sensitivity scenario, compared to baseline. Across all impact categories, should the manufacturers deliver continued light weighting there is a beneficial reduction in impacts, which range from 5% to 9%. For global warming potential the 10% light weighting sensitivity scenario shows a 7% reduction in impact.
4.3 COMPARISON
Figure 4.1 shows the whole life impact profiles for all scenarios, including sensitivities, for the manufacture and use of shaped nappies and for disposable nappies. The results for the baseline scenarios, when comparing shaped nappies with disposables, show for some categories shaped nappies are more beneficial and for other disposables are more beneficial. For global warming potential, the disposable nappies have approximately 10% more beneficial global warming profile. If we consider abiotic resource depletion, then the shaped nappies and disposable nappies have an almost identical score.
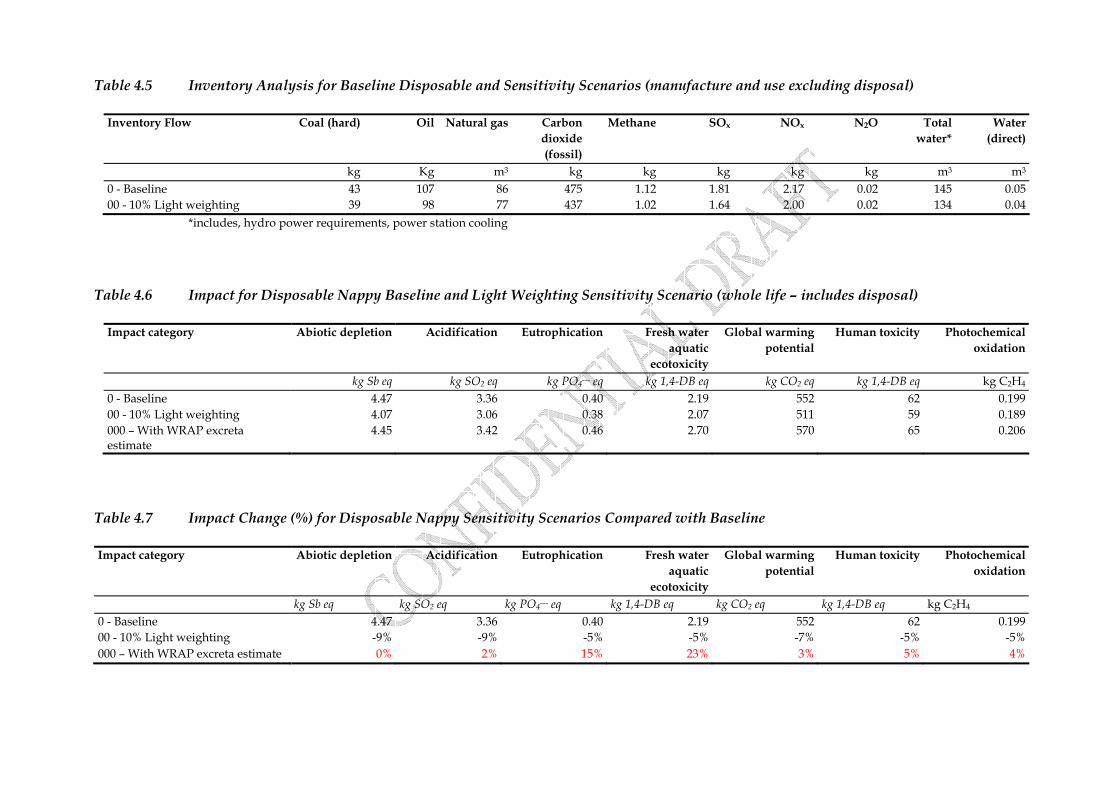
Table 4.5 Inventory Analysis for Baseline Disposable and Sensitivity Scenarios (manufacture and use excluding disposal)
Inventory Flow Coal (hard) Oil Natural gas Carbon dioxide (fossil)
Methane SOx NOx N2O Total water*
Water (direct)
kg Kg m3 kg kg kg kg kg m3 m3 0 - Baseline 43 107 86 475 1.12 1.81 2.17 0.02 145 0.05 00 - 10% Light weighting 39 98 77 437 1.02 1.64 2.00 0.02 134 0.04
*includes, hydro power requirements, power station cooling
Table 4.6 Impact for Disposable Nappy Baseline and Light Weighting Sensitivity Scenario (whole life – includes disposal)
Impact category Abiotic depletion Acidification Eutrophication Fresh water aquatic
ecotoxicity
Global warming potential
Human toxicity Photochemical oxidation
kg Sb eq kg SO2 eq kg PO4--- eq kg 1,4-DB eq kg CO2 eq kg 1,4-DB eq kg C2H4 0 - Baseline 4.47 3.36 0.40 2.19 552 62 0.199 00 - 10% Light weighting 4.07 3.06 0.38 2.07 511 59 0.189 000 – With WRAP excreta estimate
4.45 3.42 0.46 2.70 570 65 0.206
Table 4.7 Impact Change (%) for Disposable Nappy Sensitivity Scenarios Compared with Baseline
Impact category Abiotic depletion Acidification Eutrophication Fresh water aquatic
ecotoxicity
Global warming potential
Human toxicity Photochemical oxidation
kg Sb eq kg SO2 eq kg PO4--- eq kg 1,4-DB eq kg CO2 eq kg 1,4-DB eq kg C2H4 0 - Baseline 4.47 3.36 0.40 2.19 552 62 0.199 00 - 10% Light weighting -9% -9% -5% -5% -7% -5% -5% 000 – With WRAP excreta estimate 0% 2% 15% 23% 3% 5% 4%

Figure 4.1 Whole Life Impact Profile Comparison
0
0.1
0.2
0.3
0.4
0.5
0.6
0.7
0.8
0.9
1
Abiotic depletion Acidification Eutrophication Fresh water aquaticecotox.
Global warming(GWP100)
Human toxicity Photochemicaloxidation
1 - Baseline - 2006 Shaped Nappy Use 2 - High efficiency - 2006 Shaped Nappy Use3 - Full load - 2006 Shaped Nappy Use 4 - HIgh temp - 2006 Shaped Nappy Use5 - 100% TD - 2006 Shaped Nappy Use 6 - 0% TD - 2006 Shaped Nappy Use7 - 50% Re-use - 2006 Shaped Nappy Use 0 - 2006 Disposable 1 child 2.5 yrs 4.16 chan00 - 2006 10% LW Disposable 1 child 2.5 yrs 4.16 chan 000 - 2006 Disposable WRAP Excreta 1 child 2.5 yrs 4.16 chan

ENVIRONMENTAL RESOURCES MANAGEMENT ENVIRONMENT AGENCY
4.4 SCALE OF IMPACTS
In the UK there are approximately 1.7 (2001-2002) million children wearing nappies. If we consider the baseline scenarios for shaped nappies and disposables, this would equate to an estimated total global warming potential of 1.03 million tonnes of CO2 equivalents for shaped nappies and 0.94 million tonnes for disposables. This is a difference between the two nappy types of 94 thousand tonnes of CO2 equivalents (which is approximately equivalent 400 million passenger car miles (1)). Total greenhouse gas emissions for UK total approximately 700 million tonnes of CO2 equivalents. Similarly, if we look at direct water consumption associated with nappy wearing by 1.7 million children (ignores water consumed in production raw materials and in generating energy), we get an estimated total water use of 91 million m3 for shaped nappies, compared to 81 thousand m3 for disposables, for each baseline scenario. If we consider all water consumption the volume increases to 2 147 million m3 for shaped and 247 million m3 for disposables. The estimated scale of environmental improvement that can be achieved for each nappy system across the UK is illustrated below for a few examples: Shaped nappies: • a 20% reduction from full load washing would result in saving
approximately 178 thousand tonnes of CO2 equivalents and 3.1 million m3 of direct water use; and
• a 12% reduction from use of high efficiency appliances would result in
saving approximately 107 thousand tonnes of CO2 equivalents and 2.9 million m3 of direct water use.
Disposables: • a 10% reduction in nappy weight would result in saving approximately 69
thousand tonnes of CO2 equivalents and 8 thousand m3 of direct water use.
(1) Assuming 0.2kg of CO2 equivalents per mile driven for a passenger car.