life cycle assessment of li thium -ion b atteries for plug...
TRANSCRIPT
Life Cycle Assessment of Lithium-ion Batteries
for Plug-in Hybrid Buses Master of Science Thesis
YLVA OLOFSSON
MIA ROMARE
Department of Energy and Environment/ Department of Applied Physics
Division of Environmental Systems Analysis/ Division of Condensed Matter Physics
CHALMERS UNIVERSITY OF TECHNOLOGY
Gothenburg, Sweden, 2013
ESA Report No. 2013:5


Thesis in Applied Physics and Energy and Environment
REPORT NO. 2013:5
Life Cycle Assessment of Lithium-ion Batteries for
Plug-in Hybrid Buses
YLVA OLOFSSON
MIA ROMARE
Department of Energy and Environment/ Department of Applied Physics
Division of Environmental Systems Analysis/ Division of Condensed Matter Physics
CHALMERS UNIVERSITY OF TECHNOLOGY
Gothenburg, Sweden, 2013

Life Cycle Assessment of Lithium-ion Batteries for Plug-in Hybrid Buses
YLVA OLOFSSON
MIA ROMARE
© Olofsson & Romare, 2013
With Support from AB Volvo
REPORT NO. 2013:5
ISSN: 1404-8167
Department of Energy and Environment/ Department of Applied Physics
Chalmers University of Technology
SE-412 96 Göteborg
Telephone: +46 (0)31-772 1000
Chalmers Reproservice
Göteborg, Sweden 2011

Abstract
Electrified buses are becoming increasingly popular and are labeled less environmental impactingcompared to conventional buses thanks to reductions in fuel consumption. It is in light of this,however, important to consider the added environmental burden related to production, use, andend of life of the energy storage system, a fundamental component in the electric drive line.
This thesis investigates the possible gains and losses when using battery cells with a rangeof different chemistries. The effect of modularization and change in pack design of the systemis also assessed in terms of potential gains and environmental burden. The goal has beento determine the steps in the life cycle with most environmental impact by conducting a lifecycle analysis on a full energy storage system based on lithium-ion chemistries. Lithium ironphosphate and lithium nickel manganese cobalt oxide are considered for the cradle to gate lifecycle assessment. Other current and future chemistries are assessed for reference.
When considering modularization, special focus has been given the environmental impactsrelated to measures for interoperability of battery module units, as well as effects of reuse andsecond life. For the use phase, the impacts of the battery related to the number of passengersof the bus are investigated. Also the environmental effect of choosing different battery packmaterials is investigated.
Regarding the effects of changing cell chemistry, the results indicate that a transition frommaterials with scarce constituents to those with more abundant materials can be beneficial forthe environmental impact, even if energy consumption is not improved. The assessment alsopinpoints aluminum current collectors as a part with large impact. In addition, another largepart of the impact from the cells is due to the active materials and their processing, indicatingthe potential gains associated with improved recycling. It is indicated that different processingalternatives have different benefits depending on whether or not the active materials need to beof nano-size.
In the perspective of the whole battery pack, the cells together with the electronics andcontrol systems have the largest impacts, and this can efficiently be reduced by applying reuse.Through modularization, the battery pack can be prepared for different types of reuse or secondlife. When using several small packs the impacts are higher than when using one larger pack.The impact of using several smaller packs is also dependent on the placement of control units.
Additional cooling system structure for fast charging has shown to have high significancefor the weight of the battery pack, indicating the need of paying high attention to the coolingsystem design. The electronics and battery monitoring system result in a large impact. Themagnitude of this impact is, however, still dependent on the type of printed circuit board used.
In the total life cycle, the energy consumption during the driving related to a typical increasein the battery pack weight is same order of magnitude as the energy needed to produce thebattery. Moreover, if a weight increase also leads to a decreased passenger capacity, normalizingwith the number of passengers has a great importance for the outcome of the LCA, motivatinga thorough allocation method.
In light of the results found in this thesis it is clear that assessing the impacts of usingdifferent materials and components in the battery energy storage system is a key in order todesign systems with as low environmental impact as possible.


Acknowledgments
We would like to extend a warm thank you to all those who made this thesis possible, bothat Chalmers, and through the collaboration with AB Volvo. A big thanks to all of the groupat Volvo ATR who were so friendly and always ready to answer any questions, no matter howsimple or difficult, and to all of the employees who made our work here as enjoyable as it hasbeen.
Thank you also to all our great supervisors. Jens Groot who took us in from the start,got involved and showed great determination in helping us achieve the best thesis possible.Thank you also for introducing us to the fascinating world of batteries! To Duncan Kushnirfor knowledgeable comments and answers to all our questions, and perhaps most of all for theencouragement and belief in our work. Patrik Johansson, for great support in all aspects of thethesis work, and for valuable advice when looking beyond these five months. To Anne-Marie forwise and valuable down-to-earth advice about the proceedings of an LCA study, and for tellingus what actually is a reasonable scope for a five month thesis.
Thank you to Lisbeth Dahllof and Maria Wallenius Henriksson for advice and help withthe modeling for the LCA. To Johan Hellsing, Johan Johansson, Karin Carlsson, EdwardJobson, Pontus Enhager, Martin Aslund for their help with estimates and explanations. ToPer Halvarsson for estimates about second life prospectives.
Lastly we acknowledge the support from our wonderful families. Joel, for the never endingsupport that helped five month’s work to come together in one single thesis, and for simply beingthere. Federico for his tender attention and support that helped in keeping high motivation allalong the project.
Mia Romare and Ylva OlofssonGoteborg, 2013

Contents
1 Introduction 11.1 Goal . . . . . . . . . . . . . . . . . . . . . . . . . . . . . . . . . . . . . . . . . . . 21.2 Scope and limitations . . . . . . . . . . . . . . . . . . . . . . . . . . . . . . . . . 21.3 Life Cycle Assessment . . . . . . . . . . . . . . . . . . . . . . . . . . . . . . . . . 31.4 Software and tools . . . . . . . . . . . . . . . . . . . . . . . . . . . . . . . . . . . 41.5 Rechargeable batteries . . . . . . . . . . . . . . . . . . . . . . . . . . . . . . . . . 41.6 Energy storage systems . . . . . . . . . . . . . . . . . . . . . . . . . . . . . . . . 51.7 Designing for a plug-in hybrid electric bus . . . . . . . . . . . . . . . . . . . . . . 8
2 Life cycle assessment methodology 112.1 Goal and scope definition . . . . . . . . . . . . . . . . . . . . . . . . . . . . . . . 112.2 Impact categories and weighting methods . . . . . . . . . . . . . . . . . . . . . . 122.3 Sensitivity analysis . . . . . . . . . . . . . . . . . . . . . . . . . . . . . . . . . . . 14
3 Components and design alternatives for energy storage systems 153.1 Current and future cell chemistries . . . . . . . . . . . . . . . . . . . . . . . . . . 15
3.1.1 Lithium-ion batteries . . . . . . . . . . . . . . . . . . . . . . . . . . . . . . 153.1.2 Lithium-ion battery cathode active materials . . . . . . . . . . . . . . . . 183.1.3 Lithium-ion battery anode active materials . . . . . . . . . . . . . . . . . 213.1.4 Novel cell types . . . . . . . . . . . . . . . . . . . . . . . . . . . . . . . . . 233.1.5 Environmental impact of battery constituents . . . . . . . . . . . . . . . . 24
3.2 Materials manufacturing . . . . . . . . . . . . . . . . . . . . . . . . . . . . . . . . 263.3 ESS design . . . . . . . . . . . . . . . . . . . . . . . . . . . . . . . . . . . . . . . 28
3.3.1 Pack manufacturing . . . . . . . . . . . . . . . . . . . . . . . . . . . . . . 293.3.2 Modular design . . . . . . . . . . . . . . . . . . . . . . . . . . . . . . . . . 30
3.4 Reuse and second use of energy storage system components . . . . . . . . . . . . 363.4.1 Reuse . . . . . . . . . . . . . . . . . . . . . . . . . . . . . . . . . . . . . . 373.4.2 Battery systems in grid applications . . . . . . . . . . . . . . . . . . . . . 40
3.5 Recycling . . . . . . . . . . . . . . . . . . . . . . . . . . . . . . . . . . . . . . . . 423.5.1 Pack recycling . . . . . . . . . . . . . . . . . . . . . . . . . . . . . . . . . 423.5.2 Cell recycling . . . . . . . . . . . . . . . . . . . . . . . . . . . . . . . . . . 42
4 Data collection, modeling and inventory analysis 454.1 Cell materials models and data . . . . . . . . . . . . . . . . . . . . . . . . . . . . 45
4.1.1 BatPaC chemistry and cell parameters . . . . . . . . . . . . . . . . . . . . 464.2 Modeling of cell production . . . . . . . . . . . . . . . . . . . . . . . . . . . . . . 48
4.2.1 Cathode active material synthesis . . . . . . . . . . . . . . . . . . . . . . . 484.2.2 Anode active material synthesis . . . . . . . . . . . . . . . . . . . . . . . . 504.2.3 Production of electrolyte, separator, electrodes and casing . . . . . . . . . 504.2.4 Cell assembly . . . . . . . . . . . . . . . . . . . . . . . . . . . . . . . . . . 51
4.3 Battery pack design and implications for environmental parameters . . . . . . . . 514.3.1 Using BatPaC as reference model for pack design . . . . . . . . . . . . . . 53
iii

CONTENTS
4.3.2 Selection of modularization in BatPaC . . . . . . . . . . . . . . . . . . . 564.3.3 Components and materials . . . . . . . . . . . . . . . . . . . . . . . . . . 564.3.4 Pack scenarios included in the LCA . . . . . . . . . . . . . . . . . . . . . 62
4.4 Use phase . . . . . . . . . . . . . . . . . . . . . . . . . . . . . . . . . . . . . . . . 634.4.1 Normalization and functional unit for LCA comparisons of the use phase 66
4.5 Second use and reuse . . . . . . . . . . . . . . . . . . . . . . . . . . . . . . . . . . 674.6 Cell recycling models . . . . . . . . . . . . . . . . . . . . . . . . . . . . . . . . . . 72
5 Results 755.1 Cell manufacturing and constituents . . . . . . . . . . . . . . . . . . . . . . . . . 75
5.1.1 Energy use for the cell components . . . . . . . . . . . . . . . . . . . . . . 755.1.2 Impact categories of the cell components . . . . . . . . . . . . . . . . . . . 785.1.3 Applying weighting methods . . . . . . . . . . . . . . . . . . . . . . . . . 825.1.4 Implications for future chemistries . . . . . . . . . . . . . . . . . . . . . . 835.1.5 Sensitivity analysis and limiting assumptions . . . . . . . . . . . . . . . . 84
5.2 Battery pack and modularization impacts . . . . . . . . . . . . . . . . . . . . . . 855.2.1 Use phase . . . . . . . . . . . . . . . . . . . . . . . . . . . . . . . . . . . . 89
5.3 Pack life cycle . . . . . . . . . . . . . . . . . . . . . . . . . . . . . . . . . . . . . . 935.4 Battery material recycling scenarios . . . . . . . . . . . . . . . . . . . . . . . . . 95
5.4.1 Life cycle impact assessment . . . . . . . . . . . . . . . . . . . . . . . . . 955.4.2 Sensitivity analysis and limiting assumption . . . . . . . . . . . . . . . . . 96
6 Discussion 97
7 Conclusions 101
Bibliography 103
A Appendix 107
iv

Acronyms
ADP Abiotic Depletion Potential
AP Acidification Potential
BEV Battery Electric Vehicles
BMS Battery Management System
CPM Cells Per Module
DCB Dichlorobenzene
DMC Dimethyl Carbonate
EC Ethylene Carbonate
EI99 Eco-indicator 99
ELU Environmental Load Units
EOL End Of Life
EP Eutrophication Potential
EPS Environmental Priority Strategies
ESS Energy Storage System
GWP Global Warming Potential
HEV Hybrid Electric Vehicles
HOMO Highest Occupied Molecular Orbital
HTP Human Toxicity Potential
LCA Life Cycle Assessment
LFP LiFePO4
LFS Li2FeSiO4
Li-S Lithium-Sulfur
LMO Lithium Manganese Oxide
LMP LiMnPO4
LTO Li4Ti5O12
LUMO Lowest Unoccupied Molecular Orbital
v

CONTENTS
NCA Lithium Nickel Cobalt Aluminium oxide
NiMH Nickel-Metal Hydride
NMC Li(Ni1/3Mn1/3Co1/3)O2
NMP N-methyl-2-pyrrolidone
OCV Open Circuit Voltage
PbA Lead Acid
PC Polycarbonate
PCB Printed Circuit Board
PE Polyethylene
PET Polyethylene Terephthalate
PHEV Plug-in Hybrid Electric Vehicles
POCP Photochemical Ozone Creation Potential
PP Polypropylene
PU Polyurethane
PVC Polyvinyl Chloride
PVdF Polyvinylidene Fluoride
RES Renewable Energy Sources
SEI Solid Electrolyte Interphase
SOC State Of Charge
SOH State Of Health
UPS Uninterruptible Power Supply
Contribution summary
Mia Romare: Main responsibilities: Sections 3.1, 3.2, 3.5, 4.1, 4.2, 4.6, 5.1, 5.4Ylva Olofsson: Main responsibilities: Sections 3.3, 3.4, 4.3, 4.4, 4.5, 5.2, 5.3
vi


Introduction
The environmental impact of the transportation sector is an area that has received increasingattention during the past decades. The transportation sector contributes 16% of mankind’s totalemissions of CO2 [OICA - International Organization of Motor Vehicle Manufacturers 2013],and is one important sector that needs to reduce its emissions.
Legislations to encourage this reduction are being passed, and further emission reductionswill be required after the Euro-6 emission norm for light vehicles, and Euro-VI emission normfor heavy duty vehicles are introduced as standard in 2014 for the new models released focusingon the reduction of NOx [Volvo Trucks 2013], [Johnson 2008].
Fear of depletion of fossil fuels and fuel security issues are also reasons for the increasedinterest in alternative fuels. In light of this, the interest in electrified vehicles has increased. Inturn, the possibility of using electricity as a propulsion means is dependent on the developmentof durable, stable and reliable energy storage systems (ESS) to store the energy. Batteriescould be an alternative, and therefore the battery concepts and their constituent materials areof interest.
The share of electrified vehicles is already growing. Electrified vehicles started being pro-duced in the early 20th century, but the development of the combustion engine hindered theirgrowth. In the 21st century, interest in electric vehicles is again great. The world stock ofelectrified vehicles was around 180 000 in 2012. USA, Japan, France and China have the largestelectrified vehicle fleet, but other countries like Norway and Ireland are also adopting electricvehicles. Between 2011 and 2012 global sales increased from 43 000 to 113 000 electric vehicles[IEA - International Energy Agency 2013].
Different electrified vehicles exist and require different sizes and design of the batteries.Examples of electrified vehicles are hybrid electric vehicle (HEV), plugin-hybrid electric vehicle(PHEV) or fully electrified battery electric vehicle (BEV or FEV). Hybrids use the batterysystem to store energy from regenerative braking, while plug in vehicles store electricity suppliedfrom the grid and additionally from regenerative braking. Thus, HEVs need a smaller battery,PHEVs slightly larger, and BEVs need large batteries to sustain full electric driving. If thetype of electrified vehicle is generic the system is often labeled xEV. Additionally, differentkinds of battery systems and types exist. Currently sold commercial alternatives use lithium-ion chemistries to a large extent. Past alternatives have mostly been nickel metal hydride orlead acid batteries.
The aim of using electrified vehicles is to decrease the environmental impact of the transportsector. When the use of electrified vehicles increases it becomes ever more important to evaluateat what cost the benefits of electric vehicles come. The impact of the batteries themselves, andthe environmental load they place on different environmental categories, can determine the netsavings when switching from fossil fuels to battery systems. If the battery production uses moreenergy than what is saved when driving there would be no benefit.
When talking about electrified vehicles, the focus is often on the potential gains in theuse phase. This gain must, however, be viewed in light of the added production cost andcorresponding environmental impact from adding an electric propulsion system where the
1

CHAPTER 1. INTRODUCTION
battery system usually dominates. Therefore, an environmental assessment is necessary, andcan help to give a deeper insight into the impact of the total life cycle, from production touse. In previous thesis work it has been determined that the battery has a large impact for thetotal electrified drive line [Laudon & Inzunza Soriano 2012]. Therefore further assessment ofthe battery and its sub-components is necessary to fully determine why the battery plays such alarge role in the total drive line and what components should be improved in order to decreasethis role. This in order to improve the total environmental benefit of the electrified vehicle.
An important parameter for the introduction of electrified vehicles is the battery cost, asthe battery is one of the most expensive components of the vehicle. A reduction of the batteryprice will facilitate the growth of the xEV fleet. Solutions for such a price reduction related tothe pack design and standardization are at present being investigated and a significant decreaseis expected in the future from the present approximate 400 $/kWh towards 150 $/kWh [ArgonneNational Laboratory 2000]. Special focus in this thesis is on the environmental impacts ofdifferent possibilities for design, recycling, reuse and second life, possibly leading to batterypack price reduction.
The results from this assessment could serve as a base for introducing the environmentalconcepts of batteries in product development, purchasing, manufacturing, remanufacturing andcontacts between vehicle manufacturer and battery manufacturer. It can also help in decisionsmaking concerning battery end of life (EOL) solutions.
1.1 Goal
The goal of this thesis is to assess the life cycle impacts of lithium-ion batteries for plug-inhybrid buses. The aim is to highlight potential hot-spots in the battery life cycle when choosingdifferent cell chemistries, modularization approaches and pack designs. The results from thereport are aimed to guide and recommend the most beneficial current and future solutions. Thisin the light of both energy consumption and other environmental impact categories.
The assessment is performed with the help of life cycle assessment (LCA) methodology. Thelife cycle steps included in the assessment range from extraction and production of constituentmaterials, to assembly, use phase and end of life management. Priority has been given to achievetransparent data. In this way the method used in this thesis can be applied to more case specificlife cycle assessments in the future.
For the cell chemistries the extraction and production of active material, along with cellassembly is in focus. Also the potential gains of recycling the cells after use are evaluated. Ona higher system level, environmental effects and opportunities for second use and reuse coupledwith modularization are assessed. Lastly different materials choices for supporting componentsin the whole pack are evaluated.
1.2 Scope and limitations
The thesis aims to assess the environmental impacts of different battery components and sub-systems. Therefore only the battery system and its casing are included. Other components inthe electrical drive line, like the electric motor, are not included. Also supporting componentsfor the battery system, like the battery charger, are omitted from the thesis scope.
The LCA is divided in parts, with separately explained data collection and results, relatedto the different product life phases and components. The methodology differs from the one in
2

CHAPTER 1. INTRODUCTION
a standard LCA since the full life cycle impact receives less focus than the results from thedifferent phases of product life and the most important results derive from sensitivity analysisof the importance of various components and production process choices.
In this thesis the end of life options for the pack are only included in the total life cycle asdecreased extraction of various metals and materials. For the cells, possible end of life processcosts are also included in the assessment.
The time frame of the thesis work is set to be present day for all production, assembly andmaterials extractions. Also the use phase is set to be in present time, with current electricitymixes and fuels. The vehicles are assumed to follow emission limits for vehicles being producedduring 2013.
The life cycle assessment only has lithium-ion batteries within its scope. Other possiblematerials are assessed outside of the LCA methodology. All models are based on literaturestudies and calculations, and no lab test have been performed to support the data collection.A battery modeling software, BatPaC, has been used to design battery systems.
1.3 Life Cycle Assessment
LCA is a method to evaluate the environmental impact of the complete life cycle of a productor a service [Baumann & Tillman 2004]. The methodology has been in wide practice sincethe early nineties as a tool to compare different choices of processes and materials. LCA iscommonly used in product development, production processes and waste management, and hasbecome important for standardized environmental market communication.
There are international standards for how a LCA study is conducted, the one used in thisthesis is ISO 14044. The environmental impacts are measured according to a group of standardindicators, which makes the LCA results comparable between studies. The indicators and otherthesis specific choices will be presented in chapter 2.
Life cycle assessment as a tool for product development
Apart from assessing potential hot-spots of the complete life cycle of a product or service, LCAcan be a useful tool for environmentally beneficial design, also called ecodesign [Baumann &Tillman 2004]. This gives the opportunity to find the most optimal design even at a conceptualstage. There are a few general rules to follow when aiming to achieve this design:
• Avoid toxic substances.
• Minimize energy and resource use in production, transport and use phase.
• Use structural features and high quality light materials to minimize weight.
• Promote repair and refurbishment to enable reuse.
• Use materials that promote long product life for products with high production and endof life impact.
• Prepare for upgrade, repair, reuse and recycling by using few and simple materials.
• Use joining elements that can easily be removed to facilitate disassembly.
3

CHAPTER 1. INTRODUCTION
1.4 Software and tools
GaBi software
The GaBi software is a tool to conduct life cycle assessments of products, and it was developed bythe Chair for Building Physics, University of Stuttgart in collaboration with PE International.The software provides features to manage the large sets of environmental data associated tothe product life cycle, to create balances for different subcomponents and life phases, and tointerpret and visualize the impacts [PE International 2013].
GaBi itself does not provide the data sets of specific materials and processes and so databasescontaining this data are connected independently. The databases are updated regularly withcurrent data about the material production processes, electricity mixes and average data forregions to keep the environmental evaluations up to date with present industry and theory[PE International 2013]. In some cases the data provided by the existing databases needs tobe adjusted to represent a very specific process, and such a change should be motivated bycalculations or from literature. In this thesis the changes made to the provided datasets arenoted in Appendix A and the assumptions are clarified in chapter 4. The version used is GaBi6, and the databases used are PE International, Plastics Europe and Ecoinvent.
BatPaC
BatPaC is a performance and cost model developed by Argonne National Laboratory [Nelson,Bloom & I Dees 2011]. The name BatPaC stands for Battery pack Performance and Cost. Themodel contains information and design models for several different lithium-ion battery cells andthe resulting modules and packs. There is the opportunity to choose many parameters to get asystem that is a good model for the one that is being investigated. Thereby valuable data formodeling can be retrieved, like weight of components and relative contributions. The versionused in this thesis was version 2.1. The focus was to a great extent on the performance part ofthe program and not the cost.
1.5 Rechargeable batteries
The use of batteries to achieve portable and small scale electrical sources is wide-spread intoday’s society. Depending on size, batteries can power anything from electronics to vehicles.Batteries that cannot be recharged are used to great extent in most households in various elec-tronic devices. Rechargeable batteries are, however, becoming increasingly common. Batteriesoffer the possibility to store energy in chemical form and retrieve it as electrical energy throughan electrochemical reaction. Unlike in non-rechargeable batteries the reaction is reversible inrechargeable batteries and the cell can be cycled from charged to uncharged many times. Thiscomes with higher demands on the materials involved, and thus a higher price. Generally, thistype of battery instead provides the opportunity of up to thousands of recharges and thus longeruse.
The fundamentals of the battery were discovered early, and realized in the year 1800 by Volta,when he created his voltaic pile. He found that when two materials of different electrochemicalpotential were connected with an electrolyte between, a current could be collected. The samebasic idea exists in current batteries. When the battery cell is coupled to an external circuit,oxidation and reduction reactions occurs at the negative and positive electrodes respectively.The electrons are collected and used in the external circuit and the ions are transported betweenthe electrodes through the electrolyte. Separating the anode and cathode with an electrically
4

CHAPTER 1. INTRODUCTION
Figure 1.1: Schematic illustration of the workings of a battery cell. All key materials components are
shown. The foils supporting the active material (shelves), the separator (dashed line) and mobile charges
can all be viewed in the figure. The electrolyte component would be contained between the anode and
cathode, and also inside the active materials.
insulating separator ensures that the electrons only can pass through the external circuit, andreaction is limited to when the cell is connected. This basic setup is illustrated in figure 1.1.
When a rechargeable battery is used, it is cycled between different states of charge anddischarge. The highest state of charge (SOC) indicates the maximum available energy storagecapacity in the battery. The current SOC is the percentage of the highest SOC that is chargedat the moment.
The range of charge in which the battery is cycled is called the SOC window. Whenrechargeable batteries are tested, they are often tested with deep cycles having an 80% SOCwindow, and the number of available cycles stands in correlation with this. When used invehicles, a typical SOC window is smaller, around 40% to achieve a greater number of cycles.When comparing battery alternatives it is important to use the same definition of SOC window.In this thesis the total life length of the system in years is used to avoid this confusion.
1.6 Energy storage systems
An automotive energy storage system (ESS) has the function of storing and delivering electricenergy, for example to the propulsion of electrified vehicles. The size of the ESS in terms ofpower and energy is determined by the expected driving pattern, requested range with electricdrive, and vehicle weight. An ESS can be designed in a vast amount of ways; from a smallsystem for electronics to large systems with many components for automotive use. For a vehiclesize system there are some basic sub-systems that are used to build up the whole battery ESS.The assembly of the sub-systems and their relations to each other are depicted in figure 1.2.These sub-systems comprise:
• The battery cell where the chemical reaction occurs (A).
• The module which stores and manages a certain number of cells (B).
• The pack which contains all modules and all other subcomponents (C).
• The housing which contains one or several packs, creating the outer wall of the ESS (D).
• Subcomponents to control the operation of the battery.
5

CHAPTER 1. INTRODUCTION
Figure 1.2: The various system boundaries between the subsystems comprising cells, modules, packs,
ESS and vehicle are illustrated. The cells are contained in modules, and a number of modules in turn
comprise a pack. A full energy storage system is then made up of one of more packs, and placed as a
component in the complete vehicle system.
Battery cells
The basic components of a battery cell are a positive and a negative electrode, an electrolyte andoptionally a separator. The electrodes are current collectors with the active materials adheredto allow collection of electrons from the reacting materials. The active materials should beconducting and should readily be reduced or oxidized many times without changing form ordeteriorating.
The electrolyte is a material with the purpose of conducting ions between the anode andthe cathode. It is often a liquid, although alternatives like polymers are possible. In the caseof liquid types the electrolyte is contained in the separator and electrodes. The separator is apassive part of the battery cell. Its role is to act as a container for the liquid electrolyte, givestability to the cell and remain stable throughout charging and aging. By separating the twoelectrodes, short circuiting is prevented [Daniel & Besenhard 2012].
The components of the cells are arranged and encased in a protective pouch or in an outerlayer. There are a few different ways of doing this. The electrodes are always layered, but canthen either be inserted directly into a flat pouch or casing; or they can be rolled and insertedinto a round casing. For the purpose of this thesis, the flat pouch cells are used as models forcells. The use of this design is beneficial since the cells are easier to pack efficiently, easier tocool and are straightforward to model in two dimensions [Nelson et al. 2011]. The material ofthe pouches can vary, often a thinly rolled plastic-metal-plastic material is used. This materialprotects the cell and is only broken by the protrusion of current collector tabs, from which manycells and a load circuit can be connected.
Modularization
Modularization of the battery pack implies the subdivision of the total amount of cells containedin the pack into smaller sub units. The cells in the battery are contained in separated boxes,called modules, which interconnected build up the battery pack (figure 1.3,1.2). The modular-ization can be explained as the almost infinite number of options to group a large number of cellsin different configurations. Modularization is a wide concept, and it impacts various aspects ofthe physical battery properties, and influences the use and the remanufacturing possibilities.
6

CHAPTER 1. INTRODUCTION
Figure 1.3: The composition and assembly of the battery pack. 1) cooling plates, 2) cell, 3) cell
interconnection, 4) cell group, 5) cells contained in module housing with positive and negative terminals,
6) modules connected in row, 7) assembly of two module rows, 8) module group, 9) assembly of steel
plates and steel straps to module group, 9) pack containing the modules with terminals and coolant inlet.
Pack design
The pack is a system component that contains all modules and all subcomponents needed in thecomplete system. It is typically viewed as the box containing interconnected modules with cells,some control units, measurement sensors, parts of the cooling system and safety installationssuch as fuses. All of the pack components can be seen in figure 1.3. Attention should, however,be paid not to confuse the battery pack with the ESS, since several packs may be used toachieve the full functionality needed for the vehicle. In other words, the ESS may consist of oneor several battery packs.
One main function of the pack is to contain the different control units needed to ensureproper functioning of the whole system. For safety reasons, and for prolonging the life of thebattery, the voltage and currents need to be controlled to avoid dispersion in load among thecells. It is important that no cells are overloaded and fail, since this would result in reducedfunctionality of the battery.
To secure good functioning of the ESS, an integrated control system is needed. Themanagement of the whole system control is usually called battery monitoring system (BMS),consisting of printed circuit boards (PCB) and electronics. Additionally for safety reasons, fusesare integrated to hinder any electric dysfunction in the system to spread.
During the charge and discharge of the battery, heat is generated. The battery aging isdependent on the temperature, and so a thermal management system is also needed in thepack. The cooling system should be able to keep the battery at a stable temperature ideallyabout 35 ◦C, creating a need for cooling plates and pumps [Nelson et al. 2011]. If cooling platesare used the thickness of the plates is adapted to the rate of heat rejection. Thick cooling platesare especially important for fast charging of the battery when the temperatures may rise veryfast 1.
1Personal communication with Jens Groot, 2013.
7

CHAPTER 1. INTRODUCTION
Current limitations
In general, there are a few common factors that limit the performance of battery energy storagesystems. For automotive applications the main issues are weight, volume and cost. These canbe especially relevant when considering fully electrified vehicles, as heavy systems (250-700 kg)are needed to get a reasonable range. This is in turn coupled with high cost and environmentalimpact due to a larger energy consumption when driving, and a more costly production of theparts.
All batteries have life-length problems, degrading over time as a function of the number ofcycles. Currently they are not able to perform up to the required standards during the wholelife-time of the vehicle, leading to a need for replacement. This is caused both by charging anddischarging, ’cycling’ issues, but also by side reactions when the battery is passive for a longerperiod of time, ’calendar life’.
The battery system and its active materials need to compete when it comes to energydensity, both volumetric and gravimetric. This gives rise to a general need for developmenttowards lighter materials with good capacity and fast charge/discharge. A longer life-time isalso a key factor as it reduces the overall impact of the processing step and the need for servicing.
1.7 Designing for a plug-in hybrid electric bus
For vehicle size systems there are a multitude of factors determining the choice of componentson all levels of the system, from chemistry to casing. The vehicle use determines the requiredenergy storage capacity, as well as the required voltage, charge capacity, and power. Thesefactors do in turn impact the number of cells needed, what chemistries these can be and theconfiguration (series or parallel) of the cells. The vehicle use can vary greatly depending ondrive cycles, range of driving and time of driving. The ESS might also have to conform to therequirements placed by existing infrastructure, and be suitable for different climates. The PHEVbus typically has a predefined route with predictable accelerations, driving speeds, number ofstops, and charging places.
The electric range of the battery is dimensioned according to the driving cycle for the setroute [Pesaran, Markel, Tataria & Howell 2009]. The goal is often to make a certain percentagetotally electric in order to for example to keep the driving silent or to not emit in urban areas.A common electric distance for a PHEV bus is 5-10 km. For the rest of the driving distancethe ICE engine is included and shares the load with the electric engine as efficiently as possible,using also the power from regenerative breaking [Pesaran et al. 2009]. For a city bus, a 5-10 kmelectric range is close to the distance between end stations, giving opportunity to recharge afterthis distance.
The battery is dimensioned so that the energy needed to achieve the electrical range isavailable, taking into consideration the SOC window available for the battery during its life[Pesaran et al. 2009]. Normally, the window is at most 40% in order to make the battery lastlonger. Common sizes of a battery system for a 10 km electric range in city driving are between20-60 kWh depending on the driving cycle2. Moreover, the accelerating power is dimensionedas the maximum power that should be extracted from the battery, and the braking power isdimensioned as the power that should be absorbed in the regenerative braking. The power ofthe electric motor often ranges between 120-150 kW[Volvo Buses 2013a] depending on the sizeof the bus, at voltages of 500-730 V2.
The type of cell used in the system can also influence the size and design. This since a busis a heavy vehicle and thus requires more power compared to energy storage than for example
2Estimate from personal communication with Jens Groot, 2013.
8

CHAPTER 1. INTRODUCTION
a car. This in turn has implication both for the supporting material in cell and pack, sincethey need to cope with large currents and corresponding heat generation. Also the need for fastcharging in a city bus that spends most of its time on the road is of importance for the coolingsystem.
The weight of a battery system depends on what demands are placed on the desired electricrange, and what energy storage capacity is needed. For a PHEV as described above a typicalrange is from 250-700 kg assuming a specific energy of 84 Wh/kg battery pack3. For the total batterysystem. The cells used in this system weigh around 500-600 g each.
The last stage of design is placing the battery somewhere on the vehicle body. The outerframes should fit in the available space, and be balanced against the weight of other equipment,both in layout and in total weight. An over dimensioned battery can have the implication oflowering the legally advised number of passengers on the bus, penalizing the functionality.
3Estimate from BatPaC calculation
9


Life cycle assessment methodology
A life cycle assessment is often conducted in several typical steps [Baumann & Tillman 2004].First the goal and scope are defined, then an inventory analysis is performed. In the inventoryanalysis a model of the life cycle is built based on the goal and scope, data is collected for allthe stages included in the model, and the amounts of material, energy and emissions includedin each step of the model are calculated. After the inventory analysis an impact assessment isperformed to indicate the resulting impacts from the model created in the inventory analysis.In this thesis the inventory analysis and models are presented in chapter 4 and the impactassessment is presented in chapter 5.
2.1 Goal and scope definition
The LCA type in this thesis is a stand-alone LCA, meaning that only one product is evaluatedand no comparison with other products are conducted [Baumann & Tillman 2004]. This aim isto identify hot spots in the complete life cycle, and the goal and scope are aimed at producingresults that highlight these hot-spots.
Life cycle analysis goal statement
The goal of the LCA conducted in this thesis is to highlight the key steps in the developmentand design of an ESS, and their contribution to environmental impact of the system. Theassessment can lead both to recommendation for improvement of certain life cycle steps, butalso to guidance for future development plans. The assessment aims to answer the followingquestions
• What are the key components influencing the life cycle of a complete system?
• What are the key steps of cell production?
• What is the effect of modularization?
• What are the possible gains of different strategies of reuse, second life use and recycling?
• What would be the impact of changing the cell chemistry used in the system?
• What would be the impact of changing pack and module materials in the system?
To answer these questions the LCA was divided in both a full cradle-to-grave assessment, butalso into several cradle-to-gate and gate-grave assessments for subprocesses and input materials.
11

CHAPTER 2. LIFE CYCLE ASSESSMENT METHODOLOGY
Scope and functional unit
The scope of this LCA includes the study of a complete ESS with all its subcomponents. TheESS is sized for use in a PHEV city bus. The system is specified to provide appropriate energyand power for this application, regardless of the battery type. Other components of a PHEVbus, apart from the ESS, are only considered as a black box, albeit with some parameterizationsuch as reacting to changes in weight by changing energy consumption for driving.
The functional unit of the LCA is one full ESS scaled for heavy vehicles, with a 3 yearlife length. All results will correspond to this functional unit as all the components are scaledaccordingly. The cell size, number of cells, and pack size are all suited for the functional unit.
The motivation for this choice of functional unit is that the different design alternativesin this thesis lead to the need for different pack sizes, different relative weight between thecomponents and different size of the total energy storage capacity. Therefore a per kg or perkWh functional unit would be misleading in light of these changes. The priority is to show theresults in light of the function of the energy storage system that is to supply energy to a PHEVbus for 3 years.
System boundaries
The aim of the thesis was to assess and highlight the most important impact categories for thedifferent life cycle steps of a vehicle battery in a very general manner. This means that nogeographical boundaries were set, and global or European averages were used where possible.Due to this a choice was made to exclude the impact from transportation, and infrastructurelike plants. This is acceptable, since transport has a gross energy demand in the order of 1%of the total demand during cell production [Rydh & Sanden 2005]. The timescale of the LCAwas set to include present data only.
The technical boundaries include the cut-off of all components outside the boundary of theESS and its case. Previous work concludes that the battery is a dominant factor both in globalwarming potential and acidification potential compared to other components in the drive line[Laudon & Inzunza Soriano 2012]. The ESS may be a key component, but the results will stillbe limited to indicate possible improvements and key impact factors connected to the batterymaterials, processing, assembly, reuse and recycling.
2.2 Impact categories and weighting methods
Material or system environmental impacts can be obtained by looking at different impactcategories. Apart from looking at the energy consumption, this thesis uses seven impactcategories:
• Global warming potential (GWP), CO2-equiv.
• Abiotic Depletion Potential of elements (ADP elements), Sb-equiv.
• Abiotic Depletion Potential of fossils (ADP fossil), MJ.
• Acidification Potential (AP), SO2-equiv.
• Eutrophication Potential (EP), phosphate-equiv.
• Human Toxicity Potential (HTP), DCB-equiv.
• Photochemical Ozone Creation Potential (POCP), ethene-quiv.
12

CHAPTER 2. LIFE CYCLE ASSESSMENT METHODOLOGY
To further understand why these are of relevance, a short description of each category willfollow:
Energy : Represents the total net calorific value of fuels related to transports and processesfor the production of materials or services. This category is measured in MJ.
Abiotic depletion potential : Measures the depletion of non-renewable, non-biological re-sources that are not recreated by nature within a very long period. Examples are metals, min-erals, and fossils. The category is based on determined existing resources, and may vary if newsources are discovered [Baumann & Tillman 2004], [en Waterstaat & Waterbouwkunde 2002].The category is of interest due to the possible depletion of elements with high importance forthe industrialized society, for example fossil fuels and rare metals used in electronics. The ADPof elements is measured in kg antimony-equivalents, and that of fossils in MJ energy contained.
Eutrophication potential : Measures the substances emitted to nature that can lead to anincrease in biological productivity in terrestrial systems, lakes and waters (aquatic systems)leading to lack of oxygen, so called eutrophication. The increased biological activity is dueto nutrients such as phosphates and nitrates being emitted [Baumann & Tillman 2004]. Thebiological organisms consumes the oxygen in the water for their metabolism until the wateroxygen content is depleted, and fish and other aerobe beings go towards extinction, whileanaerobe metabolisms take over[Hans De Keulenaer 2006b].
Acidification potential : Is impacted by the emissions of sulfur and other substances leadingto acidification of ground and waters, and measured in kg SO2-equivalents. The acidificationleads to changes in pH in the environment changing the living conditions for the biosphere,often in a negative way[Baumann & Tillman 2004]. The acidification is a problem especiallyfor grounds with low content of calcium and other minerals being natural pH stabilizer, suchas those in the pine forests in Scandinavia [Krug, Frink et al. 1983]. The acidification may forexample lead to leaching of heavy metals to the ground water due to chemical reactions favoredby the acidity, the degradation of cultural monuments of marble, and difficulties with survivalfor some species[Hans De Keulenaer 2006a].
Global warming potential : Is enhanced by the green house gas emissions to the atmosphereand measured in CO2-equivalents. Global warming is the origin to secondary effects such asclimate change [Baumann & Tillman 2004], thereby giving unpredictable but severe impactsto the environment such as; melting of glaciers, raised sea level, increase in natural disastersdue to unstable weather, and extinction of species due to drastically changed living conditionsinduced by the temperature increase [Azar 2008].
Human Toxicity potential : Accounts for emissions of chemical substances to the environmentthat can be harmful to humans by inhalation, dermal contact with water and soil, or ingestionby produce, fish and meat. The exposure, spreading and fade of the dose is modeled andinterpreted in dichlorobenzene (DCB) equivalents [Hertwich, Mateles, Pease & McKone 2001].
Photochemical ozone creation potential : The creation of ozone at ground level is a reactionbetween uncombusted hydrocarbons and NOx from traffic emissions, catalyzed by sun radiation.Ozone at ground level is harmful to vegetation and is toxic for humans in high concentrations.The concentration of ozone and the related toxicity depends on weather conditions such ashumidity and wind [Baumann & Tillman 2004]. The index is ethylene-equivalents.
Weighting methods
Weighting methods can be used to value the impact in different categories and summarize allvalues into a single score. This can give fast and easy comparison between different alternativesand designs. Different weighting methods can be used, each valuing different impacts moreor less heavily. Weighting methods are standardized so as to present a common base forcomparison.
In this thesis two weighting methods are used. The first is the Environmental PriorityStrategies (EPS) method, measured in Environmental Load Units (ELU). The units are based
13

CHAPTER 2. LIFE CYCLE ASSESSMENT METHODOLOGY
on the willingness to pay for a certain environmental impact. The method was developed to aidin product development [Baumann & Tillman 2004].
The second weighting method used is the Eco-indicator 99 (EI99). Also EI99 was developedas a tool for product development, using one single impact score. Here the LCA impactsare categorized as belonging to one of three categories; Damage to human health, damage toecosystem quality, and damage to resources. The relative importance of each of these categoriescan vary. In this thesis we use the hierarchic perspective, including both a shorter and alonger time frame, and based both on facts and political and scientific bodies [Baumann &Tillman 2004].
2.3 Sensitivity analysis
A sensitivity analysis is an assessment of the effect of changing a certain parameter between thevalue used in the LCA, and possible maximum and minimum values for the same parameter.Sensitivity analysis is an important part of LCA [Baumann & Tillman 2004], especially whendealing with assessments of components for which not much data exists, were the data isincomplete or not very detailed. By systematically changing the uncertain parameters andanalyzing the effect this has on the system, the impact of the uncertainty can be determined.If the change in the system is small when changing a parameter, then the uncertainty is not agreat issue. On the other hand, if the impact on the system is large it should be noted that theuncertainty of the parameter in question could have large impact on the overall assessment.
In this thesis, sensitivity analysis was performed on parameters that showed a large impacton the total result for one or more impact categories. Also parameters where there were knowndiscrepancies in the data were tested, so that the effect of having uncertain data could beanalyzed.
14

Components and design alternativesfor energy storage systems
A large variety of different battery system concepts exist. Everything from the shape of thepack, module and cell, to the incorporated material can change. This chapter is aimed atproviding a base for understanding possible and common choices for the different materials anddesign alternatives, as well as production methods and end of life alternatives for these. Thepresentation in divided into sections where the design and materials of different components arepresented. These components include the cells, modules and packs. Also cell production andrecycling, as well as second use and reuse alternatives are presented.
3.1 Current and future cell chemistries
This section provides an overview of the battery chemistries that were evaluated in this thesiswork. Common designs and constituents of each type are described, and their coupling toautomotive battery evolution discussed. Several of the chemistries are based on the lithium-ionconcept, and a general description of this important type of battery is therefore presented. Apresentation of specific lithium-ion chemistries and material follows, as well as a comment onother alternative battery designs and their materials. This builds a base for the interpretationof the LCA results presented in Chapter 5.
3.1.1 Lithium-ion batteries
Lithium-ion (Li-ion) batteries as a group are of high interest both when talking about currentand future battery technologies, since they have high cell potential and low weight, resultingin high gravimetric power and energy densities. Generally Li-ion batteries are valued for theirlong lifetime, both in available cycles and calendar-life, compared to older types of rechargeablebatteries such as the nickel-metal hydride (NiMH) batteries or lead acid batteries (PbA).
The basis of Li-ion batteries is the rocking-chair mechanism, meaning the lithium ionsrock between the anode and cathode during charge and discharge. The electrodes consist ofa supporting and conducting foil to which the active material, and possibly some conductiveadditive, are adhered with a binder. Between and inside the electrodes, the electrolyte iscontained. A schematic representation of the electrode setup is illustrated in figure 3.1.
Figure 3.2 illustrates the potential of several different energy storage alternatives. Li-ion isthe only option at present that can be tuned to fit many different needs, and thus many differentapplications, as exemplified by their use in both portable electronics and vehicles. Thereforethis thesis focuses on this technology, and several different Li-ion chemistries are evaluated. The
15

CHAPTER 3. COMPONENTS AND DESIGN ALTERNATIVES FOR ENERGYSTORAGE SYSTEMS
Figure 3.1: Schematic illustration of a lithium-ion electrode. The foil is a flat metallic surface, the
active material particles and conductive additive are adhered to the foil with a binder (dried). The
liquid electrolyte is contained between the active material particles.
choices of chemistries represent different power and energy properties as well as different statesof development.
The different chemistries are often denoted by their cathode active material. The electrodeactive material consists of an intercalation or insertion material, capable of hosting lithium ionswithout deforming their structure. There are a wide variety of cathode active materials tochoose from, and also some different anode active materials, although most current chemistriesuse graphite. Some commercially available alternatives are presented in table 3.1
Table 3.1: The table presents some of the commercially available and most common choices for lithium-
ion battery cathodes and anodes. Some of the most promising and relevant options for heavy vehicles
have been included in the life cycle assessment presented in this thesis.
Active material Included in LCA
Cathodes Lithium iron phosphate YesLithium nickel manganese cobalt oxide YesLithium manganese oxide NoLithium cobalt oxide NoLithium nickel cobalt aluminium No
Anodes Graphite YesLithium titanate Yes
Many configurations choices, small modifications and indeed also mixes of these materialsare possible. Additionally there is a constant development of new and promising electrode activematerials for Li-ion batteries. The complete selection of included electrode active materials forthe LCA consists of both the current alternatives mentioned in table 3.1, and future candidatesincluding lithium manganese phosphate and lithium iron silicate.
There are also some general drawbacks associated with Li-ion batteries. For automotivepurposes the issue of safety will always be important, all current Li-ion batteries need to beoperated under controlled temperature and voltage conditions to avoid unwanted reactions inthe cell. If they are punctured during an accident there is a risk that anode and cathode comein contact, causing high currents to run, and heat generation that leads to potential fire hazard.
The use of certain materials in the Li-ion cells might be an issue. Some chemistries containcobalt and nickel, increasing the environmental burden, see section 3.1.5, whilst others lack theeconomic incentive for recycling, as will be discussed in section 3.5. For future light weight
16
CHAPTER 3. COMPONENTS AND DESIGN ALTERNATIVES FOR ENERGYSTORAGE SYSTEMS
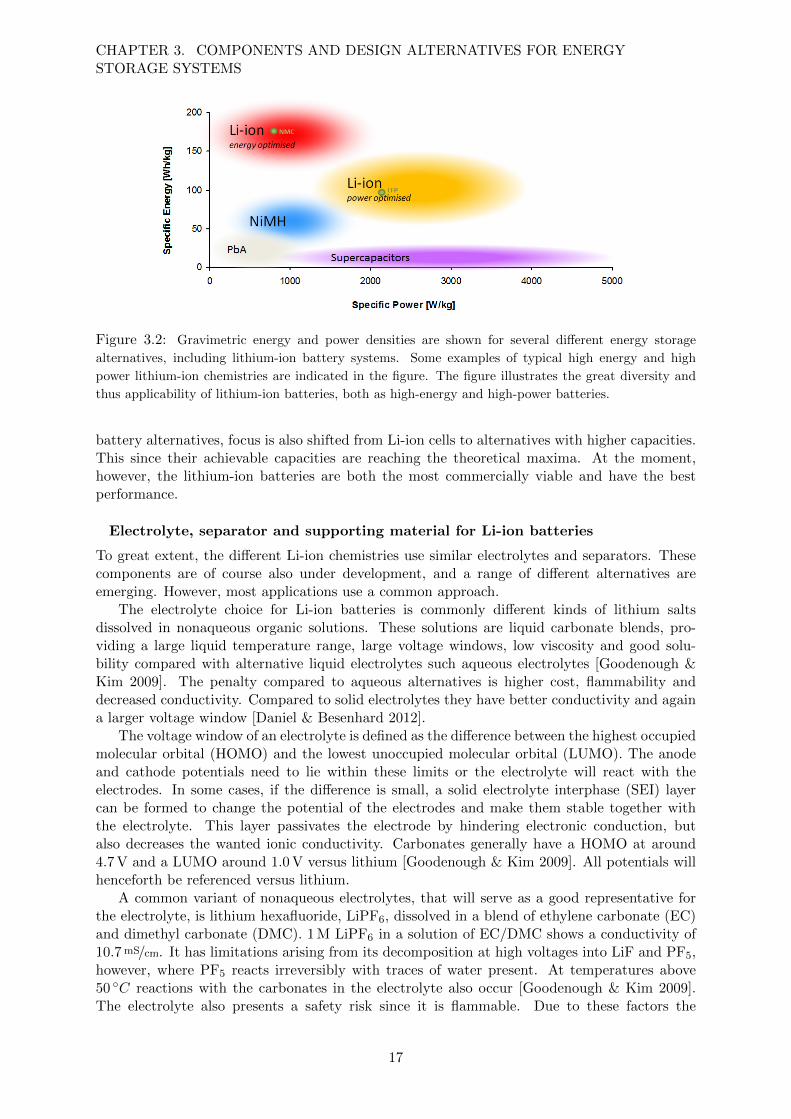
Figure 3.2: Gravimetric energy and power densities are shown for several different energy storage
alternatives, including lithium-ion battery systems. Some examples of typical high energy and high
power lithium-ion chemistries are indicated in the figure. The figure illustrates the great diversity and
thus applicability of lithium-ion batteries, both as high-energy and high-power batteries.
battery alternatives, focus is also shifted from Li-ion cells to alternatives with higher capacities.This since their achievable capacities are reaching the theoretical maxima. At the moment,however, the lithium-ion batteries are both the most commercially viable and have the bestperformance.
Electrolyte, separator and supporting material for Li-ion batteries
To great extent, the different Li-ion chemistries use similar electrolytes and separators. Thesecomponents are of course also under development, and a range of different alternatives areemerging. However, most applications use a common approach.
The electrolyte choice for Li-ion batteries is commonly different kinds of lithium saltsdissolved in nonaqueous organic solutions. These solutions are liquid carbonate blends, pro-viding a large liquid temperature range, large voltage windows, low viscosity and good solu-bility compared with alternative liquid electrolytes such aqueous electrolytes [Goodenough &Kim 2009]. The penalty compared to aqueous alternatives is higher cost, flammability anddecreased conductivity. Compared to solid electrolytes they have better conductivity and againa larger voltage window [Daniel & Besenhard 2012].
The voltage window of an electrolyte is defined as the difference between the highest occupiedmolecular orbital (HOMO) and the lowest unoccupied molecular orbital (LUMO). The anodeand cathode potentials need to lie within these limits or the electrolyte will react with theelectrodes. In some cases, if the difference is small, a solid electrolyte interphase (SEI) layercan be formed to change the potential of the electrodes and make them stable together withthe electrolyte. This layer passivates the electrode by hindering electronic conduction, butalso decreases the wanted ionic conductivity. Carbonates generally have a HOMO at around4.7 V and a LUMO around 1.0 V versus lithium [Goodenough & Kim 2009]. All potentials willhenceforth be referenced versus lithium.
A common variant of nonaqueous electrolytes, that will serve as a good representative forthe electrolyte, is lithium hexafluoride, LiPF6, dissolved in a blend of ethylene carbonate (EC)and dimethyl carbonate (DMC). 1 M LiPF6 in a solution of EC/DMC shows a conductivity of10.7 mS/cm. It has limitations arising from its decomposition at high voltages into LiF and PF5,however, where PF5 reacts irreversibly with traces of water present. At temperatures above50 ◦C reactions with the carbonates in the electrolyte also occur [Goodenough & Kim 2009].The electrolyte also presents a safety risk since it is flammable. Due to these factors the
17

CHAPTER 3. COMPONENTS AND DESIGN ALTERNATIVES FOR ENERGYSTORAGE SYSTEMS
electrolyte type is not applicable to all possible chemistries, but it is currently used in mostcommercial cells. Common operating ranges are below 50 ◦C and 4.5 V due to the decompositiontemperature and HOMO. Despite its disadvantages for some chemistries, this electrolyte doesof course fulfill many of the requirements put on an electrolyte, such as good ion conductivity,low electronic conductivity, and acceptable voltage window. This is the reason that 1 M LiPF6
in EC/DEC/DMC is the most common variant of electrolyte in current commercial cells..
At the moment the most common separator, matching the above mentioned choice of elec-trolyte, is a micro-porous polyolefin membrane. These membranes often consist of polyethylene(PE) or polypropylene (PP), and most often a lamination of the two. This type of membraneis set between the two electrodes, and the electrolyte is contained within its pores, as well as inthe electrodes.
The setup with a polyolefin membrane with LiPF6 in EC/DEC/DMC provides a level ofsafety for the cells since the membrane will melt in the case of a thermal runaway, a situationwhere an increase in temperature promotes further increase. When the separator melts it hindersfurther increase in temperature due to high current. The choice of PE and PP also gives goodmechanical and chemical stability, at an acceptable cost [Arora & Zhang 2004]. Having theseparator melt is, however, a worst case scenario, since the battery then will be unusable. De-velopment of new separator and electrolyte alternatives that inherently resist thermal runawayis therefore of interest for further development. Flammability and decomposition temperaturesalso need to be improved.
Other key supporting materials are the current collector foils, to which the active materialis adhered, for mechanical support and conduction. The material of choice is aluminium dueto its good conductive properties, low weight and reasonable price. However, the low potentialof the active material might lead to corrosion of aluminium and unwanted alloying between thealuminium and lithium. The cathode active materials have high potential, so here aluminiumfoils can be used exclusively. The anode active materials have lower potentials, and due to thisthe aluminium foils might need to be changed to copper foils which corrodes at much higherpotentials than aluminium.
The foils are also used to design high power cells. By using thicker foils, more currentcapacity is achieved and thus higher power. In addition, adhering a smaller amount of activematerial to each foil gives the need for more foils to carry the total amount for material needed,but it also decreases the diffusion lengths giving higher power. These factors are used in thisthesis to scale the cells for high power applications.
3.1.2 Lithium-ion battery cathode active materials
Layered metal oxides
Layered metal oxides as cathodes for lithium-ion batteries were the first to be commercialized,starting with the use of the material LiCoO2 by Sony in 1990, a variant mostly used forelectronics [Daniel & Besenhard 2012]. The layered oxides have the general formula LiMO2
where M stands for metal and can be Co, Ni, V or Cr. The lithium is intercalated in planes,allowing diffusion in two dimensions. The metal is located in the alternating planes in astructure called the O3 layered structure, shown in figure 3.3. Layered metal oxide materialshave good electronic conductivity due to the structural contact between the metal atoms, andgood diffusivity due to the two dimensional movement.
The potential intercalation is one lithium ion per unit cell, resulting in a theoretical capacityof approximately 274 mAh/g. However only around 50% of this capacity, 150 mAh/g can be realized.This since the materials are not stable at deep cycling, and will start to loose oxygen andcobalt to the electrolyte. The materials do however have a high density, for example 5.1 g/cm3
18

CHAPTER 3. COMPONENTS AND DESIGN ALTERNATIVES FOR ENERGYSTORAGE SYSTEMS
Figure 3.3: Basic structure of the layered oxides (LiMO2). The metals and lithium are located in
alternating planes between oxygen layers. The metal M can for example be Co, Ni or Mn or combinations
of the three. Lithium is found in 2D layers in the material. Courtesy of D. Abraham, ANL.
Figure 3.4: Basic olivine structure of the phopho-olivines. M can be Fe, Mn, Ni or Co. Lithium is
present in 1D tunnels in the material. Courtesy of D. Abraham, ANL.
for LiCoO2, making them compact and appropriate for low volume applications. One of themain limitations of these materials is not their performance, but rather their need for scarceconstituents such as cobalt. In light of this, a continued use of layered oxides without very largerecycling might lead to constraints on material availability.
For layered metal oxides, there is also the opportunity to mix the metals used, creatingblends of for example Ni, Mn and Co oxides. The use of all three elements is often referred toas NMC, short for NickelManganeseCobalt oxides, and denoted with numbers to explain therelative amounts. NMC (Li(Ni1/3Mn1/3Co1/3)O2) is a common variant with equal amounts ofNi, Mn and Co. The use of aluminium in the oxides gives materials like nickel cobalt aluminiumoxides (NCA).
Layered metal oxides have not only been used in electronics. NMC is a good alternative forvehicle batteries, and there also exist mixes of layered oxides with for example spinel LiMnO2.This type of oxide does not have the layered structure described above, but rather a stablespinel structure. This type has been discussed for automotive purposes, but will not be furtherassessed in this thesis. Layered oxides are high energy chemistries, and this must be taken intoaccount when dimensioning for high power, heavy vehicle use.
Phospho-Olivines
Phospho-Olivines with the general formula LiMPO4 (M is Fe, Mn, V Co or Ni) have receivedincreasing attention the past decade. Due to the olivine structure and strong P-O bonds, thesematerials are structurally stable, and thus also a safer alternative than previous chemistries. Thelithium is transported in 1D tunnels in the material, making it sensitive to impurities in these
19

CHAPTER 3. COMPONENTS AND DESIGN ALTERNATIVES FOR ENERGYSTORAGE SYSTEMS
tunnels, see figure 3.4. This places demands on the processing, as high purity of the materialsis required. However, acceptable purity can be obtained with current processing methods, aswill be discussed in section 3.2.
Another key property of the material type is low conductivity, leading to a need for nano-sizing the material to minimize diffusion lengths for the lithium ions. Often it is also needed toadd a conducting material to enhance the electronic conduction. The most common approachto improve electronic conductivity has traditionally been with some kind of carbon coating,added to the material during processing. Future possibilities include replacing this coating witha network of carbon nanotubes or with conducting polymers [Wang & Sun 2012].
In this thesis two types of phospho-olivine cathode active materials will be assessed, LiFePO4
(LFP) and LiMnPO4 (LMP). The other two alternatives involving Co and Ni present higherpotentials, making them interesting, but adding the need for a new electrolyte with largervoltage window. Additionally, the use of Fe and Mn gives the opportunity to reduce the scarcityproblems associated with Co and Ni, present in the layered metal oxides.
Compared to the layered oxides the olivine types have one further drawback in that theyhave a lower density. This impacts the volume of material needed in a battery, which may bea weakness, especially in smaller vehicles where space is scarce. LFP and LMP have densitiesof 3.6 g/cm3 and 3.4 g/cm3 respectively [Nelson et al. 2011].
LFP has emerged as an interesting candidate for larger energy storage systems for auto-motive applications. Its main attribute of interest is the improved safety compared to layeredoxides, an important factor in vehicles. LFP batteries can also provide a rather high gravimetricpower density and are thus applicable to heavy vehicles. However, the electronic conductivityof LFP is only 10−9 S/cm, and this will lead to a need for nano-sizing. LFP has a potentialof 3.2-3.3 V versus lithium and theoretical capacity of 166 mAh/g, where 150 mAh/g is commonlyrealized in commercial cells [Daniel & Besenhard 2012].
As a contrast to LFP, which is already in production, LMP is under development, and isinteresting due to its higher potential of 4.1-4.2 V versus lithium. This gives the opportunity forhigher specific power and energy, but also for coupling to new higher voltage anodes. As withLFP the materials involved are non-toxic and reasonably priced. The potential is also acceptablewhile using common electrolytes as it is below the 4.7 V HOMO of LiPF6 in EC/DMC.
However, LMP shows even worse electronic conductivity than LFP due to a larger bandgap, the conductivity only reaches 10−14S/cm. This may place even higher demands on theproduction, and may require demanding nano-scaling processes [Martha, Markovsky, Grinblat,Gofer, Haik, Zinigrad, Aurbach, Drezen, Wang, Deghenghi et al. 2009].
LMP has a theoretical capacity of 170 mAh/g, and a capacity of 140 mAh/g has been achievedduring several cycles [Martha et al. 2009]. This indicated that there is potential for thesematerials, and the possibility of achieving the same stable capacity as LFP. At the moment,this capacity has not been realized for longer cycling, but will serve as an assumed referencefor the material during evaluation. If the low intrinsic conductivity of LMP turns out to be toolimiting, it is still interesting to evaluate, since a mix of LFP and LMP could be possible toenhance the voltage.
Due to its higher potential compared to LFP, LMP could be a future candidate for automo-tive purposes. It has the same potential benefits, but could deliver longer life (coupled with ahigh potential anode) or better power and energy.
Silicates
Silicates are a group of cathode active material for Li-ion batteries that present an interestingevolution to the phospho-olivines. Using Li2MSiO4 (M= Fe, Co and Mn) gives similar structuralstability due to strong Si-O bonds, but with an additional lithium ion available in the structure.This doubles the theoretical capacity to around 333 mAh/g [Daniel & Besenhard 2012]. Inaddition, the material also does not incorporate any of the previously questionable materials
20

CHAPTER 3. COMPONENTS AND DESIGN ALTERNATIVES FOR ENERGYSTORAGE SYSTEMS
in lithium ion batteries, such as cobalt or nickel. Instead it uses the very abundant Si, andif matched with a common metal such as Fe or Mn it is appealing option from a materialssustainability point of view.
One example of this group of materials is Li2FeSiO4 (LFS). This is an especially interestingmaterial alternative, as both iron and silicon are such abundant materials. This could decreasethe problems associated with using scarce materials while maintaining good stability and per-formance. Intrinsically LFS does however have low conductivity, around 6 · 10−14 S/cm, whichmight put even higher demands on the particle size and need for conductive additives comparedto for example LFP. The density is also low, around 1.3 g/cm3 when calculated from the unit cellsize [Nyten, Abouimrane, Armand, Gustafsson & Thomas 2005], resulting in low volumetricenergy and power densities.
Using this new cathode active material might lead to the need for another electrolyte salt,such as LiTFSI [Nyten et al. 2005]. This is due to the risk of reaction between the LiPF6 saltand the fluorophilic Si. However, since the main attributes of this electrolyte is close to that ofour previously presented electrolyte this factor will not be taken into further consideration inthis thesis.
Although it is possible to extract two lithium ions from LFS, the material has only beenproven to provide capacities around 140 mAh/g, closer to the theoretical capacity when only onelithium ion is free for transport. The reason for this is that currently only the Fe2+/3+ redoxreaction has been shown to take place at room temperature. However, it still holds the futurepossibility that a well-developed LFS cell could perform around 300 mAh/g if all the lithium isused, based on the theoretical capacity.
It has been shown that the capacity of the first cycle is close to 160mAh/g, but that itdecreases after a few cycles. A similar change can be seen in the potential which changesfrom initial 3.1 V to 2.85 V in following cycles. This indicates that a structure change mightbe occurring during the first cycles [Islam, Dominko, Masquelier, Sirisopanaporn, Armstrong& Bruce 2011]. Practically, a capacity of only around 85 mAh/g can be assumed at present[Chen 2013]. Further investigation of the changes occurring in the material during cycling, andthe parameters influencing the redox reactions will be necessary to fully evaluate the potentialof LFS.
It is clear that LFS faces many obstacles before it can be realized as a viable electrode activematerial. However, since it potentially presents an intrinsic improvement compared to LFP, itis an interesting material to evaluate. The low density is, however, a problem for some smallscale applications. In large scale vehicles the chemistry might be more interesting, especially ifthe volume constraints are not too severe.
3.1.3 Lithium-ion battery anode active materials
The first alternative for anodes in Li-ion batteries was lithium metal. The difficulties arisingfrom using this material are, however, quite large and other anodes were developed to solve theseissues. Although lithium has a high specific capacity of 3860 mAh/g, it is plagued by dendriteformation when cycling and by its inherent reactivity [Daniel & Besenhard 2012]. Today, themost common anode in Li-ion batteries is graphite. A viable alternative for high potentialcathodes is the use of Li4Ti5O12 (LTO), which will be discussed below.
Graphite anodes
Different kinds of carbon materials are possible as anodes for Li-ion batteries. Graphite has aunique structure with separate sheets of carbon in a hexagonal lattice. The bond between thecarbon atoms in the lattice are covalent bonds involving three of the four valance atoms, but theinterplanar bonds are weak van der Waals bonds. This results in good possibilities for storingLi-ions as they are intercalated between the planes of the graphite. The fourth valence atom is
21

CHAPTER 3. COMPONENTS AND DESIGN ALTERNATIVES FOR ENERGYSTORAGE SYSTEMS
free, and gives graphite its conductive properties, thus making it appropriate as electrode activematerial. Lithiated graphite is stable up to LiC6, giving it a theoretical capacity of 372 mAh/g,where 330 mAh/g is readily realized after initial cycling [Daniel & Besenhard 2012]. The densityis around 2.24 g/cm3 if battery grade graphite is used [Nelson et al. 2011].
One drawback of the graphite as anode for Li-ion batteries is that it has a slightly toolow potential (0.1-0.2 V potential versus lithium) compared to common electrolytes LUMO,resulting in a reaction between the electrolyte and the anode. This is mitigated by the solidelectrolyte interphase layer, the SEI layer, produced during the first cycle. Having a stable SEIis necessary when using a carbon anode, and is thus an inherent limitation. Having EC in theelectrolyte mix helps the creation of a passivating SEI and hinders further reaction [Goodenough& Kim 2009].
LTO anodes
LTO is an anode match for high potential cathodes and it has been explored during severalyears. One of its main advantages is a prolonged life-time. This is due to LTO having almostno expansion upon lithiation. An LFP cathode coupled with LTO can last up to 10000 deepcycles, compared to 3000 deep cycles when coupled to graphite [Kushnir & Sanden 2011].
Another improvement compared to graphite is that there is no formation of a SEI, and noneed for one, since LTO has a higher potential and does not react with the electrolyte. This givesthe opportunity for faster charge/discharge, since one limiting step is removed. The potentialis 1.5 V versus lithium [Nelson et al. 2011].
In general LTO itself provides faster charge/discharge times compared to graphite, at leastif the diffusion lengths in the material are not too long. That means that the material needsto be of nano-size for optimal performance. As a last benefit LTO can also function in alarger temperature range than graphite, allowing comparably fast and safe use at -50 ◦C to75 ◦C. However, LTO has lower capacity than graphite, 170 mAh/g is a reasonable result for thismaterial [Nelson et al. 2011].
Of course there is also a price to pay for the benefits of LTO. Due to the higher potential,the material puts limits on what cathodes are reasonable. The anode needs to be coupled withhigh potential cathodes in order not to decrease the open circuit voltage (OCV) too much. LTOalso has worse electronic conductivity than carbon based anodes, and thus needs nano-sizingfor optimal performance. The weight of the material may also be a limitation, especially forautomotive purposes. However, the density of LTO is 3.4 g/cm3 compared to graphite’s 2.24 g/cm3,making LTO volumetrically more beneficial [Nelson et al. 2011].
A common choice of cathode to couple with LTO is the spinel lithium manganese oxide(LMO), but in light of some of the future cathode active materials investigated in this thesisLMP is also a viable candidate due to its high potential.
Future anodes
The main goal when looking for future anode active materials is to find a material with betterenergy and power gravimetric densities. The best current anode is graphite with 372mAh/gas theoretical maximum capacity. Silicon and tin based materials could be one opportunity toimprove the capacity. Transition metal oxides are a possible alternative, although they sufferfrom a problematic voltage hysteresis during charge and discharge [Chen 2013]. Silicon basedmaterials will be discussed in some greater detail below, and will act as representative of futureanodes with greatly improved capacity, but currently with stability issues.
Pure silicon has a theoretical capacity of 4200 mAh/g, but the volume expansion during chargeis up to 400% [Chen 2013]. Due to this, the initially high capacity is quickly reduced whenthe materials is cycled. The expansion does not only damage the material, but also breaksthe SEI causing reactions between the electrolyte and anode that can be both dangerous and
22

CHAPTER 3. COMPONENTS AND DESIGN ALTERNATIVES FOR ENERGYSTORAGE SYSTEMS
deteriorating. There are, however, possible solutions to volume expansions of this magnitudein electrode active materials.
One alternative is to nano-structure or nano-size the material. The volume expansion foreach particle can then be fit into the increased amount of free space present between the particles[Chen 2013]. Another alternative is to have the silicon in a porous structure of some morestable materials like carbon, thus dividing the roles of the electrode active material betweentwo materials, one for reaction and one for stability. Porous carbon silicon composites leavespace for the expansion of the silicon, but the added material does of course penalize the weight.Silicon is only one interesting candidate, but it highlights the problems of large expansion thatneed to be overcome for the materials to work in applications.
3.1.4 Novel cell types
Lithium-ion batteries with intercalation electrodes may be a dominating player on the recharge-able battery market at the moment, however, other alternatives exist. This section discusses theconcept of lithium-sulfur batteries, sodium-ion batteries and also organic batteries, representingnew approaches.
Lithium-Sulfur
Lithium sulfur (Li-S) batteries are a modified approach to Li-ion batteries as they do not containany metals besides lithium and uses a cathode of only sulfur. Li-S uses no excess materials tocreate a stable crystal structure, like for example Fe, Ni, Co and Mn in LFP or NMC. Thismakes it cheap, light and environmentally sustainable. Due to its weight the capacity can bevery high, up to 1675 mAh/g [Ji & Nazar 2010], and this could compensate the low potential of2.15 V. The anode is often metallic lithium, which causes problems due to reactivity. Otheranode types have not been proven to give good performance [Daniel & Besenhard 2012].
Li-S batteries have not, to date, been realized in a way that would make them applicablefor automotive purposes in the near future. However, since they present such an appealingenvironmental alternative, work continues to reach a viable Li-S battery in the future. The mainissue is the poor cyclability. When running a Li-S cell soluble polysulfides are generated duringthe reduction steps. These compounds diffuse trough the electrolyte due to the concentrationgradient. At the anode they react to form lower order polysulfides, creating a new concentrationgradient and diffusion back to the cathode were they oxidize back to their original form. Thisphenomena is called a shuttle mechanism and decreases the capacity of the cell as well as causeshigh self-discharge [Ji & Nazar 2010]. If at some point the sulfides are fully reduced (Li2S),they act as an insulator, possibly passivating both the anode and cathode [Barchasz, Lepretre,Alloin & Patoux 2012].
Li-S batteries are also limited by the insulating nature of sulfur and lithium sulfide. Toincrease rate capability and electrical properties the cathode active material needs to be placedin a structure of conducting carbon or possibly even metals.
Na-ion batteries
One issue with the Li-ion batteries is the cost, and possible scarcity issues of lithium. Sodium-ion batteries (Na-ion) are a possible solution to this problem, since sodium is abundant, andhas similar properties to lithium. Sodium also comes at a lower cost than lithium, an importantfactor in the search for a cost effective energy storage system. It also has a reasonable potentialaround 2.5-3 V [Ellis & Nazar 2012], and good theoretical capacity around 150 mAh/g.
Focusing on the automotive industry Na-ion, however, has one large drawback, its weight.Due to it being a heavier element, and with its lower potential, the Na-ion battery has lowergravimetric density than a comparable Li-ion chemistry. However, sodium is becoming a viable
23

CHAPTER 3. COMPONENTS AND DESIGN ALTERNATIVES FOR ENERGYSTORAGE SYSTEMS
candidate in light of the increasing need for cheap battery material [Ellis & Nazar 2012]. Thisis especially true for large volume applications where the weight of Na can be compensated byits price.
Different types of Na-ion batteries exist, much like for Li-ion. Examples of cathode activematerials are sodium manganese oxides and sodium iron phosphates, reminiscent to their Li-ioncounterparts. The basics of the structures are similar, but due to the larger size of sodium themost effective structure may differ. As an example of performance, olivine NaFePO4 (compa-rable to the LiFePO4) has a theoretical capacity of 154 mAh/g [Palomares, Serras, Villaluenga,Hueso, Carretero-Gonzalez & Rojo 2012].
Organic batteries
The term ’organic battery’ covers a wide range of different battery types, from batteries whereeach component is organic, to Li-ion batteries with organic electrode active materials. Generallythe point is to reduce the impact of materials processing, simplify and improve recycling andreduce the amount of toxic components in the batteries.
Fully organic batteries rely on a redox-active organic compound to constitute both elec-trodes. The materials also need to be active when paired together as anode and cathode, ademand that has limited the amount of possible materials [Zhu, Lei, Cao, Ai & Yang 2013].The idea has however been realized with, for example, n- and p-doped radical polymers. Thehuge drawback with these batteries at the moment is that they have a very low specific energydue to low potentials and limited energy storage. The concept is interesting, but work on findingand developing materials that will be stable as electrodes and produce high enough voltages isstill in an early stage. Both the gravimetric and volumetric energy density needs to undergomuch development before these materials are considerable for any purpose, let alone automotive.
A way of incorporating organic materials that is closer to realization is to use organicelectrodes for a Li-ion battery. Organic electrodes for lithium ion batteries is not a new idea, butdue the fast development and success of inorganic cathodes such as layered oxides and phospho-olivines they received less attention during the 90-ies and in the beginning of this century.However, since these inorganic materials are reaching the limit of performance progress, organicelectrode active materials are again more interesting. Organic based electrodes do not onlypresent a possibly well performing material with capacities usually over 400 mAh/g [Liang, Tao& Chen 2012], they are also interesting due to their potential environmental friendliness; theydo not incorporate scarce metals, do not require high temperatures or milling to achieve goodcrystal properties, and their energy and materials impacts are low. In addition, these factorsmake them potentially less expensive and non-toxic.
There are a variety of organic electrode alternatives for Li-ion batteries such as; organosulfurcompounds, organic free radical compounds or carbonyl compound to mention a few groups.The main challenge for all types is to achieve good specific energy and power while maintainingcycling stability, but a universal answer is hard to find since many different materials are beingtested. Therefor organic electrodes will become possible candidates first when more work hasbeen conducted to find fewer and more effective candidates, and these candidates have beenevaluated and improved. The structure and ion transport in the materials needs to be furtherunderstood [Liang et al. 2012]. For automotive purposes it is also important that the newelectrodes have sufficient stability to ensure safety.
3.1.5 Environmental impact of battery constituents
Any kind of switch from fossil based fuels to other technologies should be accompanied witha discussion about the potential for material scarcity and environmental impacts of the newtechnology, due to the large scale of the transportation sector. It is important to be aware ofhow long the resources needed for a new technology may last, and how much environmental
24

CHAPTER 3. COMPONENTS AND DESIGN ALTERNATIVES FOR ENERGYSTORAGE SYSTEMS
impact the use of these materials will have, both now and in the future. Achieving good insightinto the possible limitation of new technologies is, however, easier said than done.
Assessing all possible scenarios for future improvements, market sizes and material choices isimpossible. None the less, no matter how many uncertainties exist concerning the future supplyand impact of using different materials, it is still important to prepare and evaluate as manyscenarios as possible. Having evaluated different effects that might come from changes in supplyand price helps guard against unwanted backlashes that may come when the technology becomesmore widely used. This thesis will not evaluate different scenarios, but a short summary of somecurrent assessments of the material resources available for vehicle batteries is presented. Thisinformation will provide a base for discussion of the advantages and disadvantages that mightarise in the future from using different chemistries.
Lithium
The impact and scarcity of using lithium is an important factor to consider if Li-ion batteriesare to be used as ESS in an expanding market of electric vehicles, because lithium is ultimatelythe only material that cannot be substituted. Opinions vary concerning if and when (and forwhich actors) a lithium shortage may occur. The critical factor will most likely be the rate atwhich lithium can be extracted, and if this rate can keep up with the rate with which electrifiedvehicles increase [Andersson & Rade 2001]. If not, the extraction rate will be the factor thatlimits the spread of electrified vehicles.
It is interesting to notice that all assessments of lithium resources assume that used batterieswill be recycled for lithium, yet this assumption may prove to be difficult to fulfill [Kushnir &Sanden 2012]. At the moment, the lithium stock available in used batteries is small comparedto the potential future demand. The future need for recycling is, however, an interesting point,since recycling today is not well developed for lithium. The state of recycling will be discussedin section 3.5.
Geographical location of the lithium resources is another potential problem for large scaleuse of lithium based batteries. At present, Chile is the dominating producer of lithium. In thesame region Bolivia has smaller production, but large reserves. China and the USA also haveopportunities for rather large production, however, their reserves come nowhere near those ofChile [Gaines, Nelson et al. 2009]. However, the lithium production in the world is not limitedto the above mentioned countries. The U.S. import is a good example; their prime suppliersare in order Russia, Norway, China, Canada, Finland, Zambia, Belgium, Australia, Brazil andMorocco [Gaines et al. 2009].
Nevertheless, the fact that such a large portion of the world’s lithium reserves lies in sucha small geographical area as Chile and Bolivia could become a problem if the use of electrifiedvehicles expands greatly. In this case the need for lithium will be very large and all reserveswill need to be accessible. The limitation of having few and localized producers may lead tomany other political consequences. Assessing these are of great interest, but will not be furthercovered here. The use of lithium as a key component in future propulsion technologies willhowever imply a need to evaluate these questions further, and partly motivates the discussionon recycling in this thesis.
Cobalt, nickel and manganese
Cobalt, nickel and manganese represent the possible metal components in layered metal oxidecathodes. Cobalt, and to a lesser degree nickel are scarce and valuable, and thus representa potential limitation for chemistries based on oxides with these elements. Manganese is lessscarce than the other two elements. Gaines et al. [2009] estimates a reserve availability of 5200million tons, compared to cobalt’s 13 million and nickel’s 150 million tons. One electric carwould roughly need 30 kg of cobalt or nickel, and for a LiCoO2 battery this would mean the
25

CHAPTER 3. COMPONENTS AND DESIGN ALTERNATIVES FOR ENERGYSTORAGE SYSTEMS
supply would sustain 450 million vehicles [Andersson & Rade 2001]. This should be viewedin light of the total worldwide sales of 81.7 million vehicles during 2012 [OICA - InternationalOrganization of Motor Vehicle Manufacturers 2013]. With ever increasing sales, and a largerand larger part of these vehicles being electric, this would mean a fast depletion of the reserves.Using NMC with only a third of the amount of cobalt would imply an increased amount ofvehicles, but no long term viability. Larger batteries with more active material could alsoincrease the material consumption.
Cobalt and nickel are limiting factors if chemistries with large amounts of these elementsare used [Andersson & Rade 2001]. However, these elements are also the only ones that aresuccessfully being recycled at the moment, due to their high value. With the factors of valueand recovery in mind, the use of these more scarce materials can be possible, at least for aprolonged period of time. It is safe to say that the risks of using cobalt and nickel have sparkedthe search for more sustainable materials choices.
Other common battery materials
The remaining battery components can be made of a wide range of different materials. However,some materials are more common than others. Aluminum and copper are the most commoncurrent collectors. Titanium and graphite are present in common anodes and iron and phos-phorous in the common LFP chemistry. None of these have the scarcity issues of the abovementioned metals. Copper can be expensive, but has a good recycling chain, and more than 40%of total world copper demand is met by using recycled copper [BIR - Bureau of InternationalRecycling 2013]. For aluminium this number is more than 33%, and for both metals it is lessenergy intense to recycle than to extract virgin material.
It can be concluded that recycling is of great importance, if a large fleet of electrified vehiclesis the target. Lithium is a key resource, and the supply needs to be ensured for a future casewith a much larger stock present in used batteries. Nickel and cobalt based alternatives willnever be viable on a long time scale, but much less so without recycling.
3.2 Materials manufacturing
The processing and production of different materials is an important factor to consider whenchoosing chemistry and evaluating the environmental impact. The processes chosen can betweaked and modified in almost every step to suit the material being processed. Several processmethods that are inherently different also exist for most materials. ’Dry’ processes involve hightemperatures to synthesize the material, relying of simple mixing and heating of the precursors.’Wet’ methods instead use low temperatures, but have a need for chemicals or solvents. Thesemethods will be presented in more detail in this section.
The methods place different burdens on the life cycle and are appropriate for differentmaterials and precursors. They also provide different opportunities when it comes to nano-sizing the materials. With dry production methods there is a need for energy intense millingif small sizes are desired. Wet methods on the other hand, can produce nano-sized materialsdirectly during synthesis.
Dry synthesis active material production
As mentioned, dry synthesis methods are synthesis routes where the precursors are heated tohigh temperatures in order to obtain reaction and good material properties. Solid state synthesisis one of the most commonly used synthesis methods to date and simply uses different heatingand mixing steps. Microwave heating is an interesting alternative dry synthesis route. Here the
26
CHAPTER 3. COMPONENTS AND DESIGN ALTERNATIVES FOR ENERGYSTORAGE SYSTEMS
precursors are heated with microwaves to achieve a uniform heating in short time [Jugovic &Uskokovic 2009].
The solid state synthesis will be the dry synthesis route of choice for the purpose of thisthesis, since it is rather straight forward. The precursors are simply mixed and then sinteredfor a varying number of hours until the desired crystallinity is reached. The temperatures andsintering times can vary with the active material being produced.
Solid-state synthesis of phospho-olivines and silicates is possible. Besides the sintering,a milling step is however required to achieve the nm size needed for these materials. Theprecursors for producing LFP and LMP via sold-state synthesis are stoichiometric amountof iron or manganese salts like iron-oxalate, lithium in the form of for example LiOH and aphosphorous source, most commonly ammonium phosphate [Jugovic & Uskokovic 2009]. ForLFS the precursors can be similar as for LFP, but silica is used instead of ammonium phosphate[Huang, Li, Wang, Pan, Qu & Yu 2010].
Solid-state synthesis is commonly used for layered metal oxide cathodes like NMC. Sincethere is no need for nano-sizing, the process provides sufficiently performing material withouthaving to include the energy intense milling step. Possible precursors for this synthesis routeare LiOH with metal sources from Ni, Mn and Co oxides [Wang, Sun, Chen & Huang 2004].
Wet synthesis active material production
Wet synthesis methods are a group of methods based on treating precursors in water solution.By dissolving the precursors, opportunity to achieve better homogeneity and control of particlesize is achieved. Examples of wet processes are hydrothermal, sol-gel and co-precipitationsynthesis. Hydrothermal will be the wet process assessed in this thesis, since it is cheap, possiblylow-energy and has been shown to provide Li-ion cathode active material with good properties.The main approach for hydrothermal synthesis is to dissolve the precursors in water. Thesolution is then heated for a varying number of hours, depending in the material being produced.Next, the reacted material is filtered from the solution and dried. Finally the material is heattreated in order to obtain the desired crystallinity.
A few factors have been shown to contribute to material performance if using hydrothermalsynthesis for the phospho-olivines and silicates. It has been shown that the temperature cannotbe too low if good results are to be achieved with the processed material. Below 175 ◦C themetal disorder can reach 8% [Chen, Wang & Whittingham 2007], meaning that 8% of the ironin LFP is located in the lithium diffusion channels which strongly hinders the performance ofthe material. Apart from this demand there is also a need to stop the unwanted oxidation offerrous to ferric iron, which readily occurs in water if no reductive agent is added. An exampleof such an additive to hinder oxidation is sugar.
The precursors for hydrothermal synthesis of LFP and LMP are LiOH, H3PO4 and FeSO4 orMnSO4, and these will be used in this thesis, although others are possible. For LFS precursorsfor wet synthesis such as LiOH, SiO2 and H8Cl2FeO4 have been explored [Dominko, Bele,Gaberscek, Meden, Remskar & Jamnik 2006].Hydrothermal synthesis of NMC is perhaps not as beneficial as for LFP and other materials need-ing nano-sizing. However, hydrothermal synthesis is possible and may be beneficial if the totalenergy-use can be reduced. Generally the process starts from LiOH and Ni1/3Mn1/3Co1/3(OH)2.The metal hydroxide is prepared from NiSO4, CoSO4, MnSO4 and NaOH. In this stage achelating agent is needed as well, since this prevent the formation of unwanted single metalhydrides like Co(OH)2 [Lee, Kang, Myung & Sun 2004].
27
CHAPTER 3. COMPONENTS AND DESIGN ALTERNATIVES FOR ENERGYSTORAGE SYSTEMS
Anode active material production
Graphite anode production methods are not similar to the cathode methods, since the materialis so different in nature. Battery grade graphite has higher requirements placed on it thannormal graphite. Therefore the graphite is usually baked, so as to remove any oxygen impurities[Majeau-Bettez, Hawkins & Strømman 2011].
LTO on the other hand can be produced in similar ways to the cathode active materials.However, there mainly exists one method, used by the company Altair [Verhulst, Sabacky,Spitler & Prochazka 2003a]. They make use of a hydrolysis step followed by calcining, wetmilling and drying. As opposed to the nano-cathode active materials, the size of the LTOachieved with hydrothermal synthesis is not adequate, since LTO requires a particle size ofdown to 20 nm. This makes production of LTO very energy intense since it requires bothmilling and hydrothermal synthesis.
Carbon coating
Some of the materials of interest need conductive coating to perform well. In these cases acarbon coating step needs to be incorporated into the process, and this can be done in severalways. In general the coating can be added ex situ, after the active material is produced, or insitu by mixing the carbon additive with the precursors before reacting. Examples of additivesare sugars, pure carbon like acetylene black or conductive carbons like carbon nanotubes [Chenet al. 2007].
If the carbon is added after the material is produced the coating can be formed by a millingand sintering step[Konarova & Taniguchi 2009], or other mixing and heating alternative. Thisis often the alternative chosen for solid-state synthesis routes. A risk is that the heating stepneeded to achieve conductive carbon negatively affects the particle size [Li & Zhou 2012]. Forhydrothermal synthesis the in situ addition of carbon additive to the precursor solution canprovide a way to incorporate the additive on a smaller scale, thus giving a better distributionof the coating over the particles and less risk for particle growth due to heating.
3.3 ESS design
The technical design of the ESS have many criteria to satisfy, as discussed briefly in section 1.6.Firstly there are the most fundamental ones of voltage, pack energy capacity, power output andallowance of different discharge rates. Then follows constraints on the safety, controllability,volume, dimension, weight, physical robustness, opportunity to diagnose, cost and life length.From a manufacturing point of view, the ESS should be easy to mount and to disassembly.Adding to this the possible environmental constrains makes the task to find an optimum designquite complex. However, the environmental aspects enter in only a few on the design criteria.These are the construction- competing with robustness, safety, and costs - the weight, and thechoice of materials - competing with costs. Further on the design of the ESS can be madecompatible with a number of organizational options of use. Depending on the economics, theuse of the same ESS could be promoted in different applications, some components could bedismantled and used again, and the ESS could be sold to another organization with other usesthan the automotive. These aspects are secondary, but equally important in the choice of ESSdesign, adding extra requirements to the original set up of limits and constraints.
Interoperability
Since the battery prices are important for the growth of the xEV fleet it is of high interest tosee what solutions there are for cost reductions and what could be the environmental impacts
28

CHAPTER 3. COMPONENTS AND DESIGN ALTERNATIVES FOR ENERGYSTORAGE SYSTEMS
related to those measures. The standardization of components will be an important step towardscheaper battery packs and for this a large production volume is needed. To achieve this manydifferent applications could go together in using the same product, in a so called interoperability.
The system level of future interoperability has many question marks. It could be that eitherpack, modules, cells or specific components of the pack such as the housings and electronics aredesigned in common to suit various different applications. With the highly varying requirementsfor different types of battery applications [Eyer & Corey 2010] it may be difficult to performinteroperability on a cell level or of a complete module unit due to the varying chemistryrelated properties. If instead different cell types could be fit in the same standard module andpack housings and electronics, some reduction in manufacturing costs could be possible. Thecomponent dimensions and volumes will then be parameters related to environmental impacts.Even in case the cell chemistry could be kept the same, the connections between the cellscould need to be different to suit different voltage requirements from the applications. Forinteroperability of complete packs, there may be a need for using a multiple of one commonpack size to satisfy different applications. To make an example of interoperability the choice ismade to use a PHEV car as an additional application that the PHEV bus module unit shouldbe designed according to. In this thesis the changes in materials and components when designmeasures are taken to perform interoperability on a battery pack or module will be accountedfor in the environmental impact assessment.
3.3.1 Pack manufacturing
The manufacturing of the pack is made in two distinct steps; the first consisting of the moduleassembly, in which cells are connected and inserted into the module, and the second similarlyconsisting of the insertion and interconnection of the modules into the pack housing. Thesetwo steps are the last in a chain of processes from extraction of materials to the shaping of thepack components and assembly leading to the final product. Different designs can be better orworse from an environmental and economic point of view. To find out if and how economic andenvironmental aspects can be joined, a comparison between the most costly processes and themost environmentally demanding processes needs to be done. In the same way the most costefficient and environmentally efficient pack design options may be compared.
An environmentally beneficial pack design contains materials of low process energy and ofhigh availability in the earth crust. From an economical point of view the pack should alsocontain cost efficient components and materials. These materials could potentially conflictwith the need to minimize time, and the complexity of the actions needed to include these costreducing materials in the manufacturing stage. All these three materials factors - environmental,cost and simply manufacturing - have to be balanced in the quest for an environmentally efficientpack design, since one of the big barriers for a larger introduction of lithium ion batteries is thehigh costs.
For some components in the pack - copper and electronics - both the environmental andthe economic costs are high. For other components such as housings as steel, plastics andaluminium, the environmental aspects and the costs may promote different optimal solutions[Ashby 2012]. The common and secure factor of both cost and environmental load is at presentthe energy in terms of fueling different processes and the energy needed for transport and usephase. The costs related to the pack production can be allocated to purchased items andmaterials, and to the man hours needed for the assembly.
From an environmental point of view, the most energy intense processes are found in thematerials extraction and production of metals. In contrast, the energy need for assembly ofdifferent components into a product is smaller in comparison. The comparison between costand environmental impact is, however, only valid in an instantaneous perspective. As it isderived from the intrinsic value of nature resources, the environmental impact has the property
29

CHAPTER 3. COMPONENTS AND DESIGN ALTERNATIVES FOR ENERGYSTORAGE SYSTEMS
Figure 3.5: The battery pack modularization, a) no containing module walls, b) minimum modulariza-
tion, cell string row included in module, c) maximum modularization, 1-4 cells contained in module.
of independence from the world market forces, and will thus be the same no matter fluctuatingmaterial prices.
3.3.2 Modular design
A topic investigated more closely in the battery pack design is the modularity and its implica-tions on the ESS design parameters. The choice of using modularity in the pack is due somedifferent reasons, all depending mainly on controllability and safety, but secondary effects onother parameters are many. Modularity as a design approach is illustrated in figure 3.5 wherethe impacts of added interfaces are made visible.
The economic reasons for modularity can be derived from the concepts of production volume,reuse and remanufacturing. Ultimately, the benefits of modularization are that defect units canbe detected and exchanged without need to change the whole system. Second life applicationsmay be favored since the remanufacture is facilitated, (suitable units may be extracted and usedagain), and standardization of modules and packs may reduce the long term manufacturingcosts.
Modularization advantages and drawbacks
The disadvantage of modularization is that it requires more passive material and thus increasedweight and cost both at module and pack level. The increased amount of material is needed forconnecting and protecting the cells. A scaled up modularization leads, in particular, to increasedtotal module surface with a corresponding increase in number of electric interconnections andcontainer walls. To conclude, the simple rule is; the smaller the modules, the higher theproportion of passive materials will be, and the lower the gravimetric energy density.
If smaller modules are the key to higher production volumes and cost reduction, the positiveimpact from electrified vehicles will be damped from the higher rates of materials used. Thesignificance of the impact of increased passive materials should be analyzed. To do so, thepassive materials must be defined in detail, and the possible amounts used for different typesof modularization assessed.
30

CHAPTER 3. COMPONENTS AND DESIGN ALTERNATIVES FOR ENERGYSTORAGE SYSTEMS
The following list will describe the driving forces for increased subdivision in modules(modular scale-down):
• Standardization (smaller units suit a wide range of applications when assembled).
• Decreased module unit costs from increased production volume.
• Increased control possibilities and diagnose precision.
• Lower voltage per module, more safety.
• Facilitating remanufacturing and second use (switching modules).
• Standardization leading to cost reduction and increasing xEV use.
In contrast to there are also driving forces for decreased subdivision in modules (modular scale-up):
• Decreased weight from module interface walls and interconnects.
• Decreased energy consumption during driving due to battery pack weight.
• Decreased embodied energy from module and pack housing materials.
• Less parts to assembly in battery pack meaning decreased assembly cost.
• Marginally less battery pack housing materials needed.
• Minimize losses from resistances in module interconnects (Voltage drop).
• Less complicated cooling circuitry needed.
Module dimensioning coupled to voltage constraints
The best size of the module depends on various constraints that should be respected. Themaximum voltage, for example, limits the number of cells in series contained within one modulein order to guarantee safe handling. Additionally, other voltage limits to respect are those ofthe vehicle. For the bus, 500-730 V is the nominal pack voltage range 1, [Volvo Buses 2013b].For the PHEV car, lower voltages are required, for this thesis assumed to be 200-430 V 1, anexample is Volvo V60 plug in hybrid of 400 V [Volvo Cars 2013].
In figure 3.6, the options of pack capacity are visualized together with the required connec-tion types and the number of cells for the PHEV bus, given the voltage limits. If interoperabilitybetween a bus and a car is wanted for reasons previously described in section 3.3, the modulewill most likely need to have flexible connection types. Making an example of interoperabilitybetween a bus and a car with a NMC pack of30-60 kWh, respectively 5-15 kWh, the smaller carpack would require cells in series connection or two cells in parallel connection in order to respectthe voltage constrains, while the larger bus pack would require and 3-4 parallel connections tosatisfy the voltage criteria. The method for determining possible interoperability can be seen infigure 3.7. It should be noted that the capacities in this figure are indicative, assuming no lossesin the system, and that the focus is set on the voltages. The real cases have losses of 4-10% 2
in capacity depending on the amount of connections etc., and for each case a more profoundmodeling should be done in BatPaC to obtain realistic numbers.
The possibility of interoperability is higher for two packs of similar size, for example 24 kWhand 40 kWh, if they can meet at a an adjusted voltage of for example 480 V, since they coulduse the same connections, even if the solution is rather unpractical for both applications. The
1Estimate from personal communication with Jens Groot, 2013.2Estimates from calculations in BatPaC
31

CHAPTER 3. COMPONENTS AND DESIGN ALTERNATIVES FOR ENERGYSTORAGE SYSTEMS
Figure 3.6: The available options of LFP pack capacity in relation to number of cells and parallel
connections respecting voltage limits for a bus are illustrated. The method illustrated in the scheme
may be used as a guide to determine the possible pack capacities when dimensioning a pack based on a
certain cell type, and the connection types needed.
Figure 3.7: The figure shows the NMC pack capacity in relation to number of cells and parallel
connections for the voltage constraints of a car and a bus. The scheme can be used for a preliminary
overview of possible options of interoperability for module units between bus and car, telling if the same
type of connections can be used.
32

CHAPTER 3. COMPONENTS AND DESIGN ALTERNATIVES FOR ENERGYSTORAGE SYSTEMS
best would be to have interoperability only between units of the same voltage requirements. Asa last solution for applications of different voltage criteria, the parallel connection of modules,or module strings could be an option especially when the difference in pack size is high. In thiscase, the low voltage solution for the small pack can be series connected to a module string whichstays within the ranges of the larger pack maximum voltage limits. For example a car pack of12 kWh, 180 cells and 3 parallel connections could build up a bus pack of 41 kWh and 540 cells,by series connecting three of the car packs. To reach larger capacities this module string canthen be multiplied and parallel connected to reach the wanted capacity. An important commentis, however, that the parallel connection on the module string level is expensive and difficult tomanage in terms of control and regulation systems. The implications of parallel connections ondifferent system levels are shown in table 3.2.
Table 3.2: The drawbacks and advantages related to different options of system level for parallel
connection, see system definitions shown in figure 3.8. * The higher level of parallel connection makes
the control units treat higher amount of data, measuring the voltage of each cell comprised within the
parallel connected system part.
ParallelConnection
Type Advantages Drawbacks
Cell Less monitoring info Low voltage for car.A-A for Bus. Difficult to exchange single cells.
No constraint on number Complicated welding if 3 cells in parallel.of modules per string. Requires that No. of cells per module is
dividable with No. of cells in parallel.
Module Flexible choice of parallel More monitoring data for bus*.B-B connection. Requires that No. of modules is dividable
No constraint on cells per with No. of strings in parallel.module
Pack Flexible choice of parallel More monitoring data for bus.C-C connection. Difficult to respect max voltage constraint
No constraint on No. of and lowest voltage constraint, capacitycells per module or constraint.No. of modules/string.
After having defined the voltage ranges, and the capacity of the pack, the same should bedone for the module. The modularization has the consequence of adding extra material to thebattery pack. One approach is to take the total cells fulfilling the capacity and power criteriaof the vehicle and divide them into a certain number of modules in a top down approach.Unfortunately this method sets rather fixed limits on the possibilities of modularization. Theexact number of cells will most likely not be kept if both pack dimensional requests and voltagerequirements should be satisfied. If instead a bottom up approach is used, the available rangesof defined module sizes, can be built up to the wanted pack. This way of designing the pack,makes sure that the voltage, connection type, and safety properties of the modules are alwaysrespected, which further implies that the pack voltage and safety parameters will be fulfilled nomatter of the geometry of the pack.
Module dimensioning coupled to control circuitry
The number of cells that can be mounted by a single printed circuit board (PCB) used for BMSand SOC controllers is normally 6 or 12 [Conte 2006]. The control units can be strategicallyplaced in the ESS system. Two possibilities are present, the first, to position the SOC controllers
33

CHAPTER 3. COMPONENTS AND DESIGN ALTERNATIVES FOR ENERGYSTORAGE SYSTEMS
independently from the modular configuration, or the second, to integrate them in the moduleunit. In the largest module, with an internally placed control unit, the cells per module (CPM)should not exceed 12. However for externally placed control units, the number of CPM is moreflexible, but attention should be paid to make efficient use of the PCB since the it is expensiveand has high environmental impact.
The choice of independently positioned PCB optimizes the rate of used inputs for all modulardesigns with a number of CPM different from 12 or 6. In this design, all cells of the pack aremonitored by a group of PCB units. For a PCB of 12 connected cells an example of theefficiency of use of the control units is estimated for some different number of CPM (table 3.3).The conclusion is that an independent external control unit gives more efficient use of PCB andgives more freedom in the module dimensioning. The disadvantage of the independent PCBgroup is that the diagnosis of the single modules is lost at module reuse.
Table 3.3: Example of use rates of PCB depending on cells per module and internal and external
placement of the control unit: The externally placed unit is less sensitive to the number of cells per
modules for an efficient use, compared to the internally placed PCB.
Cells per module 13 12 11 10 9
Rate of external unused PCB % 3 0 1.8 1.8 0.9Rate of internal unused PCB % - 8.3 0 16.7 25
Number of modules 50 54 60 66 74
Total cells 650 648 660 660 666
Table 3.4: Example of modularization effects on module housing: The module housing surface decreases
with increasing number of cells per module for the same amount of total cells in a battery pack.
Cells per module 4 6 12 54 216
Module surface (m2) 16 12 8 4.9 4.3Number of modules 162 108 54 12 3
Total cells 648 648 648 648 648
Controlling cells in terms of voltage and temperature when divided into smaller subunits isan easier task than to regulate the whole amount of cells in one large chunk 3. Modularization isconsequently a way to reduce the amount of information to treat by each control unit, makingthe regulation more efficient. Finally, for the simple reason of controlling the cells positionsome walls are needed around the cells, and from a manufacturing point of view the moduleunit makes the positioning of the cells in the pack easier.
Modularity impacts on the total material needs
Different module sizes imply different number of interfaces in the pack, and the total surfacefor the housings will vary according to the module size, considering design choices in which thenumber of cells is constant within the pack. As a first approach to quantify the modularizationimpact on the battery, the minimum and maximum cases of modularity should be identified.
As an example, if the minimum module is set to contain a cell group of 4 cells, and thelargest to reach a maximum of 60 V (the legal safety limit) with maximum 3 cells in parallel,using LFP cells at 3.3 V per cell would produce a module with 3 · 60/3.3 =54 cells. From4-54 cells could thus be included in one module with internal parallel connection. In case ofonly a series connection, the number of cells per module should be 18 to stay within the 60 V
3Personal communication with Jens Groot, 2013.
34

CHAPTER 3. COMPONENTS AND DESIGN ALTERNATIVES FOR ENERGYSTORAGE SYSTEMS
safety limit. Assuming pack dimensions of 0.3 m x 0.5 m x 2 m, and cell dimensions of 160 mmx 230 mm and 8 mm thickness (consistent with cells modeled in this thesis, see section 4.1.1),the surface of the minimum module of 4 cells has a surface of 0.099 m2 and the maximum of54 cells has a surface of 0.41 m2. For a total pack of 648 cells, the smallest module unit resultsin 16 m2 surface (162 modules) and the largest module results in 5 m2 surface. The materialneeded for the smallest module size of the pack is thus about three times larger than the largestmodule option. See table 3.4. Assuming copper connects of 40 g each between modules, thetotal amount copper would differ between 0.5-7.6 kg from the largest to the smallest modules.
For a steel module housing, the difference between the highest and the lowest rate ofmodularity would equal about 43 kg steel, and between 45 and 360 USD depending on if stainlesssteel or low alloy steel is used. Counting embodied energy cradle to gate, the difference is of1400 MJ (low alloy) to 3600 MJ (stainless) [Ashby 2012]. For aluminium the difference wouldbe 15 kg housing, 41 USD and 3700 MJ embodied energy cradle to gate [Ashby 2012]. Thealuminium is lighter, cheaper, has a similar energy impact of chromium steel, is stable tocorrosion, but has a lower Young’s modulus (gives less strength to the construction). Generally,increased Young’s modulus implies higher embodied energy [Ashby 2012]. Due to the batteryweight related fuel consumption, the aluminium housing is preferable from the environmentalaspects.
Pack geometries and material
The battery pack can be built up according to different geometries, to achieve a long pack,prismatic compact pack (cuboid), or cubic final shape. The long pack is suitable in cases whenthe modules can be series connected in a single row and stay within limits, otherwise the packwill be difficult to connect. The cuboid pack is suitable for relatively large amount of modules,which can be organized in one single layer for easy access. The cubic pack is the least materialconsuming solution but has the disadvantage of complicated access to certain module units, aproblem for assembly and disassembly. The influence of using different layouts can be seen insome examples of a 40 kWh pack in table 3.5.
Table 3.5: Example of module layout configurations effects on pack housing surface. The same number
of modules build up a 40 kWh LFP pack of different geometries.
Pack type Long pack Cuboid Pack Cuboid Pack Cubic Pack
Module layout 1x54 2x27 3x18 3x3x6Pack height [m] 0.23 0.23 0.23 0.69Pack length [m] 5.18 2.59 1.73 0.58Pack width [m] 0.16 0.32 0.48 0.48Pack surface [m2] 4 3 2.7 2Module surface [m2] 8 8 8 8
The pack casing surface can be related to the geometries. For the module size of 12 cells,the dimensions are assumed to be 230 mm height, 160 mm width, 100 mm thick. For 54 modulesthe different geometries results in a pack surface of between 4 m2 for the long pack and 2 m2
for the cubic pack, see table 3.5. The pack surface is in the worst case 50% of the modulesurface and in the best case 25% of the module surface. The pack volume is 0.191 m3, and theminimum surface is for the cubic pack geometry 2.01 m2, quite close to the theoretical surface ofa perfect cube 1.99 m2. This means that even with a prismatic module unit, a quite optimizedpack geometry could be achieved from a material point of view.
35

CHAPTER 3. COMPONENTS AND DESIGN ALTERNATIVES FOR ENERGYSTORAGE SYSTEMS
Safety aspects of modularity
As seen previously the environmental load, and the material costs are high for small modules.None the less, the commercially available Nissan LEAF [U.S. Department of Energy, EnergyEfficiency & Renewable Energy, Vehicle Technologies Program 2013] with a 24 kWh pack of 192total cells, has only 4 cells per module with resulting 0.5 kWh/module. The reason may not be thatsmall modules increase the ability to build a pack with a precise energy capacity, since thereis no evident advantage in comparison to a slightly larger module of for example 8 cells permodule and for example 1 kWh/module. The question is than what other criteria has the priority,and what the driving force to make a small module of 4 cells is.
Since material is both costly and heavy, the reason for this high rate modularity must besafety. To start with, safety is increased through subdivision in modules since any accidentaldysfunction or accident leading to leakage, swelling, fire and gaseous emissions is containedwithin one module and does therefore not spread easily within the whole ESS. The subdivisionin modules also helps to regulate the functioning of the system. Smaller cells have less problemswith swelling and gas production from the chemical reactions4. Another benefit from smallcells is that the cooling plates can be integrated at a higher rate in the module, and make thethermal management more efficient. Presumably these gains in safety can outweigh the lossesin material mass and energy density for small battery packs.
Organizational implications of modularity
The organizational driving force for modularization is cost reduction, and the organizationalrequirement is design collaboration so that several applications can be served with the samemodule unit. This means in practice that other equipment in the drive line may need to bedimensioned to keep the battery module fixed. A critical question is whether the module anddrive line should be designed separately or not. This is the cheapest solution and requiresstandardized interfaces from both vehicle manufacturer and battery manufacturer. It meansthat a black box approach is used during design by both the battery manufacturer and vehiclemanufacturer. The second step of getting a more optimized battery drive line system, is toadapt either the drive line to the battery or the battery to the drive line. The adaptation ofthe battery pack to the existing drive line, is the present way of doing it. On the other hand ifa battery manufacturer can provide low price modules in a few standardized sizes, perhaps thedrive line will need to be designed according to the battery. This design choice has implicationsfor the overall efficiency of electric transport and thus for its competitiveness and environmentalimpact. An additional benefit from an administrative point of view is that cell testing becomesmore practical using the modules as smallest units. During module assembly, each cell should bevalidated; the grouping in modules makes cell testing easier to follow and less time consuming.The administration of the manufacturing is simplified since one module fits in many products,meaning that there are less diversity in the items to account and organize.
3.4 Reuse and second use of energy storage system
components
At the end of its ‘first’ lifetime in a vehicle, the ESS can meet different destinies, such as landfill,combustion, reuse, or reengineering/remanufacturing for a ‘second life’ [Ashby 2012]. Ideally,the channel used for each of these treatments should be of similar rate as the end of life flow,and be cost efficient. To use several of these channels in parallel in the end of life of the product,
4Personal communication with Jens Groot, 2013.
36

CHAPTER 3. COMPONENTS AND DESIGN ALTERNATIVES FOR ENERGYSTORAGE SYSTEMS
may be difficult to accomplish, in order to efficiently match the rate of rejection [Ashby 2012].The end of a first life can occur for various reasons:
• Physical life - the product breaks down and it is no longer economical to repair or refurbish.
• Functional life - the customer does not any longer need the product.
• Technical life - the competition from other more advanced technology makes the productless attractive on the market.
• Economic life - other products are both more technologically advanced providing the samefunction at a lower price.
• Legal life - legislation, new standards or directives make the product illegal, and not viable.
In general, the physical life determines the when a battery is rejected; in the future, the economiclife and possibly the functional life might be relevant. The physical life is determined by thedegrading and ageing of the cyclable cells. There is still no method to reengineer a cell that hasbeen passivated on a material level; the end of the chemical reactions is definitive. The cyclelife length of the cells depends on the charging conditions; fast charging degrades the batteryat a higher rate per cycle, and the SOC state of charge should be kept within a small window,max 40% of total SOC window, to make the battery degrade as little as possible for every cycle.The EOL for a vehicle battery is met when the battery cannot supply the requested amount ofpower, which generally is the moment in which the capacity of the battery is 75% of the originalcapacity neubauer2012techno. Depending on the driving cycle and use pattern of the vehicle,in relation to the initial power and capacity of the battery, the ESS lifetime will vary.
The economic life becomes significant for the case of second life of car batteries since theyusually lasts 10-12 years in the vehicle. The possibility of reuse within the same product or asecond use in another application, even if technically feasible, may then be dependent on futureadvances in technology and design leading to cost reduction for the alternative of simply buyinga new battery. This becomes a difficult business case if the battery prices decrease as predicted[Neubauer & Pesaran 2011]. The bus battery examined in this thesis, with an expected lifetimeof 3 years 5 , depending on driving cycles, will reach end of life at a rate in which the technologyadvancement is less ahead. New batteries would therefore be relatively less competitive andsecond life therefore more interesting. However the first barrier for reuse and second use isthe capacity degrading of the battery pack. The 75% of remaining capacity means that 33%more used battery is required to achieve the same function as a new battery in a second lifeapplication.
3.4.1 Reuse
The reuse criteria are based on the fact that the functionality of the whole system may differat different points, which motivates a construction based on many subsystems that can beinterchanged and refurbished separately. This can optimize the function of the battery packduring use and avoid the waste of fully functional units. Such a goal is only achievable if thesystem design allows precision in the detection and disconnection of components. The increaseddivision in subsystems can be obtained through an increased number of cell modules, howeverthis has the downside of an increase in material needed for cell module containers related to theincreased total module system area. As mentioned before the number of interconnects betweenmodules are increased, and fixing points to fasten modules to the pack, having the consequence ofmore parts to assembly/disassembly, and slightly higher weight. The battery pack components,such as cables, housings, BMS, electronics and the battery cells, can be assumed to be reused
5Estimate from personal communication with Jens Groot, 2013.
37

CHAPTER 3. COMPONENTS AND DESIGN ALTERNATIVES FOR ENERGYSTORAGE SYSTEMS
to different extents, assuming that the degradation of cells varies within the battery packsand that this degradation can be diagnosed. The weakest cell unit will set the limit for thewhole pack performance; this means that even though the total battery capacity at EOL maybe below the cutoff criteria, module units or even cells could be reutilized depending on theirindividual health. Testing and remanufacturing costs are important to determine whether thisscenario is feasible. However the environmental impact from different scenarios is interesting tomotivate reuse at different system levels. The single cells can have variations in degradation;depending on internal manufacturing errors/variations, or to the circumstances during use, suchas variation in temperature within the pack, or use that goes over the recommended limits forcharging procedures and parking duration and temperature conditions [Groot 2012]. The most‘efficient’ use of the battery would require frequent service and exchange of single cells, and thusa complicated sensor system including every cell in the diagnosis. Such system is however likelyto be quite impractical and costly.
In conclusion, reuse in itself has contradictions between the driving force of increased divisionin subsystems, and the driving force to facilitate the assembly/disassembly of parts. A trade-offbetween optimized precision in interchange and in simplicity of assembly is needed. The optimaltrade-off is determined by identifying the most frequent issue of failure and the most valuableitems of longest life length in the battery pack. The assembly should permit to easily extractand interchange those items. The optimum scenario from a cost perspective may look differentfrom the best scenario of the environmental perspective.
Battery exchange to improve performance
Exchanging a vehicle battery for a new one makes the electric driving performance more equalduring the vehicle life. In some cases the vehicle construction and the integration of the ESSlimits the possibility of such an exchange. In cars, where space is limited, the ESS is oftenplaced to maximize the inner space in the vehicle cabin. This means preferably under seatsand in mass equilibrium with other drive line systems. The design priority is not given tobattery interchange, for the primary reason that the range of the EV battery is designed tohave adequate performance all the vehicle life, and so there is no explicit need for exchange.In the case of most electric cars, the battery is released only when the vehicle is sent to endof life management. If the construction and design of the ESS-Vehicle interface is not adaptedfor easy extraction of the battery, it may be difficult to upgrade a battery during the vehiclelife. However if the waste management facility can extract the ESS and redeliver it to the carmanufacturer, reuse could be applied at end of life. For the PHEV bus, battery reuse is a morenatural choice, since the ESS needs to be exchanged a couple of times during the vehicle lifetime,and at every interchange, supplementary actions such as repurposing testing and diagnosis maybe taken.
Theoretically the battery could be interchanged at every full discharge by an automatedsystem instead of in-vehicle charging [MacCarley 2000]. This concept allows short stop times,and reduce the wear of the battery due to fast charging, giving the allowance for slow chargingoutside the vehicle. From a repurpose and reuse point of view, this could be an ideal way torefurbish the ESS, since an instant detection and action can be taken to substitute failingor degraded components. A frequent upgrading of the ESS can keep the vehicle electricperformance at the highest possible level. Until present the method has shown few actualapplications since some huge challenges in installing the infrastructure and machinery for sucha service have to be overcome. As some ideas show, [MacCarley 2000] the automatized batteryexchange machinery could be placed underground, which means large investments. Even thoughthe solution is clever, the volume of the xEV is yet too small to create incentive for such aninvestment.
38

CHAPTER 3. COMPONENTS AND DESIGN ALTERNATIVES FOR ENERGYSTORAGE SYSTEMS
Figure 3.8: Interfaces of systems from cell to vehicle. The boundaries of the systems A to D give an
idea about the need for protecting casings and housings materials, and from a maintenance point of view
the several layers that must be removed in order to reach the cells and modules.
Mechanics needed for remanufacturing and reuse
The actual mechanics of replacing a battery are critical to the possibility of reuse. There aretwo principal questions for reuse and refurbishment: whether the service of refurbishment canbe made fast- on the fly failed unit replacement [MacCarley 2000], and if it can be made at lowcosts.
To investigate these questions, it is necessary to know:
• At what system level the cell can be reached- at module, pack or vehicle level.
• At what system level the module can be reached- at pack or vehicle level.
The less interfaces (figure 3.8) between cell and vehicle and the easier it is to remove theseinterfaces, the total time and cost can be reduced for the replacement.
The difficulty of accessing single module units depends on the plane on which the electrodesand interconnections are positioned and how many module layers in this plane there are. Asingle layer of modules makes the inserting, disconnection, or testing of a certain unit easier,facilitating selective module reuse, refurbishment, second use and disassembly. The definitionof an accessible module is one that has direct contact with the outermost system boundary, seethe system boundary definitions in figure 3.8; opening one side of the pack casing, the modulewould be accessible without need to remove other system units. The highest level of access isgiven when the entire module unit has an interface with the same plane of the pack.
The weight and size of the battery pack determines if machinery for lifting and displacing isneeded. A relatively light pack could be handled by a person while a large pack could requireinvestment of extra equipment. To reduce the time and costs of refurbishment the initial numberof actions needed to dismantle the case should be reduced. This means less connects, screws,etc. At the same time the refurbishment should not be simplified for unauthorized people. Thiscan be solved by using seals with need for special instruments.
The optimum for second use, reuse, and switching of modules is a pack that does not need tobe removed from the vehicle to access the modules. The requirement for switching modules ofan integrated pack is that the access plane is freed from external covering equipment enabling toopen the pack easily. The definition of an accessible module is one that has direct contact withthe outermost system boundary, see the system boundary definitions in figure 3.8; opening oneside of the pack casing, the module would be accessible without need to remove other systemunits. The highest level of access is given when the entire module unit has an interface withthe same plane of the pack.
In addition to the mentioned criteria the definition of accessible connection in a free pack(important for second use, refurbishment, reuse, module unit switching) is the orientation of the
39

CHAPTER 3. COMPONENTS AND DESIGN ALTERNATIVES FOR ENERGYSTORAGE SYSTEMS
module terminal sides towards the outermost system boundary. Thanks to this configuration,the connections are easy to reach and the single modules can be disconnected individuallywithout an explicit need to disassembly the whole pack. For a fast upgrading of a few moduleunits, this is an important criteria.
3.4.2 Battery systems in grid applications
Regarding the electricity consumption in the society, solutions are being investigated of how tosave electricity and gain more independence from fossil fuels. Many measures are possible for thefuture. Two important concepts are the management of the power production units comprisingintegration of renewable energy sources (RES), and the demand side management which is theresponsibility of the electricity end user to control and consume electricity at preferred hoursin accordance with high RES supply and low electricity prices [Steen, Le & Bertling 2012].
Until precise predictions exist for how the electricity demand and supply curves look at aconsumer level, and the price predictions are available to end-users and power market actors,we may need an energy storage solution to succeed with the flexible demand and supply,and the demand side management. The ideal system in which the power supply of RES isdirectly balanced by for example hydro power, and the demand side could react instantly to theoscillations in the power supply, but the market, infrastructure and technology are not there yet.Until the moment in which market strategies are changed – towards possibly more predictablesupply and demand curves we may need the storage capacity at the decentralized level. Therole of the battery is possibly transient but still important[Eyer & Corey 2010], [GreenpeaceInternational and European Renewable Energy Council 2009].
It can be discussed how the price oscillation will flatten at high implementation of energystorage and demand control and what technology and energy use this would give incentiveto. However the physical transmission grid and the renewable energy sources will always beremaining constraints for the market development, in whatever direction the monitoring andregulations around it are created [Viljanen, Makkonen, Annala & Kuleshov 2011].
The reinforcement of the European electricity grid is on the planning stage with some largeprojects aiming to free the electricity trade over national borders [Buchan 2011]. The needfor eliminating bottlenecks, smoothing load curves and proposing security of supply is the firststep to achieve the free trade. The introduction of high amounts of RES supply as a mean todecrease fossil fuel dependence increases the intermittency and need for peak shaving and electricenergy storage [Greenpeace International and European Renewable Energy Council 2009]. Itis possible that there is an increase of the stationary applications in the future to balance theRES, it may be the result of new market strategies but it may also be induced be legislation[Viljanen et al. 2011].
Second life
The possibility to give the automotive batteries a longer life by letting them serve in stationaryapplications after the automotive end of life (EOL) is called second use or second life. Thismay be a way to decrease PHEV costs and to decrease the environmental load from the battery.As mentioned earlier, given that the battery has to satisfy high requests on energy capacity,power output and efficiency to function properly for vehicle applications, the end of life entersat 75-70% remaining capacity. With this capacity and lower energy density, the battery ismore than adequate for the performance needs of many stationary applications such as on oroff-grid decentralized storage. A few different examples of applications that are of interestfor the second use of automotive batteries are uninterruptible power supply (UPS), electricpower quality and reliability services, transmission support, wind power generation support etc[Neubauer, Pesaran, Williams, Ferry & Eyer 2012].
40

CHAPTER 3. COMPONENTS AND DESIGN ALTERNATIVES FOR ENERGYSTORAGE SYSTEMS
The current state of the art is that used batteries are being tested in some applications. Oneexample is Chevrolet Volt batteries in off grid applications for electricity supply to apartments[ABB 2012], but this is not done at a large scale and commercialized techniques are still in thefuture. The barriers for a wider use are related to the difficulty of predicting the actual end oflife of the battery depending on the previous use patterns. Models and diagnosis systems haveto be developed in order to secure, and possibly certify, the functioning of the used battery tobe sufficient for the second use application. There is lots of R&D needed to enable second lifein practice.
Market based introduction of second life batteries
The second use consideration, is that repurposed vehicle batteries replace the supply of newbatteries requested by the stationary service. The amount of old batteries needed to replace onenew can be determined according to different methods; allocation by energy storage capacity,power, allocation by willingness to pay, allocation by customer perception, or a combination ofthese aspects through weighting factors [Neubauer & Pesaran 2011]. The choice can be madeto consider the second life market as a share of the existing stationary markets. The alternativewould be to consider the second use market as a new market created on the incentive fromthe upcoming fleet of used batteries. Taking into account the immatureness of the second usetechnique, a limited share of the existing market should be willing to use second life batteries.
At the current state of testing and validation of the concept, it is reasonable to assume alow number of applications in the next years, and if positively received an increased acceptanceand growing market share can be expected. The lower limit of the available fleet of second lifebatteries is determined by the development and sales of the PHEV and EV sector. The upperlimit of batteries applied in second use is determined by the market demand for electrical energystorage to stationary applications. The existing amount of electrical energy storage in currentstationary applications can be retrieved, given the geographical area of interest and the type ofapplication [Neubauer & Pesaran 2011]. The infrastructure changes in the electricity grid areslow, due to the related high investment costs [Buchan 2011], and so the power supply capacitydemand can for simplicity be assumed to be constant.
As follows the determinant for the second use application possibility in the coming yearsis the prediction of the EV market development. In conclusion, the relation between the usedbattery fleet and the size of electrical energy stationary storage is important for the scale ofsecond use[Neubauer et al. 2012].
Modularity and pack size impact for second life
The modularization of the battery will have an impact mostly on the remanufacturing possibilityseen from the point of view of the second life application actor. The size of the energy storagefor second life is often much larger than the vehicle batteries, especially when it comes to on gridapplications for example Siemens provides modular ESS systems from 16 kWh up to 500 kWh[Siemens AG 2013]. This means that the priority would be to send whole battery packs tosecond use. Apartments instead could make use of smaller batteries, with an average dailyconsumption of 50 kWh, and an average yearly consumption of about 18600 kWh/household inSweden [Zimmermann 2009] which promotes second life of single modules.
Either the second life could enter for modules, packs or both, the diagnosis and life cycleregistration are important parameters, as is the remanufacturing moment of exchanging thecritically degraded cells and adapting the ESS unit to suit the new function. A clever mod-ularization will facilitate the remanufacturing and service of the batteries for any other actortaking on this task. The role of battery life management is significant for the handover of thebattery between one user phase and another. The state of health (SOH) of the battery at endof the vehicle use phase depends on the battery monitoring and control [Conte 2006], and onthe strategy of battery service.
41

CHAPTER 3. COMPONENTS AND DESIGN ALTERNATIVES FOR ENERGYSTORAGE SYSTEMS
In the case of frequent service the battery will have overall the same SOH in all modulesduring all the vehicle lifetime. In case of less frequent service or none, the moment of batteryEOL and vehicle EOL may occur at different times. In the case of battery EOL at vehicleEOL the value of the battery will be low, and the need for remanufacturing is major. If thevehicle EOL occurs in the beginning of the battery life the opportunity of second life actors isgreater. The issue is to define who is responsible for the remanufacturing and at what momentthe battery is exchanged, and if maintenance will be given to the battery.
3.5 Recycling
If the application of rechargeable batteries for vehicles will continue to expand, recycling willbe a factor of great importance for the sustainability of the technology. The advantages ofrecycling can be both to reduce the need for raw material extraction, and to limit the amountof residual waste. It is of course also desirable that this can be achieved at competitive prices.To reach this goal, the process of recycling must be both more energy efficient and less costlythan the use of virgin materials. The recycling can occur in all levels of the system, from packcasing materials, to modules, cells and electronics.
3.5.1 Pack recycling
Recycling the pack is rather straight forward since many of the materials like steel, aluminiumand plastics are common to many other applications and thus have well developed recyclingmethods. However, before any components can be removed, the pack needs to be dischargedfor safety reasons. The housing, module housing, electronics, connects and cells can then beseparated.
The pack components are sorted depending on material. Steel and aluminium in the casingsare sent to metal recycling. If there are plastics, and these are pure, then recycling is possible alsofor these materials. Recycling aluminium is very efficient, and uses 95% less energy comparedto production from virgin materials [BIR - Bureau of International Recycling 2013]. Also therecycling of steel is performed on a large scale, in average 60% of steel is from recycled material.
Metal connects, often of copper, are economically valuable and are separated and recycledwith common copper scrap recycling methods. The recycled copper can be used in wires, andcould thus possible be included in new battery packs [BIR - Bureau of International Recycling2013]. No specific methods for recycling metals or other materials will be discussed in thisthesis.
3.5.2 Cell recycling
Cells are separated from other scrap and sent to specialized facilities. Today the main reason forrecycling cells, besides possible legislations, is the monetary value of the noble metals (cobalt,nickel, copper, etc.) contained in some Li-ion chemistries. Due to this, the recycling initiative forchemistries with less expensive constituent is limited. Among such chemistries with low recyclinginitiative are options such as LFP. Since the need for recycling is evident, it is important to alsoassess how the recycling of these batteries can become viable.
Currently, no process is being applied that extracts lithium compounds from the wastelithium-ion battery material, mainly due to the low economic value of lithium. As mentioned insection 3.1.5, the sustainability of an expanding electric vehicle market is questionable withoutlithium recycling.
42

CHAPTER 3. COMPONENTS AND DESIGN ALTERNATIVES FOR ENERGYSTORAGE SYSTEMS
Another limitation and difficulty with recycling cells is the very wide variety of chemistriesthat are on the market. This leads to uncertainty of value and the need to use methods thatcan be applied to any type of battery. Recycling is simplified by using a smaller diversityof materials. Hopefully the industry will develop a more standardized approach as the batterytechnology evolves. This may open for processes that are very specialized on specific chemistries,but still receive large quantities, making them more efficient and economically viable.
Due to the low degree of recycling today this thesis will not aim at only looking at currentmodels for recycling Li-ion batteries, but also try to model future methods capable of extractinga larger part of the constituent materials. This is based on the EU target for 2016, of extractinga minimum of 50% by weight [European Parliament 2008], but also due to the interest of lookingat way to extract lithium and other materials not targeted today. Assessing future recyclingpossibilities and gains is an important step in motivating the sustainability of a battery poweredautomotive sector. It can also help to show at what price recycling of currently uneconomicalmaterials becomes viable.
Three groups of recycling methods will be presented; pyrometallurgical, hydrometallurgicaland physical recycling. These represent different approaches to extract materials, as well asdifferent opportunities to extract other materials that may be important, for example lithium.
Pyrometallurgical methods
Pyrometallurgy is a commercialized approach to extract valuable materials from the discardedbatteries. This is a high energy approach that can accept almost any kind of battery andthat extracts valuable metals like copper, cobalt, nickel and possibly some iron. In the generalprocess, all organics in the cell are incinerated for process energy, and valuable metals areextracted through different purification steps. Waste materials that are not possible to extractare released as slag and used as for example additives in concrete.
Some corporations are already applying this type of process to battery material streams, bothsmaller consumer product batteries, and larger vehicle batteries. Umicore’s Val’Eas Process hasbeen chosen as a good model for a representative and currently available process. The companyclaims to recycle 69% of the metal, however, this is not equal to the percentage that is recycledinto reusable material. An example of why these numbers differ is due to the fact that thelithium and aluminium slag is counted as recycled, although it is down cycled or lost [Dunn,Gaines, Barnes, Wang & Sullivan 2012].
The Umicore process has been investigated for previous LCAs by Dunn, Gaines, Barnes,Wang & Sullivan [2012]. Here the process is described in several steps. First two preparationsteps are performed; pre-heating and plastics pyrolizing. The first step is to evaporate theelectrolyte to ensure that there is no explosion risk. The second is to start burning the plastic,helping the system reach higher temperatures.
After these preparation steps, the material is put through a smelting step where the organicmaterial is continuously incinerated for heat, and additional materials divided into a slag fractioncontaining Li, Mn and Al, and into a valuable alloy containing for example Co, Ni and Cu.This alloy is then separated into its constituent metals with leaching, oxidizing and solventextraction steps. The method also contains a last firing step to produce the wanted LiCoO2
from the recycled Co.Using this process allows for the extraction of the valuable metals like Co, Ni and Cu present
in some Li-ion batteries. For batteries with less of these materials, the process is not viable froma cost perspective, since most of the content then is incinerated or ends up in slag. However,the process is viable for NMC batteries, and is performed today.
Hydrometallurgical methods
The goal of future recycling process will have to be to recycle lithium as well as other scarcematerials used in the batteries. In order to obtain lithium from the battery, the use of a solely
43

CHAPTER 3. COMPONENTS AND DESIGN ALTERNATIVES FOR ENERGYSTORAGE SYSTEMS
pyrometallurgical approach is not enough; instead a combination of pyro- and hydrometallurgycould be used [Georgi-Maschler, Friedrich, Weyhe, Heegn & Rutz 2012].
The general idea of a hydrometallurgical approach is to use several leaching and solventextraction steps, increasing the need for chemicals, but reducing the need for heating. Thisleaves the materials in more or less pure states when they have been extracted. Large parts ofthe constituent materials can in this way be salvaged.
One possible recycling route would be to first leach the electrodes, thus dissolving the activematerial in an aqueous solution. In this way, the foils and separator can be removed, and themetals in the foils can be recycled. To obtain the active material constituent, solvent extractioncould be used. An organic solvent would then be added to the aqueous solution from the leachingstep, and some metals would be extracted into this phase, giving opportunity for recovery. Inthis way lithium, iron and other metals can be recovered [Kosaraju 2012].
Physical recycling
Physical recycling includes methods where the parts are crushed and then mechanically sep-arated by different means. Firstly plastics could be removed on a shaker table. After thatdifferent filters and processes can be added to the materials to separate them in different ways,depending on properties. This method places very high demands on the inputs, since thematerials cannot be successfully separated if their properties are not known. Even when theinputs are known, some materials might be difficult to separate. However, if the materials aresuccessfully separated the method provides greater opportunity for recycling the componentsback to battery grade materials because they are not intrinsically transformed.
44

Data collection, modeling and inven-tory analysis
The life cycle in this thesis is modeled in different parts. The cells, the modules and packs, theuse phase and the end of life scenarios are all modeled independently. The models and dataused for the different parts are presented in this chapter. They can be view as stand-alone,but they are also correlated with the functional unit. That is, they are designed to provide thefunction of powering a PHEV bus. The division of the total model life cycle model into steps,and the sections in which each step is described can be seen in table 4.1.
Table 4.1: The stand-alone parts of the data collection. All sections are independent, but coupled by
the design to function in a battery system capable of powering a PHEV bus.
Production Use End of Life
Cell, sec 4.2 Module/Pack, sec 4.3 sec 4.4 Second use, sec 4.5 Recycling, sec 4.6
4.1 Cell materials models and data
A life cycle cradle to gate assessment was performed on different lithium-ion cells. A varietyof different chemistries were chosen with the aim of modeling both present high-performingsystems as well as possibilities realizable in the future. In compliance with the functional unit,all the cells where designed to function in a PHEV bus, and all of the chemistries where scaledto suit high-power applications. The chemistries were
• Lithium iron phosphate (LFP) cathode - Graphite anode.
• Lithium nickel manganese cobalt oxide (NMC) cathode - Graphite anode.
• Lithium iron silicate (LFS) cathode - Graphite anode.
• Lithium manganese phosphate (LMP) cathode - Lithium titanate (LTO) anode.
The assessed chemistries represent different properties and stages of development, see figure4.1. Only Li-ion battery materials were chosen for the LCA. The motivation for this is thecurrent relevance of this group of batteries, giving the opportunity for reliable inputs to LCAdue to the large amount of confirmed data available for many component materials. The basicdata for cell composition and weight percent was taken from BatPaC. The composition varieswith chemistry, and the modeled weight percentages of different subcomponents of the cell andelectrodes can be seen in full in table A.1 in Appendix A.
45

CHAPTER 4. DATA COLLECTION, MODELING AND INVENTORY ANALYSIS
Figure 4.1: Schematics of the chosen chemistries and their key properties. Also the choice of
corresponding anode active material for each cathode active material is given. Dark gray areas mark
future alternatives for lithium-ion cathode materials. The characteristics are high and lower voltages, as
well as the amount of lithium ions available. The metals involved also vary.
Outside the LCA Na-ion, Li-S and organic cathodes, as well as Si-based anodes wereevaluated based on the Li-ion LCA results. Their opportunity to improve certain life cyclesteps or impact categories was analyzed.
Since not all materials being evaluated are actually produced today, the scale and productioninputs of the material extraction and cell fabrication were modeled as systems that are viablefor production today, or systems that would be viable for production if the technology had beendeveloped thus far. This means that possible future systems were scaled up in a way as torepresent a realistic future scenario of full scale production. Capacities were chosen close to thetheoretical values, and issues that are not inherent to the material were assumed to have beensolved. Inherent limitations such as low conductivity were assumed to be solved in similar waysas for materials used today, for example by nano-scaling.
4.1.1 BatPaC chemistry and cell parameters
BatPaC was used to model the four combinations of cathode and anode materials chosen.LFP, NMC, LTO and graphite models were pre-existing in BatPaC, and used with only slightmodification. LMP and LFS were modeled as modifications of LFP. LMP was modeled as havingthe same capacity as LFP, and LFS was modeled as having 300 mAh/g, close to its theoreticalcapacity
To assess the property changes associated with changing the active material a few parameterswere targeted as most important for modeling different materials. These were changed inBatPaC’s chemistry sheet, with effect on the performance and size of the pack. The threeparameters in question, defining the key properties of the materials were; density of activematerial, capacity of active material and the anode–cathode voltage. The amounts, densitiesand basic structure for all cell components apart from the electrodes were taken directly fromBatPaC. This includes the electrolyte, cell casing, current collectors and separator.
Apart from the three parameters, some alterations were made to make the battery moresuited for high power use. This was done by changing the coating thickness of active material.The value was changed from the original 100µm to 35µm; resulting in higher specific powerbecause of the shorter diffusion lengths, but lower specific energy, since more passive materialsuch as current collectors and electrolyte is obtained per amount of active material. This makesboth LFP and NMC more power optimized, but due to the fact that NMC is a high-energychemistry, rather than high-power, a system using NMC still needs to be treated differently
46

CHAPTER 4. DATA COLLECTION, MODELING AND INVENTORY ANALYSIS
than one using LFP. This impact the capacity of the cells, and the energy storage capacity ofthe total system. Both thicknesses are, however, reasonable, depending on if an energy or poweroptimized system is desired. Therefore a sensitivity analysis on this component is performed.
The amount of cell material needed to construct one cell was based on a battery packcalculation in BatPaC. The aim was 20 Ah cells for LFP, LMP and LFS and 26 Ah cells forNMC, suitable scaling of each cell when optimized for the high power needs of heavy vehicles.These parameters were fulfilled with a cell size, 160 mm x 160x230 mm, comparable to currentcommercial cells like C020 from EiG[EiG - Energy innovation group 2013] and AMP20 fromA123 [A123 Systems 2013]. To comply with these requirements the thickness of the cell wasslightly changed between chemistries, ranging from 8-9 mm. The resulting weight, power densityand energy density for the cells are shown in table 4.2:
Table 4.2: The table shows the resulting weights, energy densities and power densities from the BatPaC
models on different cell chemistries.
LFP NMC LMP LFS
Weight [g] 670 650 600 660Power density [W/kgcell] 2145 1587 4373 2318Energy density [WH/kgcell] 97 143 90 93
The resulting material weights for one cell based on this model were used for modeling cellsin GaBi.
Supporting component models:
The supporting components, kept constant between chemistries, were discussed in section 3.1.1,and illustrated in figure 3.1.
Electrolyte: The modeled electrolyte for all Li-ion battery chemistries was lithium hexaflu-orophosphate (LiPF6) in a blend of ethylene carbonate (EC) and dimethyl carbonate (DMC).The choice of the specific salt and composition of solvent was done based on the BatPaC modelof the electrolyte and the fact that this electrolyte is used in many production-phase batteries.From BatPaC the electrolyte is assumed to have a salt concentration of 1 M and a density of1.2 g/cm3.
Separator: The choice of separator was motivated in much the same way as the choice ofelectrolyte. The match for this choice of electrolyte is a micro-porous membrane of polyethylenebetween polypropylene. The choice of this laminate is based on the data available in BatPaCand is modeled as 20% PE and 80% PP. The thickness of the separator was set to 20µm andthe density is 0.46 g/cm−3 based on the assumptions in BatPaC.
Cell casing: The cell casing was modeled as a pouch type, with a PP coated aluminiummaterial. The thickness of the aluminium layer was set to 100µm as in BatPaC, and thethickness of the plastic coating was set to 50µm, where 20µm is PP and 30µm is PET(Polyethylene terephthalate).
Current collector foils: For graphite as anode the negative current collector foils were copperand the positive aluminium. For the LTO anode the copper was replaced by the cheaperaluminium as the higher voltage of this material allows for this change. The thickness of thealuminium and copper collectors tabs protruding from the cells were set to 1 mm. The currentcollector foils used to support the active material were set to have the thicknesses 12µm for thecopper ones and 20µm for aluminium, all according to BatPaC.
Binder and solvent: For the production of the electrodes a binder is needed to adhere theactive material paste to the current collector and possibly to some added conductive material.For this purpose it was assumed that a Polyvinylidene fluoride (PVdF) binder is used, and that
47

CHAPTER 4. DATA COLLECTION, MODELING AND INVENTORY ANALYSIS
this needs to be dissolved in a N-methyl-2-pyrrolidone (NMP) solvent. These assumptions arein line with those made in BatPaC.
Conductive additive: For all of the active materials, apart from graphite, a carbon blackadditive was modeled as conductive additive when manufacturing the electrodes.
4.2 Modeling of cell production
The production of the cell and its component was modeled to obtain LCA data for these steps,the different components and processes included can be seen in figure 4.2. For all processesit was assumed that stoichiometric ratios of the different precursors were used, and that theprocesses have a 100% yield. The assumption is in line with the 95-98% assumed in previousLCAs [Majeau-Bettez et al. 2011], and the effects of decreasing the yield was determined bya sensitivity analysis. The complete account of materials needed, and corresponding energyconsumption for the different processes and different materials can be found in Appendix A.Also different modeling choices for less common materials are presented there, see table A.2.It is assumed that all heat is wasted and that all chemicals are collected after the process,with exception of emissions stated, since these in industrial processes are highly limited andcontrolled.
Two production paths were modeled, representing one dry and one wet processes. Thesetwo paths were assumed to have similar steps independent of what active material is beingproduced. Only variations due to the need of nano-sizing and coating are added. For the activematerials needing nano-size particles a maximum of 200 nm is assumed as a reasonable limit forthe particles. Zhang [2011] concluded that particles with sizes in the range of 150-300 nm havebest capacity, when using conductive carbon additives.
When no production site information was available, or when the results were to be keptgeneral, one electricity and one heat source were used. Electricity was modeled as the EU-27:Electricity grid mix from the PE International database. This mix has its main contributionsfrom uranium, natural gas, hard coal and lignite resources. As a generic process heat sourceRER: heat, natural gas, at industrial furnace >100 kW was used, taken from the Ecoinventdatabase where RER indicates European values. These choices are important to have in mindwhen considering the results.
Transportation of materials and components are not included in this thesis. This is partlydue to the broad and general nature of the thesis, giving little or no specific production sites.Another factor contributing to the this choice is the aim to highlight the effects of differentprocesses due to the inherent properties of the method, and no other impacts. The need forspecific infrastructure to process the materials for the batteries has also been excluded. In realitytransport does have an impact in the order of 1% of the total gross energy demand[Rydh &Sanden 2005] or 3% of the manufacturing CO2 emissions [Zackrisson, Avellan & Orlenius 2010].However, the fact that this impact is highly dependent on very site specific data remains, makingthe assumption of no impact reasonable for the purpose of this thesis.
4.2.1 Cathode active material synthesis
There are a wide variety of different synthesis paths for cathode active materials. Dependingon the material they put different requirements on the need for energy and additives. Twodifferent production paths were modeled in this thesis, representing proxies for one wet and onedry synthesis.
48
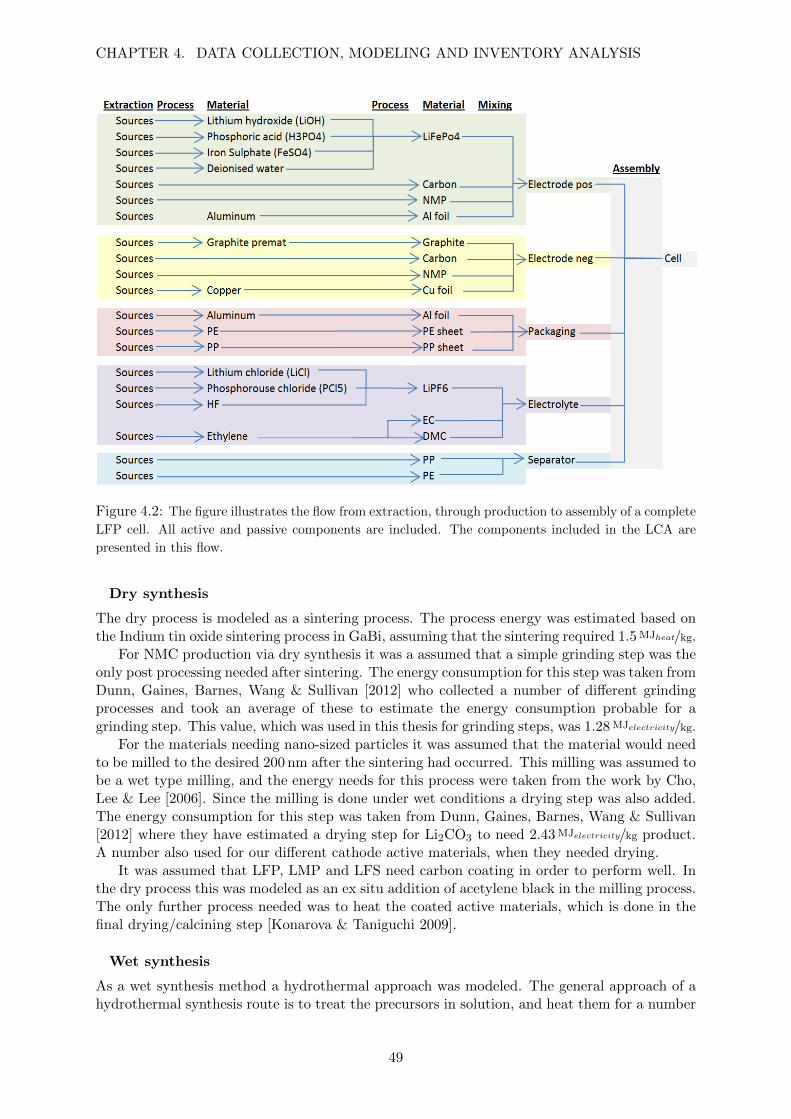
CHAPTER 4. DATA COLLECTION, MODELING AND INVENTORY ANALYSIS
Figure 4.2: The figure illustrates the flow from extraction, through production to assembly of a complete
LFP cell. All active and passive components are included. The components included in the LCA are
presented in this flow.
Dry synthesis
The dry process is modeled as a sintering process. The process energy was estimated based onthe Indium tin oxide sintering process in GaBi, assuming that the sintering required 1.5 MJheat/kg.
For NMC production via dry synthesis it was a assumed that a simple grinding step was theonly post processing needed after sintering. The energy consumption for this step was taken fromDunn, Gaines, Barnes, Wang & Sullivan [2012] who collected a number of different grindingprocesses and took an average of these to estimate the energy consumption probable for agrinding step. This value, which was used in this thesis for grinding steps, was 1.28 MJelectricity/kg.
For the materials needing nano-sized particles it was assumed that the material would needto be milled to the desired 200 nm after the sintering had occurred. This milling was assumed tobe a wet type milling, and the energy needs for this process were taken from the work by Cho,Lee & Lee [2006]. Since the milling is done under wet conditions a drying step was also added.The energy consumption for this step was taken from Dunn, Gaines, Barnes, Wang & Sullivan[2012] where they have estimated a drying step for Li2CO3 to need 2.43 MJelectricity/kg product.A number also used for our different cathode active materials, when they needed drying.
It was assumed that LFP, LMP and LFS need carbon coating in order to perform well. Inthe dry process this was modeled as an ex situ addition of acetylene black in the milling process.The only further process needed was to heat the coated active materials, which is done in thefinal drying/calcining step [Konarova & Taniguchi 2009].
Wet synthesis
As a wet synthesis method a hydrothermal approach was modeled. The general approach of ahydrothermal synthesis route is to treat the precursors in solution, and heat them for a number
49

CHAPTER 4. DATA COLLECTION, MODELING AND INVENTORY ANALYSIS
of hours. After this step is done the material is calcined and dried. The first of these stepsis modeled by heating the solution, water, in what is assumed to by a no-loss environment.This is acceptable since it has been shown that the heat losses, when taken into account, onlycontribute energy use about two orders of magnitude less than the heating itself [Majeau-Bettezet al. 2011]. The second step in the hydrothermal proxy is a combined calcining an drying step.Dunn, Gaines, Barnes, Wang & Sullivan [2012] collected data of available calcining process tofind an approximation for a calcining step at around 1300 ◦C. This data is used for the calciningand drying step in the wet process proxy, using 0.08 MJelectricity/kg and 2.1 MJheat/kg.
As the hydrothermal route gives the opportunity to directly achieve nano-sizes in the rangeof the wanted 200nm, no additional milling is required for this process. The only differencein the model between the different materials is in the temperature the solvent is heated to.For LFP and LMP this temperature is 200 ◦C, a temperature chosen to be above the 175 ◦Cnecessary for good performance [Chen et al. 2007]. For the LFS and NMC chemistries the chosentemperatures were 150 ◦C [Nyten et al. 2005] and 170 ◦C [Myung, Lee, Komaba, Kumagai &Sun 2005], respectively. The hydroxide precursors for NMC production was assumed to beproduced by a simple mixing step followed by drying. The drying was modeled as described inthe dry synthesis case.
The amount of water used for the reaction influences the energy consumption to a highdegree, since it is that amount that needs to be heated. It was assumed that 100 kg of waterwas needed for every kg of LiOH precursor, based on the wet synthesis process presented forLFP by Majeau-Bettez et al. [2011]. Since this had a great impact on energy consumption, theimpact of changing the amount of water was analyzed with the sensitivity analysis.
For good performance of LFP, LMP and LFS a carbon coating proxy was added to themodel. This was assumed to be achieved in situ by a carbon additive in the precursor mix. Theadditive chosen was glucose as described by Murugan, Muraliganth & Manthiram [2009].
4.2.2 Anode active material synthesis
The battery grade graphite was taken from the Ecoinvent database. This battery grade graphiteis a modification of graphite production, with an additional 40 MJ hard coal coke. This toprovide the extra baking needed to achieve battery grade graphite.
The approximations for the LTO processes were based on the production processes presentedby the company Altair [Verhulst, Sabacky, Spitler & Prochazka 2003b]. The first step includedin the LCA was a hydrolysis step consuming 31 MJheat/kg. This data was based on the datagiven by Altair for the production of TiO2. For LTO the same process can be assumed, withthe addition of a LiCl precursor for the chloride production method [Verhulst et al. 2003b]. Thesecond step is to calcine the material to obtain the desired crystal structure.
The third step included is a milling step due to the need for nano-sizing. This is modeledin the same way as mentioned above for the cathode active materials, that is, with data fromCho et al. [2006]. Since the milling was performed in a wet environment a drying step afteris assumed to be needed. The drying process was assumed to be similar to the drying andcalcining step of the cathode production.
4.2.3 Production of electrolyte, separator, electrodes and casing
The production of the sub components was held constant for each cell type. The electrolytewas modeled as a no energy mixing process from LiPF6 salt and 50% each mix of EC and DMCas solvent [Dunn, Gaines, Barnes, Wang & Sullivan 2012]. The salt production was assumed torequire no energy, simply mixing the precursors LiCl, PCl5 and HF. The solvents were modeledas ethylene glycol for EC and DMC was modeled as produced from phosgene and methanol.
50

CHAPTER 4. DATA COLLECTION, MODELING AND INVENTORY ANALYSIS
The separator was assumed to be produced by a process similar to that applied when producingplastic films, but with a mix of PP and PE as inputs.
The electrode assembly required a coating and drying process which was modeled accordingto the graphite anode production data available in the Ecoinvent database. The binder andsolvent used were NMP in PVdF, and the conductive additive was carbon black. Lastly, the cellcasing was modeled as sheet rolling for the aluminium part and extrusion of the plastic part.
4.2.4 Cell assembly
The assembly of the entire cell was modeled according to Dunn, Gaines, Barnes, Wang &Sullivan [2012], who modeled each component in the assembly chain from the bottom-up,approximating each step in the assembly with known industrial processes and equipment. Thesesteps included assembly in a dry room and cycling as the most important processes, representingaround 60% of the total 1.11 MJelectricity and 1.16 MJheat required to assemble the cell.
However, it should be noted the assembly process has been assigned much higher impact inother studies. Majeau-Bettez et al. [2011] take a top-down approach to credit a set total energyto different steps. They assume that around 20 MJ each of electricity and heat are requiredto assembly the electrodes and the entire cell. For the purpose of this thesis, the bottom-upapproach of Dunn, Gaines, Barnes, Wang & Sullivan [2012] is better suited since most of theother processes are modeled based on the processes and not the total energy. Dunn, Gaines,Sullivan & Wang [2012] conducted a sensitivity analysis confirming that a change in the dryroom energy need from 60% to only 20% still keeps the energy required for assembly well belowthe top-down assumption of Majeau-Bettez et al. [2011]. 10 MJ/kg should be an upper limit tothe assembly step, and this limit will be used in a sensitivity analysis to assess the maximumimpact of the assembly.
4.3 Battery pack design and implications for envi-
ronmental parameters
The battery design is related to environmental effects in many areas. For example the amountof passive material added in the ESS has consequences on the environmental impact both interms of energy consumption during the driving phase and of the embodied energy in the packcomponents. Certain pack designs may be more material efficient than others, keeping in mindthe material strengths, densities and energy needed for material extraction and production. Afew key issues are illustrated in the LCA scenarios; the implications of housing material choices,impact of having the parallel connections on different system levels, the impact from using twosmall packs instead of one large, and the effect of oversizing the housings in order to createflexibility in the cell choice.
Selection of battery pack capacities
Before the pack design can be considered, the pack energy storage capacity needs to be deter-mined, to determine the size. The selection of the optimum battery size is a complex processthat is simplified in this thesis to keep a general approach. To determine the needed batterycapacity an approximation was done from the required driving range and the necessary SOCwindow for the battery use. The PHEV bus electricity consumption of an assumed 8 km drivingroute requires an available battery capacity of about 12 kWh (1.5 kWh/km · 8 km). To keep aSOC window of 40%, implies that the total battery capacity should be 30 kWh. The totalcapacity of the battery will degrade during its service life to about 75% of the original capacity.
51

CHAPTER 4. DATA COLLECTION, MODELING AND INVENTORY ANALYSIS
In order to make the electric driving range no less than 8 km during the total service life 33%extra capacity is added. With this extra margin the final pack capacity becomes 40 kWh. Inthis thesis, we further on consider the LFP chemistry battery to be 40 kWh, and the NMCbattery to be 60 kWh - 50% larger to compensate for the fact that the NMC chemistry is betterfor energy than for power and both packs should last 3 years to be comparable.
Modularization and pack design assumptions
To determine the impact of modularization, the aspects of battery pack weight, volume, voltageand cost were investigated, given specifications for the needed power and range of the battery.The increased modularization on pack level and module level influences the volume, weight andthe cost of the battery and, most importantly, the specific energy (Wh/kg) and the energydensity (Wh/l).
The modularization question has been treated on a generic basis. The 40 kWh LFP packwas modeled with different material choices and thicknesses, and cooling configurations. Alsothe size up in kWh from 40 kWh to 60 kWh in the case of NMC was considered. The purposewas to give a range of different pack configurations and compare the related impacts and addedweight. This since the function of the battery was set to a hypothetical ESS able to provide theamount of energy storage capacity and power needed for the city driving cycle and the rightvoltage (500-730 V nominal). Dimensioning and use criteria on what rates of electric and hybridmode to be used can result in an LFP pack of 20-40 kWh, or an NMC pack of 40-60 kWh1. Inthe following paragraphs, different scenarios of design choices are illustrated.
Battery pack design in BatPaC
The battery pack was modeled by varying the following parameters in BatPaC:
• The numbers of cells included in each module.
• The number of modules per battery pack.
• The number of packs per vehicle.
• The energy storage capacity (kWh).
• The power (kW).
• The number of cells or modules in parallel.
• The number of modules in row.
• The number of module rows.
• The type of cooling system (liquid or air).
In addition to these primary parameters, the following criteria have been used in this thesis todimension the cells and pack models by iteration:
• The final pack dimensions of 0.3 m height, 0.5 m width, 2 m length.
• The voltage of 500-730 V for the PHEV bus.
• The voltage of 220- 480 V for PHEV car (taken into consideration for interoperability ofmodule units).
1Estimate from personal communication with Jens Groot, 2013.
52

CHAPTER 4. DATA COLLECTION, MODELING AND INVENTORY ANALYSIS
Some issues are not treated as inputs in the BatPaC model such as orientation of modules ina pack, the layout of the pack, materials of the housings and casing and the cell dimensions.Some of the fixed parameters in BatPaC were changed as follows:
• The cell height to width dimension ratio.
• The material of the housing- stainless steel, plastic, (PP).
• The material thickness of the housing and casing.
• The material contents in BMS and SOC controllers.
• The material contents in insulation, here assumed to be polyurethane (PU) foam.
Requirements for battery pack design
The modularization and the pack design should take into account certain requirements andconcepts previously described in section 3.3. For the modeling of the modularization theconstraints in table 4.3 and 4.4 have been used. In addition to this an assumption of themaximum module weight of 10 kg is made to make the extraction of module units easier for anassumed reuse.
Table 4.3: The table shows the constraint for the number of cells, cells per module, cells in series and
aligned cells for both LFP and NMC chemistries. Upper and lower limits for these parameters are also
shown. The values are dimensioned after the 20 Ah of LFP and 26 Ah of NMC. A maximum of 3 cells in
parallel is assumed.
Min Max Min MaxLFP LFP NMC NMC Limiting constraints
Number of cells 624 648 624 648 Capacity
Cells per module 10 54 10 47 Control unit input, voltage
Cells in series - 220 - 195 Maximum voltage
Cells aligned 7 243 7 216 Space
Table 4.4: The pack design parameters set by the vehicle interface. Important to note are the different
energy storage capacities related to different chemistries, and maximum and minimum resulting voltages.
Min Max Min MaxLFP LFP NMC NMC Limiting constraints
Capacity kWh 39 41 58 62 Driving range
Power kW 150 170 150 170 Braking power/EM power
Voltage V 500 730 500 730 Maximum voltage
4.3.1 Using BatPaC as reference model for pack design
The objective when modeling the battery pack was to create a realistic, well performing packcorresponding to the given constraints. To achieve this, the BatPaC model was used with onlyminor changes in the data set to suit the assumed reference cells and pack geometry. Thevalidation of the models was done on a theoretical basis. Here follows a description of thescenarios created for the LCA with the help of BatPaC.
53

CHAPTER 4. DATA COLLECTION, MODELING AND INVENTORY ANALYSIS
Figure 4.3: Examples of possible module layouts depending on cell orientation in relation to the pack
geometry, in the case of cuboid pack. Layout A is the most convenient from an assembly point of view
and gives the highest modularization flexibility for the cuboid pack allowing the highest number of cells
per module.
Scope and limitations of modularity selection
The inputs given to the BatPaC model include how many cells and modules are desired in thetotal system and how these are configured to produce the total power and energy. For simplicitythe modules are all considered to have the same number of cells and size although in realitysome different module sizes can be joined in one pack. The diversity in module size is a designapproach which is good for a very specific use but the drawbacks of diversity in module size arethat the manufacturing may become more complicated, that a more complex control system isneeded and the pack risks to be less efficiently packed.
The choice of singular module size is made to keep the general approach of the thesis. Tofurther give a focus to the modularization the approach has been to select module sizes so thatthe modules should be a suitable subunit to both a bus pack of 39-41 kWh and a car packof 10-12 kWh. The total number of cells of the pack has from the beginning been selected tobe dividable with sets of two and three to allow many different symmetric configurations andlayouts. The prime numbers of priority has been set to 2 and 3 for highest possible flexibilityin the modularization.
Method of modularity calculation
Focusing on using the control units as efficiently as possible, the minimum CPM was set to 6 andthe maximum to 19 to keep the module weight under 10 kg. The pack was build up iterativelyto capacities of 38-40 kWh and 10-12 kWh, having set a minimum and maximum of modulerows, layers and columns to fit the pack within the dimensional constraints. Alternating thenumber of cells per module from minimum to maximum, going from a high to low number ofmodules per pack, all possible symmetric pack configurations for this data set up were retrieved.
A sensitivity analysis was made to see the difference in pack housing materials dependingon the six different cell orientations within the module assuming a cuboid cell. The investigatedcell dimensions showed little sensitivity and finally the direction of cells was kept as shown inthe layout A in figure 4.3, based on practical reasons explained in section 3.4.1. The materialsfor housings and connects were calculated for each of the retrieved configurations to show theimpact of modularization, see figure 4.4.
54

CHAPTER 4. DATA COLLECTION, MODELING AND INVENTORY ANALYSIS
Figure 4.4: Modularization method examle with the number of cells per modules shown for interop-
erability between a car and a bus for an example of a 12 kWh and a 40 kWh NMC pack, related to
the number of modules per pack, the total number of cells per pack and the amount of passive pack
materials weight per cell. In the figure can be seen, what modular solutions are possible in terms of
capacity for both the car and the bus and what rate of modularization gives the lowest rate of added
passive pack materials. Typically, the higher number of cells per module means the less weight of passive
pack materials. The optimal pack capacity needs to be approximated to accept a certain module layout,
which means that depending on the certain number of cells per module, the pack capacity will deviate
more or less from this optimum. In the example the number of cells per module allowing the most
optimal capacity for the bus pack is 15. Assuming the same pack layout for the car, this modularity will
on the contrary not be optimal. The conclusion from this example is that another pack layout for the
car is needed to possibly achieve a good modularity for interoperability for both the car and the bus.
Most likely a compromise needs to be done for one or both applications to succeed with interoperability
of module units.
55

CHAPTER 4. DATA COLLECTION, MODELING AND INVENTORY ANALYSIS
4.3.2 Selection of modularization in BatPaC
The pack selected for the LCA has 54 modules of 12 cells per modules, which is a pack of 648cells since this set up works for different types of parallel connections on cell level and modulelevel, respects the number of inputs for the control unit. Additionally the module can be usedto build up the car battery pack, and is of medium size requiring not too much surface materialsas shown in table 3.4. To make the different cell chemistries comparable, the same configurationof cells, modules and connections have been used for both the NMC and the LFP pack (table4.5).
Three cells in parallel were used, and three rows of 18 modules in each to make a cuboid packgeometry, suitable for the positioning in the bus. This modularization is realistic in terms ofvoltage, weight and dimension, and has been used for the material calculations done in BatPaCfor the different scenarios. The pack voltage is then about 700 V, suitable for the PHEV busapplications. The difference between the NMC pack and the LFP pack is the dimensions.Slightly larger for the NMC pack than the LFP pack due to a difference in volume between thecells. The NMC cell is considered 20 volume% larger than the LFP cells. See bill of materialsin table A.4 and A.5 in Appendix A.
Table 4.5: Summary of the configurations and modularization of the packs modeled in the LCA. NMC
and LFP have the same set up with different total pack capacities depending on the difference in cell
capacity.
Parameter NMC LFP
Pack [kWh] 60 40
Modules 54 54
CPM 12 12
Total cells 648 648
Cell strings in parallel 3 3
Rows of modules 3 3
4.3.3 Components and materials
The following components were collected among the ones treated in the BatPaC program forbattery pack design, and from realistic assumptions of components in existing packs. Somecomponents are fundamental for the function of the pack; in this group are the items in figure4.5, such as cells, BMS, thermal management and electronics, etc. Those components cannotbe excluded from the system.
At the same time, some secondary components are present in the ESS that are there tomechanically keep the structure together. Those are module housing and linking elements,such as connects etc. The extra interfaces needed for modularization implies that separatingelements are inserted, which creates the need for more interconnections. The connecting andseparating elements are presented in figure 4.6. The modularity and extra interfaces are notdirectly related to the battery function of delivering electricity, so from a battery functionalpoint of view, these interfaces should be minimized.
The assembly of the pack components has been allocated 2.7 MJ/kg battery pack accordingto [Dunn, Gaines, Sullivan & Wang 2012]. The shaping and production techniques of packcomponents from original materials have been omitted.
56

CHAPTER 4. DATA COLLECTION, MODELING AND INVENTORY ANALYSIS
Figure 4.5: The different components present in the battery pack with their function and grouping.
Figure 4.6: The different components present in the battery pack with their function and grouping.
The connects act between modules, the steel straps and pressure plates compress modules, while module
walls separate the cell groups.
57

CHAPTER 4. DATA COLLECTION, MODELING AND INVENTORY ANALYSIS
Figure 4.7: Cooling system structure options. 1) Air cooling: Cells equipped with distance fins for airflow. 2) Liquid cooling: Aluminium fins with integrated cooling channels. 3) Heat rejection directly fromcell tabs to cooling plate made of electrical isolating material. 4) solid cooling plates integrated betweencells, to cooled walls and bottom plate. 5) Liquid cooling: cylindrical cells, with wave shaped coolingchannel. 6) BatPaC coolant flows, 6a) Pack cut open between positive and negative terminal, 6b) packcut open in parallel plane to the pack terminal side.
The implications of cell modeling on the pack
BatPaC generates a model of a stiff pouch cell with stacked plates, and states that the modelrepresents most other types of cells of the same chemical and physical properties. This meansthat little differences are seen in comparison to other shapes of cells such as cylindrical withwounded windings and cells with flat wound, in terms of terminal material, current collectorsand cost [Nelson et al. 2011].
An advantage is given for the flat cells in the heat rejection, which is more efficient than thecylindrical cells. This is, however, to only main difference between the cell types in BatPaC,implying that the results from the BatPaC modeling can be considered indicative for genericbatteries. However, the dimensions of the ESS are specific for the flat cells, since cylindricalcells would occupy more space due to their geometry.
Cooling plates of prismatic soft cells
The thermal management of the battery pack attempts to guarantee that all the cells keep thesame temperature during use, and also that the temperatures are kept close to the optimum35 ◦C2, since deviation from this optimal temperature can speed up the aging of the cells. Thecooling is needed in between the cells, requiring a medium to reject the heat produced. A 50%ethylene glycol in water solution is used, in BatPaC assumed to have a density of 1070 kg/m3,heat capacity, 3.26 J/g◦C, with a fluid flow velocity of 2.5 cm/s. A power of 87 W is required forthe pump and motor to circulate the fluid.
The coolant should not be in direct contact with the cells for safety reasons, so aluminiumcooling plates are inserted between the cells, figure 1.3 (1) and 4.7. The positioning of thealuminium plates can be made in different ways, either with internal integrated channels forthe coolant, figure 4.7 (2), or solid metal in connection to the module walls/module base, figure4.7 (4). The solid cooling plate can at the same time serve as supporting wall. In this solutionno additional module walls are needed.
2Estimate from personal communication with Jens Groot, 2013.
58

CHAPTER 4. DATA COLLECTION, MODELING AND INVENTORY ANALYSIS
The pressure is given by steel bars connecting and tying the cooling plates together, figure1.3 (9). In case extruded solid aluminum plates are used, the base can be given the shapeof snap fit, reducing the time of assembly, disassembly, and need for additional screws andconnects. The alternative is solid cast profiles. This type of module construction is clever froma flexibility point of view; the cell width and size can vary and still fit the in the aluminumprofile construction.
A last option for the cooling is to directly use the tabs of the cells. The tabs have both theproperties of electrical conductors and of heat conductors and so they can lead heat to a coolingplate or the module house, that in turn must be of an isolating material, figure 4.7 (3).
The cooling structure of the pouch cells is quite small in comparison to the cylindrical cells.From a volume perspective the cells of cylindrical shape fill up the pack space less efficientlyand a lot of material for the wave shaped cooling structure is needed to guarantee the heattransfer between the cells and the coolant, figure 4.7 (5). The pouch cells can be packed veryefficiently thanks to their prismatic shape, this means that the cooling structure is limiting themost efficient packing of the cells, and thus the volumetric energy density, and in some extentthe specific energy of the pack.
The cooling plates can vary in thickness; producing a tradeoff between added weight andcost, and the rate of heat rejection. The heat transport is increased with a thicker plate of upto 3 mm 3. For a thin thermal conductor, the mass flow rate of the coolant must be higher,requiring more electricity for fans and pumping in the cooling system. The BatPaC coolingplates (called thermal enclosures or aluminium conductors) are thin, 0.4 mm, folding each cell,figure 1.3 (1). They are in connection to the module wall, which is cooled by circulation liquidflowing between the pack wall and the module walls, figure 4.7 (6).
The BatPaC construction implies that the module terminals are isolated from the coolingfluid by a plastic foam. From a reuse, or remanufacturing perspective this is not an optimalconstruction, since the plastic isolator must be removed to access the modules. A generaldifficulty is that the cell side and the cooling plate must be in direct contact for efficient heatrejection. The soft pouch cell can vary in thickness during its life because of swelling. In thiscase, thin sheets of plastic foam can be added to guarantee good contact between cooling plateand cell.
In the models, a cooling plate of 0.73 g is added to each cell according to the BatPaC designas the best case, making a total of less than 26 kg. This design of cooling system is good forslow charging when the heat flow is within the normal ranges, as in BatPaC [Nelson et al. 2011].Instead in the case of fast charging of the pack, heat is created at high rate. A more efficientcooling system is thus needed and often thicker cooling plates needs to be used. A sensitivityanalysis is used to see the impact of a cooling plate of 3 mm, and the weight of 300 g added tohalf the cells or to every cell about 113-220 kg. These scenarios are outlined in the results. Inthe last design, some of the module housing is directly substituted by the cooling plates.
Interconnections
For cells: The pouch cells are either welded or connected by screws. The first option is simple,but does not allow remanufacturing or reuse on the cell level. The screws and joining connectionplates/cables makes the interchange of cells possible but increase the number of parts of thesystem, making the assembly more demanding. In the BatPaC model, the cells are welded.For parallel connection, a cell group interconnect of 13 g (LFP) and 7 g (NMC) is added foreach module. The interconnects are dimensioned according to the voltage and the current. Inthe selected models, the cells are connected in 3 parallel strings. The pouch cells interconnectsare less complex than the cylindrical cells interconnects/bus bars and so higher part costs andslightly more materials needed due to the less efficient packing should be allocated for the
3Estimate from personal communication with Tomas Thelin, 2013.
59

CHAPTER 4. DATA COLLECTION, MODELING AND INVENTORY ANALYSIS
connection of cylindrical cells. The BatPaC model is not representative for cylindrical cells inthis aspect [Nelson et al. 2011].
For modules: The interconnects consist of a copper connect part, conducting the currentbetween modules, figure 1.3 (6). In BatPaC these interconnects are 30-42 g each and aredimensioned according to the voltage and the current. If the modules are supposed to beplaced in parallel, an additional bus bar is needed to interconnect the rows.
Stabilizing pack components
Stabilizing pack components consist of all pack and module housing materials that are presentto increase the mechanical stability and safety of the system. The function of each componentis presented in section 3.3.
Plastic module frames: The pouch cell group can be stabilized with plastic frames, in somedifferent configurations. In a row, these frames constitute the module wall. In the beginningand end of each module, a steel plate can be added to keep the cell group compressed. Steelrods keep the cell grouping together. Suitable plastic materials according to yield strength andYoung’s modulus are polypropylene (PP), Polyvinyl chloride (PVC), polycarbonate (PC) andpolyamide (PA) [Klason, Rigdahl, Boldizar & Kubat 2008]. The materials used in the modelingare polypropylene (PP) with a thickness of 2 mm. Extra steel plates are added on each modulefor increased stability. The recyclability of the different plastics may vary, but is not of furtherfocus in the modeling.
Steel pressure plates and steel straps: In addition to the steel rods, pressure plates can beadapted to add force in the compression of the modules, figure 1.3 (9). The cells may swellslightly towards the end of life from gas formation wherefore it is needed to force them intoshape by pressure. The pressure plates can be added on both sides of one module, or in thebeginning and the end of the pack in the cell alignment direction. The thickness of the platesis assumed to be 1.5 mm, weight minimum 590 g/plate in all models. According to the BatPaCconstruction, the steel straps keep the modules in shape, surrounding the whole pack, figure 1.3(9). The steel plates and the steel straps weight are summed in the models. Chromium steel304 is assumed since the coolant flows directly between module housings and pack housings,and must not oxidize the materials it is in direct contact with, figure 4.7.
Module housing: The walls around the cell group make the housing of the module, figure1.3 (5). The housing has the mechanical function of stabilizing the cell group, and making thepart easy to handle, move, lift, store, limit spreading of fire etc. The housing is modeled byeither plastic, aluminum or steel. Some of the module housing can be excluded, to reduce weightof the unit, if the base of the module gives enough support. In the model, plastic, stainless steeland aluminium have been used for the module housing. Stainless steel and aluminium coldrolled sheets of the thickness 0.5 mm are assumed in the models, and molded plastic (PP) of2 mm thickness. The increased thickness of the plastic sheet compared to the original thicknessof 0.5 mm, has been set to compensate for the lower strength of the plastic material per m3
[Ashby 2012]. Even though the increased housing thickness would have an impact on the totalpack housing dimensions, this effect has been omitted for simplicity. In fact the impact of thepack housing surface change is small in comparison to the module housing surface as seen inchapter 3.
Pack housing: The housing of the pack has the function of covering the row of modules,figure 1.3 (10). The pack housing can be excluded if the surrounding vehicle construction cantake that function which is the case for example in cars. The material recommended for thepack housing is aluminum or plastic for light weight construction.
Pack housing insulation: The insulation is sandwiched between two sheets of aluminiumin the ESS casing. It contributes to a more stable thermal climate in the pack. In the model isassumed a 1 cm thick layer of polyurethane (PU). The thermal conductivity of the pack jacketinsulation is described 0.00027 W/cm◦C in BatPaC.
60

CHAPTER 4. DATA COLLECTION, MODELING AND INVENTORY ANALYSIS
ESS: The bus ESS has a prismatic shape, normally with one layer of module rows. Commonmaterials for the ESS casing are steel and aluminum. It can be equipped with isolation plasticto reduce impacts from temperature changes. In the models, chromium steel sheet of 3 mm,and aluminium sheet of 2 mm are assumed. Welding and connects such as screws and washersare neglected. In the models, the ESS casing is equivalent to the pack casing.
Electronic components
For the control of the pack, grid to vehicle charging, and safety, a number of electronic compo-nents are present in the pack. The fuses, disconnect unit, Battery Management System (BMS)add expensive materials and parts to the system. The components are dimensioned accordingto voltage levels and current magnitudes. BatPaC uses a fixed set up of those components- 4 kgof BMS. The variable components are the SOC controllers. Those components are purchasedand the material compositions are not known in detail.
The amount of printed circuit board (PCB) is partly dependent on the number of modulesin the pack. The SOC controller, disconnect unit and BMS are accounted for as BMS inthe modeling, with a material content of 10% PCB, 50% copper, 40% steel [Majeau-Bettezet al. 2011]. Two different PCB of high and low gold content are tested in the models. The oneof high gold content has about 100 times more gold than the low gold content PCB, and bothmake part of the PCB options of low to medium gold content. The impact of control units andPCB can highly influence the results according to previous studies [Majeau-Bettez et al. 2011].Since there is no exact data available for the PCB, these two possible assumptions are testedin the sensitivity analysis.
Weight collocation of battery components and design choices
In order to make a realistic assumption of the possible battery weight increase due to differentdesign choices a maximum weight scenario was calculated. This scenarios was used as a worstcase weight increase in the LCA
Assuming a minimum pack energy storage capacity of 20 kWh, 324 LFP cells of 670 g/cell,217 kg cells, and on the other hand a 60 kWh pack of 648 NMC cells, 421 kg, then the weightdifference depending on the choice of chemistry and design is 204 kg.
The difference between the light case of aluminium and the more robust steel case is 78 kg.Dimensioning the cooling plates for fast charging can add between 113-220 kg kg aluminiumcompared to the minimum 27 kg aluminium for the thin cooling plates of the slow chargingdesign, which makes a difference of 193 kg.
Increasing the modularization rate, keeping a low rate of cells per module, the result can be27 kg extra aluminium.
The total possible difference between the lightest battery pack fulfilling the function andthe heaviest pack responding to the technical requests is at least 502 kg.
The drive lines of the hybrid bus, and the PHEV bus are often of the same design, with abattery pack that is seen as a black box during the equipment design. The drive line will notbe drastically changed for the conversion from HEV to PHEV, and so an unexpected weightincrease of the battery pack design can result in a higher energy consumption. In addition thebattery integration may also imply voltage mismatches in the drive line interfaces leading tothe need for extra converters which also means extra weight.
Alternative component materials and uses
The modeling of the pack considers a few scenarios and set ups for the LCA from a variety ofpack design possibilities. Some alternatives that would have been interesting to evaluate butcould not be included in the LCA in this thesis are hereby described.
61

CHAPTER 4. DATA COLLECTION, MODELING AND INVENTORY ANALYSIS
The steel chosen to represent all steel used in the ESS is stainless steel, due of the need forcorrosion resistance when in contact the cooling liquid. For another choice of cooling systemintegration, the steel housings could be of another steel type with less chromium. The ESS willbe completely integrated within the vehicle body and should thus not be exposed to possiblecorrosive ambient conditions, wherefore a less resistant material could be used, with a possiblelower environmental impact.
Some plastic materials that are often present in commercial packs have been excluded bychoosing the BatPaC design. The relative impact related to these other plastics are generallyhigh in comparison to the plastics such as PP and PE used in this thesis, but since these otherplastics are related to cables, isolation etc. their quantity is minimal and presumably theirimpacts will not change the overall results. This choice could, however, be further assessed.
The exchange of copper to aluminium in the connects and power system can be made todecrease the costs of the structure. It is likely that such a design change may have some impactin losses of heat from the electricity transmission, it is, however, recommended to check theefficiency loss of such a design.
To make the pack of aluminium less heavy and less complicated to recycle, the PU insulationcould be eliminated. For the steel and plastics case- the extra stabilizing steel compressionplates could be eliminated. Additionally for all the designs, the ESS housings could be reducedin weight by making use of the bus frames for some stabilizing and protecting function for thepack.
The efficiency and actual losses from parallel connections on module level, pack level andcell level should be studied in order to account for the costs of a shared modularization betweencar and bus.
With liquid cooling, conducted in between cells through channels in the aluminium plates,the rate of heat transfer could be higher, but the safety sets constraints on the type of coolingliquid. It should not be glycol and water which would act like an electrolyte if it comes in directcontact with the cell terminals. For liquid cooling between cells a non-electrically conductivecoolant may be needed. The environmental impact of such a coolant needs to be investigated.
4.3.4 Pack scenarios included in the LCA
Apart from the standard pack design using one pack, a few other scenarios were evaluated in theLCA. Different materials for the pack and modules are assessed for the standard model, creatingfour different standard scenarios. Other scenarios include having an oversized pack, having twosmall packs instead of one large, and changing where in the system the parallel connectionsare placed. These are based on the first standard design, corresponding to BatPaC’s originaldesign. The effect of increased the amount of cooling plates, and the effect of having a largergold content in the PCB are also assessed in the LCA, and also these are based on the firststandard model scenario.
BatPaC standard model scenarios
The base case for the evaluation of the housing material choice of the pack is made in the sameway for both NMC, and LFP, with some differences in size depending on the assumption of aNMC cell slightly larger than the LFP cell. Four standard cases were created; The first one,given the index design 1 is the original BatPaC design with aluminium housing in both pack caseand module case and a thick layer of insulating plastic to withstand temperature oscillations.Design 2 has a steel housing for both pack and module, to represent a very robust pack. Design3 was given a steel pack case and aluminium module housing, for robustness but at the sametime with less weight from the module housings. Finally design 4 was made with a pack caseof steel and a module housing in plastic (PP), to illustrate pack of a low weight, with cheaper
62
CHAPTER 4. DATA COLLECTION, MODELING AND INVENTORY ANALYSIS
material for the housing. The total bill of materials for the standard cases is found in tablesA.5 and A.4 in Appendix A.
Oversized pack scenario in BatPaC
The choice of using the same module and pack casing size for both LFP cells and NMC cellsillustrates a scenario in which the pack design is standardized to suit different applications.The winning is that the same manufacturing unit can be used for all the housings and theproduction costs may be lowered by reducing the diversity in specifications. The advantagecould be seen by a xEV car manufacturer and a xEV bus manufacturer that could make useof the same standardized battery module unit even though the requests on type of cells aredifferent. Additionally there may be consequences depending on different capacity (Ah) andvoltage of the two different cells within the module. The number of cells is assumed to be keptthe same for both cell types and some filling material or stabilizing structure needs to be addedto the module housing to keep the cells in position. This extra material is omitted in the modelsdue to lack or information. The indata can be seen in table A.4 in Appendix A.
Double pack scenario in BatPaC
The use of two small packs of 20 kWh to substitute a big one of 40 kWh has some implicationsin duplicated control units. The driving force is to make a small pack an independent elementthat is autonomous in terms of control and cooling system. The pack could be used aloneor in multiples to suit different applications and reducing the production costs. The case isevaluated in terms of added materials for the original BatPaC design with aluminium and PU.The module housings stays the same and the ESS housing is a little increased. The importantchange is found in the control system. The indata used for the two packs can be seen in tableA.4 in Appendix A.
Module parallel connection scenario in BatPaC
The influence of changing the system level of parallel connection is investigated. The connectionof three module strings in parallel instead of three cells in parallel is modeled in BatPaC forthe same modular configuration as in the NMC standard case. When parallel connecting threemodule rows some extra SOC control units are needed to treat the greater amount of informationand less total amount of copper connects are required, see indata in table A.5 in Appendix A.The efficiency and actual losses from parallel connections on module level, pack level and celllevel should be studied in order to account for the costs of a shared modularization betweenPHEV car and PHEV bus.
4.4 Use phase
The use phase is known to have a great impact of the vehicle life cycle. The aim to reduceemissions and fuel consumption has led to the PHEV solution which allows combining electricdriving with ICE driving. For an appropriate evaluation of the battery environmental impactit is important to take both the electricity consumption into account and the fuel consumptionwhich both can be related to the load carried on the vehicle at the medium speeds common incity driving. Fundamental for a bus in city service is to carry a high number of passengers, aneed that may become limited by a weight increase of the bus due to the electrification. Thescenarios for the use phase have been selected to illustrate city driving of a common bus sizewith average passenger load, comparing PHEV bus to a standard reference bus and a hybrid
63

CHAPTER 4. DATA COLLECTION, MODELING AND INVENTORY ANALYSIS
bus. The per passenger impact of the battery weight added is also made to give an illustrativeexample for the later battery life cycle impact assessment.
Vehicle and driving parameters
The use phase scenario is modeled after the intended use of a bus. A city driving cycle chosensimilar to the European standard ‘Braunshweig’ cycle [Barlow, Latham, McCrae, Boulter et al.2009]. The assumed average annual driving distance was assumed to be 120000 km/year. Theelectric range which is important for the possible fuel savings was kept high, at 80%4 of thetotal driving range. Since the driving conditions are quite intense, the vehicle life length wasassumed to be 9 years, for which three batteries were assumed to be consumed5. The batterylife length is theoretical and should be validated once measured use data are available. For asummary of all data used in the modeling of the driving see table A.6 in Appendix A and table4.6 for emissions accounted for.
Table 4.6: Emissions from driving, with 0.211 kg diesel/kWh, 40% efficiency. Ammonia emissions from
urea are neglected. *Emission limits for the Euro VI legislation.
Emission g/kWh
CO 0.0305 (1.5*)
HC 0.000026 (0.13*)
NOx 0.107 (0.4*)
PM 0.0023 (0.01*)
CO2 681
SO2 0.0013
Energy consumption related to vehicle weight
The vehicle weight for truck or bus with two axes is 18000 kg, according to the Swedish transportauthority [Transportstyrelsen 2013]. In reality the bus weight is measured from the front axisand the rear axis of the vehicle according to a set of rules implying that the total weight ofthe vehicle may be higher. The placement of the engine and battery has importance for themeasured total bus weight and thus the number of passengers that are allowed. The distributionof the maximum passenger load together with the curb weight amounts to 19 tonnes for thehybrid bus 7900 [Volvo Buses 2013a] the same assumption was set for the PHEV bus.
A heavier vehicle will use more fuel. The fuel consumption increase was assumed to belinear, at least 2% increase for every added 1000 kg load on the vehicle 4. In these speed rangesthe air resistance force can be neglected, while the rolling resistance and the acceleration force(mvehicle ·a) may be considered. On a vehicle of 12000 kg with 1000 kg added, the weight increaseis 8% making the minimum energy consumption increase by the same percentage for a standardbus. In the hybrid bus the regenerative braking reduces the losses and the assumption of a maxincrease of 7% is reasonable 6. The electric motor was assumed to have a proportional increaseof electricity consumption in relation to the weight added 4. The power of the battery wasassumed to be 170 kW to suit the given vehicle weight and for absorbing the braking power andfurnish the electric motor with the sufficient power in full electric mode with some margins fordegradation of the power output during the battery service time. The reference electric motoris of 150 kW [Volvo Buses 2013a].
4Estimate from personal communication with Edward Jobson, 2013.5Estimate from personal communication with Jens Groot, 2013.6Estimate from personal communication with Johan Johansson, 2013.
64

CHAPTER 4. DATA COLLECTION, MODELING AND INVENTORY ANALYSIS
The fuel consumption for the average loaded standard bus was supposed to be 0.45 l/km, forthe hybrid and PHEV bus, 0.31 l/km full hybrid mode, and 1.5 kWh per km full electric mode.To reduce the NOx emissions according the Euro VI limits urea solution is injected with thediesel [Johnson 2008]. See table 4.7 for detailed data.
Table 4.7: Number of passengers and energy consumption related to normalization of the use phase per
passenger and kWh charged electricity for PHEV bus scenario.
PHEV bus Parameter Value Personal communication
Average weight 1 passenger 75 kg Martin Aslund
Linearized diesel consumption increase 7 %/tonne Johan Johansson
Electricity consumption increase Proportional to Edward Jobsonweight increase
Max All-diesel consumption full bus 0.40 l/km [Calculation]
Max All-electricity consumption full bus 1.94 kWh/km [Calculation]
Max passengers with 500 kg added battery weight 83 [Calculation]
The impact of weight increase on the bus due to the battery can be seen in different waysdepending on the scenario used. The battery added on the maximally loaded bus will notchange the fuel consumption but reduces the number of passengers 7, the battery added on ahalf loaded buss will only increase the energy consumption. In the case of lost passengers theallocation of an extra bus could be done to the marginal increase of battery weight 8. The twofirst assumptions will be further considered in the modeling, and the last case will be discussedin the results.
As an example, to compare the per passenger and per km energy consumption of a fullPHEV bus of 90 passengers and a similar bus with a 500 kg heavier battery, 7 less passengerswould be transported in the heavier bus. If 1000 kg extra components and battery is added,and the total passengers are reduced by 13. The difference in fuel consumption per passengerand km depending on the added weight on the vehicle can be seen in table 4.8.
Table 4.8: Normalized energy consumption per passenger and km for PHEV bus. The actual energy
consumption from the use phase is normalized per passenger in the case of full loaded bus, with 500 kg
extra battery, and average loaded bus with 300 kg extra battery. Fuel and energy consumptions are taken
from table 4.7 and A.6
Full load Average loadFull load (ref) 500 kg extra Average load 300 kg extra
Consumption (90 people) (83 people) (33 people) (33 people)
Electricity Wh/passenger km 8.8 9.5 18.4 18.8Diesel Wh/passenger km 17.2 18.7 36.4 37.1Energy Wh/passenger km 26 28.2 54.8 55.9% of reference energy 100 108 211 215
Modeling of use phase and driving
The modeling of the use phase in the battery life has been done by adding 300 kg batterytogether with the average load of 33 passengers assuming that the drive line is similar to thehybrid bus 7900 and that extra battery weight has been added on top of existing components.The increase in energy consumption related to this increase in battery weight is accounted for.
7Estimate from personal communication with Pontus Enhager, 2013.8Personal communication with Lisbeth Dahllof, 2013.
65

CHAPTER 4. DATA COLLECTION, MODELING AND INVENTORY ANALYSIS
The original fuel consumption with 33 passengers on the bus is given in table A.6 in AppendixA, the increase is 0.0719 kWh/km for the diesel consumption full ICE mode, and 0.0374 kWh/kmfor the full electric mode. The results are normalized by kWh electricity charged and passenger.The relations between the energy consumption on a per passenger basis and the degree ofcompletion of the number of passengers on the bus when the battery is added are shown intable 4.8.
4.4.1 Normalization and functional unit for LCA comparisons of the usephase
The normalization of the use phase of the battery is a difficult topic. The most uncertainparameter is the life length of the battery and it is quite difficult to determine and to predictsince it depends on the driving style, about the slow or fast charging of the battery, on thedimensioning of the battery to suit these applications, on the BMS and management of coolingsystems and voltage regulation. The only actual measurable parameter is how much electricitythat has been charged to the battery and discharged from the battery.
It is tempting to calculate the impacts according to the number of cycles of the battery.The great disadvantage of this normalization is that one cycle of the battery can have differentdepth, different rates of power and to make it a unit means that a fictional average cycle depthshould be created, in relation to the maximum SOC window. There is no standard method totranslate the driving related battery cycles of different depths to an average cycle unit, witha clear relation to the battery life length. It is a lot different to cycle the battery cells in alaboratory under controllable conditions and to cycle the battery in the vehicle.
Still, a lot has to be done in research and development in this topic. A standardized methodto determine the average cycle depth of the battery should be determined before it can be usedin normalizations for the use phase of a vehicle. Two batteries used in the same type of vehiclesin the same type of driving cycle and with equal control strategies could be compared over thesame time. Since no such standardized control strategy of BMS is used in all vehicles this isthe limiting factor.
To conclude, the battery is still a consumable product that can last for a long time or shorttime, serving the vehicle with more or less energy depending on how cleverly it has been used.It is up to the ESS manufacturer to furbish a battery with control strategies to withstandcertain driving conditions, and up to the user to execute this precise driving in order to makethe battery serve in its application as long as possible.
Per passenger and kWh electricity consumed by the battery
For the functional unit the choice has been done to look at the energy that passes throughthe battery during its service time in the vehicle. The efficiency of the battery is high around95-98% 9 and decreases only marginally, less than 5% during service in the vehicle9, thus thetotal electricity that is charged to the battery will be a measure of the function of the battery-to supply electricity. The measuring of the electricity upstream of the battery is feasible, thecharged electricity from the grid to the battery is always counted. The amount of electricity willbe large for a battery that lasts for many years and is used frequently, for a battery that failsduring service the electricity consumed will be low. This means dividing the impacts with theconsumed electricity for a highly functional battery will give a lower per unit impact than a lessfunctional battery, which means that the functional unit serves its purpose. This functional unitavoids the issue of electric range, SOC, cycles, energy density and specific energy. The last twoare drawbacks for this functional unit since the weight and volume of the pack are importantparameters for the automotive service. However, the weight related to fuel consumption, and
9Estimate from personal communication with Jens Groot, 2013.
66

CHAPTER 4. DATA COLLECTION, MODELING AND INVENTORY ANALYSIS
volume indirectly determining the amount of battery capacity that can be fit into the vehicle arein this thesis considered as secondary from an environmental perspective. Instead the priorityhas been made to look at the life length of the battery. It should be taken into account whenusing this functional unit that a heavier battery will lead to a higher electricity consumptionthan a lighter one with the same performance.
To further include the purpose of the bus (which is to transport passengers), the functionalunit for this thesis has been set to ’per passenger and kWh charged electricity’, which meansthat the total life cycle impact results will be normalized with this unit.
4.5 Second use and reuse
Second use of the battery pack means prolonging the life of a product that otherwise would bescrapped, if it still is valid as energy storage. Hopefully second life will come to reduce costsfor the PHEV user, and possibly reduce the environmental impacts of the battery life cycle.Previous LCA studies have shown that a 25% decrease of the environmental load is possible for aLFP 20 Ah lithium-ion battery life cycle when including second use [Cicconi, Landi, Morbidoni& Germani 2012]. Second use is, however, not in practice yet and some questions have to beanswered in order to evaluate the viability: How does the battery design affect the possibilityto use the battery in a second life application? Will then the use in the vehicle be reduced andthe second life be longer?
As stated in section 3, the rationale for the battery retirement from automotive use can beboth economical or performance based. One question is whether the battery should be retiredearlier from the automotive service in order to continue in the second use sector. It has beenshown that with a decreasing battery price it will always be more economically viable for thevehicle owner to keep the battery in the vehicle as long as the performance criteria are satisfied[Neubauer & Pesaran 2011]. It then is assumed that the investment cost of the battery islevelized per driven distance, the refurbishment cost is more than zero, and the repurposedbattery will have a lower value (because of the consumer willingness to pay) than an equallyperforming new battery [Neubauer & Pesaran 2011].
The used automotive battery in second use application, will have a smaller amount ofavailable cycles and a faster energy storage capacity fade than a new battery of the sameinitial capacity. Therefore, more second life batteries must be used to fill the same service lifeas of a new battery. In addition to the capacity fade the internal resistance of the battery willalso increase, resulting in a high efficiency loss during the second life [Cicconi et al. 2012]. Toaccount for this in LCA, the allocation of the replacement of batteries can be made by dividingthe used battery, by a term of N + 1 , where N is the number of battery replacements requiredby the second use, and adding the impact from the electricity loss due to efficiency decrease[Cicconi et al. 2012].
The second use and reuse rate depending on failure rates
The prediction of the cell failure rates in the second use, is important for making realisticassumptions about need for remanufacturing and exchange of cells. Such prediction requirestests of the cell failure rates at a certain number of cycles, for use patterns similar to the onesof the second use scenario. In a general approach it can be assumed that the probability ofthe need for a cell replacement should to be determined at the automotive EOL. Dependingon the cell performance at the first EOL, it can be passed over to the second use or scrapped[Neubauer et al. 2012]. The amount of packs in a fleet of 1000 vehicles that can continue tosecond use with minor refurbishment at a cell fault rate of 0.0001 are 940 packs, counting the
67

CHAPTER 4. DATA COLLECTION, MODELING AND INVENTORY ANALYSIS
Figure 4.8: Theoretical module and pack yield in relation to different cell fault rates and numbers of
cells, showing the probability of a functioning module or pack at a certain content of cells, after first use.
probability for the functioning of altogether 648 cells, (1−1/10000)648. In the same way, a faultrate of 0.001, reduces the packs sent to second use to 520, and with 0.01 cell fault rate only 1.5packs could be sent to second use. Thus second life could be possible only if the cell fault rateis less than 0.01 the second life could be possible, see figure 4.8.
If refurbishment is considered on a module level, the worst case of a cell fault rate of 0.1,for 12 cells per module, and 54 modules per pack would generate 15 functioning modules inone pack (28%), and if the fault rate is 0.001, the yield of functioning modules would be 53(99%). For a smaller module of 4 cells the fault rate of 0.1, generates 66% module yield, and fora larger module of 24 cells, the yield would be only 8%. As stated in the article by Neubaueret al. [2012], the higher the fault rate, the smaller the module that would be required to makethe second use scenario viable.
The refurbishment of the modules exchanging single cells, is a possible choice if high faultrates are unavoidable, and the refurbishment of complete packs, is an option in case of very lowfault rates. Different options of remanufacturing of the system are showed in table A.7 in Ap-pendix A. Either the battery packs are kept intact and are changed whenever the requirementsof power and energy storage capacity no longer are met or the modules are exchanged whentheir internal capacity is below requirements.
Averaged reuse rate
Taking the remanufacturing and the refurbishment of modules into consideration, it is necessaryto evaluate the to what extent different components can be reused. Assuming the cells can bereused once, the maximum average reuse rate of cells would amount to 50%. However, if thefunctioning cell yield from the module only is 70% after first use, and an average of 50% ofthese can be used one more time, the resulting reuse rate for the cells in one average module isapproximately 35%. The reuse loops with material flows are illustrated in figure 4.9.
It should be noted, however, that in order to obtain these average results in all modules, alarge fleet of used batteries would be needed. The inflow of new cells must also be guaranteed,since the cell reuse rate is different from the average module and pack reuse rate.
Second use example
UPS for small industries or large stores such as IKEA is a possible choice of a second lifeapplication for used automotive batteries. The battery will supply power during outages of1 hour length, 10 times per year for 10 years, connected to the low voltage grid (400 V), witha power of 50 kW. The power requirement of 50 kW for 1 hour makes the need for 50 kWh
68

CHAPTER 4. DATA COLLECTION, MODELING AND INVENTORY ANALYSIS
(a) Reuse loops for cells and module housing.
(b) Reuse equations for mass flows.
Figure 4.9: Reuse loops for one module unit, assuming a different reuse rate for module housing and
cells. The cells could in the best case be used twice, and the housing is assumed to be reused for infinite
number of loops. The cell and material flows are illustrated in (a), and the formulas for the mass flows
are found in (b) together with the averaged percentage of reuse for the cells.
69

CHAPTER 4. DATA COLLECTION, MODELING AND INVENTORY ANALYSIS
available energy storage capacity. With a SOC window of 60% this means 83 kWh total storagecapacity. Every application would need 3 old 40 kWh bus batteries of 70% storage capacity.The total cycling would be 100 cycles which is marginal in comparison to the total numberof 10000 cycles during the battery life making the application reliable if tested and diagnosedpreviously. The remanufacturing in this case would be minimal. The market is, however, smallwith presumably 10-20 applications to cover in Sweden, amounting to a fleet of at maximum60 used bus batteries. The price of the battery could at maximum be set to 25% of the currentmarket price 10.
This second life case is preferable compared to other larger UPS applications in which theadditional installation equipment and cost makes the battery price neglectable in comparison,and the risk for dysfunction cannot be taken. In an LCA perspective the allocation of the savednew battery produced is difficult to determine. In fact the battery sent to second use couldbe evaluated on the basis on available storage capacity, the power, expected remaining life,consumer perception [Neubauer et al. 2012] or a coefficient of the new battery market price.The simplest approach is to assume that one old battery replaced 0.7 new batteries, and thatthe cradle to gate emissions from materials extraction could be avoided as a credit, given thatthe UPS would have been installed anyway, and that for maintenance the life time of the batteryis set to 10 years even in the case of a new one.
If instead the original UPS application is expected to last 20 years and the predicted life ofthe used automotive battery lasts only half the time, the cradle to gate impact reduction of anautomotive battery is only 35% compared to 70% according to the allocation method of [Cicconiet al. 2012]. The losses in electricity comparing the old and the new battery may be significantif the efficiency loss is high for the used battery, depending on changes in the material leadingto increased internal resistance. The difference in losses on total charged electricity between anew and an old battery may be at least 9%, see table 4.9. In addition the capacity degradingmay be at different rates for the old and the new battery and a linear approximation may befar from reality.
A possibility that can be considered is to make window change during the use phase,either for mitigating the gradual efficiency and capacity loss, or to make the battery lastlonger. The first design requirement of available capacity may than be dependent on manyuncertain parameters, making the dimensioning difficult. This means that the first assumptionof comparing the total capacities of the new and the old battery at present time may not beenough as a base for the dimensioning. As in the example in table 4.9 the initial capacitymay vary with 50% depending on what dimensioning method used. The prediction models ofbattery life performance after automotive use will be needed for a more secure allocation anddimensioning.
10Estimates from personal communication with Per Halvarsson, 2013
70
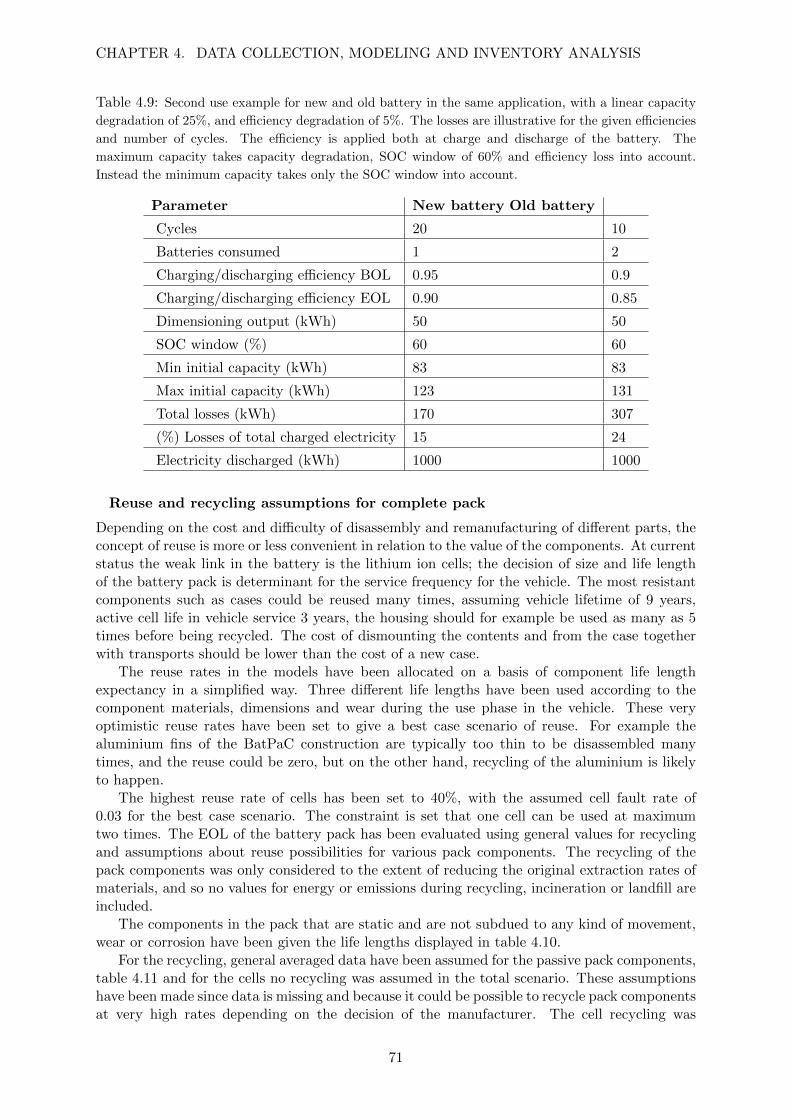
CHAPTER 4. DATA COLLECTION, MODELING AND INVENTORY ANALYSIS
Table 4.9: Second use example for new and old battery in the same application, with a linear capacity
degradation of 25%, and efficiency degradation of 5%. The losses are illustrative for the given efficiencies
and number of cycles. The efficiency is applied both at charge and discharge of the battery. The
maximum capacity takes capacity degradation, SOC window of 60% and efficiency loss into account.
Instead the minimum capacity takes only the SOC window into account.
Parameter New battery Old battery
Cycles 20 10
Batteries consumed 1 2
Charging/discharging efficiency BOL 0.95 0.9
Charging/discharging efficiency EOL 0.90 0.85
Dimensioning output (kWh) 50 50
SOC window (%) 60 60
Min initial capacity (kWh) 83 83
Max initial capacity (kWh) 123 131
Total losses (kWh) 170 307
(%) Losses of total charged electricity 15 24
Electricity discharged (kWh) 1000 1000
Reuse and recycling assumptions for complete pack
Depending on the cost and difficulty of disassembly and remanufacturing of different parts, theconcept of reuse is more or less convenient in relation to the value of the components. At currentstatus the weak link in the battery is the lithium ion cells; the decision of size and life lengthof the battery pack is determinant for the service frequency for the vehicle. The most resistantcomponents such as cases could be reused many times, assuming vehicle lifetime of 9 years,active cell life in vehicle service 3 years, the housing should for example be used as many as 5times before being recycled. The cost of dismounting the contents and from the case togetherwith transports should be lower than the cost of a new case.
The reuse rates in the models have been allocated on a basis of component life lengthexpectancy in a simplified way. Three different life lengths have been used according to thecomponent materials, dimensions and wear during the use phase in the vehicle. These veryoptimistic reuse rates have been set to give a best case scenario of reuse. For example thealuminium fins of the BatPaC construction are typically too thin to be disassembled manytimes, and the reuse could be zero, but on the other hand, recycling of the aluminium is likelyto happen.
The highest reuse rate of cells has been set to 40%, with the assumed cell fault rate of0.03 for the best case scenario. The constraint is set that one cell can be used at maximumtwo times. The EOL of the battery pack has been evaluated using general values for recyclingand assumptions about reuse possibilities for various pack components. The recycling of thepack components was only considered to the extent of reducing the original extraction rates ofmaterials, and so no values for energy or emissions during recycling, incineration or landfill areincluded.
The components in the pack that are static and are not subdued to any kind of movement,wear or corrosion have been given the life lengths displayed in table 4.10.
For the recycling, general averaged data have been assumed for the passive pack components,table 4.11 and for the cells no recycling was assumed in the total scenario. These assumptionshave been made since data is missing and because it could be possible to recycle pack componentsat very high rates depending on the decision of the manufacturer. The cell recycling was
71

CHAPTER 4. DATA COLLECTION, MODELING AND INVENTORY ANALYSIS
excluded due to the high cost, and the probability that it will happen is low in the close future.
Table 4.10: Reuse rates battery components. The extraction rates assumed for the scenario of maximum
reuse of passive battery pack components, based on the material thicknesses and aging during the use
phase. The ESS system is set to last 3 years.
Extraction rate Total years TimesBattery component factor per ESS in service used
Pack housing 0.2 15 5Module housing 0.2 15 5Insulation 0.2 15 5Copper connects 0.33 9 3Steel connects and straps 0.33 9 3BMS 0.33 9 3Coolant 1 3 1Cells 1 3 1Thin (0.4 mm) cooling plates 1 3 1
Table 4.11: The recycling rates assumed for the scenario of maximum recycling of passive battery pack
components, based on the extraction rates with reuse taken into account. No energy recovery of energy
consumption is included for the waste management. Only the reduced material extraction is accounted for
in the recycling scenario. The recycling rates are general average values commonly applied[Ashby 2012].
Battery Recyclingcomponent/material rate BatPaC component
Stainless steel 0.4 Housings, pressure plates and strapsAluminium 0.55 Housings, cooling platesPU 0 Thermal insulation for housingPP 0.06 HousingsCopper 0.40 ConnectsBMS 0 -Coolant 0 -Cells 0 -
4.6 Cell recycling models
The end of life (EOL) stage of the LCA is an important stage to assess since it can help decreasethe impact of the material choices by recycling materials and allocating the emission betweendifferent products. However, it should be stated that great uncertainty is associated with therecycling step, since it occurs in the future, it is cost driven, new materials are constantlydeveloped and the state of the battery when it reaches this stage varies.
Since recycling is both a current and future problem, comparison of one existing recyclingmethod for NMC with one future method of LFP is of interest. For the current method moredata exists, but for LFP it is also of interest to look beyond existing methods that focus onCo and Ni extraction. Therefore a hydrometallurgical method will be included for LFP. Thischoice will give perspective on possible future recycling alternatives.
72

CHAPTER 4. DATA COLLECTION, MODELING AND INVENTORY ANALYSIS
Pyrometallurgical method
As a model for the pyrometallurgical process data from a report by Dunn, Gaines, Barnes, Wang& Sullivan [2012] was used. The report presents an assumption of the energy requirements for apyrometallurgical recovery method, based on the process by Umicore. The data was presentedin the form of energy/kgcobalt, although the exact chemistry was unknown. It was also statedthat the percentage of cobalt in the battery was 14%, information taken from a patent byUmicore [Cheret, Santen et al. 2007]. In order to apply this data to the NMC evaluated in thisthesis the data was translated into the general form energy/kgbattery, which then was assumedto be a good approximation also for other types of layered oxide Li-ion batteries, like NMC.
The steps involved in the process were:
• Smelting, 0.21 MJkginput.
• Leaching, 0.08 MJkginput.
• Solvent extraction, requiring stoichiometric amounts of HCl.
• Oxidation, requiring stoichiometric amounts of H2O2.
• Firing, 1.18 MJkginput, requiring stoichiometric amounts of Li2CO3.
The solvent extraction and oxidation steps were assumed to require zero energy input.
Hydrometallurgical method
For the LFP chemistry, where pyrometallurgy is of no interest due to the lack of valuable Coand Ni parts, a hydrometallurgical method was modeled as recycling method. With the aim toextract lithium as well as valuable copper and aluminium, the method chosen was a promisingfuture one, solvent extraction. The data for this process was based on lab-scale test of thisprocess performed by Kosaraju [2012].
The steps involved in the process were:
• Dismantling, cutting the cell and separating active material from foil, requiring HCl forleaching.
• Solvent extraction, requiring kerosene and Cyanex 272 mix for extraction.
• Lithium extraction, requiring HCl.
It is possible to extract iron with an additional leaching step, but this will be disregarded in thisthesis. The pouch and the separator are also assumed not to be recycled, and could possibly endup in an incineration process to eliminate waste. This will not be included in the assessment.The foils are assumed to be recycled back to foils, which is somewhat misguiding. They arerecycled in their original form, but the potential to use them is more limited since they arealready cut.
Since the energy requirements for each step are highly dependent on the scale of recycling,and no large scale test have been made, it is assumed that no process energy is required. Thesavings can then be viewed in light of this, as potential savings. The main impact from thismethod is in the cost and environmental impact of the chemicals involved. It is assumed that90% of the solvents and extractants are recycled in each cycle. To motivate this assumptionreports show that large scale systems have stated recovery up to 97% (Dalal Engineering),while small scale have reported around 75-80%. Pharmaceutical companies have set a desiredrecovery at 90% [Rockwell Automation 2009], making this value a reasonable assumption forthis future method. It should also be noted that additional energy consuming steps, apart fromthose mentioned above could be needed to ensure various things, for example that the solventand binder do not get released with the waste water without processing.
73

CHAPTER 4. DATA COLLECTION, MODELING AND INVENTORY ANALYSIS
Recovery rates
In the future of battery recycling the goal would have to be to recycle the constituents back tobattery grade material. For the purpose of this thesis we will count material recycled to a lowergrade, but with opportunity to be improved to battery grade material, as recycled. With thisapproach the energy cost of refining the material would be placed in the LCA of a battery usingrecycled materials. In the LCA the recovered material will be set as a negative contribution,and the size of this contribution will be equal to the energy consumption of the correspondinginput material.
Some different recovery rates were used for the different materials and recycling processes.In the pyrometallurgical process it is assumed that either all or none of the material is recycled,the effect of this assumption will be tested in the sensitivity analysis. Most likely, there will besome slag left from the reactions occurring when pyrolized. The same assumption is made forthe hydrometallurgical method, except for the electrolyte were some losses due to evaporationare assumed. For this process the assumption of 100% is more likely to be achievable, since allthe materials are handled in their pure form, and thus no yields for reaction need to be takeninto account.
74

Results
This chapter presents the results from the life cycle assessment of battery cells (section 5.1),modularization and pack design (section 5.2), use phase (section 5.2.1) and recycling (section5.4). The energy during the cradle to gate of the components are analyzed, along with thechosen impact categories. The potential energy savings from recycling are presented separately.
5.1 Cell manufacturing and constituents
The cell and its material production are major components in the impact of the production phaseof the battery system. The impact per cell is also largely independent of other parameters relatedto the whole ESS, making the cell assembly results applicable to other system configurationsthan the ones modeled here. Therefore the impact of different cell chemistries and processchoices will be presented as a separate category, where the implication of changes in the cellwill be in focus. The same cells will later be viewed in light of their place in the total system,see section 5.2.
5.1.1 Energy use for the cell components
The energy consumption during material extraction, production and cell assembly is an impor-tant step to analyze. Both the total amount used and the distribution between the differentstages have implication for total impact and possible gains of recycling.
Figure 5.1 shows the energy use impact of the different cell components for the variouschemistries, and the total energy consumption for one kg of battery cell. Independent ofchemistry and production method, it is the lithium-based electrodes that have the largestimpact. For this reason, the fact that LMO uses LTO anodes instead of graphite means ahigher total energy consumption for this cell type. The production of one kg of cell requiredroughly 80-100 MJ for the graphite based cells, which is in line with, or slightly lower thanprevious work [Majeau-Bettez et al. 2011] [Notter, Gauch, Widmer, Wager, Stamp, Zah &Althaus 2010]. The results from the LTO based cells are slightly lower than previous work[Kushnir & Sanden 2011].
The total results for the different production paths give indications on the best approach forproducing cells with different chemistries. For the cells using materials that need nano-sizingthere is a clear advantage in using the wet synthesis. For the cell not needing nano-sizing, NMC,the impact is more equal between production paths.
The impact from the cell casing seen in figure 5.1 is mainly caused by the use of aluminium.More than 90% of the energy use for this component comes from the aluminium foil andits processing. The plastics and their processing play a smaller role, suggesting room forimprovement if less aluminium is used. For the separator, the main energy consumption is
75

CHAPTER 5. RESULTS
Figure 5.1: The energy consumption from extraction of materials to finished cell is shown for each cell
component. All chosen chemistries are represented, with both wet and dry production alternatives for
the cathode active material. The negative anode is graphite based for all chemistries except for LMP,
where the anode active material is LTO. It can be seen that the electrodes consisting of active material
and foil have large impact.
in the plastics, and only a little over 6% is from the production. Due to the way the electrolyteproduction was modeled, with no energy consumption for the mixing steps, all the energyimpact is from the constituent materials and their production. The contribution from thesolvent materials and the salt precursors is roughly equal, with a slightly higher impact fromthe carbonate solvents. The cell assembly with its energy consumption both from electricity andheat contributes around 5% of the total energy use, when looking at the production alternativewith least total consumption.
Energy use of the electrode components
As shown in figure 5.1, the positive electrode is a key consumer of energy during the cellproduction. In figure 5.2 the impact of each of the components in the positive electrode isshown. This reveals the large part that the foils play when it comes to energy consumption.The assembly of the electrode is a minor part. It is also clear that the relation between energyfrom processing and energy from materials in the active material production varies dependingon the type of production method used.
When the materials needs to be nano-sized, like for LFP, LFS and LMP, the process energyfor the dry synthesis rises considerably due to the extra milling step. This difference is notpresent in NMC, here the simplicity of the dry process can be beneficial. The effect of assumingdifferent amount of water as heating solution during the wet process can be seen in the differencebetween LFP and LFS wet, LFS is modeled as using less water per kg active material, and theenergy use scales accordingly. The energy consumption for the LFP wet process is slightly higherthan in previous studies, indicating a possibly over dimensioned assumption of the amount ofwater needed [Kushnir & Sanden 2011]. The dry process for layered oxides is fully in line withprevious work. The indication of improvement when using a wet process on nano-sized materialsis consistent with previous work [Kushnir & Sanden 2011].
The relative impact of the active material production and the active material precursors
76

CHAPTER 5. RESULTS
Figure 5.2: The energy consumption from extraction of materials to finished cell is shown different
constituents of the positive and negative electrodes. The energy is calculated per kg of total cell, and
thus the results reveal the relative impact of different electrode constituents for a certain chemistry, as
well as the difference between chemistries. The foils and the active material stand for virtually all the
energy consumption of the electrodes.
vary. For NMC the main impact is from the precursors, highlighting again the energy intensematerials used in this chemistry. In the dry process over 70% of the active material energy isfrom Co and Ni precursors. In the wet process the chemicals for hydroxide production furtherincreases the impact of the active material precursors, although less energy intense materialscan be used as nickel and cobalt source, only contributing 30% of the active material energyconsumption. Improvements to the process will only give minor benefits in this case.
In contrast LFS has its main impact from the process. The active material also has a smallertotal impact. LFP and LMP have a wet synthesis consuming energy close to that of NMC, butthe contribution of precursors versus production is changed, making improvements in processequally beneficial to improvements in precursor alternatives. In these material there is also nodominating precursor, as Ni and Co are in NMC.
Switching focus to the anode it can be concluded that the graphite anode has a much smallerimpact on the energy consumption than the cathodes. The relative contributions within theelectrode between active material and foil is however similar. Changing anode to LTO, with itsdifficult production and demands on nano-size, greatly increases the energy consumption. Thiseffect is due to the change of foil to aluminium, and the great increase in process energy andprecursor complexity compared to graphite.
Looking again at the impact of the foils, the aluminium in the cathode electrodes has a largerenergy impact than the copper in the anode. The positive aspects of using aluminium are notcoupled to energy consumption, but rather to price, and aluminium is used were possible. Anadditional effect is also that the copper sheet can be thinner, and thus less material is used. Inthe electrodes the energy consumption is basically only from the aluminium foil and the activematerial, in average around 50% each depending on chemistry and production path. This resultis consistent with that of Notter et al. [2010], showing the aluminium foil contributing morethan 50% of the cathode impact.
Normalizing with available cycles
The energy consumption when producing a cell use should also be viewed in light of the possiblelife-length of the cell. Since the LTO anode provides the possibility of more cycles this can
77

CHAPTER 5. RESULTS
(a) Best/worst case energy, wet synthesis. (b) Best/worst case energy, dry synthesis.
Figure 5.3: The production energy per kg of cell is presented normalized with the available cycles. Best
case represents deep 3000 cycles for the graphite anode based chemistries (LFP, NMC, LFS) and 10000
for the LTO anode chemistry (LMP). Worst case is represented by 500 deep cycles for all. It is clear
that a full utilization of the available cycles compensates the higher energy use of the LMP-LTO cell.
compensate the higher energy consumption during production. The impact of this normalizationcan be seen in figure 5.3, where the worst case performance has been set to 500 full cycles, andthe best case to 10000 full cycles for LMP and 3000 full cycles for the other chemistries. Fullcycles implies that the depth of discharge is equal to the cell capacity.
It is clear that a full utilization of the possible 10000 cycles for LMP with the LTO anodefully outweighs the larger energy consumption shown in figure 5.1. However, if this possibilityof longer life-length is not utilized fully the anode choice cannot be motivated compared to theless energy intense graphite anode. However, the indication of prolonged system life that comeswith increased cycle life can be of great importance to the viability of batteries as ESS. Previouswork concludes that the impact of improved cycle life goes beyond the differences in energy use,since the benefits of having systems that last as long as the vehicle are very large [Kushnir &Sanden 2011].
Figure 5.3 illustrates the opportunities for improvement coupled with using materials thatincrease the life-length of the battery. The increased life can make the production cost per yearequal to that of cheaper cells, and the costs of changing or updating the battery when it isplaced in the vehicle will decrease, since fewer batteries will be needed. Therefore it is clearthat large gains can be found in improving the life-length, and the added production costs mustbe viewed in light of this.
5.1.2 Impact categories of the cell components
To achieve a full assessment of the impact of the different production methods and theircorresponding precursors, it is not enough just to look at the energy consumption. This sincedifferent precursors can be used, with more or less environmental impact.
The most illustrative results for the impact categories are presented in figure 5.4. Theimpact of the different components, for all impact categories, can be viewed in figure A.1. Theelectrodes dominate all of the impact categories, albeit to a varying degree, and will be brokendown and discussed further. For reference it can be stated that the total GWP of 6-7 kg CO2
equivalents for the cell is in line with other bottom up LCA results. Notter et al. [2010] havefor example stated a 6 kg CO2 equivalents use per kg of cell.
78

CHAPTER 5. RESULTS
Figure 5.4: The impact of the different components of the different cell chemistries is shown. The impact
categories represented are energy use, global warming potential, abiotic depletion potential of elements
and fossil fuels, acidification potential, eutrophication potential, human toxicity potential, photochemical
ozone creation potential. The electrodes can be seen to have the largest single impact.
Looking at the supporting components, the electrolyte has most of its impact linked to theacidification potential (AP) and abiotic depletion potential (ADP) of elements, but can be foundto impact all categories. The ADP is linked in equal amounts both to the carbonate solventand the precursors for the salt, which is also the distribution of impact for all the categories.The acidification comes mainly from the possible chloride emissions from the salt production,modeled as stoichiometric amounts of HCl. Improvement to the electrolyte can clearly be ofinterest, since it impacts all categories, and this could possibly be done by switching to materialswith less impact than the currently involved carbonates and salts.
The separator has a very small impact, mostly linked to the use of fossil fuel for plasticproduction. This makes the main impact categories for this component global warming potential(GWP) and ADP of fossils. As with the energy consumption, the main impact from the casingis from the use of aluminium, giving it a slightly higher impact in the human toxicity potential(HTP) and GWP compared to other impacts. For HTP aluminium stands for 99% of theimpact of the casing and for the AP for around 97%. In all other impact categories the impactof aluminium is closer to 90% of the casing impact, comparable with the energy percentage. Thecell assembly mostly involves the use of energy and therefore impacts the categories coupledto fossil fuel use, GWP and ADP of fossils. Generally, as for the energy consumption, theimpact of the passive components comes from the use of aluminium in the casing and from thematerials in the electrolyte. These results are in line with previous studies, indicating that thesupporting materials does not contribute greatly to the energy consumption or GWP [Dunn,Gaines, Sullivan & Wang 2012] [Notter et al. 2010].
Impact categories of the electrode components
The positive electrode dominates all impact categories, except for the abiotic depletion potentialof elements. Here the copper in the negative graphite electrodes makes this component a keyimpact. This illustrates the scarcity issues, and possible gain of using aluminium foils insteadof copper, although the energy impact of aluminium is greater. Beside the impact of the copperon the ADP of elements, the negative electrode contributes to ADP of fossils and GWP aswell. Here the impact is shared by the copper foil and the graphite production. The negativeelectrode can also be seen to impact photochemical ozone creation potential (POCP) to some
79
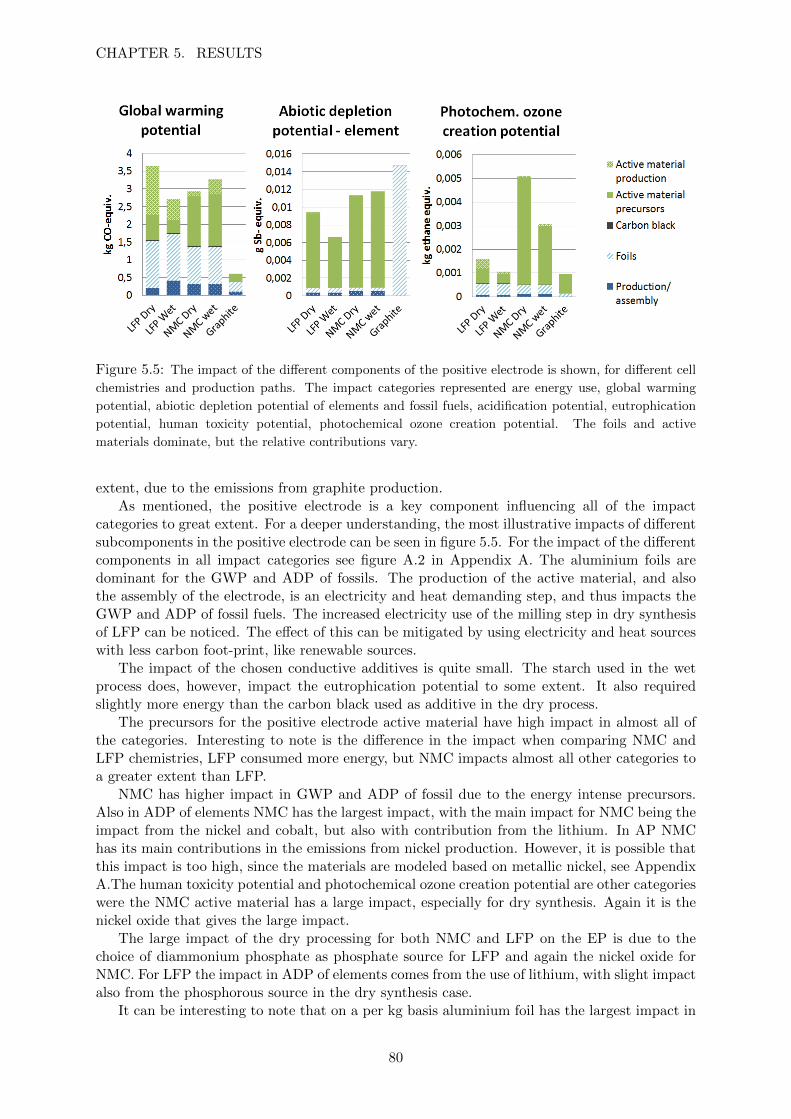
CHAPTER 5. RESULTS
Figure 5.5: The impact of the different components of the positive electrode is shown, for different cell
chemistries and production paths. The impact categories represented are energy use, global warming
potential, abiotic depletion potential of elements and fossil fuels, acidification potential, eutrophication
potential, human toxicity potential, photochemical ozone creation potential. The foils and active
materials dominate, but the relative contributions vary.
extent, due to the emissions from graphite production.As mentioned, the positive electrode is a key component influencing all of the impact
categories to great extent. For a deeper understanding, the most illustrative impacts of differentsubcomponents in the positive electrode can be seen in figure 5.5. For the impact of the differentcomponents in all impact categories see figure A.2 in Appendix A. The aluminium foils aredominant for the GWP and ADP of fossils. The production of the active material, and alsothe assembly of the electrode, is an electricity and heat demanding step, and thus impacts theGWP and ADP of fossil fuels. The increased electricity use of the milling step in dry synthesisof LFP can be noticed. The effect of this can be mitigated by using electricity and heat sourceswith less carbon foot-print, like renewable sources.
The impact of the chosen conductive additives is quite small. The starch used in the wetprocess does, however, impact the eutrophication potential to some extent. It also requiredslightly more energy than the carbon black used as additive in the dry process.
The precursors for the positive electrode active material have high impact in almost all ofthe categories. Interesting to note is the difference in the impact when comparing NMC andLFP chemistries, LFP consumed more energy, but NMC impacts almost all other categories toa greater extent than LFP.
NMC has higher impact in GWP and ADP of fossil due to the energy intense precursors.Also in ADP of elements NMC has the largest impact, with the main impact for NMC being theimpact from the nickel and cobalt, but also with contribution from the lithium. In AP NMChas its main contributions in the emissions from nickel production. However, it is possible thatthis impact is too high, since the materials are modeled based on metallic nickel, see AppendixA.The human toxicity potential and photochemical ozone creation potential are other categorieswere the NMC active material has a large impact, especially for dry synthesis. Again it is thenickel oxide that gives the large impact.
The large impact of the dry processing for both NMC and LFP on the EP is due to thechoice of diammonium phosphate as phosphate source for LFP and again the nickel oxide forNMC. For LFP the impact in ADP of elements comes from the use of lithium, with slight impactalso from the phosphorous source in the dry synthesis case.
It can be interesting to note that on a per kg basis aluminium foil has the largest impact in
80

CHAPTER 5. RESULTS
the GWP and ADP of fossils categories while copper only influences ADP of elements. Nickeland cobalt impact both GWP and ADP of both fossil and elements. Nickel has a large impactalso in AP, EP, HTP and POCP.
It is clear that there can be interesting conclusion drawn from looking at the impactcategories, since they illustrate the benefits of choosing common and non-toxic elements. Whilethe energy use for LFP and NMC cells are similar, favoring NMC, the impact of using LFP issmaller for virtually all impact categories assessed in this report. This conclusion is validatedby previous similar studies, comparing NMC and LFP [Majeau-Bettez et al. 2011].
Improvements when using LiMnPO4 and Li2FeSiO4
The impacts if LFS and LMP are not presented in detail, since they are modeled in muchthe same ways as LFP, with the main differences in the active material precursors. Therefore,a comparison with the impact of the LFP components are more interesting. For graphicalrepresentation see figure A.3 in Appendix A.
Using the high capacity LFS leads to a need for less active material in general. Due tothis, the impact of the materials is lower for LFS compared to LFP, although the synthesismay be similar. However, due to the lower density of LFS, and since the coating thickness iskept equal, the amount of inactive material is increased. As mentioned earlier the aluminiumis the greatest factor of the inactive components of the electrode and hence an increase inaluminium will impact all categories. Regardless, a switch to LFS could in total be potentiallybeneficial, due to the lowered amount of active material. The impact of silica compared to anyphosphorous source is also beneficial since silica has virtually no impact in any category. If thecoating thickness can be made thicker, this would decrease the impact of the foils and otherpassive components, limiting this increase.
LMP and LFP were modeled as having equal production paths. Acquiring manganeseprecursors could require slightly more energy, giving this material a higher impact. However,the higher voltage gives reason to assume that this increase can be outweighed by performance,although this is not shown quantitatively. In the case modeled in this report, the main changebetween the LFP and LMP is not in the active positive material, but rather in the anodematerial.
Impact when using graphite versus Li4Ti5O12
Focusing on the impact of the anode, the graphite anode is a minor component in most impactcategories. The copper foil does however make it a key component in the ADP of elements.The active material in the electrode, graphite, has similar impact as for example LFP in HTPand POCP, but no impact from the foil. In all other categories the impact is smaller than thatof the cathode active materials.
The LTO anode has been evaluated in comparison with the graphite one. When the impactis normalized by available cycles (3000 for graphite and 10000 for LTO), LTO shows a doubledimpact in most categories, see figure 5.6. The main difference is the decreased ADP of elementsachieved when changing the foil to aluminium. The graphite material also impacts the POCP,and this impact is reduced with LTO. However, there is a general increase in impact even whennormalized by the cycles, and this is an indication that other aspects than energy use must betaken into account when switching to LTO. One explanation to the increased impact of LTOis the fact that more mass of active material is needed per kg of cell, since LTO has a lowercapacity than graphite, 170 mAh/g compared to 330 mAh/g for graphite.
81

CHAPTER 5. RESULTS
Figure 5.6: The relative impact of the different component of 1kg of graphite and LTO anodes are
presented. For most impact categories the red LTO has a greater impact, most likely due to the need
for more active material. Graphite has high impact on the ADP of elements due to the use of copper.
5.1.3 Applying weighting methods
The impact of different cell components can also be viewed in light of a weighting method,where all impact categories are summed into one impact value. This can give an insight intothe effects of all the impact categories, depending on what your focus is. The two weightingmethods, EPS and EI99, where presented in section 2.2.
Figure 5.7 shows two different ways of summing the impacts. EPS puts high penalty onthe use of EU-27 electricity, since this mix includes hard coal and lignite with large ELU/MJ,and therefore LFP produced with dry synthesis has a high impact due to the electricity usedfor milling the material. The NMC precursors give slightly higher impact compared to LFPprecursors, but also here it is the electricity that contributes most. It should also be notedthat aluminium foil has a large impact on EPS score, due to its production with hard coal andlignite energy sources.
Looking at the EPS score for wet synthesis, the LFP material is beneficial compared toNMC, but this result is balanced by the need for more passive material in the cell, due to thelower density of LFP. This leads to the need for more aluminium, which in turn gives a highEPS score. LFP with wet synthesis is however more comparable to the results of NMC, withthe main contribution from the foil. The cell casing also impacts in this weighting, since itcontains aluminium. The anode graphite, and the electrolyte impact very little.
Looking instead at the results from the EI99 weighting the different chemistry alternativesare more equal. For NMC, dry is more beneficial since the wet process uses more energy, andmost importantly uses chemicals like ammonia to produce the precursors. This even thoughthe precursors themselves have a larger impact when using dry processing. Due to the dryprecursors being modeled from metals this difference might be even larger. In general, higherenergy use both from electricity and heat have a great impact on this weighting method. Again,the wet processed LFP active material has less impact than NMC, but this is compensated bythe need for more passive material. The more simple precursors of LFP dry now give a largerbenefit since EU-27 electricity and natural gas heat are more equally weighted. Compared toNMC it is, however, the larger total use of energy that makes the weighted result for LFP worsefor both production paths.
Both weighting methods emphasize the importance of considering the energy consumption.Depending on how different energy sources, like natural gas or coal based sources, are valueddifferent materials will have more or less weighted impact. Depending on where focus is placed,
82

CHAPTER 5. RESULTS
(a) EPS weight. (b) EI99 weight.
Figure 5.7: Summed total impact of all categories, with different weight methods applied. Both results
for the EPS and EI99 methods are shown. In EPS, LFP dry is clearly less beneficial. In EI99, the
different chemistries and production paths are more equal.
the fact that NMC has higher impact than LFP in basically all impact categories becomes moreor less important. In the weighting methods discussed above the larger energy consumption ofLFP makes the NMC favorable. For production this is a guide that will optimize the productioncost today. On the other hand, it is possible that this choice would not be sustainable over alonger period of years.
5.1.4 Implications for future chemistries
Looking into specific examples of future chemistry candidates, the results from the Li-ionchemistries can suggest some implications for other chemistries as well. Since the electrodeactive material plays a large role, and since the amount of inactive materials could be decreased,Li-S could be one technology largely beneficial for environmental impact.
Additionally, the impact on some of the categories can be decreased when going from metalbased cathodes with costly precursors to simple and cheap sulfur. Further evaluation on eachcategory would be needed to assess this in detail, especially to evaluate the impact of sulfur. Itshould be noted that if Li-S is shown to require a supporting structure of some sort, this couldincrease the weight and therefore impact the gravimetric energy and power density, as well asadding energy consuming materials to the process.
Na-ion as an alternative would most likely not influence the impacts of the cell to greatextent, since the impact of lithium is such a small component. The increased weight of usingNa-ion could instead impact the use phase negatively and using more aluminium would increasethe energy need, since this foil type was shown to have greater impact than copper foil. Mostlikely it would be the economic benefits of using Na-ion chemistries that would guide towardsthe implementation of this type, and this is of course in practice a factor of great importance.It should also be taken into consideration that the need for other anode materials than graphitemight impact the life cycle.
Since the active materials, and the electrodes in general have such a large impact, organicbased cells or electrodes could present large improvements to the impact of the cell. If theneed to use foils can be reduced this would be an added benefit. If organic electrodes wouldbe possible would become more important to assess other components in the cell apart fromthe electrodes. Organic electrodes could potentially be easier to recycle, however, the decreased
83
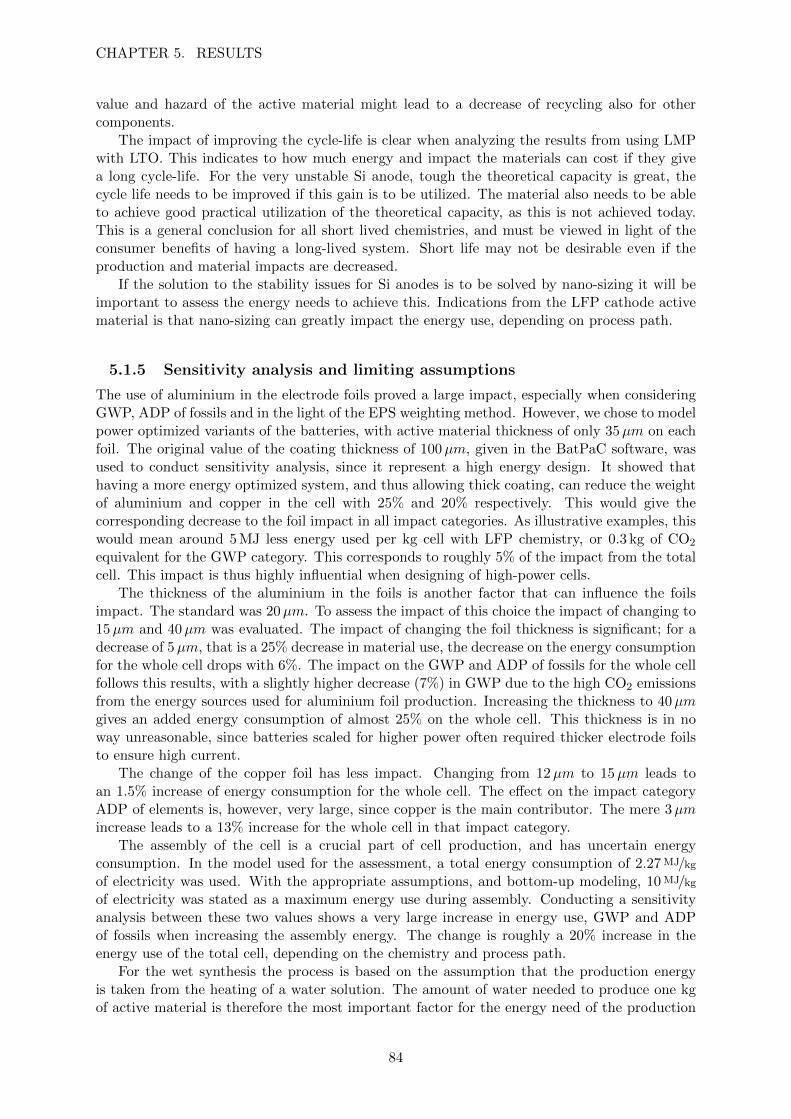
CHAPTER 5. RESULTS
value and hazard of the active material might lead to a decrease of recycling also for othercomponents.
The impact of improving the cycle-life is clear when analyzing the results from using LMPwith LTO. This indicates to how much energy and impact the materials can cost if they givea long cycle-life. For the very unstable Si anode, tough the theoretical capacity is great, thecycle life needs to be improved if this gain is to be utilized. The material also needs to be ableto achieve good practical utilization of the theoretical capacity, as this is not achieved today.This is a general conclusion for all short lived chemistries, and must be viewed in light of theconsumer benefits of having a long-lived system. Short life may not be desirable even if theproduction and material impacts are decreased.
If the solution to the stability issues for Si anodes is to be solved by nano-sizing it will beimportant to assess the energy needs to achieve this. Indications from the LFP cathode activematerial is that nano-sizing can greatly impact the energy use, depending on process path.
5.1.5 Sensitivity analysis and limiting assumptions
The use of aluminium in the electrode foils proved a large impact, especially when consideringGWP, ADP of fossils and in the light of the EPS weighting method. However, we chose to modelpower optimized variants of the batteries, with active material thickness of only 35µm on eachfoil. The original value of the coating thickness of 100µm, given in the BatPaC software, wasused to conduct sensitivity analysis, since it represent a high energy design. It showed thathaving a more energy optimized system, and thus allowing thick coating, can reduce the weightof aluminium and copper in the cell with 25% and 20% respectively. This would give thecorresponding decrease to the foil impact in all impact categories. As illustrative examples, thiswould mean around 5 MJ less energy used per kg cell with LFP chemistry, or 0.3 kg of CO2
equivalent for the GWP category. This corresponds to roughly 5% of the impact from the totalcell. This impact is thus highly influential when designing of high-power cells.
The thickness of the aluminium in the foils is another factor that can influence the foilsimpact. The standard was 20µm. To assess the impact of this choice the impact of changing to15µm and 40µm was evaluated. The impact of changing the foil thickness is significant; for adecrease of 5µm, that is a 25% decrease in material use, the decrease on the energy consumptionfor the whole cell drops with 6%. The impact on the GWP and ADP of fossils for the whole cellfollows this results, with a slightly higher decrease (7%) in GWP due to the high CO2 emissionsfrom the energy sources used for aluminium foil production. Increasing the thickness to 40µmgives an added energy consumption of almost 25% on the whole cell. This thickness is in noway unreasonable, since batteries scaled for higher power often required thicker electrode foilsto ensure high current.
The change of the copper foil has less impact. Changing from 12µm to 15µm leads toan 1.5% increase of energy consumption for the whole cell. The effect on the impact categoryADP of elements is, however, very large, since copper is the main contributor. The mere 3µmincrease leads to a 13% increase for the whole cell in that impact category.
The assembly of the cell is a crucial part of cell production, and has uncertain energyconsumption. In the model used for the assessment, a total energy consumption of 2.27 MJ/kgof electricity was used. With the appropriate assumptions, and bottom-up modeling, 10 MJ/kgof electricity was stated as a maximum energy use during assembly. Conducting a sensitivityanalysis between these two values shows a very large increase in energy use, GWP and ADPof fossils when increasing the assembly energy. The change is roughly a 20% increase in theenergy use of the total cell, depending on the chemistry and process path.
For the wet synthesis the process is based on the assumption that the production energyis taken from the heating of a water solution. The amount of water needed to produce one kgof active material is therefore the most important factor for the energy need of the production
84

CHAPTER 5. RESULTS
step. It is possible that the water amount can vary greatly depending on chemistry. AssessingLFP, a 50% decrease of the water amount decreases the total energy consumption of the totalcell production by 7%.
For LFP, LMP and LFS a conductive additive is assumed to be added to the active materialduring production. The type of material can affect the impact of the active material. Usingstarch, as in wet production, has a larger impact than the acetylene black used in the dryproduction. However, a 25% increase of the starch in the wet case only increases the energyconsumption with 1%. Better knowledge concerning the precise type of additive needed, andthe amounts that are required at large scale production, would improve the assessment.
Where the production of parts or constituent was kept to a general case the electricity mixused for cell production was EU-27, containing larger amount of coal-based sources than forexample a Swedish mix. The effects of changing to a more carbon free electricity will influencethe production of the materials and cell assembly, in particular the dry production of LFP,LMP and LFS since these use much electricity for milling. In the EPS weight this would meanthat all the materials and production paths would have equal impact. In the impact categoriesit would mainly mean a decreased GWP and ADP of fossil. Choosing a more carbon intenseelectricity mix would instead increase the impact. In light of the electricity choice it should alsobe noted that all heating is assumed to be from natural gas.
In the LCA of the cell the yield for the active material production is assumed to be 100%. Totest the impact of this assumption, the yield was changed to 95% [Majeau-Bettez et al. 2011].Looking at LFP produced via wet path and NMC via dry, the energy consumption goes upwith around 1.5%, thus not greatly impacting the end result. The effect is slightly higher in theimpact categories where the cathode active materials dominates to greater extent.
For the production, only the effects of the precursors were analyzed. The emission of forexample CO2 from reaction balances were not included. This would mainly effect the impact ofthe dry production since the heating of the lithium carbonate precursor would lead to emissionof CO2 further worsening the GWP. The wet production would only lead to some sulfur basedemission to water that are more likely to be handled, albeit with a slight energy cost.
Exclusion of the transportation may not contribute greatly to the energy use, but may shiftthe relative contributions of the different components. This depending on how high the impactof transportation is on that particular production part. This assumption should not be keptif site specific data are available for a certain battery or component. The 1% impact of thetransport to the total gross energy demand [Rydh & Sanden 2005] is not equally distributedover components.
5.2 Battery pack and modularization impacts
The degree of modularization has been identified as an important parameter for safety and forthe amount of passive materials in the pack. From an organizational point of view the modularitycould enable reuse and facilitate the testing before a possible second life. Additionally for thesake of reducing the production costs the module size should fit multiple applications as statedin chapter 3. For the scenarios of selected modularization and sensitivity analysis of PCB, packsize and reuse, the cradle to gate results will be presented for the whole pack of NMC andLFP chemistry. The impact categories of focus are ADP elements and embodied energy (netcalorific value) since they were found representative, and have shown the greatest changes inthe different scenarios, while other impact categories are similar or less sensitive to the differentdesigns. The complete set of results in all impact categories can be found in Appendix A.
’
85

CHAPTER 5. RESULTS
Figure 5.8: NMC and LFP pack cradle to gate impacts per component for different standard design
alternatives and various extra scenarios represented by the categories energy and ADP. In (a)-(b) is
shown a comparison between LFP and NMC standard designs. In (c)-(d) are found LFP extra design
scenarios of reuse, pack size, 2 packs replacing one and extra PCB. In (e)-(f) the effects of NMC extra
scenarios of added cooling plates, and module string parallel connection are shown.
86

CHAPTER 5. RESULTS
Table 5.1: Total and normalized values for the energy and ADP elements impacts of the NMC and LFP
packs, cradle to gate.
Impact LFP pack NMC pack
Energy (MJ) 47858 51860MJ/kg pack 84.3 88.4kg Sb-equiv. 0.0306 0.0301kg Sb-equiv. /kg pack 5.39E-05 5.14E-05
Impacts of standard designs and chemistry
The four standard designs presented in the inventory are here evaluated in terms of ADPelements and embodied energy for the NMC and LFP pack. As a first result, the NMC packand the LFP pack show to have little difference in impacts both in the embodied energy, and inthe ADP elements (figure 5.8 (a) - (b) ). For the LFP pack, the maximum of 48 GJ embodiedenergy, 84 MJ/kg is very similar to the NMC pack with a maximum of 52 GJ and 88 MJ/kg.The results are not too far from the ones found in [Dunn, Gaines, Sullivan & Wang 2012] of 75MJ/kg for the BatPaC model taking into account the medium high rate of modularization. Forboth packs the cells are dominant of 50% or more in the scenarios in which no reuse of cells isassumed, in all categories except HTP and ADP, where the steel casing has high importance.
Regarding the evaluated standard design choices, design 1-4, it is seen that on an energy basisthey are all similar, except from design 1 which is higher due to the contribution of the thermalinsulation here (PU). Supposing that this insulation would be removed, the energy impact forall the four standard designs would be almost equal (figure 5.8 (a)). For the different standarddesigns only the housing structure is changed in terms of materials, which is a contributingfactor to the similar impacts.
For the ADP elements the clear advantage is given by design 1, since aluminium and PUdo not contribute much to the mineral resource depletion. Instead the steel housings in design2 contribute to high extent to the ADP elements impact (figure 5.8 (b)). This is because ofadditive metals such as the chromium and nickel present in the stainless steel. A steel alloywith fewer amounts of those components would have lower impact. The module housing ofplastic (PP) and aluminium in design 3-4 have almost no contribution to the ADP elementscategory, while the added steel pressure plates in design 4 increases the impact (figure 5.8 (b)).To conclude the best designs from an energy point of view are design 2-4, the best one in ADPelements is design 1 which at the same time is the worst case for the energy. The worst case forADP elements is design 2 due to the chromium steel. The designs 3 and 4 are medium goodchoices in both categories.
The ADP elements impacts are dominated by copper, BMS and stainless steel. Somedifference in the amount of copper connects can be seen between the LFP pack and the NMCpack because of the different voltages of the modules, the NMC module being of higher voltagethan the LFP module. For the stainless steel, NMC has a higher contribution due to its higheramount of housing materials deriving from the slightly larger cells (figure 5.8 (b)). On the otherhand the energy category is dominated by the cells, making the design choices less importantfor the total impact.
Looking more at the passive pack materials, the actual composition of the plastics used forthe housing could be evaluated further. A more resistant engineering plastic such as polycar-bonate could possibly reduce the need for extra steel compression plates and reinforcementsin the pack, meaning that the total cost, weight and environmental impact possibly could bereduced. The pressurizing plates of steel and steel straps are assumed to have always the samethickness. In reality the thickness could be adapted to the amount of cells in rows and inrelation to the swelling of the cells, which means that the results may look different dependingon the modularization. For a further improvement of the modeling of the insulation, the type
87

CHAPTER 5. RESULTS
of insulation plastic should be determined, since for example the ADP elements may vary quitemuch depending on the type of foam used.
Impacts of alternative designs
Having seen the trends for the impacts related to housing materials and chemistry, somealternative designs are considered for the component set up of design 1, comparing with thestandard design 1 as a reference, for NMC or LFP chemistry with the impact propertiesdescribed in table 5.1.
The reuse of the passive pack components set at a maximum rate enables the reduction ofthe total cradle to gate impact of the LFP pack by 22% in the energy category and by 57%in the ADP elements (figure 5.8 (c)-(d)) thanks to the minimized extraction of control systemmaterials and copper and housings. The reuse of passive components is a relatively easy wayto reduce the impacts of the whole pack. The adoption of reuse of different passive componentsneed not be complicated on a technical level, but the logistics and organizational channelsshould be studied to see at what cost reuse is feasible and at what rate. Reuse is perhapsmore viable than second life since it can be made at various component levels and within thesame organization. The knowledge about remanufacturing and the legal permission to openand refurbish the modules will be needed. At present the manufacturer of the battery does notallow the vehicle manufacturer to open the modules which makes the reuse difficult.
The cell reuse is a more distant solution, with its requirements for advanced qualificationof old cells. However from the assumption of 40% reused cells, a result of 25% reduction ofenergy, and 12% reduction of ADP elements is achieved. The total impact reduction is inferiorto the one of the passive pack reuse. To arrive to a rate of 40% cell yield may be difficult inpractice and so this result may be considered optimistic (figure 5.8 (c)-(d)). Making use ofthe reuse concept to a maximum extent, in the case of both passive pack materials reuse andcell reuse, the impact reduction can reach 47% for the energy- to a total net calorific value of44.5 MJ/kg pack and 59% for the ADP elements 2.2E-05 kg Sb eq./kg pack. This reduction could beseen as a target for the battery life management (figure 5.8 (c)-(d)).
A sensitivity analyses was done by exchanging the normal PCB unit with a type of higherpercentage of gold. The difference on the energy was minimal while for the ADP elements theimpact was increased by 42% (figure 5.8 (c)-(d)) showing the importance of choosing the controlunits carefully. Since the SOC controllers and BMS are components subdued to little wear andaging during the battery life, reuse should be an aim, or recycling of the gold and other raremetals, in order to mitigate the impacts.
For the purpose of using one pack size for both NMC cells and LFP cells, the LFP packwill be oversized, and the related impacts are increased by about 9% (figure 5.8 (c)-(d)) both inenergy and ADP elements giving an idea of the costs of interoperability from a material pointof view. The result is highly dependent on the difference in dimension of the cells; here theNMC cells are considered 20 v% larger than the LFP cells.
For the special design of the two small packs in one, almost the double of control units isadded to make the singular packs autonomous, and extra housing materials are needed. Theenergy impact is increased by marginal 4%, while the ADP elements impact is increased by27% (figure 5.8 (c)-(d)). If this set up will be needed, it is recommended to perform reuse ofthe electronics and control system to minimize the impacts.
In some cases when the choice can be made to place the control units independently outsidethe packs, the amount of control units required may not be as high. The impact of the ‘twopacks’ scenario thus depends on the alternatives of placement of the BMS.
For the interoperability of modules, it can become necessary to make a compromise in thecell interconnection, and go from three cell strings in parallel to three modules in parallel.The effects of this configuration with higher amount of SOC controllers are seen in the ADPelements, sensitive to the amount of electronics, by an increase of 12% (figure 5.8 (e)-(f)). .
88
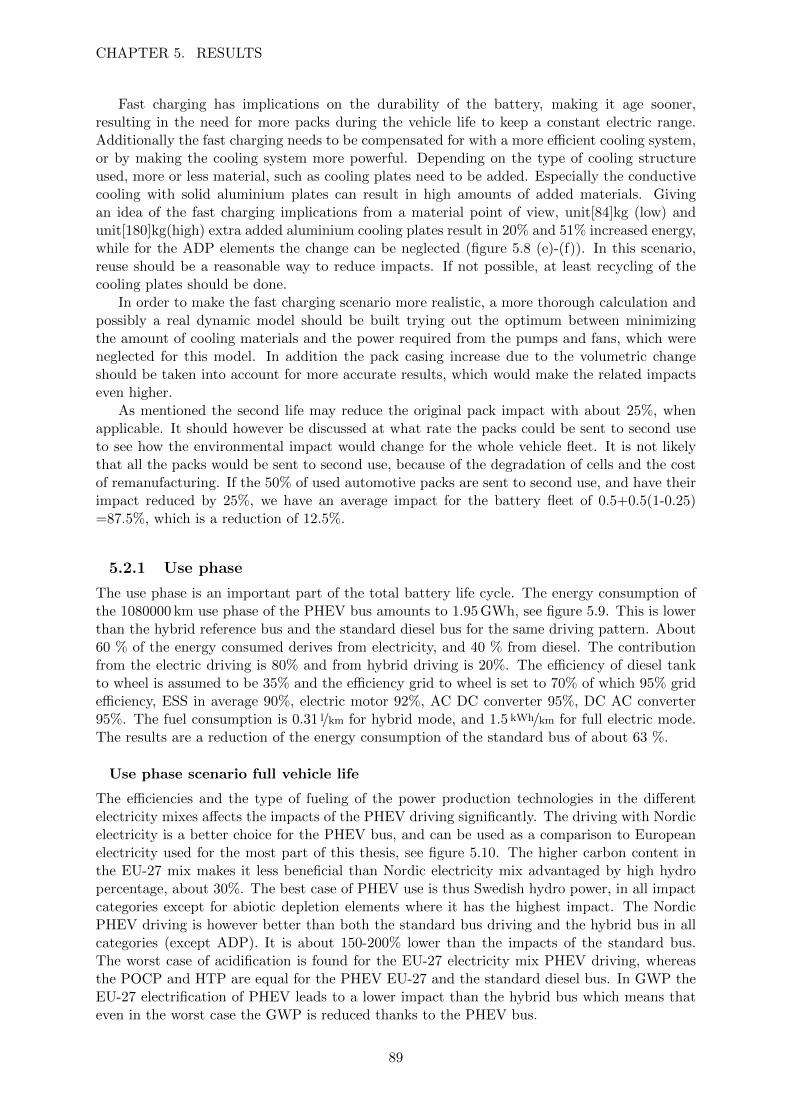
CHAPTER 5. RESULTS
Fast charging has implications on the durability of the battery, making it age sooner,resulting in the need for more packs during the vehicle life to keep a constant electric range.Additionally the fast charging needs to be compensated for with a more efficient cooling system,or by making the cooling system more powerful. Depending on the type of cooling structureused, more or less material, such as cooling plates need to be added. Especially the conductivecooling with solid aluminium plates can result in high amounts of added materials. Givingan idea of the fast charging implications from a material point of view, unit[84]kg (low) andunit[180]kg(high) extra added aluminium cooling plates result in 20% and 51% increased energy,while for the ADP elements the change can be neglected (figure 5.8 (e)-(f)). In this scenario,reuse should be a reasonable way to reduce impacts. If not possible, at least recycling of thecooling plates should be done.
In order to make the fast charging scenario more realistic, a more thorough calculation andpossibly a real dynamic model should be built trying out the optimum between minimizingthe amount of cooling materials and the power required from the pumps and fans, which wereneglected for this model. In addition the pack casing increase due to the volumetric changeshould be taken into account for more accurate results, which would make the related impactseven higher.
As mentioned the second life may reduce the original pack impact with about 25%, whenapplicable. It should however be discussed at what rate the packs could be sent to second useto see how the environmental impact would change for the whole vehicle fleet. It is not likelythat all the packs would be sent to second use, because of the degradation of cells and the costof remanufacturing. If the 50% of used automotive packs are sent to second use, and have theirimpact reduced by 25%, we have an average impact for the battery fleet of 0.5+0.5(1-0.25)=87.5%, which is a reduction of 12.5%.
5.2.1 Use phase
The use phase is an important part of the total battery life cycle. The energy consumption ofthe 1080000 km use phase of the PHEV bus amounts to 1.95 GWh, see figure 5.9. This is lowerthan the hybrid reference bus and the standard diesel bus for the same driving pattern. About60 % of the energy consumed derives from electricity, and 40 % from diesel. The contributionfrom the electric driving is 80% and from hybrid driving is 20%. The efficiency of diesel tankto wheel is assumed to be 35% and the efficiency grid to wheel is set to 70% of which 95% gridefficiency, ESS in average 90%, electric motor 92%, AC DC converter 95%, DC AC converter95%. The fuel consumption is 0.31 l/km for hybrid mode, and 1.5 kWh/km for full electric mode.The results are a reduction of the energy consumption of the standard bus of about 63 %.
Use phase scenario full vehicle life
The efficiencies and the type of fueling of the power production technologies in the differentelectricity mixes affects the impacts of the PHEV driving significantly. The driving with Nordicelectricity is a better choice for the PHEV bus, and can be used as a comparison to Europeanelectricity used for the most part of this thesis, see figure 5.10. The higher carbon content inthe EU-27 mix makes it less beneficial than Nordic electricity mix advantaged by high hydropercentage, about 30%. The best case of PHEV use is thus Swedish hydro power, in all impactcategories except for abiotic depletion elements where it has the highest impact. The NordicPHEV driving is however better than both the standard bus driving and the hybrid bus in allcategories (except ADP). It is about 150-200% lower than the impacts of the standard bus.The worst case of acidification is found for the EU-27 electricity mix PHEV driving, whereasthe POCP and HTP are equal for the PHEV EU-27 and the standard diesel bus. In GWP theEU-27 electrification of PHEV leads to a lower impact than the hybrid bus which means thateven in the worst case the GWP is reduced thanks to the PHEV bus.
89

CHAPTER 5. RESULTS
Figure 5.9: Energy supply Tank to wheel and Battery to wheel, during the whole use phase of the
vehicle life for PHEV bus and reference standard (conventional) bus and hybrid bus, for the assumption
of 80% electric mode and 20% hybrid mode for the PHEV bus.
Comparing the energy needed to produce the battery pack with the energy consumed duringthe use phase, it is seen that the battery with its around 50 GJ embodied energy is about 160 to320 times smaller than the use phase of between 8 TJ to 16 TJ (figure 5.10, 5.8 (a)) dependingon electricity mix. The number of batteries consumed during the vehicle life should be takeninto account when comparing use phase with batteries produced. For the selected battery packs,a life of three years is assumed, thus only a third of the 9 years energy consumption may berelated to each battery.
An important comment to the results is that the electricity is assumed to be averages forthe selected regions. If instead marginal electricity would have been applied, the results couldlook different. The worst case Nordic marginal electricity would be similar or worse than theEuropean average. The marginal electricity concept implies that the next unit of electricitysupply in the merit order often is coal and natural gas depending on the time of the day andthe period of the year. Hydro power and nuclear power are normally used to full extent duringthe day since their variable production costs are low. Adding the PHEV bus charging to thisload during the day, would call in marginal extra production of for example coal condensingpower. In an international grid perspective, the difficulty comes in identifying from where thecharged electricity comes, since the grid includes many different producers in different nations.The last consideration in terms of electricity supply is the scenario of a large fleet of PHEVvehicles which, depending on the control strategies and time scheduling for the charging, couldincrease the total need for electricity supply within a region, as has been shown in a model forthe city of Gothenburg [Steen 2012]. This means that the introduction of a large PHEV fleetcan solicit to install new power production services. The consequence and the allocation of sucha new installed power capacity to the grid need to be further investigated.
In order to make more precise assumptions about the electricity use, the recommendation isto make a model of the scheduled charging of the PHEV bus, compare it to the real timeelectricity production data of the specific area of vehicle operation and extract the actualtechnologies for the power supply. In this way both the exact electricity mix can be retrievedand the need for extra installed power supply capacity can be determined.
In the electrified drive line the conversion efficiency of the electricity to traction is of greatimportance to achieve the environmental gain. Adding the efficiency degrading of the batteryto the evaluation could determine the point at which the full electric driving is beneficial. Infact the electric mode will lead to a reduced impact compared to the ICE mode only whenthe conversion efficiency of well to power plant to grid to wheel is better than the conversionefficiency of the diesel engine. Depending on the assumed electricity technology assumed and
90

CHAPTER 5. RESULTS
Figure 5.10: Impacts in various categories for the use phase of the PHEV bus well to wheel, 9 years,
with different electricity mixes, compared to reference standard (conventional) bus and hybrid bus, for
the assumption of 80% electric mode and 20% hybrid mode for the PHEV bus.
91

CHAPTER 5. RESULTS
Figure 5.11: The energy consumption increase in relation to added weight on the vehicle for 2%and 7%
diesel consumption increase per tonne added weight and proportionally increased electricity consumption.
its fossil fuel content, the allocation of marginal or average electricity the outcome could differ.
The battery weight contribution to the fuel consumption is marginal compared to the totalelectricity supply and diesel supply during the life phase. The increase in diesel consumption isset to a minimum of 2% per added 1000 kg extra weight and of maximum 7% per tonne extraweight. The electricity consumption increase is proportional to the relative increase in weightof the whole vehicle see figure 5.11. If the battery pack leads to an increase in the minimumvehicle weight, the best case scenario is that the fuel consumption is increased, and there is amarginally higher life cost of the vehicle. Considering an increased weight of 500 kg leading toa total energy consumption increase of 3%, the marginal change in fuel consumption is 663 ldiesel and 52000 kWh electricity.
In the same way an increase of 1000 kg leads to an increase of 7-8% energy consumption asa best case. If instead the battery weight is added on the max loaded vehicle, the number ofpassengers allowed on the bus must be reduced to stay within the vehicle weight limits. This isthe worst case scenario since a the service of the vehicle is reduced, and more buses are neededto cover the service for the number of passengers on the line. Adding 500 kg corresponds toa reduction of 7 passengers of 75 kg, 12% lost passenger capacity on a bus with 60 passengersand 12% more buses needed in the fleet to cover the function of a conventional bus. Similarlyadded 300 kg means 4 passengers or 7% lost capacity. In figure 5.11 the increase in energyconsumption is illustrated. From increases of 20 kg that are the possible impacts of changes inmodularization and to those of 500 kg that are the ones of over dimensioning in battery energystorage capacity or in the amount of cooling plates. The proportion of the energy consumptionallocated to battery weight during driving and the embodied energy of the battery pack are ofthe same magnitude, assuming a fuel consumption increase of 2% to 7% the relative impactsare shown in figure 5.12.
For future evaluation of the use phase, it could be interesting to compare the impacts perperson and distance for the PHEV bus with a PHEV car. In particular the embodied energyof the battery compared to the energy saved during the use phase should be interesting to see.
92

CHAPTER 5. RESULTS
Figure 5.12: The energy consumption increase in relation to added battery weight on the vehicle and
compared to the embodied energy in the battery pack. 2% diesel consumption increase per tonne added
weight, set into relation with the total fuel and electricity that have been used during the ESS life in the
vehicle. N.B. Scaled total original energy consumption by a factor of 0.1.
5.3 Pack life cycle
The total life cycle has been modeled for LFP with assumed reuse and recycle rates see 4.11 and4.10. The results in figure 5.13 and 5.14, show that the reuse of passive components can reducethe total impact significantly. The use phase with the contribution of the electricity and dieselfrom carrying the pack has higher impact than the pack production phase in Energy, ADP fossiland GWP. For these impacts the reduction of the weight of the battery or the elimination ofother components in the drive line could improve the total impact. The cells have the highestimpact in POCP, AP and EP. The ADP elements impact can be improved by reusing packcomponents such as BMS. In AP the reuse of pack components could mitigate the use phaseenergy consumption.
Second life scenarios
The assessment of second life should be further investigated, with more exact data for the yieldof functional batteries after first use, and calculations on the second life impacts for differentoptions of applications. An evaluation of a new battery used in a stationary application couldbe beneficial; to determine the possible energy gain from the second life service. This shouldthen be the reference to compare the impact of the refurbished vehicle batteries. Due to thebattery weight the location of the second life application could be important due to possibleemissions from transporting the used battery packs. The degree at which the transport factorinfluences the total impact of second life could imply constraints on the possible second lifemarkets.
Going towards possible second life applications a standardized method for testing anddiagnosing of the batteries should be established. It could also be of interest to investigatewhether there are differences in diagnosing and testing of PHEV bus batteries and PHEV carbatteries, and to determine whether one of them is be more suitable for second life, from botha cost perspective and a performance perspective.
For future batteries, the initial design of the cell properties could be made to supportthe automotive use followed by the second life stationary application. The hot-spots in therequirements for such secondary applications should be identified. The case may be that power
93

CHAPTER 5. RESULTS
Figure 5.13: The aggregated results from production of cells and pack materials with use phase, reuse
and recycling for LFP . The production is compared to the use phase with 7% diesel consumption increase
per ton added weight and proportionally increased electricity consumption for 300 kg added weight due
to the battery pack. The unit is per passenger and kWh electricity charged from grid to battery.
Figure 5.14: The aggregated results from production of cells and pack materials with use phase, reuse
and recycling for LFP with the different components and phases in percentage of total impact for each
category.
94

CHAPTER 5. RESULTS
optimized batteries from PHEV bus applications could suit a certain type of application better,such as power quality applications, and that PHEV car energy optimized batteries could beused for other stationary applications such as UPS and batteries installed in apartments.
5.4 Battery material recycling scenarios
Recycling of the cell material is very chemistry dependent and thus hard to model. The resultsreflect the specific modeling choices, but give general indication. For the hydrothermal recycling,no process energy is included, making the results a comment on potential saving in the materials,and not actual energy savings associated with the method. The results of pyrometallurgicalrecycling will be shown for dry produced NMC cells, and those of hydrometallurgical recyclingwill be shown for wet produced LFP cells.
5.4.1 Life cycle impact assessment
The effects of recycling different chemistries will be assessed in terms of energy saving comparedto energy consumption during the recycling. Figure 5.15 shows the energy consumption of a cellproduced from virgin material, the energy cost of recycling, the energy gain from accreditingthe recycled materials negative energy consumption and lastly the total energy consumptionif recycled materials are included. The figure includes the results both for NMC and LFPrecycling.
The gain of NMC recycling is clear, but not a great contribution to the total cell production.This is mainly due to the small percent of the cell being recycled back into battery material. Therest is used for heating or goes to slag and is not accredited in this assessment. The energy costof recycling is rather low, which can partly be explained by the use of all organic componentsas fuel. However, using the energy in these materials is a way of recycling them, although notback to battery grade. The gains from recycling NMC is distributed among the materials beingrecycling, namely cobalt, nickel and copper.
For LFP recycling the gain is larger, since much of the material is recycled to a reusablestate. However, the energy cost of recycling is somewhat uncertain since only the chemicalsneeded are taken into account. The indications that there are potential benefits for the energyconsumption in recycling is still clear, since the major impact of this recycling method is thechemicals. In light of the aluminium foils large contribution to several impact categories, onelarge gain of hydrometallurgy in comparison with pyrometallurgy is the opportunity to decreasethis burden by recycling.
For the hydrometallurgical recycling of LFP the main gain comes from the recycling of thealuminium foil. Since the processing of the aluminium is a small part of its impact, this recyclingwill be effective even if the aluminium foil cannot be reused directly. The credit of lithium andthe electrolyte are about half that of the aluminium each. The lithium gain is readily realizable,as the lithium is retrieved in a form that can be reused in battery material production. Lastly,a smaller gain is added from recycling the copper foil.
It is important to consider that recycling often is driven by price and not energy consump-tion. If legislations are passed to regulate recycling, the energy consumption might be a goodguide to when it is beneficial to recycle. If not, the energy savings have to be viewed in lightof cost. The saving from pyrometallurgical recycling may look small, but the value of therecovered material is high since copper cobalt and nickel are among the recovered metals. Thehydrometallurgical method may look appealing from an energy perspective, but the chemicalsinvolved are often very expensive, and the value of the recovered material is small.
95

CHAPTER 5. RESULTS
(a) LFP recycling, hydrometallurgical (b) NMC recycling - pyrometallurgical
Figure 5.15: The energy needed to recycle and the energy gained by accrediting the recycled materials
negative contribution can be viewed in light of the total virgin cell production. The impact recycling
would have on the total energy consumption can be seen as the right column.
Previous assessments of the effects of pyrometallurgical and hydrometallurgical recyclinghave indicated that hydrometallurgical actually may be less energy efficient than pyrometal-lurgical, due to the use of chemicals. Dunn, Gaines, Sullivan & Wang [2012] has taken largerconsideration to the need for post-processing the materials, and included that energy, as wellas including process energy. The resulting assessment shows hydrometallurgy requiring moreenergy than pyrometallurgy.
5.4.2 Sensitivity analysis and limiting assumption
For the pyrometallurgical approach, the whole cell is assumed to simply be placed into a furnaceto be burnt and recycled. In the case of hydrometallurgical, a limitation is that no EOLprocessing is assumed for the components that are not recycled. That includes the pouch withits aluminium and the separator. Apart from the possible aluminium recovery, managing thesecomponents EOL would cost energy without adding value to the life cycle stage. Possibly, thesecomponents could be incinerated and used as heat for some of the other processes.
Since all the materials in the NMC recycling contribute equally to the gain of recycling, alowered recycling rate for any of them would correspond to a reduction in the total gain with athird as much. Since the energy consumption of the recycling step is so low, a recovery rate ofonly 12% of the valuable metals would still validate the recycling path.
96

Discussion
The results in the previous chapter, and the models used to describe the ESS in this thesis,gives rise to some interesting points for discussion. Both the results and the models can haveimplication for future work, both new life cycle assessments and product development.
The results of the assessment of cell materials and production give indications of possibleimprovements that can be obtained when changing battery chemistry. It is clear that the choiceof production method for the active material needs to be chosen to suit that particular chemistry.Both the energy intensity of the process itself, but also the available precursors impact the choiceof most efficient production. Changing precursors affect the energy consumption, but can alsogreatly influence other categories, leading to a reduced total impact.
For materials that require nano-size, the benefits of using wet synthesis are clear. For othermaterials, the choice of dry processing is more reasonable, but still comparable to the wetmethod. Therefore all potential active materials, and possible precursors, need to be evaluatedin detail before a process choice can be made.
Another indication is that the foils used as current collectors and support for the activematerial have a large impact on both energy consumption and some resource oriented impactcategories. Copper has great impact of the ADP of elements, and has a high price. However, itshould be noted that the choice of the thicker aluminium foil has larger impact on many of theother categories. Minimizing the thickness of the foils is of large importance when designinghigh power cells which, to a greater extent than energy optimized cells, use thicker foils. If achange in chemistry required a greater or smaller thickness of the foil, this should also be takeninto consideration.
The results for the LTO anode, indicating the viability of increased energy consumption inlight of longer cycle-life, are valid also in a more general case, with other cathode active materialsthan the future LMP chemistry. The most common cathode for the LTO today is LMO andnot LMP, and the indications of the large impact LTO has on cell production would hold forthis chemistry as well. The conclusion that it is of great importance to utilize the possibility ofincreased life-length is also valid for other cathode choices. This also gives indications to oneroute to improve the electrode impact, namely prolonged cycle-life. In addition, if the boundariesof the assessment are broadened, the decreased need for replacement and maintenance maypositively influence more parts of the whole system.
The different housing material choices for the pack designs have shown few effects on thecradle to gate impact of the whole pack, but less than for example cells, copper connects andcontrol units that are present in about the same amount for all the different standard designs.Firstly the similar impacts may derive from the fact that the aluminium, steel and plastics usedall are common metals and materials with little risk for depletion and with few related toxicemissions during production and extraction. Secondly, all the pack designs have been madewith the same requests on assumed strength and durability, to allow a long life of the passivecomponents. As have been mentioned the embodied energy (cradle to gate) per volume of amaterial is positively correlated to the strength in terms of young’s modulus, and so the requestfor strength and the dimensioning criteria makes it reasonable that the outcome is similar for
97

CHAPTER 6. DISCUSSION
all standard designs.It would be interesting to investigate the actual thicknesses of the cases required to withstand
a crash. The current designs for the models are not tested with finite element method and sothe actual yield strength should be further investigated. The possibility to use less materialfor the housings should be evaluated, as the minimum material thickness required. Since ithas been shown that module housing adds a high amount of material, due to the large surface.BatPaC has a standard set up of dimensions for housings, materials and connects, which shouldserve mainly to give directions for design of packs for cars. Typically the weight is doubled forthe battery of the PHEV bus compared to the BatPaC standard system, and so the requests onthe structure to withhold the weight of cells and modules may be higher. In order to take theenvironmental considerations into account during the first concept designs of the battery pack,part of the LCA evaluation could be integrated directly into CAD software, or into BatPaC. Inthis way construction, electric properties and ecodesign could be joined directly.
In the results the product manufacturing process energies of the pack passive materials havenot been included, which gives a margin for errors, making the pack passive materials perhapsmore equal to the cells in terms of energy.
Having seen that the reuse of cells and passive pack components may lead to a greatimprovement of the life cycle impacts in the best case, the actual component life lengths,the transports needed, and the feasible collection rates should be further investigated. For arealistic case the possible reuse rate may be a lot lower for various reasons.
For the driving the results show that the impact from energy consumption during the usephase related to the battery weight is similar to the energy needed to produce the battery.This means that reducing the weight of the passive materials in the battery can be an equallyefficient measure from an energy point of view as reducing the production energy.
To achieve better accuracy, the actual increase in energy consumption due to added loadon the bus should be simulated, or measured. After all, the linearization that is done in theassumptions is an approximation that could be done in a more precise way.
For the battery assumptions, the life length of the batteries needs to be validated with testsor case specific data, being an important parameter for the battery life cycle impacts, and apossible difference in life length between the selected NMC and LFP packs could make need fora different sizing of the packs.
Some impacts related to voltage mismatch could be reduced if choosing the battery early inthe development phase, in order to optimize the interfaces between all the drive line components.This could also be achieved by keeping a close contact between the battery manufacturer andthe vehicle manufacturer from start. In this way voltage levels may be kept similar for thewhole drive line and less extra components will be needed to compensate for different voltagelevels implying less weight and costs.
An alternative to fast charging would be to have a redundancy of battery packs that couldbe switched at the end of each service route, which would allow using slow charging and soprolonging the battery pack life. The comparison should be made in terms of costs and impactsto evaluate the optimum number of packs serving each bus, compared to the cost of shorteningthe battery life due to fast charging. To succeed with battery friendly fast charging, the cellaging properties needs to be further improved.
Given the importance of the cooling system weight and volumetric contributions for thebattery pack, the choice of cooling structure should be made carefully, to not increase the amountof passive materials unnecessarily. The tradeoff between the cooling system efficiency and theweight related fuel consumption may need to be done. In general the type of infrastructure forthe cooling system should be further investigated, there are many different options and to betested is which one is the most efficient, from an energy and material point of view. It seems agood idea to give supporting structures such as the housings the function of heat exchangers.
98

CHAPTER 6. DISCUSSION
Recommendations for future life cycle assessments
The results of this thesis are aimed at showing hot-spots and important stages in battery designand production. This is done without specific data, to keep the results are general as possible.The key points to assess in future LCAs are summarized below:
• Include transportation and geographical production details.
• Include case specific use phase to better assess the end of life opportunities.
• Assess a specific cell chemistry and production path.
• Assess the impact of different power optimization designs.
• Assess in detail the cooling system needed for fast charging and its impacts.
Generally, adding the transportation impact to the assessment would further improve the results.This does require some more data on production and assembly sites. Acquiring more of theproduction locations would also help achieve greater detail, and limit the need to use global orEuropean averages.
Since the life-length of the battery in the vehicle greatly impacts the per km or per yearimpact of the battery, as well as possible replacements cost, it is a factor to assess in greaterdetail. Case specific driving cycles, coupled to a known chemistry and a certain life-length ofthe ESS could fully determine the impact of the battery compared to the use phase. In thisthesis only indications of the most influential components are given, based on general drivingcycles and an assumed system life-length in the vehicle. Future improvements could thereforeinclude collecting case-specific data for modeling one known battery configuration.
On a cell level this would include choosing one chemistry and assessing the precise processsteps taken to produce the active materials and other cell components. The precise weightsof the different components could then be better assessed. This would settle what impact thecomponents with high sensitivity, like the foils, actually have.
Site specific production data for the different production processes could be useful to assessthe importance of geographical location of the manufacturers. Finding a more detailed descrip-tion of the production path could help determine the possibilities to improve, and more preciselywhere in the production line improvements would be most beneficial. Having known precursorswith known production location improves the accuracy of the results, since site specific dataand extraction methods can be used. A sensitivity analysis between different manufacturersof battery cells is of interest when choosing supplier. The dilemma with the cell productionindustry is that specific data rarely is disclosed, making evaluation difficult for an externalparty. The production paths for the active material is in this thesis modeled as proxies for wetand dry production, and more detailed steps could be added for greater detail into this step. Afurther assessment of the changes to the production path when changing chemistry would alsobe beneficial.
In this thesis some steps have been added to the model to ensure more power optimizedsystems, and in particular power optimized cells. For this purpose the thickness of the activematerial was decreased. To further evaluate the different energy impacts when power optimizingthe thickness of the foils should also be changed. A comparison with an energy optimized cellwould then be of great interest. It can also be of interest to compare different degrees of energyand power optimization, and different methods to achieve them.
The cell assembly is a step surrounded by great uncertainty and a wide range of data. Adetailed assessment of actual energy needs during this step is therefore of great interest andcould improve the assessment further.
Similarly, data for the assembly of the pack and manufacturing of other pack componentssuch as housings should be collected, for the results to become more precise. Adding the actual
99

CHAPTER 6. DISCUSSION
recycling of passive pack components such as housings and cooling plates would also give moreaccurate results. Especially interesting is the possibility of recycling the gold in the PCB andthe related potential of reduction in impacts from the control system electronics. The same isvalid for the possible reuse rates that should be further investigated. Depending on the likelinessof second life, the allocation of the replaced new batteries can be included in the total lifecycle,finding a way to divide the impacts between first and second life actors.
Data for the energy consumption during the use phase should be validated with measure-ments for all the reference vehicles, with the actual number of passengers to achieve moreaccuracy in the assessment. The actual amount of added battery that increases the marginalweight of the vehicle should also be determined to improve the results.
The actual power needed for the ESS cooling has been excluded in this thesis, which mayhave a varying degree of impact depending on the amount of cooling plates and the coolingefficiency. It can also be of value to specify what type of cooling system that is used in thevehicle, to get a better assessment of the impact.
100

Conclusions
In the ESS, the cells have a large impact on the total life cycle. The results from examiningthe different components in the cell are therefore of great interest since this can suggest wherethere is most room for improvement. When choosing cell chemistry it is important to considerthe type of impact. The layered oxide example NMC contains elements with larger impactin most categories, even though the total energy consumption is similar to for example thephospho-olivine LFP. For LFP the impact is divided between precursors and processing makingthe choice of processing and suitable precursors more open for fine tuning. NMC has less roomfor improvement since the process impacts very little.
The results of the LCA for the cells also indicate that the foils have a large impact. Thismakes it interesting to investigate the critical thickness needed for these foils, and the possibilityto have a smaller total amount in the whole cell. For current chemistries it is still the activematerial that has the highest impact in the LCA of the positive electrode, but when the impactof the active materials is decreased as in LFS, the foils will need to develop as well to decreasethe total impact significantly.
If the thickness of the foils are increased to enable higher power the impact is large, especiallywhen considering energy consumption and global warming potential. This has implication whendesigning high power systems, since the foils then might need to be thicker to increase the currentcapacity of the cell.
The electrolyte has the largest impact apart from the electrode, and development of thiscomponent, especially when it comes to the acidification impact should not be neglected.However, if using the weighting factor EPS, the electrolyte has little importance for the totalimpact of the cell. If the focus instead is in the lines of the EI99 weighting method, the electrolytedoes again matter. This implies that there is a need to have a clear picture of what the goal ofpossible improvements is, since the most important factors vary with weighting methods. Thisalso holds true for the electrodes.
The assembly of the cell, the separator and other passive components have a small impactin all weighting methods. The fact that the cell casing has such a small impact on the totalcell leads to the conclusion that a decrease in cell size leading to a change in the amount ofpouch materials will not yield great improvements to the life cycle. Actions to achieve smalleramount of active materials are more valuable. Improvement to the graphite electrode is ofsmaller benefit than improving the cathode, especially when focusing on the EPS score.
Investigating the impact of using an anode with longer life-lengths illustrated the benefitsof increasing this property. This can be used as a guide when discussing the possible life-lengthbenefits of an anode or cathode change, in light of for example increased energy consumption.To increase the viability of battery systems in vehicles life-lengths closer to that of the vehiclelife may be desirable, adding consumer benefits to the possible environmental benefits of longerlife.
After the cells, the most critical components are the control units and the copper connects.Although their weight percent is very low, the related impacts are significant. As shown inthe sensitivity analysis the type of printed circuit board and its content of rare metals highly
101

CHAPTER 7. CONCLUSIONS
influence the results. As follows it is relevant from an environmental perspective to try to reducethe amount of these components, and to select the printed circuit board to have less possiblegold content. Reuse of the electronics is also a good idea, since they suffer little wear during thebattery use. Both these actions would save both costs and environmental impacts. Attentionshould be paid when using multiple packs for one bus to not use multiple control units for thementioned reasons.
The impacts of choices of various pack designs in terms of housing materials have littleinfluence compared to the impact of the electronics, the cells, and the choice of total capacity.The choice of pack modularization has shown to have an impact in terms of weight; the largermodules the lighter pack. The possibility for second use and reuse is dependent on the modulesize where a smaller module size will be beneficial in terms yield rate. However, the numberof parts to administrate and disassemble makes the remanufacturing more costly, as well asincreases amount of housing materials and connects. More research on this topic is needed foran optimal trade off.
On a higher system level, the battery pack should be seen as an integrated part of thevehicle, meaning that many choices can be done to decrease the environmental impacts, takinginto account voltage matching, weight and number of passengers versus capacity of the pack,fast charging implications and design and disposition of components to enable reuse and seconduse. Reuse of pack components and cells has shown to be an efficient measure to reduce thebattery life cycle impacts if it can be done at high rates. Especially the reuse of passive packcomponents seems a recommendable choice, without risk of affecting safety or performance.
A weight increase of 300-500 kg, for example caused by an increased battery pack weight,leads to an energy consumption contribution similar to the one of the production of the batterypack. Additionally, this increase could result in a reduced number of passengers which reducingthe battery weight an important factor to consider. The interfaces between battery and drive lineshould be optimized, especially in terms of voltage, to avoid extra weight from other componentssuch as converters.
The cooling system is an important part of the ESS and the actual integration of thestructure varies from case to case. The results from changing the thickness of cooling plates forfast charging indicates an increase in energy use both in pack production and use phase due tothe added weight of the system.
As a last conclusion, recycling cells and cell material will most likely become increasinglyimportant. The assessment in this thesis shows that there are environmental gains whenrecycling, both with pyrometallurgy and hydrometallurgy. The gains must however be placed incontext of economic gains, and this is the current limit both for lithium extraction as an additionto pyrometallurgy, and to hydrometallurgy. The energy savings of aluminium recycling in thehydrometallurgical route are large, although they were not assessed in relation to a possibleincrease in energy use. If recycling is not viable, reuse of the cells may be an alternative tolower the impact of the production phase.
102

Bibliography
A123 Systems [2013], ‘Nanophosphate lithium ion prismatic pouch cell datasheet’. [online], http://www.
a123systems.com/, Accessed on June 3 2013.
ABB [2012], Press release. [online], http://www.abb.se/cawp/seitp202/c2e73824456831b8c1257ab60040a3b0.aspx, Accessed on June 7 2013.
Andersson, B. A. & Rade, I. [2001], ‘Metal resource constraints for electric-vehicle batteries’, TransportationResearch Part D: Transport and Environment 6(5), 297–324.
Argonne National Laboratory [2000], ‘Costs of lithium-ion batteries for vehicles’.
Arora, P. & Zhang, Z. [2004], ‘Battery separators’, Chemical Reviews 104(10), 4419–4462.
Ashby, M. F. [2012], Materials and the environment: eco-informed material choice, Butterworth-Heinemann.
Azar, C. [2008], Makten over klimatet, Bonnier.
Barchasz, C., Lepretre, J.-C., Alloin, F. & Patoux, S. [2012], ‘New insights into the limiting parameters of theli/s rechargeable cell’, Journal of Power Sources 199, 322–330.
Barlow, T., Latham, S., McCrae, I., Boulter, P. et al. [2009], A reference book of driving cycles for use in themeasurement of road vehicle emissions, Vol. 1.
Baumann, H. & Tillman, A.-M. [2004], The Hitch Hiker’s Guide to LCA. An orientation in life cycle assessmentmethodology and application, Studentlitteratur AB.
BIR - Bureau of International Recycling [2013]. [online], http://www.bir.org, Accessed on May 29 2013.
Buchan, D. [2011], Expanding the European dimension in energy policy: the Commission’s latest initiatives,Oxford Institute for Energy Studies.
Chen, J. [2013], ‘Recent progress in advanced materials for lithium ion batteries’, Materials 6(1), 156–183.
Chen, J., Wang, S. & Whittingham, M. S. [2007], ‘Hydrothermal synthesis of cathode materials’, Journal ofPower Sources 174(2), 442–448.
Chen, J. & Whittingham, M. S. [2006], ‘Hydrothermal synthesis of lithium iron phosphate’, Electrochemistrycommunications 8(5), 855–858.
Cheret, D., Santen, S. et al. [2007], ‘Battery recycling’. US Patent 7,169,206.
Cho, H., Lee, H. & Lee, Y. [2006], ‘Some breakage characteristics of ultra-fine wet grinding with a centrifugalmill’, International Journal of Mineral Processing 78(4), 250–261.
Cicconi, P., Landi, D., Morbidoni, A. & Germani, M. [2012], Feasibility analysis of second life applications forLi-ion cells used in electric powertrain using environmental indicators, in ‘Energy Conference and Exhibition(ENERGYCON), 2012 IEEE International’, IEEE, pp. 985–990.
Conte, F. [2006], ‘Battery and battery management for hybrid electric vehicles: a review’, e & i Elektrotechnikund Informationstechnik 123(10), 424–431.
Dalal Engineering [2013], ‘Solvent Recovery Solutions, For Profitability with Compliance’. [online], http://www.dalalengineering.com/pdf/Dalal%20Solvent%20Recovery.pdf, Accessed on May 5 2013.
Daniel, C. & Besenhard, J. O. [2012], Handbook of battery materials, Wiley-VCH.
Dominko, R., Bele, M., Gaberscek, M., Meden, A., Remskar, M. & Jamnik, J. [2006], ‘Structure andelectrochemical performance of Li2MnSiO4 and Li2FeSiO4 as potential li-battery cathode materials’,Electrochemistry Communications 8(2), 217–222.
Dunn, J. B., Gaines, L., Sullivan, J. & Wang, M. Q. [2012], ‘Impact of recycling on cradle-to-gate energyconsumption and greenhouse gas emissions of automotive lithium-ion batteries’, Environmental science &technology 46(22), 12704–12710.
Dunn, J., Gaines, L., Barnes, M., Wang, M. & Sullivan, J. [2012], Material and energy flows in the materialsproduction, assembly, and end-of-life stages of the automotive lithium-ion battery life cycle, Technical report,Argonne National Laboratory (ANL).
103

BIBLIOGRAPHY
EiG - Energy innovation group [2013]. [online], http://www.eigbattery.com, Accessed on May 29 2013.
Ellis, B. & Nazar, L. [2012], ‘Sodium and sodium-ion energy storage batteries’, Current Opinion in Solid Stateand Materials Science .
en Waterstaat, M. v. V. & Waterbouwkunde, D. W.-e. [2002], ‘Abiotic resource depletion in LCA’.
European Parliament [2008], ‘EC Directive 2008/103/EC: Directive 2008/103/EC of the European Parliamentand of the Council of 19 November 2008 amending Directive 2006/66/EC on batteries and accumulatorsand waste batteries and accumulators’.
Eyer, J. & Corey, G. [2010], ‘Energy storage for the electricity grid: Benefits and market potential assessmentguide’, Sandia National Laboratories .
Gaines, L., Nelson, P. et al. [2009], Lithium-ion batteries: Possible materials issues, in ‘13th International BatteryMaterials Recycling Seminar and Exhibit, Broward County Convention Center, Fort Lauderdale, Florida’,p. 16.
Georgi-Maschler, T., Friedrich, B., Weyhe, R., Heegn, H. & Rutz, M. [2012], ‘Development of a recycling processfor li-ion batteries’, Journal of Power Sources .
Goodenough, J. B. & Kim, Y. [2009], ‘Challenges for rechargeable li batteries’, Chemistry of Materials 22(3), 587–603.
Greenpeace International and European Renewable Energy Council [2009], ‘Infrastructure Needed To Save TheClimate’.
Groot, J. [2012], ‘State-of-health estimation of Li-ion batteries: cycle life test methods’, Licentiate thesis, Energyand Environment, Chalmers University of Technology, Goteborg, Sweden .
Hans De Keulenaer [2006a], ‘Acidification potential (ap)’. [online], http://www.leonardo-energy.org/
acidification-potential-ap, Accessed on June 11 2013.
Hans De Keulenaer [2006b], ‘Eutrophication potential (ep)’. [online], http://www.leonardo-energy.org/
eutrophication-potential-ep, Accessed on June 11 2013.
Hertwich, E. G., Mateles, S. F., Pease, W. S. & McKone, T. E. [2001], ‘Human toxicity potentials for life-cycleassessment and toxics release inventory risk screening’, Environmental Toxicology and Chemistry 20(4), 928–939.
Huang, X., Li, X., Wang, H., Pan, Z., Qu, M. & Yu, Z. [2010], ‘Synthesis and electrochemical performance ofli2fesio4/carbon/carbon nano-tubes for lithium ion battery’, Electrochimica Acta 55(24), 7362–7366.
IEA - International Energy Agency [2013], ‘Global ev outlook - understanding the electric vehicle landscapeto 2020’. [online], http://www.iea.org/topics/transport/electricvehiclesinitiative/EVI_GEO_2013_FullReport.pdf, Accessed on May 5 2013.
Islam, M. S., Dominko, R., Masquelier, C., Sirisopanaporn, C., Armstrong, A. R. & Bruce, P. G. [2011], ‘Silicatecathodes for lithium batteries: alternatives to phosphates?’, Journal of Materials Chemistry 21(27), 9811–9818.
Ji, X. & Nazar, L. F. [2010], ‘Advances in Li–S batteries’, Journal of Materials Chemistry 20(44), 9821–9826.
Johnson, T. [2008], ‘Diesel engine emissions and their control’, Platinum Metals Review 52(1), 23–37.
Jugovic, D. & Uskokovic, D. [2009], ‘A review of recent developments in the synthesis procedures of lithium ironphosphate powders’, Journal of Power Sources 190(2), 538–544.
Klason, C., Rigdahl, M., Boldizar, A. & Kubat, J. [2008], Plaster: materialval och materialdata, Liber.
Konarova, M. & Taniguchi, I. [2009], ‘Preparation of carbon coated LiFePO4 by a combination of spraypyrolysis with planetary ball-milling followed by heat treatment and their electrochemical properties’,Powder Technology 191(1), 111–116.
Kosaraju, S. [2012], ‘Investigation of HEV Li-ion Batteries for Lithium Recovery’.
Krug, E. C., Frink, C. R. et al. [1983], ‘Acid rain on acid soil: A new perspective.’, Science(Washington)217(4610), 520–525.
Kushnir, D. & Sanden, B. A. [2011], ‘Multi-level energy analysis of emerging technologies: a case study in newmaterials for lithium ion batteries’, Journal of Cleaner Production 19(13), 1405–1416.
Kushnir, D. & Sanden, B. A. [2012], ‘The time dimension and lithium resource constraints for electric vehicles’,Resources Policy 37(1), 93–103.
Laudon, N. & Inzunza Soriano, M. [2012], ‘Comparative LCA of Electrified Heavy Vehicles in Urban Use. Masterof Science Thesis in the Master’s Degree Programme Technology, Society and the Environment’.
Lee, M.-H., Kang, Y.-J., Myung, S.-T. & Sun, Y.-K. [2004], ‘Synthetic optimization of LiNi1/3Mn1/3Co1/3O2 viaco-precipitation’, Electrochimica Acta 50(4), 939–948.
104

BIBLIOGRAPHY
Li, H. & Zhou, H. [2012], ‘Enhancing the performances of Li-ion batteries by carbon-coating: present and future’,Chemical Communications 48(9), 1201–1217.
Liang, Y., Tao, Z. & Chen, J. [2012], ‘Organic Electrode Materials for Rechargeable Lithium Batteries’, AdvancedEnergy Materials 2(7), 742–769.
MacCarley, C. A. [2000], A Review of Battery Exchange Technology for Refueling of Electric Vehicles, in‘Proceedings of SAE Future Car Conference 2000: Washington, DC’.
Majeau-Bettez, G., Hawkins, T. R. & Strømman, A. H. [2011], ‘Life cycle environmental assessment of lithium-ionand nickel metal hydride batteries for plug-in hybrid and battery electric vehicles’, Environmental science& technology 45(10), 4548–4554.
Martha, S., Markovsky, B., Grinblat, J., Gofer, Y., Haik, O., Zinigrad, E., Aurbach, D., Drezen, T., Wang, D.,Deghenghi, G. et al. [2009], ‘LiMnPO4 as an advanced cathode material for rechargeable lithium batteries’,Journal of The Electrochemical Society 156(7), A541–A552.
Murugan, A. V., Muraliganth, T. & Manthiram, A. [2009], ‘One-pot microwave-hydrothermal synthesis andcharacterization of carbon-coated LiMPO4 (M= Mn, Fe, and Co) cathodes’, Journal of The ElectrochemicalSociety 156(2), A79–A83.
Myung, S.-T., Lee, M.-H., Komaba, S., Kumagai, N. & Sun, Y.-K. [2005], ‘Hydrothermal synthesis of layered Li[Ni1/3Co1/3Mn1/3] O2 as positive electrode material for lithium secondary battery’, Electrochimica acta50(24), 4800–4806.
Nelson, P., Bloom, K. & I Dees, D. [2011], Modeling the performance and cost of lithium-ion batteries for electric-drive vehicles., Technical report, Argonne National Laboratory (ANL), Argonne, IL (United States).
Neubauer, J. & Pesaran, A. [2011], ‘The ability of battery second use strategies to impact plug-in electric vehicleprices and serve utility energy storage applications’, Journal of Power Sources 196(23), 10351–10358.
Neubauer, J., Pesaran, A., Williams, B., Ferry, M. & Eyer, J. [2012], Techno-Economic Analysis of PEV BatterySecond Use: Repurposed-Battery Selling Price and Commercial and Industrial End-User Value, Technicalreport, National Renewable Energy Laboratory (NREL), Golden, CO.
Notter, D. A., Gauch, M., Widmer, R., Wager, P., Stamp, A., Zah, R. & Althaus, H.-J. [2010], ‘Contributionof Li-ion batteries to the environmental impact of electric vehicles’, Environmental science & technology44(17), 6550–6556.
Nyten, A., Abouimrane, A., Armand, M., Gustafsson, T. & Thomas, J. [2005], ‘Electrochemical performance ofLi2FeSiO4 as a new Li-battery cathode material’, Electrochemistry communications 7(2), 156–160.
OICA - International Organization of Motor Vehicle Manufacturers [2013]. [online], http://www.oica.net,Accessed on May 29 2013.
Palomares, V., Serras, P., Villaluenga, I., Hueso, K., Carretero-Gonzalez, J. & Rojo, T. [2012], ‘Na-ion batteries,recent advances and present challenges to become low cost energy storage systems’, Energy & EnvironmentalScience 5(3), 5884–5901.
PE International [2013], ‘Gabi-software, home page’. [online], http://www.gabi-software.com/sweden/index/,Accessed on June 10 2013.
Pesaran, A. A., Markel, T., Tataria, H. S. & Howell, D. [2009], Battery Requirements for Plug-in Hybrid ElectricVehicles–analysis and Rationale, National Renewable Energy Laboratory.
Rockwell Automation [2009], ‘An Executive Guide to Pharmaceutical Manufacturing Efficiency and theEffect of Environmental Legislation’. [online], http://literature.rockwellautomation.com/idc/groups/literature/documents/wp/ssb-wp001_-en-e.pdf, Accessed on May 5 2013.
Rydh, C. J. & Sanden, B. A. [2005], ‘Energy analysis of batteries in photovoltaic systems. Part II: Energy returnfactors and overall battery efficiencies’, Energy conversion and management 46(11), 1980–2000.
Siemens AG [2013], Siestorage. [online], https://w3.siemens.com/powerdistribution/global/
SiteCollectionDocuments/en/mv/power-supply-solutions/siestorage/brochure-siestorage_en.pdf,Accessed on June 7 2013.
Steen, D. [2012], ‘Impact on the Distribution System due to Plug-In Electric Vehicles and Changes in ElectricityUsage’.
Steen, D., Le, T. & Bertling, L. [2012], Price-Based Demand-Side Management For Reducing Peak Demand InElectrical Distribution Systems–With Examples From Gothenburg, in ‘NORDAC 2012’.
Tennants Distribution Limited [2008], ‘Product data sheet’. [online], http://www.partinfo.co.uk/files/
AdBlue%20Range%20MSDS.pdf, Accessed on June 12 2013.
Transportstyrelsen [2013], ‘Transportstyrelsen, Bruttovikter for fordon’. [online], https:
//www.transportstyrelsen.se/sv/Vag/Yrkestrafik/Gods-och-buss/Matt-och-vikt/
Bruttovikter-for-fordon/, Accessed on June 6 2013.
105

BIBLIOGRAPHY
U.S. Department of Energy, Energy Efficiency & Renewable Energy, Vehicle Technologies Program [2013], 2011Nissan Leaf – VIN 0356 Advanced Vehicle Testing – Beginning-of-Test Battery Testing Results. [on-line], http://www1.eere.energy.gov/vehiclesandfuels/avta/pdfs/fsev/battery_leaf_0356.pdf, Ac-cessed on June 4 2013.
Verhulst, D., Sabacky, B. J., Spitler, T. M. & Prochazka, J. [2003a], ‘A new process for the production ofnanosized TiO2 and other ceramic oxides by spray hydrolysis’, Nanotechnology & PM2: Scientific Challengesand Commercial Opportunities 17, 18.
Verhulst, D., Sabacky, B., Spitler, T. & Prochazka, J. [2003b], ‘New Developments in the Altair HydrochlorideTiO2 Pigment Process’, Young CA, Alfantazi AM, Anderson CG, et al. Hydrometallurgy pp. 565–575.
Viljanen, S., Makkonen, M., Annala, S. & Kuleshov, D. [2011], ‘Vision for european electricity markets in 2030’.
Volvo Buses [2013a], ‘Volvo 7900, Better Business for Greener Cities, Volvo-7900-Hybrid-Euro6-Brochure-EN’. [online], http://www.volvobuses.com/SiteCollectionDocuments/VBC/Downloads/
Volvo-7900-Hybrid-Euro6-Brochure-EN.pdf, Accessed on June 4 2013.
Volvo Buses [2013b], ‘VOLVO 7900 HYBRID, Volvo-7905H-EU6-Data-sheet-13-03’. [online], http://www.
volvobuses.com/SiteCollectionDocuments/VBC/Downloads/Volvo-7905H-EU6-Data-sheet-13-03.pdf,Accessed on June 6 2013.
Volvo Cars [2013], ‘V60 Plug-in Hybrid’. [online], http://www.volvocars.com/se/campaigns/hybrid/pages/
v60-plugin-hybrid.aspx, Accessed on June 7 2013.
Volvo Trucks [2013], ‘Volvo is ready for euro 6’. [online], http://www.volvotrucks.com/trucks/uk-market/
en-gb/trucks/volvo-fh-series/key-features/pages/d13k460-euro-6.aspx, Accessed on June 6 2013.
Wang, J. & Sun, X. [2012], ‘Understanding and recent development of carbon coating on LiFePO4 cathodematerials for lithium-ion batteries’, Energy & Environmental Science 5(1), 5163–5185.
Wang, Z., Sun, Y., Chen, L. & Huang, X. [2004], ‘Electrochemical characterization of positive electrodematerial LiNi1/3Co1/3Mn1/3O2 and compatibility with electrolyte for Lithium-ion batteries’, Journal ofThe Electrochemical Society 151(6), A914–A921.
Zackrisson, M., Avellan, L. & Orlenius, J. [2010], ‘Life cycle assessment of lithium-ion batteries for plug-in hybridelectric vehicles–Critical issues’, Journal of Cleaner Production 18(15), 1519–1529.
Zhang, W.-J. [2011], ‘Structure and performance of LiFePO4 cathode materials: A review’, Journal of PowerSources 196(6), 2962–2970.
Zhu, L., Lei, A., Cao, Y., Ai, X. & Yang, H. [2013], ‘An all-organic rechargeable battery using bipolarpolyparaphenylene as a redox-active cathode and anode’, Chemical Communications 49(6), 567–569.
Zimmermann, J. P. [2009], ‘End-use metering campaign in 400 households In Sweden Assessment of the PotentialElectricity Savings’, Contract 17, 05–2743.
106

Appendix
Modeling data for cells and electrodes
Table A.1: The table present the assumptions made on recovery rates for the different recycling methods.
In most cases 100% or 0% is assumed, but for the electrolyte some unavoidable losses are assumed.
Positive electrode wt% LFP wt% NMC wt% LFS wt% LMP
Active material 56.90% 66.47% 38.42% 59.77%Carbon black 3.84% 4.48% 2.59% 4.03%
PVdF 3.20% 3.73% 2.16% 3.36%Aluminium foil 36.06% 3.73% 2.16% 3.36%
Negative electrode wt% Graphite wt% LTO
Active material 28.44% 58.77%Carbon black 0% 3.96%
PVdF 1.50% 3.30%Copper foil 70.06% -
Aluminium foil - 33.96%
Cell assembly wt% LFP wt% NMC wt% LFS wt% LMP
Positive electrode 35.0% 40.2% 26.35% 37.2%Negative electrode 39.1% 38.7% 44.19% 37.5%
Electrolyte 18.0% 13.9% 20.73% 17.1%Separator 3.9% 3.1% 4.62% 3.7%
Casing 4.0% 4.1% 4.1% 4.5%
107

Table A.2: Summary of all materials involved in cell production. Models for some materials during the
LCA are given, as well as references for LCA data and materials choices.
kg in/kg MaterialsComponent Precursors component Modeled as Data reference choices reference
LFP wet LiOH 0.46 Ecoinvent [Chen & Whittingham 2006]H3PO4 0.62 85% in H2O Ecoinvent, industrial grade [Chen & Whittingham 2006]FeSO4 0.96 Ecoinvent [Chen & Whittingham 2006]
LFP dry Li2CO3 0.47 Ecoinvent [Jugovic & Uskokovic 2009]FeC2O4 0.91 FeSO4 Ecoinvent [Jugovic & Uskokovic 2009](NH4)3PO4 1.07 (NH4)2PO4 Ecoinvent, as P205 [Jugovic & Uskokovic 2009]
LMP wet LiOH 0.46 Ecoinvent From LFPH3PO4 0.62 85% in H2O Ecoinvent, industrial grade From LFPMnSO4 0.96 Modified Mn conc. Majeau-Bettez-Ecoinvent From LFP
LMP dry Li2CO3 0.47 Ecoinvent From LFPMnC2O4 0.91 MnSO4 Majeau-Bettez-Ecoinvent From LFP(NH4)3PO4 1.08 (NH4)2PO4 Ecoinvent, as P205 From LFP
NMC wet LiOH 0.25 Ecoinvent [Myung et al. 2005]NMC1/3(OH)2 0.95 [Myung et al. 2005]
NiSO4 0.26 Modified metallic Ni Majeau-Bettez+Ecoinvent [Myung et al. 2005]CoSO4 0.26 Modified metallic Co Majeau-Bettez+Ecoinvent [Myung et al. 2005]MnSO4 0.24 Modified Mn conc. Majeau-Bettez+Ecoinvent [Myung et al. 2005]NaOH 0.87 50% in H2O Ecoinvent, production mix [Myung et al. 2005]
NH4OH 0.73 Ecoinvent [Myung et al. 2005]NMC dry LiOH 0.25 Ecoinvent [Wang et al. 2004]
Ni2O3 0.29 Oxidized Ni metal Ecoinvent [Wang et al. 2004]Mn2O3 0.27 Ecoinvent [Wang et al. 2004]Co2O3 0.29 Oxidized Co metal Ecoinvent [Wang et al. 2004]
LFS wet LiOH 0.30 Ecoinvent [Dominko et al. 2006]SiO2 0.37 Quartz sand PE [Dominko et al. 2006]FeCl 40% in H2O 1.96 40% in H2O Ecoinvent [Dominko et al. 2006]
LFS Dry Li2CO3 0.46 Ecoinvent [Huang et al. 2010]FeC2O4 0.89 FeSO4 Ecoinvent [Huang et al. 2010]SiO2 0.92 Quartz sand PE [Huang et al. 2010]
Graphite 1.00 Battery grade graphite Ecoinvent
LTO TiO2 1.20 TiO2 Ecoinvent, chloride path [Verhulst et al. 2003b]LiCl 0.27 Ecoinvent
Electrolyte LiPF6 0.13 [Nelson et al. 2011]LiCl 0.28 EcoinventPCl5 1.37 Ecoinvent
HF 0.79 EcoinventEC 0.44 Ethylene glycol Ecoinvent [Nelson et al. 2011]DMC 0.44 [Nelson et al. 2011]
methanol Ecoinventphosgene Ecoinvent
Separator Polypropylene 0.80 PE [Nelson et al. 2011]Polyethylene 0.20 PE [Nelson et al. 2011]
Cell casing PET 0.13 PE [Nelson et al. 2011]Polypropylene 0.05 PE [Nelson et al. 2011]Aluminium foil 0.82 PE [Nelson et al. 2011]
Electrode Active material See A.1 - [Nelson et al. 2011]assembly Carbon black See A.1 PE [Nelson et al. 2011]
Polyvinylidene fluoride See A.1 Polyvinylfluoride, at plant Ecoinvent [Nelson et al. 2011]N-methyl-2-pyrrolidone See A.1 Ecoinvent [Nelson et al. 2011]Aluminium foil See A.1 PE [Nelson et al. 2011]Copper foil See A.1 EU-15 Copper sheet ELCD/ECI [Nelson et al. 2011]
108

Modeling data for pack components and materials
Table A.3: Summary of all materials involved in pack and their database, mass compositions are found
in appendix A, tableA.4, A.5. * The module and pack housings have different materials in different
designs but the mass composition is never blended.
kgmaterial/ MaterialComponent Precursors kgcomponent Modeled as Data reference choices reference
Pack housing and Stainless steel 1 Stainless steel cold rolled coil (304) Eurofer [Nelson et al. 2011]Module housing Aluminium 1 Aluminium sheet EAA [Nelson et al. 2011]alternatives* PP 1 Polypropylene injection moulding part PlasticsEurope [Klason et al. 2008]Insulation PU 1 Polyurethane foam PlasticsEurope [Klason et al. 2008]Steel straps/Plates Stainless steel 1 Stainless steel cold rolled coil (304) Eurofer [Nelson et al. 2011]
Cooling plates Aluminium 1 Aluminium sheet EAA [Nelson et al. 2011]
Copper connects Copper 1 Copper mix 40% recycled PE [Nelson et al. 2011]
BMS and PCB low gold 0.1 printed wiring board, through-hole Ecoinvent [Majeau-Bettez et al. 2011]SOC controller PCB high gold printed wiring board, through-hole Ecoinvent
mounted, unspec.,solder mix EcoinventStainless steel 0.5 Stainless steel cold rolled coil (304) EuroferCopper 0.4 DE: Copper mix 40% recycled PE
Fuel Diesel 1 Diesel mix at refinery PE [Volvo Buses 2013a]
Urea solution Urea 0.325 Urea Ecoinvent [Tennants Distribution Limited 2008](AdBlue) Water 0.685 Water Ecoinvent
Cooling fluid Ethylene glycol 0.5 Ethylene glycol PE [Nelson et al. 2011]Water 0.5 Water (desalinated; deionised) PE
Electricity European average - EU-27 Electricity grid mix PENordic average - NORDE: electricity, production mix EcoinventSwedish hydro power - SE: Electricity from hydro power PE
Table A.4: Summary of all materials involved in LFP Pack design. GaBi databases and precise material
properties found in appendix A, table A.3. Extra denoted design options where the materials are
constant, but amount of packs (Extra 1) and size of the pack (Extra 2) are changed.
Design 1 Design 2 Design 3 Design 4 Extra 1 Extra 2Component Al steel steel-Al steel-plastic Al 2 packs Al large
Pack [kWh] 40 40 40 40 40 40
ESS [kg] 568.1 594.3 573 .4 595.9 583.2 600
Spec. energy Wh/kg 82.3 78.1 81.4 77.9 79.9 66.7
Cells [kg] 434 434 434 434 434 434
Cell [g] 670 670 670 670 670 670
Cell [Ah] 20 20 20 20 20 20
Cell [Wh] 66 66 66 66 66 66
Cell [V] 3.3 3.3 3.3 3.3 3.3 3.3
SOC controllers [kg] 1.73 1.73 1.73 1.73 1.73 1.73
BMS [kg] 4 4 4 4 8 4
Connects Cu [kg] 3 3 3 3 2.18 2.3
Terminals Cu [kg] 1.8 1.8 1.8 1.8 3.54 1.8
Steel plates and straps [kg] 2.7 2.7 2.7 15.3 5.4 3.53
ESS case [kg] 37.2 81.3 81.3 81.3 40.74 47.1
Module house [kg] 11.13 32 11.13 21 11.13 14.07
Thermal conductor (Al) [kg] 25.6 25.6 25.6 25.6 25.6 31.86
Coolant [kg] 8 8 8 8 8.74 10.8
Thermal insulation [kg] 38.7 - - - 42 48.54
109

Table A.5: Summary of all materials involved in NMC Pack design in BatPaC. GaBi databases and
precise material properties found in appendix A, table A.3. Extra 1 denotes that the materials are kept
constant, but three modules are parallel connected.
Design 1 Design 2 Design 3 Design 4 Extra 1Component Al steel steel-Al steel-plastic Al parallel mod.
Pack [kWh] 60 60 60 60 60
Spec. energy Wh/kg 114.8 108 113.4 107.4 114.2
ESS [kg] 586.7 619.7 593.1 622.7 589.7
Cells [kg] 421 421 421 421 421
Cell [g] 650 650 650 650 650
Cell [Ah] 25 25 25 25 25
Cell [Wh] 95 95 95 95 95
Cell [V] 3.8 3.8 3.8 3.8 3.8
SOC controllers [kg] 1.73 1.73 1.73 1.73 5.18
BMS [kg] 4 4 4 4 4
Connects Cu [kg] 2.3 2.3 2.3 2.3 1.93
Terminals Cu [kg] 1.5 1.5 1.5 1.5 1.52
Steel plates and straps [kg] 3.53 3.53 3.53 20.1 3.53
ESS case [kg] 47.1 102.15 102.15 102.15 47.1
Module house [kg] 14.1 40.7 14.1 27.1 14.1
Thermal conductor (Al) [kg] 31.9 31.9 31.9 31.9 31.9
Coolant [kg] 10.8 10.8 10.8 10.8 10.8
Thermal insulation [kg] 48.5 - - - 48.5
110

Vehicle and driving parameters
Table A.6: Average data collected for the driving phase, vehicle data, distances. Fuel consumption and
electric consumption are intended for all electric driving and all diesel mode driving. The data derives
from calculations, literature and personal communication in 2013.
PHEV Bus - Parallel hybrid Reference or Personalconfiguration, regenerative braking Data communication (PC)
Max weight 19000 kg [Volvo Buses 2013a]
Average weight 14500 kg (estimate) Johan Johansson
Curb weight 12000 kg (estimate) Johan Hellsing
Max passengers 90 [Volvo Buses 2013a]
Average passengers 33 Calculation
ICE Volvo D5K Volvo Buses5 l240 hp
Average load diesel consumption 0.31 l/km (estimate) Johan Johansson
Standard bus average load diesel consumption 0.5 l/km (estimate) Johan Johansson
Urea consumption (all buses) 5.7 v% (estimate) Lisbeth Dahllof
Average load electricity consumption 1.5 kWh/km (estimate) Pontus Enhager
Electric efficiency grid to wheel 0.71 (estimate) Edward Jobson
Battery efficiency 0.92 (estimate) Edward Jobson
Diesel efficiency tank to wheel 0.30 (estimate) Pontus Enhager
Electric mode 80 % (estimate) Edward Jobson
Driving distance per year 120000 km/year Calculation
Approximate driving cycle Braunshweig city driving cycle [Barlow et al. 2009]
Average driving speed 21 km/h Estimate
Service time per day 16 h/year Estimate
Service days per year 350 d/year Estimate
Vehicle life 9 years (estimate) Jens Groot
Batteries per bus 3 batteries (estimate) Jens Groot
EM max power 150 kW [Volvo Buses 2013a]
Battery SOC window 40 % (estimate) Jens Groot
LFP battery available capacity 16 kWh Calculation
LFP battery total capacity 40 kWh Calculation
NMC battery available capacity 24 kWh Calculation
NMC battery total capacity 60 kWh Calculation
111

Reuse options on a system level
Table A.7: Options of system levels for reuse or second life and remanufacturing. The table illustrated
how different components can be reused (marked with x) or have the need to be changed in different
combination. Depending on the state of health of different battery components one of the 16 scenarios
is possible for reuse of second life.
Reuse Batteryscenarios ESS pack Module Cell
1 x x x x2 x x x change3 x x change change4 x change change change5 change change change change6 x change x x7 x change change change8 x x change x9 change x change change
10 change x x change11 change x change x12 change x x x13 change change x x14 change change x change15 change change change x16 change change change change
112

Supporting figures - Results
The following figures are the complete graphical representation of the results presented inchapter 5. All scenarios and impact categories are included.
Figure A.1: The impact of the different components of the different cell chemistries is shown. The impact
categories represented are energy use, global warming potential, abiotic depletion potential of elements
and fossil fuels, acidification potential, eutrophication potential, human toxicity potential, photochemical
ozone creation potential. The electrodes can be seen to have the largest single impact.
113

Figure A.2: The impact of the different components of the positive electrode is shown, for different cell
chemistries and production paths. The impact categories represented are energy use, global warming
potential, abiotic depletion potential of elements and fossil fuels, acidification potential, eutrophication
potential, human toxicity potential, photochemical ozone creation potential. The foils and active
materials dominate, but the relative contributions vary.
114
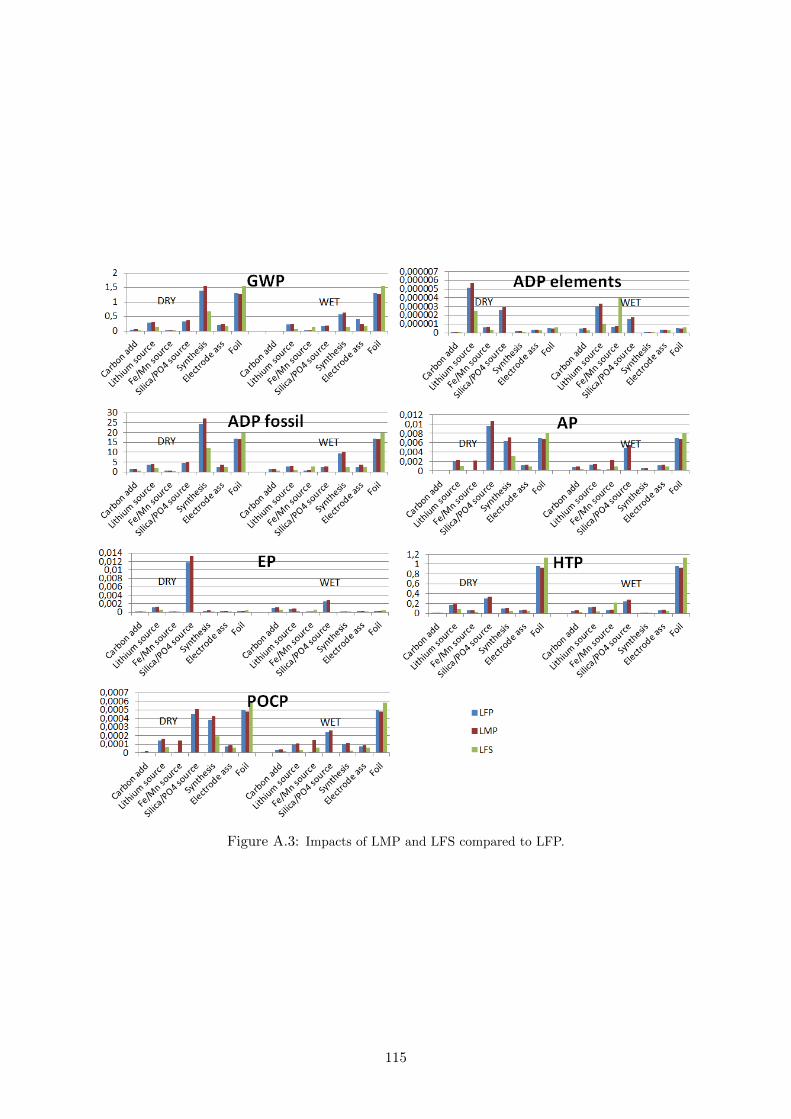
Figure A.3: Impacts of LMP and LFS compared to LFP.
115

Figure A.4: Material choices and impacts per component of battery pack design alternatives with and
with out reuse for LFP. The first 1-5 designs are shown with normal conditions, design 5-8 are the same
as the first 4 but with highest possible reuse rate of passive components. Design 9 and 10 are equally
configured as Design1, but the design 9 with extra large fit of cells in modules, and the last design 10
with two packs of 20 kWh coupled to one ESS of 40 kWh. For exact material composition see figure A.4
116

Figure A.5: Material choices and impacts per component of battery pack design alternatives with 40%
reuse of cells and with and without reuse of passive components. The first 1-5 designs are shown with
normal use conditions, design 5-8 are the same as the first 4 but with highest possible reuse rate of
passive components. Design 9 and 10 are equally configured as Design1, but the design 9 with extra
large fit of cells in modules to simulate LFP cells in a pack designed for NMC cells, and the last design
10 with two packs of20 kWh coupled to one ESS of 40 kWh. For exact material composition see table
A.4 in chapter 4.
117

Figure A.6: Material choices and impacts per component of LFP battery pack design alternatives with
and with out reuse. The PCB chosen has a higher gold content than usual. The first 1-5 designs are
shown with normal use conditions, design 5-8 are the same as the first 4 but with highest possible reuse
rate of passive components. Design 9 and 10 are equally configured as Design1, but the design 9 with
extra large fit of cells in modules, and the last design 10 with two packs of 20 kWh coupled to one ESS
of 40 kWh. For exact material composition see table A.4 in chapter 4.
118

Figure A.7: Material choices and impacts per component of NMC battery pack design alternatives with
and with out reuse. The first 1-5 designs are shown with normal conditions, design 5-8 are the same
as the first 4 but with highest possible reuse rate of passive components. Design 9 and 10 are equally
configured as Design1, and Design 2 but for 3 parallel connections on module level. For exact material
composition see table A.5 in chapter 4.
119

Figure A.8: Material choices and impacts per component of NMC battery pack design alternatives with
and with out reuse. The first 1-4 designs are shown with normal design conditions for the all aluminium
pack, design 5-10 are the same as the design1, but with increased amount of cooling plate material
gradually from 84 kg to 181 kg. For exact material composition see table A.5 in chapter 4.
120

Impact per kg for different cell components
The data in the following figure can be used as reference if different wt% of the components areused compared to the values in this thesis.
Figure A.9: The relative contribution of one kg of each of the cell components in given. The figure
illustrates what components inherently impact what categories, independent on how much is used in the
cell.
121