life cycle assessment of newly manufactured and
TRANSCRIPT

Life Cycle Assessment of Newly
Manufactured and Reconditioned
Industrial Packaging
REVISED VERSION
October 2015

© October 2015 Rotterdam, The Netherlands Client Reusable Industrial Packaging Association
Paul W. Rankin Study performed by Ernst & Young Accountants LLP Eelco Rietveld
Lonneke de Graaff Alexander van der Flier

Table of contents
1. Introduction .................................................................................................................. 3
2. Goal and scope .............................................................................................................. 4
2.1 Goal ........................................................................................................................ 4
2.2 Functional unit ......................................................................................................... 4
2.3 The product systems ................................................................................................ 4
2.4 System boundary ..................................................................................................... 5
2.5 Impact assessment method ....................................................................................... 6
3. Life cycle inventory ........................................................................................................ 8
3.1 Inbound transport .................................................................................................... 8
3.2 Manufacturing ......................................................................................................... 8
3.3 Reconditioning ........................................................................................................ 9
3.4 Inbound transport .................................................................................................... 9
3.5 End of life ................................................................................................................ 9
4. Results ....................................................................................................................... 10
4.1 Carbon footprint: Open head steel drum ................................................................... 10
4.2 Carbon footprint: Tight head steel drum ................................................................... 12
4.3 Carbon footprint: Tight head plastic drum ................................................................ 13
4.4 Carbon footprint: IBC ............................................................................................. 14
4.5 Carbon footprint - results overview .......................................................................... 15
4.6 Environmental footprints ........................................................................................ 16
5. Conclusions ................................................................................................................. 20
Appendix A Inventory data ................................................................................................. 21
Appendix B Data overview reconditioning ............................................................................ 23
Appendix C Data overview newly manufactured packaging .................................................... 24
Appendix D Traci 2.1 .......................................................................................................... 25

1. Introduction
For nearly three-quarters of a century, the Reusable Industrial Packaging Association (RIPA) has been the trade association representing North American reconditioners, manufacturers and distributors of reusable industrial packaging. RIPA represents over 90% of the industrial packaging reconditioning industry in North America including many of the world’s leading manufacturers of steel, plastic and fiber drums, as well as intermediate bulk containers. The RIPA membership also includes many of the leading suppliers of packaging parts and accessories. As a condition of membership, all RIPA members agree to conform to a Code of Operating Practice, which sets forth specific guiding principles for operations, packaging reuse and recycling. These guidelines are intended to improve the industry’s performance in the areas of regulatory compliance, environmental management, waste reduction and recycling. RIPA is the industry’s information clearinghouse. The association sponsors workshops and meetings that provide information about issues of importance to the industry’s wellbeing and continued success. The group’s Annual Conference, Technical Conference and compliance workshops help ensure that members understand key issues affecting their businesses, and can learn about technical and business developments. The association publishes an industry newsletter, “Reusable Packaging Today,” and distributes Special Bulletins on issues of immediate concern to members. RIPA has requested EY to analyze the environmental performance of industrial packaging. What are the ecological impact differences of reconditioning as compared with manufacturing a drum or IBC from raw materials? This report presents the goal and scope of the study performed (chapter 2), the results (chapter 3) and conclusions of the study (chapter 4). This report is a revised version of the report that has been made in 2013. The changes can be summarized as follows:
- The drum made from post consumer plastic is placed out of scope. - Data modifications and improvements have been made in the input data for the LCA. - Improvements are made with an update of data, recalculations in the SimaPro model and
the LCA. The LCA calculation is improved, based on final data analysis October 2015. The details of the changes are described in Appendix D.

2. Goal and scope
This chapter of the report discusses the goal and scope of the study. The functional unit and the specific products are involved as well. It also discusses the choices concerning allocation, system boundaries and assessment method.
2.1 Goal
The primary goal of the study is a head to head comparison between a new packaging and a reconditioned packaging of similar technical specifications, resulting from a single trip and multi-trip industrial packaging solution.
2.2 Functional unit
The functional unit of the comparison are packaging units with capacities of 55, 275 or 330 gallons, which are used to transport chemicals or other substances. The packaging content of 55 gallons is used for drums and the packaging of 275 gallons and 330 gallons are used for IBCs. The production, transport to customer and the end of life are included in the functional unit. The functional flow is one unit of packaging.
2.3 The product systems
The following product systems are part of the scope of the project:
Packaging type Content New Reconditioned
IBC 275 US Gal 330 US Gal
Steel pallet Steel pallet
Steel drum 55 US Gal Tight head Open head
Tight head Open head
Plastic drum 55 US Gal Tight head (virgin plastic)
Tight head
IBC An IBC has a 275 or 330 gallon volume polyethylene bottle which will contain the product during use. The bottle is inside a steel tube cage. The analyzed systems have a steel pallet. Steel drum A steel drum is completely made out of steel sheet, with an outside coating applied later in the process. The drum is manufactured as an open - or tight head. The top of the tight head is seamed to the body and only two small openings remain for filling and emptying the drum. The lid of the open head can be removed from the rest of the drum for filling. Lid and drum body are assembled with a bolt or clamp ring. Open head steel drums also utilize a plasticized gasket to facilitate proper closure. Plastic drum A plastic drum is made out of high density polyethylene (HDPE). The plastic used is a mix of virgin and recycled plastic. The tight head plastics drum is one piece blow molded. It has two small openings for filling and emptying the drum.

Collection process It is normal practice to collect drums and IBCs from users who have emptied the packaging. The drums and IBC’s are collected by truck and transported to a reconditioning facility. There, they are reconditioned as explained above and sold to customers again.
2.4 System boundary
The system boundary determines the unit processes included or excluded in each life cycle of the product system. One life cycle has connections with other life cycles. This is for instance the case with the life cycle of a packaging and the life cycle of the content of the packaging. Another example is the use of recycled materials that originate from another life cycle. It is important to determine and show which processes will be included, how they are included and also which will be excluded. This is essential for the interpretation of the results and conclusions of the study. Below a process flow diagram is presented, which provides an overview of the flow of the processes in the system. The boxes with the dotted lines are not included in the life cycles of the product systems.
Upstream Processes
Production raw
materials/ energy
Production of
drum/IBC
Reconditioning
Filling of
packaging
Use of
packaging
End of life
Production process
materials / energy*
Recycling
Core Processes
Downstream Processes
Inbound transport
Outbound transport
Figure 1 Schematic representation of the system boundary of the life cycle assessment
* Upstream processes involved in the reconditioning only reflect materials needed for washing (like e.g. caustic soda) and nothing of
the packaging materials themselves.

Allocation and recycling System boundaries are also set in the life cycle to determine the allocation of burdens and benefits regarding recycling. For instance, scrap is the output from the life cycle of steel drums and is used in another life cycle of perhaps a steel clamp ring of a drum. The boundary between the two life cycles should be set and be consistent throughout the whole study. The benefit of recycling should not be claimed twice. This happens if a benefit is provided to the drum that is scrapped and to the clamp ring that uses the scrap. The system boundary is set before the use of the recycled material by products downstream that has been provided by the products in this study. The benefits of providing materials for recycling are therefore not deducted from the burdens but also the burdens of the recycling process (for instance the scrapping process) are not taken into account here. The recycled content of steel is set at the amount of steel that is recycled at the end of life. The reason of this choice is that steel is a closed loop material: it is possible to recycle steel an indefinite number of times. The limit is the steel that is kept in the loop and is recycled in the end of life phase. Some recycling plants, as in energy recovery facilities, generate electricity and heat. This benefit is included in the national electricity mixes. This benefit is therefore allocated to the use of electricity and not to the material and product generating the energy when incinerated. Drums and IBCs for collection Each reconditioned drum or IBC was once newly manufactured. The drums and IBCs are collected after use by the reconditioning party. The impact of the newly manufactured drum is not included in any way in the life cycle of the reconditioned drum.
2.5 Impact assessment method
The focus of the study is on the emission of greenhouse gasses (GHG), which influences global warming. There are many different gasses that have this potential for global warming, but this potential is different for each gas. To be able to add up all these potentials, the global warming potential (GWP) of a substance is related to the GWP of carbon dioxide. Methane, for instance has a 25 time higher GWP than carbon dioxide, its conversion factor is therefore 25. To add up 1 kg of methane and 1 kg of carbon dioxide the amount of methane emitted is multiplied with 25 and then added to the amount of carbon dioxide emitted. This results in a total GWP equivalent to 26 kg carbon dioxide or CO2e in this case. Besides global warming there are other environment issues, for instance ozone depletion, toxicity, resource depletion. The results of this study will therefore be complemented with the results of several other impact categories as well. The impact potentials are calculated in these impact categories in a similar way as the GWP of the climate change calculated as explained above. There are different impact assessment methods that have determined conversion factors for the impact categories. In this study the method Traci 2.1 , version 1.02 with normalization and weighting set US-Canadian 2008 is used. This is a method that is developed specifically for the North American continent. More information about this method can be found in Appendix E. The impact categories in Table 1 are included in the analysis.

Table 1 Impact categories of Traci 2.1
Impact category Unit
Climate change Lbs CO2e
Ozone depletion Lbs CFC-11e
Acidification Lbs SO2e
Eutrophication Lbs Ne
Smog Lbs O3e
Carcinogenics CTUh
Non carcinogenics CTUh
Respiratory effects Lbs PM 2.5e
Ecotoxicity CTUe
Fossil fuel depletion MJ surplus
The main focus is on climate change, the other impact categories are discussed more briefly.

3. Life cycle inventory
The inventory data can be divided in foreground and background data. The foreground data are the core processes of the figures in and concerns processes like energy use of production and material use. This data is collected using questionnaires send to members of RIPA. The background data are the upstream and downstream processes of the figures in 3.4.1 and concerns processes like energy production, raw material production, resource extraction etc. A specific database for the US will be used: USLCI database1. This database contains processes specific for the production processes and circumstances in the USA. Data gaps are filled with data from the database Ecoinvent 32, the most up-to-date and large LCA database available.
3.1 Inbound transport
The raw materials and the drums and IBC to be reconditioned need to be transported to the manufacturing or reconditioning facility. The inbound transport is set at 200 miles, these materials are typically purchased within this distance from the facility. The transport of drums and IBCs to be reconditioned is dependent on the size of the packaging, the size of the truck, the distance to the client and the number of drums or IBCs to be delivered. The number of 55 gallon drums per truck load is set at 250, the number of 275 gallon IBCs per truckload is set at 60, the number of 330 gallon IBCs per truckload is set at 50.
3.2 Manufacturing
Ten manufacturers of drums and IBCs have responded to a request to provide data about the production of the manufacturing of both drums and IBCs. This resulted in data from sixteen different production lines, some manufacturers provided data of multiple lines. The database processes used and the assumptions used are presented in Appendix A. The inventory per manufacturer is confidential information, only the averages per packaging type are presented, see Appendix C The main dimensions of the different packaging types are presented below. Steel drum
Steel sheet thickness (mm) Top/body/bottom
Tight head Steel weight (lbs.)
Open head Steel weight (lbs.)
1.2/1.2/1.2 44.8 47.5
1.0/1.0/1.0 37.7 42.3
1.2/0.9/1.2 36.7 40.8
1.1/0.9/1.1 35.6 40.0
1.1/0.8/1.1 33.5 37.8
1.0/0.8/1.0 32.9 35.5
0.8/0.8/0.8 31.0 33.3
IBC – composite, steel pallet
IBC type Steel weight (lbs.)
Virgin plastic weight (lbs.)
Recycled plastic weight (lbs.)
275 gallon IBC 80.4 41.8 5.3
330 gallon IBC 96.5 50.2 6.4

Plastic drum – tight head
IBC type plastic weight PE-mix (lbs.)
55 gallon plastic 21
The material PE-mix is based on an average use of 11.16 lb virgin plastic and 9.81 lb recycled plastic. In other words, 53% virgin and 47% recycled material.
3.3 Reconditioning
Sixteen reconditioning facilities responded to a request to provide data about the production of the reconditioning of both drums and IBCs. This resulted in data from nineteen different reconditioning lines, some reconditioners provided data of multiple lines. The aggregated data of the reconditioning is presented in Appendix B.
3.4 Outbound transport
The manufactured (both new and reconditioned) drums and IBC need to be transported to the client. The outbound transport is set at 200 miles, the truck load is set equal to the truckload of the inbound transport.
3.5 End of life
No direct data of the end of life statistics of industrial packaging is available. The statistics of Municipal solid waste (MSW) are used as proxy data. The recycling percentage of the plastic and steel is obtained from the EPA3. The remaining waste is either incinerated or landfilled. This ratio is also based on EPA as included in the end of life scenario of the USA.
Recycling percentage of Plastics: 12.9%a. Recycling percentage of steel: 72%
b.
a From MSW category: Total Plastics in Cont. & Packaging
b From MSW category: Containers and Pack aging – Total steel packaging

4. Results
This chapter presents the results of the life cycle assessment. The results of the analysis of the carbon footprint of the open head steel drum, tight head steel drum, tight head plastic drum and IBC are discussed in the first four paragraphs and an overview of the results is presented in the fifth paragraph. The sixth paragraph discusses other impact categories like ozone depletion and ecotoxicity.
4.1 Carbon footprint: Open head steel drum
Figure 2 shows the head to head comparison of the life cycle of a newly manufactured drum and a reconditioned drum. The outbound transport and end of life of both systems is assumed to be the same. The differences are in the raw materials, inbound transport and the production/reconditioning process. The raw materials of the reconditioning process concern materials like steel shot that are used in the process but it also includes inner lining and coatings. The figure shows that the GHG-emissions of the life cycle of a reconditioned drum are almost one third of the GHG-emissions of a newly manufactured open head steel drum.
Figure 2 Comparison of carbon footprint between newly manufactured open head steel drum with the reconditioned open head steel drum
Open head steel drum – 1.2/0.9/1.2 – carbon footprint (lbs CO2e)
Raw materials
Inbound transport
Production/reconditioning process
Outbound transport
End of life Total (lbs CO2e)
New 66.26 1.59 11.22 2.91 0.35 82.3
Reconditioned 3.59 2.91 18.4 2.91 0.35 28.2
0,00
10,00
20,00
30,00
40,00
50,00
60,00
70,00
80,00
90,00
New Reconditioned
GH
G-e
mis
sio
n (
lbs
CO
2e
)
Open head steel drum 1.2/0.9/1.2
End of life
Outbound transport
Production/reconditioningprocess
Inbound transport
Raw materials

Open head steel drums are manufactured with steel sheet of different thicknesses, from 0.8 to 1.2 mm. Figure 3 shows an overview of the GHG-emission of the different open head steel drums.
Figure 3 Comparison of the carbon footprint between open head steel drums with different thickness steel sheet. The codes refer to the
thickness of the steel sheet: bottom/body/top
Figure 3 shows the expected results that the drums with the thinner sheet have lower GHG-emissions than the drums with thicker steel sheet. It should be stressed that the drums with thicker sheet can be reconditioned and can be reconditioned more often. The comparison with the reconditioned drum shows that the possibility of reconditioning the drums with thicker steel sheets outweighs the reduced impact of the drums with thinner steel sheet.
70 74 85
77 81 82 93
0
10
20
30
40
50
60
70
80
90
100
GH
G-e
mis
sio
ns
(lb
s C
O2
e)
Steel open head
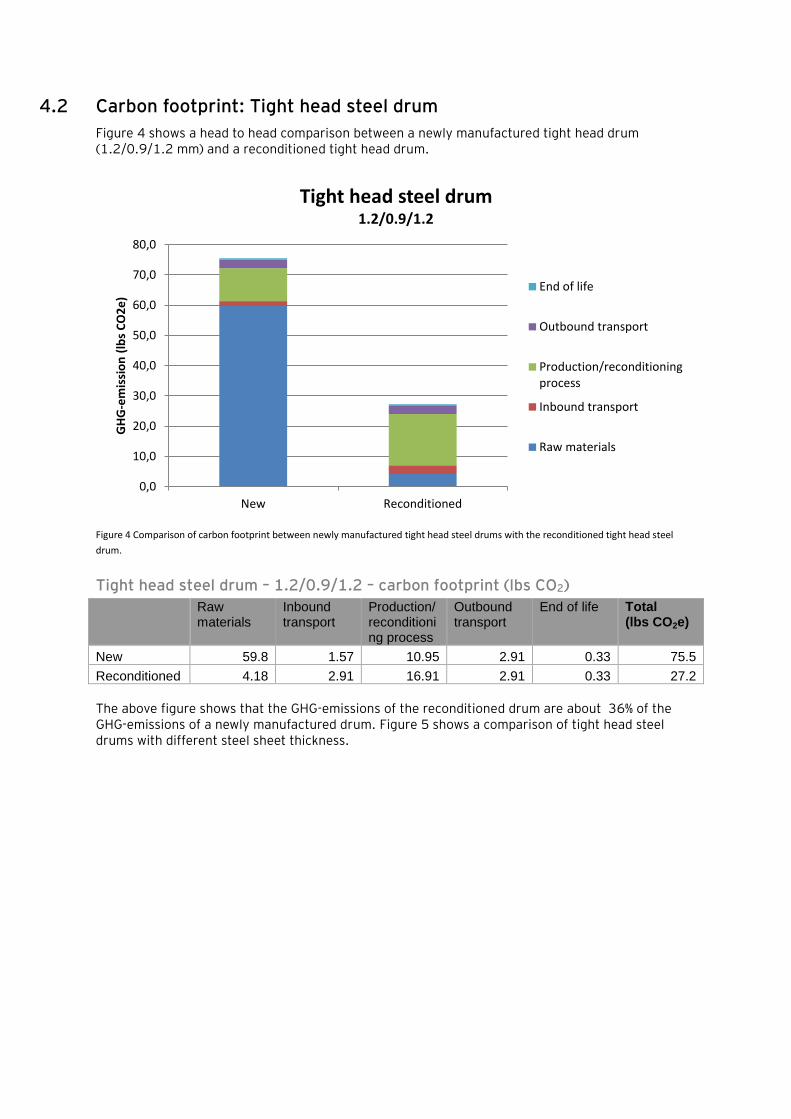
4.2 Carbon footprint: Tight head steel drum
Figure 4 shows a head to head comparison between a newly manufactured tight head drum (1.2/0.9/1.2 mm) and a reconditioned tight head drum.
Figure 4 Comparison of carbon footprint between newly manufactured tight head steel drums with the reconditioned tight head steel
drum.
Tight head steel drum – 1.2/0.9/1.2 – carbon footprint (lbs CO2)
Raw materials
Inbound transport
Production/reconditioning process
Outbound transport
End of life Total (lbs CO2e)
New 59.8 1.57 10.95 2.91 0.33 75.5
Reconditioned 4.18 2.91 16.91 2.91 0.33 27.2
The above figure shows that the GHG-emissions of the reconditioned drum are about 36% of the GHG-emissions of a newly manufactured drum. Figure 5 shows a comparison of tight head steel drums with different steel sheet thickness.
0,0
10,0
20,0
30,0
40,0
50,0
60,0
70,0
80,0
New Reconditioned
GH
G-e
mis
sio
n (
lbs
CO
2e
)
Tight head steel drum 1.2/0.9/1.2
End of life
Outbound transport
Production/reconditioningprocess
Inbound transport
Raw materials

Figure 5 Comparison of the carbon footprint between tight head steel drums with different thickness steel sheet. The codes refer to the
thickness of the steel sheet: bottom/body/top.
The figure above shows a difference of 25% in GHG-emission between the lightest and heaviest drum.
4.3 Carbon footprint: Tight head plastic drum
Figure 6 shows a comparison between the life cycle of a newly manufactured tight head plastic drum and a reconditioned drum. There is a small advantage of using a reconditioned drum. For reconditioning more energy is required in the processing, but this is compensated by the benefits of not using new plastic PE-mix.
Figure 6 Comparison of carbon footprint between newly manufactured drums made from plastic PE-mix and the reconditioned drum
66 69 77
70 73 76 88
0
10
20
30
40
50
60
70
80
90
100
GH
G-e
mis
sio
ns
(lb
s C
O2
e)
Steel tight head
0,0
10,0
20,0
30,0
40,0
50,0
60,0
plastic PE-mix Reconditioned
GH
G-e
mis
sio
n (
lbs
CO
2e
)
Tight head plastic drum
End of life
Outbound transport
Production/reconditioningprocess
Inbound transport
Raw materials

Tight head plastic drum – carbon footprint (lbs CO2)
Raw materials
Inbound transport
Production/reconditioning process
Outbound transport
End of life Total (lbs CO2e)
Plastic PE-mix 22,4 0,8 15,1 2,9 12,8 54,1
Reconditioned 0,9 2,9 30,0 2,9 12,8 49,5
What would have happened if the plastic drum was not reconditioned? Would the plastic have been incinerated? Reconditioning avoid emissions that would have been caused by the disposal. These avoided emissions are not taken into account but are a benefit of reconditioning.
4.4 Carbon footprint: IBC
Figure 7 shows a comparison between the life cycles of newly manufactured IBCs and reconditioned IBCs. The benefit of reconditioning an IBC is substantial. The GHG-emissions of reconditioned IBCs are less than a third of the GHG-emissions of newly manufactured IBCs.
Figure 7 Comparison of carbon footprint between newly manufactured IBCs and the reconditioned IBCs with the sizes 275 and 330 lbs.
Intermediate bulk container (IBC) – carbon footprint (lbs CO2)
Raw materials
Inbound transport
Production/reconditioning process
Outbound transport
End of life Total
(lbs CO2e)
IBC 275 184,5 4,9 65,6 12,1 28,6 295,8
IBC 330 221,2 5,9 68,9 14,6 34,3 345,0
IBC 275
reconditioned 1,5 12,1 36,6 12,1 28,6 91,0
IBC 330
reconditioned 1,5 14,6 36,6 14,6 34,3 101,6
0,0
50,0
100,0
150,0
200,0
250,0
300,0
350,0
400,0
IBC 275 IBC 330 IBC 275reconditioned
IBC 330reconditioned
GH
G-e
mis
sio
n (
lbs
CO
2e
)
IBC Steel pallet 275 and 330
End of life
Outbound transport
Production/reconditioningprocess
Inbound transport
Raw materials

4.5 Carbon footprint - results overview
Overview of carbon footprint results
Category Type New (lbs CO2e)
Reconditioned (lbs CO2e)
Steel drum Open head 82.3 28.2
Tight head 75.5 27.2
Plastic drum Tight head
Plastic PE-mix 54.1 49.5
IBC 275 gallon 295.8 91.0
330 gallon 345.0 101.6

4.6 Environmental footprints
The emission of greenhouse gasses is not the only environmental issue. A comparison between
newly manufactured industrial packaging and reconditioned packaging with more environmental
topics are shown in the figures from
Figure 8 to Figure 12.
Figure 8 Comparison on multiple environmental issues between newly manufactured IBC and reconditioned IBC of 275 lbs.
0%
20%
40%
60%
80%
100%
120%
IBC 275 lbs.
New
Reconditioned
0%
20%
40%
60%
80%
100%
120%
IBC 275 lbs.
New
Reconditioned

Figure 9 Comparison on multiple environmental issues between newly manufactured IBC and reconditioned IBC of 330 lbs.
0%
20%
40%
60%
80%
100%
120%
IBC 330 lbs.
New
Reconditioned
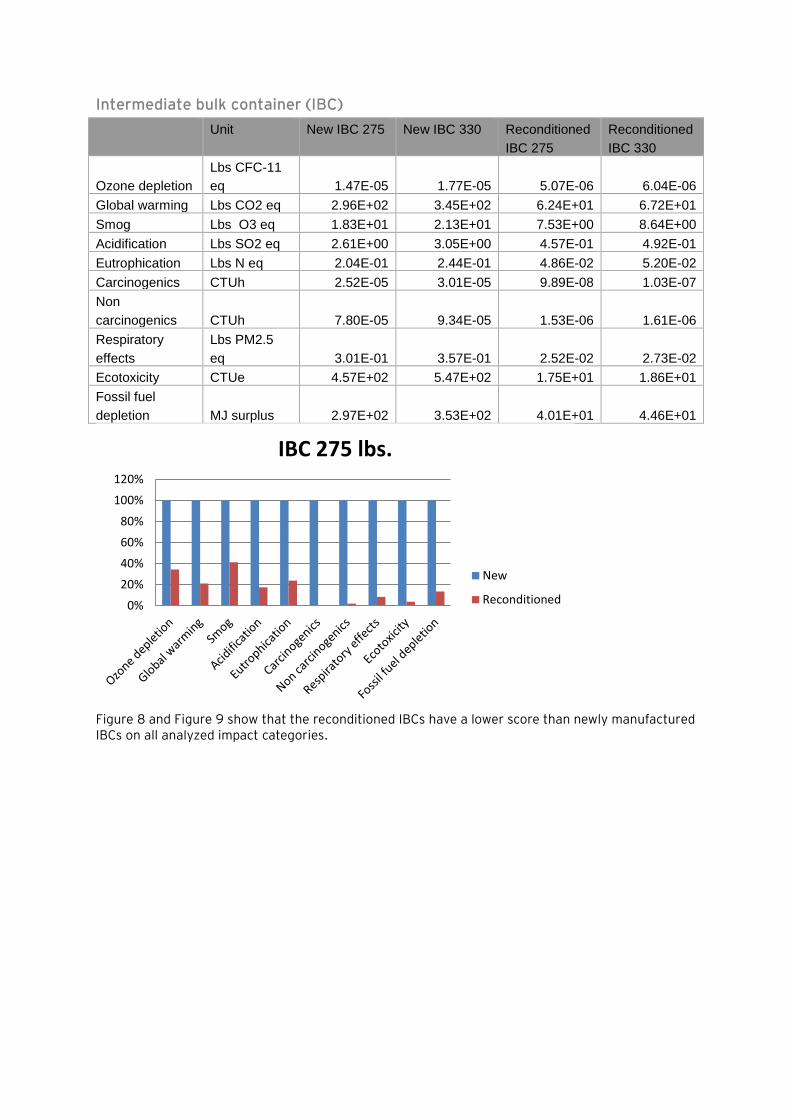
Intermediate bulk container (IBC)
Unit New IBC 275 New IBC 330 Reconditioned
IBC 275
Reconditioned
IBC 330
Ozone depletion
Lbs CFC-11
eq 1.47E-05 1.77E-05 5.07E-06 6.04E-06
Global warming Lbs CO2 eq 2.96E+02 3.45E+02 6.24E+01 6.72E+01
Smog Lbs O3 eq 1.83E+01 2.13E+01 7.53E+00 8.64E+00
Acidification Lbs SO2 eq 2.61E+00 3.05E+00 4.57E-01 4.92E-01
Eutrophication Lbs N eq 2.04E-01 2.44E-01 4.86E-02 5.20E-02
Carcinogenics CTUh 2.52E-05 3.01E-05 9.89E-08 1.03E-07
Non
carcinogenics CTUh 7.80E-05 9.34E-05 1.53E-06 1.61E-06
Respiratory
effects
Lbs PM2.5
eq 3.01E-01 3.57E-01 2.52E-02 2.73E-02
Ecotoxicity CTUe 4.57E+02 5.47E+02 1.75E+01 1.86E+01
Fossil fuel
depletion MJ surplus 2.97E+02 3.53E+02 4.01E+01 4.46E+01
Figure 8 and Figure 9 show that the reconditioned IBCs have a lower score than newly manufactured IBCs on all analyzed impact categories.
0%
20%
40%
60%
80%
100%
120%
IBC 275 lbs.
New
Reconditioned

Figure 10 Comparison on multiple environmental issues between newly manufactured open head steel drum and the reconditioned drum.
Steel drum open head – 1.2/0.9/1.2
Unit New drum Reconditioned drum
Ozone depletion Lbs CFC-11 eq 6.14E-06 1.72E-06
Global warming Lbs CO2 eq 8.23E+01 2.82E+01
Smog Lbs O3 eq 5.45E+00 2.23E+00
Acidification Lbs SO2 eq 4.86E-01 2.35E-01
Eutrophication Lbs N eq 9.14E-02 2.04E-02
Carcinogenics CTUh 1.26E-05 2.43E-07
Non carcinogenics CTUh 3.56E-05 5.86E-07
Respiratory effects Lbs PM2.5 eq 1.06E-01 1.48E-02
Ecotoxicity CTUe 1.61E+02 1.95E+01
Fossil fuel depletion MJ surplus 4.00E+01 2.67E+01
Figure 10 shows that the reconditioned open head steel drum scores better on all analyzed environmental issues.
0%
20%
40%
60%
80%
100%
120%
Envi
ron
me
nta
l im
pac
t (%
) Steel open head drum
New
Reconditioned

Figure 11 Comparison on multiple environmental issues between newly manufactured tight head steel drum and the reconditioned drum
Steel drum tight head – 1.2/0.9/1.2
Unit New drum Reconditioned drum
Ozone depletion Lbs CFC-11 eq 3.46E-06 2.32E-06
Global warming Lbs CO2 eq 7.16E+01 4.61E+01
Smog Lbs O3 eq 4.88E+00 3.39E+00
Acidification Lbs SO2 eq 4.29E-01 3.71E-01
Eutrophication Lbs N eq 6.35E-02 4.86E-02
Carcinogenics CTUh 1.14E-05 6.92E-07
Non carcinogenics CTUh 3.19E-05 1.59E-06
Respiratory effects Lbs PM2.5 eq 9.23E-02 2.61E-02
Ecotoxicity CTUe 1.44E+02 3.55E+01
Fossil fuel depletion MJ surplus 3.07E+01 3.20E+01
Figure 11 shows that the reconditioned tight head steel drum scores better on all analyses environmental issues.
0%
20%
40%
60%
80%
100%
120%
Envi
ron
me
nta
l im
pac
t (%
) Steel tight head drum
New
Reconditioned

Figure 12 Comparison on multiple environmental issues between newly manufactured drums made from PE-mix plastic and the
reconditioned drum
Plastic drum tight head
Unit PE-mix new
drum
Reconditioned
drum
Ozone depletion Lbs CFC-11 eq 1,01E-06 1,22E-06
Global warming Lbs CO2 eq 5,41E+01 4,64E+01
Smog Lbs O3 eq 3,09E+00 2,70E+00
Acidification Lbs SO2 eq 5,68E-01 2,81E-01
Eutrophication Lbs N eq 1,07E-02 8,06E-03
Carcinogenics CTUh 1,98E-07 5,31E-08
Non carcinogenics CTUh 2,23E-06 6,99E-07
Respiratory effects Lbs PM2.5 eq 3,23E-02 1,53E-02
Ecotoxicity CTUe 4,66E+01 1,40E+01
Fossil fuel depletion MJ surplus 6,88E+01 2,56E+01
The reconditioned plastic drum scores lower on most environmental issues than the newly manufactured drum. The exception is ozone depletion, which is mainly caused by the higher inbound transport and the higher energy use for processing of the drums to be reconditioned.
0%
20%
40%
60%
80%
100%
120%
140%
Envi
ron
me
nta
l im
pac
t (%
) Plastic tight head drum
Virgin new
Reconditioned

5. Conclusions
Reconditioning industrial packaging has environmental benefits compared with newly manufactured ones. The conclusions are discussed per packaging type below. Open head steel drum Reconditioning an open head steel drum instead of newly manufacturing it lowers the carbon footprint by a factor three. The impact of energy during the reconditioning process is the main contributor to the carbon footprint. Also all the other impact categories have a lower score for reconditioned drums than newly manufactured drums. Tight head steel drum For tight head steel drum we see the same benefit of reconditioning as we see for the open head steel drum. It brings the carbon footprint down to almost a third. Also all the other impact categories have a lower score for reconditioned drums than newly manufactured drums. Tight head plastic drum Reconditioning a tight head plastic drum reduces the carbon footprint about 15% if compared with a newly manufactured plastic drum. A reconditioned drum scores about three to four times better than a newly manufactured drum on several impact categories. The exception is ozone depletion because of the higher inbound transport and the higher energy use for processing of a reconditioned drum. IBC Reconditioning an IBC has a substantial benefit on the carbon footprint, it is brought back to 30% of the carbon footprint of a new IBC. Reconditioning has also a clear benefit on all the other analyzed impact categories. Reduction The environmental burden of the reconditioning process can be further reduced by energy reduction programs as the use of energy is the main contributor to the scores of the different impact categories analyzed. The depletion of fossil fuel of the reconditioned drum is higher than of a newly manufactured tight plastic drum. Green Packaging Calculator The inventory data is integrated in an Excel based calculator. The Green Packaging Calculator offers a three-step process by which the environmental impact of industrial packaging solutions, expressed in carbon dioxide (CO2) equivalents, may be determined. Calculated impacts enables RIPA members to select containers and understand the impact on the environment of such selections.

Appendix A Inventory data
Table XX: Comparable companies’ XYZ
Process Database Database process Notes
Carbon steel bars Ecoinvent 3 • Steel, low-alloyed {RoW}| steel production, electric, low-alloyed | Alloc Def, S
• Steel, low-alloyed {RoW}| steel production, converter, low-alloyed | Alloc Def, S
• Section bar rolling, steel {RoW}| processing | Alloc Def, S
72% is assumed to be from electric steel and 28 % is assumed to be from converter steel.
Carbon steel sheet Ecoinvent 3 • Steel, low-alloyed {RoW}| steel production, electric, low-alloyed | Alloc Def, S
• Steel, low-alloyed {RoW}| steel production, converter, low-alloyed | Alloc Def, S
• Hot rolling, steel {RoW}| processing | Alloc Def, S
72% is assumed to be from electric steel and 28 % is assumed to be from converter steel.
EPDM gaskets Ecoinvent 3 • Synthetic rubber {RoW}| production | Alloc Def, S
• Injection moulding {RoW}| processing | Alloc Def, S
Virgin HDPE - injection moulded
USLCI Ecoinvent 3
• High density polyethylene resin, at plant/RNA
• Injection moulding {RoW}| processing | Alloc Def, S
Dummy processes of USLCI replaced with Ecoinvent 3 processes
Virgin HDPE pellets USLCI • High density polyethylene resin, at plant/RNA
Dummy processes of USLCI replaced with Ecoinvent 3 processes
Paint solvent Ecoinvent 3 • Chemical, organic {GLO}| production | Alloc Def, S
Acetone Ecoinvent 3 • Acetone, liquid {RER}| production | Alloc Def, S
MEK Ecoinvent 3 • Methyl ethyl ketone {GLO}| market for | Alloc Def, S
Aromatic solvents Ecoinvent 3 • Toluene, liquid {RER}| production | Alloc Def, S
HCl Ecoinvent 3 • Hydrochloric acid, without water, in 30% solution state {RER}| market for | Alloc Def, S
Sodium hydroxide pellets
USLCI • Sodium hydroxide, production mix, at plant/kg/RNA
Sodium nitrite Ecoinvent 3 • Chemical, inorganic {GLO}| production | Alloc Def, S
Steel shot Ecoinvent 3 • Steel, low-alloyed, hot rolled {RER}| production | Alloc Def, S
• Metal working, average for metal product manufacturing {RER}| processing | Alloc Def, S
Exterior coating Ecoinvent 3 • Alkyd paint, white, without water, in 60% solution state {RER}| alkyd paint production, white, water-based, product in 60% solution state

| Alloc Def, S
Interior Lining USLCI • High density polyethylene resin, at plant/RNA
Dummy processes of USLCI replaced with Ecoinvent 3 processes
Natural gas USLCI • Natural gas, combusted in industrial boiler/US
Diesel USLCI • Diesel, combusted in industrial equipment/US
Propane gas USLCI • Liquefied petroleum gas, combusted in industrial boiler/US
Tap water USLCI • Tap water, at user/RER S
Electricity USLCI • Electricity, at grid, US/US Dummy processes of USLCI replaced with Ecoinvent 3 processes
Truck transport per mile
Ecoinvent 2.2 • Operation, lorry >16t, fleet average/RER S
Truck transport per lbs*mile
Ecoinvent 2.2 • Transport, lorry >16t, fleet average/RER S
Injection moulding Ecoinvent 3 • Injection moulding {RoW}| processing | Alloc Def, S
Welding Ecoinvent 3 • Welding, arc, steel {RoW}| processing | Alloc Def, U without energy
Waste water Ecoinvent 3 • Wastewater, average {RoW}| treatment of, capacity 5E9l/year | Alloc Def, S
Other waste Ecoinvent 3 • Municipal solid waste (waste treatment) {GLO}| market for municipal solid waste | Alloc Def, S
Paint waste Ecoinvent 3 • Waste paint {RoW}| treatment of waste paint, municipal incineration | Alloc Def, S
Furnace ash Ecoinvent 3 • Ash from deinking sludge {RoW}| treatment of, residual material landfill | Alloc Def, S
Sludge Ecoinvent 3 • Inert waste {RoW}| treatment of, sanitary landfill | Alloc Def, S
Solid waste Ecoinvent 3 • Municipal solid waste {RoW}| market for | Alloc Def, S
Trash Ecoinvent 3 • Municipal solid waste {RoW}| market for | Alloc Def, S
Remaining waste SimaPro 8 • Curb side collection (waste scenario) {US}| treatment of waste | Alloc Def, S

Appendix B Data overview reconditioning
Average IBC Average OH steel
Average TH steel Average poly
Electricity kWh 14.04 2.91 3.61 8.56
Natural gas cuft 43.69 89.70 68.93 80.71
Diesel gallon 0.0096
Water gal 32.97 1.08 6.86 13.91
NaOH Pellets lbs 0.27 0.20 0.23
HCl 100% lb 0.30
Sodium nitrite Lbs 0. 0065
Steel shot ton 0.000046 0.00018
Weight exterior coating lb 0.47 0.36 0.00022
Weight lining lb 0.32
Paint usage solvent gallon 0.0029 0.00129
Weight acetone lbs 0.49 0.0090 0.28
Weight aromatic solvents lbs 0.0053
Waste water gal 61.73 0.25 0.95 12.38
Sludge ton 0.017 0.000038 0.02
Furnace ash ton 0.000053
Solid waste generated ton 0.00407 0.00100 0.000498 0.00138
Trash generated ton 0.00117 0.00074 0.0002973 0.00123
Shot dust ton 0.000082 0.0001209
Paint Waste Lbs 0.00371 0.0486
Scrap steel Lbs 23.01 4.67 0.534
Scrap plastic Lbs 39.98 0.22 17.95
Other Lbs 0.19

Appendix C Data overview newly manufactured packaging
IBC 275 OH steel 1.2/0.9/1.2
TH steel 1.2/0.9/1.2
Plastic tight head
Electricity kWh 28.1 2.35 2.33 8.69
Natural gas Cuft 0.325 43.6 43.1 1.1
Propane gas Lbs. 0.081 0.0123 0.00617 0.00248
Tap water Gal 0.667 5.12 5.12
Aceton – MEK gal 0.0197 0.00987
HCl solution 50% Gal 0.000011 0.000011
Caustic solution 50% Gal 0.000027 0.000027
Injection moulded PE Oz 6
EPDM gasket Oz 1
Welding inch 37 36 36
Exterior coating Lbs. 0.3025 0.3025
Virgin PE Lbs. 41.8
PCR Lbs. 5.33
PE-mix Lbs 21
Carbon steel sheet Lbs. 43,6 40.2
Carbon steel bars Lbs. 80.4

Appendix D Data changes
In this study, the following changes have been made in comparison with the 2013 study titled ‘Life
Cycle Assessment of Newly Manufactured and Reconditioned Industrial Packaging’ © January 2014
by Eelco Rietveld and Sander Hegger:
1. All information on the use of 100% recycled plastic is removed. The references to the
comparison between the single trip reconditioned drum versus the single trip recycled
plastic drum is removed.
2. It appeared that the companies use a mix of recycled and virgin plastic to create a new
drum. The average mix is calculated, which leads to a material PE-mix, consisting of 53%
virgin and 47% recycled material.
3. Where LDPE was chosen in the first study, now HDPE is used.
4. For all products inbound transport is set at 200 mile
5. For New TH steel drums the ‘units sold’ of facility 2 and 3 is included in the data
calculations. This causes a lower average use of energy, natural gas and water and results
in a lower environmental impact.
6. The redundancy in the data for new OH and TH steel drums is removed. In detail this means
that for TH steel drums the data of ‘Manufacturing of 55-Gallon Tight Head Steel Drums-
COI’ is removed and for OH steel drums the data of ‘Manufacturing of 55-Gallon Open Head
Steel Drums GSD’ is removed. This results in a slightly higher energy use, which leads to a
slightly higher environmental impact compared to the former study.
7. Some background processes for the waste treatment were not updated in SimaPro. We had
to choose new processes. The effect on the environmental impact is small.

Appendix E Traci 2.1
The Tool for the Reduction and Assessment of Chemical and other environmental Impacts (TRACI), a stand-alone computer program developed by the U.S. Environmental Protection Agency specifically for the US using input parameters consistent with US locations. Site specificity is available for many of the impact categories, but in all cases a US average value exists when the location is undetermined. TRACI facilitates the Characterization of environmental stressors that have potential effects, including ozone depletion, global warming, acidification, eutrophication, tropospheric ozone (smog) formation, ecotoxicity, human health criteria– related effects, human health cancer effects, human health non-cancer effects, fossil fuel depletion, and land-use effects. TRACI was originally designed for use with life-cycle assessment (LCA), but it is expected to find wider application in the future. TRACI is a midpoint oriented life cycle impact assessment methodology, consistently with EPA’s decision not to aggregate between environmental impact categories. It includes classification, characterization and normalization.
Characterization
Impact categories were characterized at the midpoint level for reasons including a higher level of societal consensus concerning the certainties of modelling at this point in the cause-effect chain. Research in the impact categories was conducted to construct methodologies for representing potential effects in the United States. TRACI is a midpoint oriented LCIA method including the following impact categories: • Ozone depletion • Global warming • Smog • Acidification • Eutrophication • Carcinogenics • Non carcinogenics • Respiratory effects • Ecotoxicity • Fossil fuel depletion
Normalization
Morten Rybert from the Technical University of Denmark calculated normalization factors for the US and US + Canada. Data from 2008 and 2005 combined with 2008 was used for these reference geographies, respectively. A manuscript is now being prepared for publication at the International Journal of LCA.
References
Bare, J.; Gloria, T.; Norris, G. 2006. Development of the Method and U.S. Normalization Database for Life Cycle Impact Assessment and Sustainability Metrics. Environ Sci Techol 40 (16): 5108-5115.
Bare, J.C.; Norris, G.A.; Pennington, D.W.; McKone, T. 2003. TRACI: The Tool for the Reduction and Assessment of Chemical and Other Environmental Impacts. Journal of Industrial Ecology. http://mitpress.mit.edu/journals/pdf/jiec_6_3_49_0.pdf
Frischknecht, R.; Jungbluth, N.; Althaus, H.J.; Doka, G.; Dones, R.; Hischier, R.; Hellweg, S.; Humbert, S.; Margni, M.; Nemecek, T.; Spielmann, M. 2007. Implementation of Life Cycle Impact Assessment Methods: Data v2.0. ecoinvent report No. 3, Swiss centre for Life Cycle Inventories, Dübendorf, Switzerland

1 See http://www.nrel.gov/lci/ 2 See http://ecoinvent.ch/ 3 Municipal Solid waste in the United States – 2011 Facts and Figures. United States Environmental
Protection Agency; Office of Solid Waste (5306P) EPA530-R-13-001 May 2013; www.epa.gov