life cycle assessment of soybean-based biodiesel in ... cycle... · life cycle assessment of...
TRANSCRIPT
RENEWABLE RESOURCES • CASE STUDY
Life cycle assessment of soybean-based biodieselin Argentina for export
Luis Panichelli & Arnaud Dauriat & Edgard Gnansounou
Received: 23 April 2008 /Accepted: 13 November 2008# Springer-Verlag 2008
AbstractBackground, aim and scope Regional specificities are a keyfactor when analyzing the environmental impact of abiofuel pathway through a life cycle assessment (LCA).Due to different energy mixes, transport distances, agricul-tural practices and land use changes, results can signifi-cantly vary from one country to another. The Republic ofArgentina is the first exporter of soybean oil and meal andthe third largest soybean producer in the world, andtherefore, soybean-based biodiesel production is expectedto significantly increase in the near future, mostly forexportation. Moreover, Argentinean biodiesel producerswill need to evaluate the environmental performances oftheir product in order to comply with sustainability criteriabeing developed. However, because of regional specific-ities, the environmental performances of this biofuelpathway can be expected to be different from thoseobtained for other countries and feedstocks previouslystudied. This work aims at analyzing the environmentalimpact of soybean-based biodiesel production in Argentinafor export. The relevant impact categories account for theprimary non-renewable energy consumption (CED), theglobal warming potential (GWP), the eutrophication potential
(EP), the acidification potential (AP), the terrestrial ecotox-icity (TE), the aquatic ecotoxicity (AE), the human toxicity(HT) and land use competition (LU). The paper tackles thefeedstock and country specificities in biodiesel production bycomparing the results of soybean-based biodiesel in Argentinawith other reference cases. Emphasis is put on explaining thefactors that contribute most to the final results and the regionalspecificities that lead to different results for each biodieselpathway.Materials and methods The Argentinean (AR) biodieselpathway was modelled through an LCA and was comparedwith reference cases available in the ecoinvent® 2.01database, namely, soybean-based biodiesel production inBrazil (BR) and the United States (US), rapeseed-basedbiodiesel production in the European Union (EU) andSwitzerland (CH) and palm-oil-based biodiesel productionin Malaysia (MY). In all cases, the systems were modelledfrom feedstock production to biodiesel use as B100 in a28 t truck in CH. Furthermore, biodiesel pathways werecompared with fossil low-sulphur diesel produced and usedin CH. The LCA was performed according to the ISOstandards. The life cycle inventory and the life cycle impactassessment (LCIA) were performed in Excel spreadsheetsusing the ecoinvent® 2.01 database. The cumulative energydemand (CED) and the GWP were estimated through theCED for fossil and nuclear energy and the IPCC 2001(climate change) LCIA methods, respectively. Other impactcategories were assessed according to CML 2001, asimplemented in ecoinvent. As the product is a fuel fortransportation (service), the system was defined for onevehicle kilometre (functional unit) and was divided intoseven unit processes, namely, agricultural phase, soybeanoil extraction and refining, transesterification, transport toport, transport to the destination country border, distributionand utilisation.
Int J Life Cycle AssessDOI 10.1007/s11367-008-0050-8
Responsible editor: Robert Anex
L. Panichelli : E. Gnansounou (*)École Polytechnique Fédérale de Lausanne,LASEN-ICARE-ENAC,Station 18, EPFL,1015 Lausanne, Switzerlande-mail: [email protected]
A. DauriatENERS Energy Concept,Av. Saint-Paul,11 1004 Lausanne, Switzerland
Results The Argentinean pathway results in the highestGWP, CED, AE and HT compared with the referencebiofuel pathways. Compared with the fossil reference, allimpact categories are higher for the AR case, except for theCED. The most significant factor that contributes to theenvironmental impact in the Argentinean case variesdepending on the evaluated category. Land provisionthrough deforestation for soybean cultivation is the mostimpacting factor of the AR biodiesel pathway for the GWP,the CED and the HT categories. Whilst nitrogen oxideemissions during the fuel use are the main cause ofacidification, nitrate leaching during soybean cultivation isthe main factor of eutrophication. LU is almost totallyaffected by arable land occupation for soybean cultivation.Cypermethrin used as pesticide in feedstock productionaccounts for almost the total impact on TE and AE.Discussion The sensitivity analysis shows that an increaseof 10% in the soybean yield, whilst keeping the sameinputs, will reduce the total impact of the system. Avoidingdeforestation is the main challenge to improve the environ-mental performances of soybean-based biodiesel productionin AR. If the soybean expansion can be done on marginaland set-aside agricultural land, the negative impact of thesystem will be significantly reduced. Further implementa-tion of crops’ successions, soybean inoculation, reducedtillage and less toxic pesticides will also improve theenvironmental performances. Using ethanol as alcohol inthe transesterification process could significantly improvethe energy balance of the Argentinean pathway.Conclusions The main explaining factors depend on regionalspecificities of the system that lead to different results fromthose obtained in the reference cases. Significantly differentresults can be obtained depending on the level of detail of theinput data, the use of punctual or average data and theassumptions made to build up the LCA inventory. Furtherimprovement of the AR biodiesel pathways should be done inorder to comply with international sustainability criteria onbiofuel production.Recommendations and perspectives Due to the influence ofland use changes in the final results, more efforts should bemade to account for land use changes others thandeforestation. More data are needed to determine the partof deforestation attributable to soybean cultivation. Moreefforts should be done to improve modelling of interactionbetween variables and previous crops in the agriculturalphase, future transesterification technologies and marketprices evolution. In order to assess more accurately theenvironmental impact of soybean-based biodiesel produc-tion in Argentina, further considerations should be made toaccount for indirect land use changes, domestic biodieselconsumption and exportation to other regions, productionscale and regional georeferenced differentiation of productionsystems.
Keywords Agriculture . Argentina . Biodiesel . Explainingfactors . Export . Land use changes . LCA .Modelling .
Soybean-based biodiesel production
1 Background, aim and scope
Life cycle assessment (LCA) of biofuel production requiresa country-specific approach due to the significant impor-tance of local conditions in estimating the energy consump-tion and the greenhouse gas emissions of the system. Someefforts have been put worldwide to determine country-specific and raw-material-specific biofuels environmentalimpact (RFA 2008; Reijnders and Huijbregts 2008; Russi2008; Zah et al. 2007; CONCAWE-EUCAR-JRC 2007;Smith et al. 2007; Farrell et al. 2006; Gnansounou andDauriat 2005; VIEWLS 2005; Bernesson et al. 2004;Elsayed et al. 2003; ADEME 2002; GM-LBST 2002;Sheehan et al. 1998).
However, due to different system boundaries, functionalunit, allocation methods and other assumptions in LCAapproaches, results are difficult to compare. The LCA ofbioenergy products within the ecoinvent® 2.01 database is afirst attempt to develop environmental impact factors forcountry-specific and feedstock-specific biofuel pathwaysunder a consistent methodology (Jungbluth et al. 2007). Astructured and transparent methodology was applied todevelop environmental impact factors for soybean-basedbiodiesel from Brazil (BR) and the United States (US),rapeseed-based biodiesel from the European Union (EU)and Switzerland (CH), palm-oil-based biodiesel fromMalaysia (MY) and fossil diesel from Switzerland (CH).However, soybean-based biodiesel from Argentina (AR)was not included.
In the framework of biofuel research at LASEN, abiofuel platform was developed to test the influence ofmodelling choices in LCA results. The model is based onthe ecoinvent® database and represents biofuel pathwaysfrom feedstock production to fuel utilisation. A first casestudy was developed using wheat-based bioethanol produc-tion and utilisation in CH (Gnansounou et al. 2008). Theplatform was then used to generate a detailed life cycleinventory (LCI) and LCA of soybean-based biodiesel fromAR.
The Republic of Argentina is the first exporter ofsoybean oil and meal and the third largest soybean producerin the world, and therefore, biodiesel production from thissource is expected to significantly increase in the nextyears, mostly for exportation. Nonetheless, a consistent lifecycle approach was not yet applied to evaluate theenvironmental performance of this country-specific biofuelpathway.
Int J Life Cycle Assess
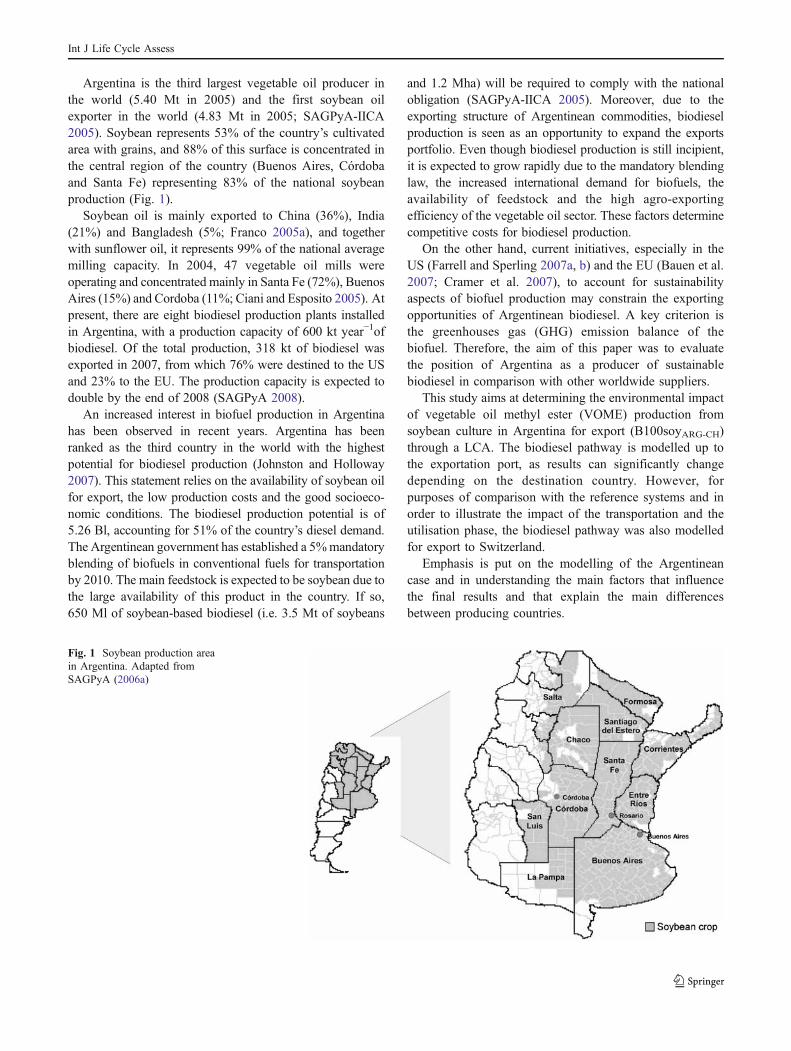
Argentina is the third largest vegetable oil producer inthe world (5.40 Mt in 2005) and the first soybean oilexporter in the world (4.83 Mt in 2005; SAGPyA-IICA2005). Soybean represents 53% of the country’s cultivatedarea with grains, and 88% of this surface is concentrated inthe central region of the country (Buenos Aires, Córdobaand Santa Fe) representing 83% of the national soybeanproduction (Fig. 1).
Soybean oil is mainly exported to China (36%), India(21%) and Bangladesh (5%; Franco 2005a), and togetherwith sunflower oil, it represents 99% of the national averagemilling capacity. In 2004, 47 vegetable oil mills wereoperating and concentrated mainly in Santa Fe (72%), BuenosAires (15%) and Cordoba (11%; Ciani and Esposito 2005). Atpresent, there are eight biodiesel production plants installedin Argentina, with a production capacity of 600 kt year−1ofbiodiesel. Of the total production, 318 kt of biodiesel wasexported in 2007, from which 76% were destined to the USand 23% to the EU. The production capacity is expected todouble by the end of 2008 (SAGPyA 2008).
An increased interest in biofuel production in Argentinahas been observed in recent years. Argentina has beenranked as the third country in the world with the highestpotential for biodiesel production (Johnston and Holloway2007). This statement relies on the availability of soybean oilfor export, the low production costs and the good socioeco-nomic conditions. The biodiesel production potential is of5.26 Bl, accounting for 51% of the country’s diesel demand.The Argentinean government has established a 5%mandatoryblending of biofuels in conventional fuels for transportationby 2010. The main feedstock is expected to be soybean due tothe large availability of this product in the country. If so,650 Ml of soybean-based biodiesel (i.e. 3.5 Mt of soybeans
and 1.2 Mha) will be required to comply with the nationalobligation (SAGPyA-IICA 2005). Moreover, due to theexporting structure of Argentinean commodities, biodieselproduction is seen as an opportunity to expand the exportsportfolio. Even though biodiesel production is still incipient,it is expected to grow rapidly due to the mandatory blendinglaw, the increased international demand for biofuels, theavailability of feedstock and the high agro-exportingefficiency of the vegetable oil sector. These factors determinecompetitive costs for biodiesel production.
On the other hand, current initiatives, especially in theUS (Farrell and Sperling 2007a, b) and the EU (Bauen et al.2007; Cramer et al. 2007), to account for sustainabilityaspects of biofuel production may constrain the exportingopportunities of Argentinean biodiesel. A key criterion isthe greenhouses gas (GHG) emission balance of thebiofuel. Therefore, the aim of this paper was to evaluatethe position of Argentina as a producer of sustainablebiodiesel in comparison with other worldwide suppliers.
This study aims at determining the environmental impactof vegetable oil methyl ester (VOME) production fromsoybean culture in Argentina for export (B100soyARG-CH)through a LCA. The biodiesel pathway is modelled up tothe exportation port, as results can significantly changedepending on the destination country. However, forpurposes of comparison with the reference systems and inorder to illustrate the impact of the transportation and theutilisation phase, the biodiesel pathway was also modelledfor export to Switzerland.
Emphasis is put on the modelling of the Argentineancase and in understanding the main factors that influencethe final results and that explain the main differencesbetween producing countries.
Fig. 1 Soybean production areain Argentina. Adapted fromSAGPyA (2006a)
Int J Life Cycle Assess
2 Materials and methods
The LCA was performed according to the ISO standards onLCA (ISO 2006a, b) and to the main steps described in ISOnorm 14041. The LCI and the life cycle impact assessment(LCIA) were performed in the biofuel platform modeldeveloped at LASEN integrating Microsoft Excel® spread-sheets and using the ecoinvent® 2.01 database (Frischknechtet al. 2004; Frischknecht 2005).
2.1 Key parameters, assumptions and data quality
The system was defined from a well-to-wheels approach.The functional unit is ‘1 km driven with diesel by a 28 ttruck’. The function of the system is to deliver ‘fuel fortransportation’. The LCIA methods are non-renewablecumulative energy demand (CED) for the CED, IPCC2001 GWP 100a (climate change) for GWP, CML 2001generic for eutrophication potential (EP), CML 2001generic for acidification potential (AP), CML 2001 TAETP100a for terrestrial ecotoxicity (TE), CML 2001 FAETP100a for aquatic ecotoxicity (AE), CML 2001 HTP 100afor human toxicity (HT) and CML 2001 for land usecompetition (LU), available in the ecoinvent® 2.01 database.The system description is valid for soybean-based biodieselin Argentina (country-specific approach) and for a timeframework 2006–2010, as technologies, prices and produc-tion methods are assumed to change in the medium term.
The reference biodiesel pathways are those availablefrom the ecoinvent® 2.01 database, and the referencesystems are described as follows:
& B100soy BR-CH soybean-based VOME produced in BRand used in CH;
& B100soy US-CH soybean-based VOME produced in theUS and used in CH;
& B100rape EU-CH rapeseed-based VOME produced in theEU and used in CH;
& B100rape CH-CH rapeseed-based VOME produced inCH and used in CH;
& B100palm MY-CH palm-based VOME produced in MYand used in CH;
& D100fossil CH-CH fossil diesel produced and used inCH.
Rapeseed production for biodiesel in Switzerland iscalculated as an average of different agricultural productionmethods, namely, organic (1%), extensive (28%) andintegrated (71%) production. Rapeseed production in theEuropean Union corresponds to conventional rapeseedproduction in Germany.
Economic allocation was based on market values.Soybean oil and soybean meal allocation was based oninternational market prices, as these products are exported.
However, as glycerine is destined to national consumption,national market price was used. B100soyARG-CH marketprice was assumed to be that of US VOME.
Although the ISO norm recommends subdividing thesystem or performing system expansion as methodsinstead of allocation, economic allocation has beenchosen essentially because soybean meal is a commoditywith a defined market value. Moreover, the decision wastaken in coherence with the ecoinvent database forbioenergy products (Jungbluth et al. 2007) where alloca-tion of environmental impacts between co-products is basedon the respective prices of co-products. Nonetheless,sensitivity analysis was performed for allocation based onenergy content, mass and carbon content to evaluate thevariability of results with regard to this key methodologicalparameter.
Only carbon dioxide (CO2), methane (CH4) and nitrousoxide (N2O) emissions are considered for GWP assessment.Emissions from land use change other than direct defores-tation are excluded due to lack of data.
The quality of the used data is consistent with theobjectives of the study. However, since the production ofbiodiesel in Argentina so far remains a marginal activity,transesterification data are based on average internationaltechnology, consistent with the information found inecoinvent®. Agricultural data are specific to the Argentineancontext. Vegetable oil production and transesterification,however, were adapted to the Argentinean context with datafrom the US and average European reference cases(Jungbluth et al. 2007).
Soybean yield per hectare is based on the average yieldfrom the last five available harvesting periods (2000/2001–2004/2005). Transport distances are based on averagedistances and do not correspond to a specific case. No datawas available for the soybean intermediate storage anddrying phase. Consequently, this stage was not consideredin the system boundaries, and it was assumed to take placeonly at the vegetable oil extraction plant.
The relevance of the data quality was studied throughsensitivity analysis of key input values with a significantimpact on the final results.
2.2 System description and inventory data
The Argentinean soybean-based biodiesel pathway wasdivided into seven unit processes, namely, agriculturalphase (soybean production), soybean oil extraction andrefining (oil production), transesterification of soybean oil(VOME production), VOME transport to port in AR,VOME transport from port to the Swiss border, VOMEdistribution in CH and VOME use in CH. The listed inputsand outputs are the ones necessary to evaluate the selectedimpact categories.
Int J Life Cycle Assess
The AR agricultural phase is specifically detailed andbased on national values. Due to lack of data in oilextraction and transesterification, these processes wereconstructed on the US case, but adapted to the AR context.The country-specific data are detailed in the followingsections.
2.3 Soybean production
The characteristics of the production system are estimatedas averages based on the four soybean production systemsin Argentina: first- and second-class soybean in reducedtillage (FCRT and SCRT) and first- and second-classsoybean in conventional tillage (FCCT and SCCT).
The distribution of the total production between the systemsis 49.3%, 30.6%, 14.7% and 5.4%, respectively (SAGPyA2006a). The average soybean yield is 2,591 kg ha−1
(SAGPyA 2006a) and is calculated as the weighted averageyield of the four production systems with regard to theirrespective shares of national production.
First class soybean is grown between October/November(sowing) and April/May (harvesting), corresponding to theoptimal growing period for soybean in Argentina. Thesoybean cycle lasts for 6 months, and the land is then leftand set aside during the winter (crop succession of set-asideland-soybean). Second-class soybean is grown betweenDecember (sowing) and April/May (harvesting), afterwheat (crop succession of wheat–soybean). Therefore,soybeans of shorter growing cycle are used. Wheat isgrown between June/July and December (harvesting) andsoybean is sowed at the same time wheat is harvested. Thisallows having two crops per year on that land. However, asfirst class soybean is grown in the optimal period, higheryields are obtained compared with second-class soybean.
Both first- and second-class soybeans are grown inmonoculture as well as in rotation with corn or sunflower.However, no data is available of the proportion of eachsoybean type done in monoculture and in rotation.
Phosphate fertilisers are imported from US, Russia,Lithuania, Morocco and Tunisia. NPK formulations areimported from Brazil and Uruguay (SAGPyA 2006b).Pesticides and fertilisers are available at regional storage(port of Rosario) and are transported over 300 km in 28 ttrucks to the local area and 30 km by tractor or trailer to thefield (SAGPyA 2006b). Soybeans are transported over30 km by tractor to the regional storage. Seed input variesdepending on the production method, being 75, 70, 80 and70 kg ha−1 for FCRT, SCRT, FCCT and SCCT, respectively.
Land occupation is estimated as 1 year for first-classsoybean (only soybean) and 0.5 year for second-classsoybean (soybean–wheat production). Soybean area hasincreased from 10.7 Mha in 2000 to 15.3 Mha in 2005(4.7 Mha; SAGPyA, 2006a), displacing other crops (32%),
mainly wheat, corn, sunflower and sorghum, pasture land(27%), savannas (19%) and forest (22%; Benbrook 2005;Gasparri et al. 2008; Montenegro et al. 2005; Paruelo et al.2005). The land use is assumed arable land and transfor-mation from arable land, shrub land, pasture and forest.Deforestation for soybean cultivation occurs in Salta,Chaco, Tucumán and Santiago del Estero (Grau et al.2005; Gasparri and Manghi 2004) at an average rate of258,406 ha year−1 for the period 2000–2005. GHGemissions from deforestation are estimated as the emissionfrom land provision and the emission from carbon stockchange in soil, as implemented in ecoinvent®, and totallyallocated to the use as agricultural land. Soybean isassumed to be cultivated in deforested areas during 2 years.Land provision is estimated based on the deforested areabetween 2000 and 2005 (1,550,435 ha of the Chacoseasonally dry forest and 72,000 ha of the evergreen andsemi-evergreen Yungas forest; Gasparri et al. 2008) and arate attributed to soybean expansion (64% of the totaldeforested area in the Northeast of Argentina; Pengue2005). CO2 emissions from carbon stock change in soil(55 t CO2 ha
−1 year−1) and biomass (193 t CO2 ha−1 year−1)
were calculated by Gasparri et al. (2008) based on the IPCCGood Practice Guidance for LULUCF and the bookkeepingmethod (Houghton 2003). Carbon loss from soil afterdeforestation is estimated based on carbon stock change insoil from forest conversion to agricultural land (15 t C ha−1
year−1; Gasparri et al. 2008). Carbon stock change in soilrepresents only 7% of the total emission from land useconversion. Emissions from biomass (93%) are accountedas provision of land by forest clearing.
Diesel consumption in agricultural processes was con-verted into inputs of agricultural field work processesaccording to ecoinvent® (Nemecek et al. 2007) in order toconsider agricultural machinery production and use as wellas exhaust emissions from the tractor. Diesel consumptionin combined harvesting is 10.6 l ha−1. Fuel consumption insowing, pesticide and fertiliser application is calculatedbased on primary data from Donato et al. (2005). Dieselconsumption for agricultural activities other than harvestingis 25 and 52 l ha−1 for reduced and conventional tillage,respectively.
Pesticide and fertiliser use is the average of soybeancultivation in Argentina under the different productionsystems (Márgenes agropecuarios 2006). Nitrogen fertiliseris only applied to first-class soybean as monoammoniumphosphate (MAP; 5 kg MAP ha−1), whilst second class usesthe residual fertilisation of the previously implanted crop(wheat). P fertiliser is applied as MAP and triple superphosphate (TSP) fertilisers in average doses of 5 kg MAPha−1 and 10.5 kg TSP ha−1, respectively. Other fertiliserssuch as calcium sulphate and simple formulations of P andS were not included due to lack of data. No K fertiliser is
Int J Life Cycle Assess
applied in soybean production in Argentina (FAO 2004).Average pesticide applications (expressed in grams ofactive compound) are with deltamethrin (67 g ha−1),difenoconazole (5 g ha−1), cypermethrin (45 g ha−1),chlorpyrifos (421 g ha−1), endosulfan (68 g ha−1), metribuzin(14 g ha−1), acetochlor (56 g ha−1), glyphosate (2,340 gha−1), 2,4-D (240 g ha−1), metsulfuron methyl (3 g ha−1) andimazetapyr (3 g ha−1).
N2O emissions are calculated as a direct emission fromthe N input and an indirect emission from the N content innitrate leaching, as implemented in ecoinvent®. N inputaccounts for the N biological fixation (BNF) and for Nfertiliser (Jungbluth et al. 2007). BNF is assumed to be70 kg N ha−1 as in the reference US and BR cases. Nitrogenoxides and ammonia emissions to air, nitrate and phospho-rous emissions to groundwater and phosphorous emissionsto surface water are estimated according to Nemecek et al.(2007), as implemented in Jungbluth et al. (2007).
Heavy metal emissions to soil are estimated as thedifference between seed and fertilisers inputs and outputs,based on the BR case, as implemented in Jungbluth et al.(2007). Pesticide inputs are assumed as emissions to soil.Biogenic CO2 uptake (1.37 kg kg−1 soybean) and biomassenergy (20.45 MJ kg−1 soybean) are estimated from thecarbon balance and the energy content in soybeans for theBR case, respectively. Soybean irrigation in Argentina is nota common practice, and the irrigated area is not significant.
2.4 Soybean oil extraction and refining
Solvent extraction technology (with methanol) is based oninternational standard technology, as described in Jungbluthet al. (2007) for VOME production. However, yields,allocation factors, natural gas and electricity consumption,electricity mix and transport distances are specific to theArgentinean context.
From 1 t of soybean, 182 kg of soybean oil (19%), 794 kgof soybean meal and 18 kg of residues are obtained. Soybeanoil and soybean meal prices are US$521 and US$201 per ton,respectively (average January 2001–September 2006 atRotterdam market; SAGPyA 2006c). Energy contents areassumed to be 37.2 and 17 MJ kg−1, respectively (Jungbluthet al. 2007). Soybeans are dried (from 16% to 13%humidity) in the vegetable oil mill using natural gas.
The electricity mix was modelled based on the electricityproduction in Argentina and accounts for the construction andoperation of the power plants (SERA 2006). The Argentineanelectricity mix is mainly dominated by fossil fuels (50%natural gas and 38% oil). Electricity at grid was modelledbased on the electricity mix accounting for transmission anddistribution processes. The electricity and natural gasconsumption corresponds to average values for vegetableoil mills in Santa Fe and Córdoba (IDIED 2004).
Utilities are transported over 150 km in 28 t trucks.Vegetable oil mills are supplied with soybeans in a radius of300 km being transported 80% by 28 t trucks and 20% bytrain. Mill infrastructure is included in the same way as inall reference cases.
2.5 Transesterification of soybean oil (methyl esterproduction)
Soybean oil transesterification is based on internationalstandard technology as implemented in Jungbluth et al.(2007) for VOME production, adapting allocation factors,natural gas and electricity consumption, electricity mix andtransport distances to the Argentinean context. From 1 t ofsoybean oil, 972.7 kg of soybean methyl ester and 106.1 kg ofglycerine are obtained, considering methanol and potassiumhydroxide addition.
Soybean methyl ester is produced for the internationalmarkets (US$833 per ton—US market price) and glycerineis sold in the national market (US$100 per ton—Argentinamarket price; Asal and Marcus 2005). Energy contents areassumed to be 37.2 and 18 MJ kg−1, respectively(Jungbluth et al. 2007).
Electricity and natural gas consumption are those ofVOME production in the European Union. Chemicals areassumed to be supplied by chemical laboratories in Rosario,Córdoba and Buenos Aires from an average transportdistance of 250 km in 28 t trucks.
Vegetable oil mills are located near the ports of Rosarioin the Paraná River. Consequently, 97% of the soybean oil,97% of the soybean meal and 75% of the soybean areexported from this port (Franco 2005b). The transesterifi-cation plants are assumed to be located in the same place,and therefore, no transportation of soybean oil is assumed.
2.6 Transport to exportation port, transport from portto the CH border and distribution to service station in CH
In Argentina, biodiesel is transported over 100 km in 28 ttrucks from the transesterification plant to the port ofRosario. It is then transported by transoceanic tanker fromthe ports of Rosario to the port of Rotterdam over anaverage distance of 12,091 km. Finally, it is transportedover 840 km in barge tanker to Basel, 100 km by train and150 km in 28 t trucks to the service station.
2.7 Utilisation
Biodiesel is assumed to completely replace fossil diesel in28 t trucks in CH. Fuel economy is 0.27 and 0.25 kg km−1
for biodiesel and fossil diesel, respectively. The impact ofthe utilisation phase is assumed to be the same for all thebiodiesel pathways and is directly taken from ecoinvent® as
Int J Life Cycle Assess
operation of a 28 t truck with 100% rapeseed VOME.Operation of a 28 t truck with fossil diesel is also takenfrom ecoinvent®.
3 Results
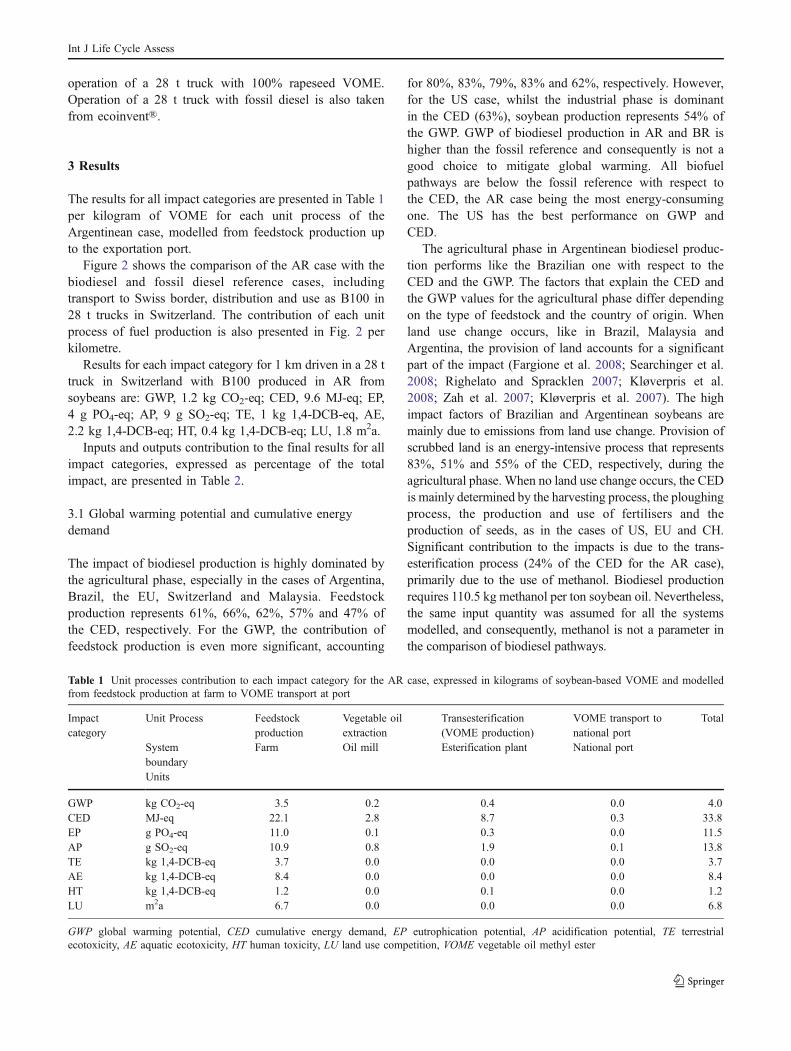
The results for all impact categories are presented in Table 1per kilogram of VOME for each unit process of theArgentinean case, modelled from feedstock production upto the exportation port.
Figure 2 shows the comparison of the AR case with thebiodiesel and fossil diesel reference cases, includingtransport to Swiss border, distribution and use as B100 in28 t trucks in Switzerland. The contribution of each unitprocess of fuel production is also presented in Fig. 2 perkilometre.
Results for each impact category for 1 km driven in a 28 ttruck in Switzerland with B100 produced in AR fromsoybeans are: GWP, 1.2 kg CO2-eq; CED, 9.6 MJ-eq; EP,4 g PO4-eq; AP, 9 g SO2-eq; TE, 1 kg 1,4-DCB-eq, AE,2.2 kg 1,4-DCB-eq; HT, 0.4 kg 1,4-DCB-eq; LU, 1.8 m2a.
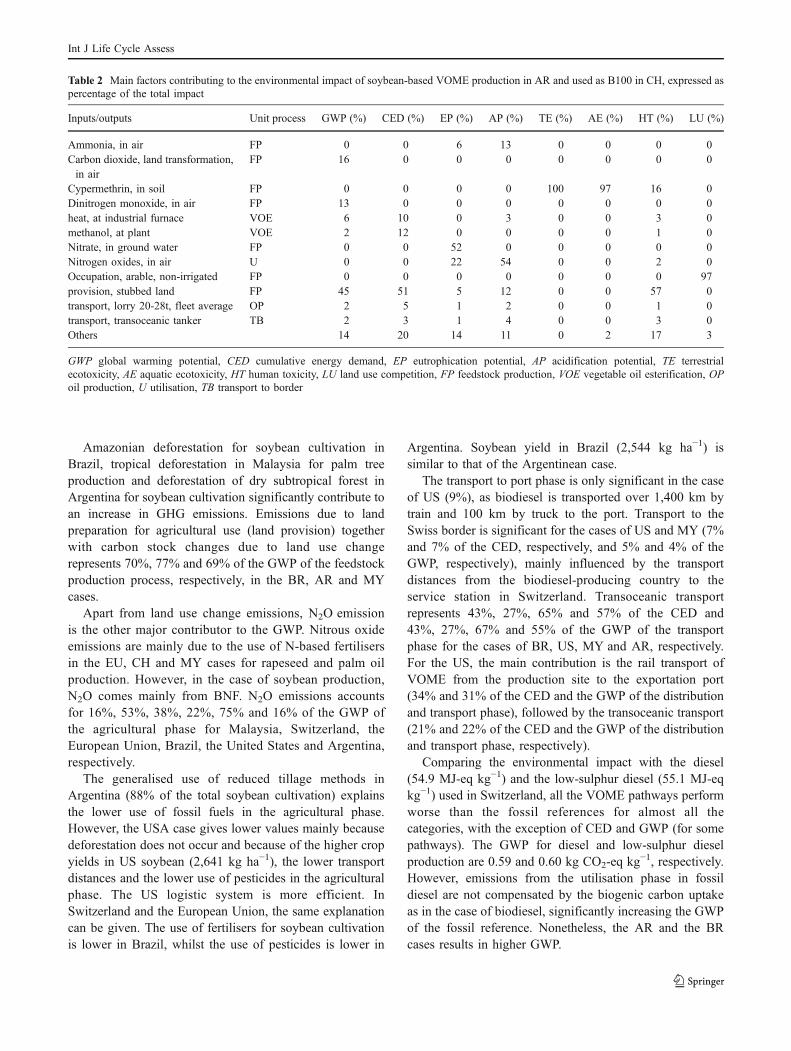
Inputs and outputs contribution to the final results for allimpact categories, expressed as percentage of the totalimpact, are presented in Table 2.
3.1 Global warming potential and cumulative energydemand
The impact of biodiesel production is highly dominated bythe agricultural phase, especially in the cases of Argentina,Brazil, the EU, Switzerland and Malaysia. Feedstockproduction represents 61%, 66%, 62%, 57% and 47% ofthe CED, respectively. For the GWP, the contribution offeedstock production is even more significant, accounting
for 80%, 83%, 79%, 83% and 62%, respectively. However,for the US case, whilst the industrial phase is dominantin the CED (63%), soybean production represents 54% ofthe GWP. GWP of biodiesel production in AR and BR ishigher than the fossil reference and consequently is not agood choice to mitigate global warming. All biofuelpathways are below the fossil reference with respect tothe CED, the AR case being the most energy-consumingone. The US has the best performance on GWP andCED.
The agricultural phase in Argentinean biodiesel produc-tion performs like the Brazilian one with respect to theCED and the GWP. The factors that explain the CED andthe GWP values for the agricultural phase differ dependingon the type of feedstock and the country of origin. Whenland use change occurs, like in Brazil, Malaysia andArgentina, the provision of land accounts for a significantpart of the impact (Fargione et al. 2008; Searchinger et al.2008; Righelato and Spracklen 2007; Kløverpris et al.2008; Zah et al. 2007; Kløverpris et al. 2007). The highimpact factors of Brazilian and Argentinean soybeans aremainly due to emissions from land use change. Provision ofscrubbed land is an energy-intensive process that represents83%, 51% and 55% of the CED, respectively, during theagricultural phase. When no land use change occurs, the CEDis mainly determined by the harvesting process, the ploughingprocess, the production and use of fertilisers and theproduction of seeds, as in the cases of US, EU and CH.Significant contribution to the impacts is due to the trans-esterification process (24% of the CED for the AR case),primarily due to the use of methanol. Biodiesel productionrequires 110.5 kg methanol per ton soybean oil. Nevertheless,the same input quantity was assumed for all the systemsmodelled, and consequently, methanol is not a parameter inthe comparison of biodiesel pathways.
Table 1 Unit processes contribution to each impact category for the AR case, expressed in kilograms of soybean-based VOME and modelledfrom feedstock production at farm to VOME transport at port
Impactcategory
Unit Process Feedstockproduction
Vegetable oilextraction
Transesterification(VOME production)
VOME transport tonational port
Total
Systemboundary
Farm Oil mill Esterification plant National port
Units
GWP kg CO2-eq 3.5 0.2 0.4 0.0 4.0CED MJ-eq 22.1 2.8 8.7 0.3 33.8EP g PO4-eq 11.0 0.1 0.3 0.0 11.5AP g SO2-eq 10.9 0.8 1.9 0.1 13.8TE kg 1,4-DCB-eq 3.7 0.0 0.0 0.0 3.7AE kg 1,4-DCB-eq 8.4 0.0 0.0 0.0 8.4HT kg 1,4-DCB-eq 1.2 0.0 0.1 0.0 1.2LU m2a 6.7 0.0 0.0 0.0 6.8
GWP global warming potential, CED cumulative energy demand, EP eutrophication potential, AP acidification potential, TE terrestrialecotoxicity, AE aquatic ecotoxicity, HT human toxicity, LU land use competition, VOME vegetable oil methyl ester
Int J Life Cycle Assess
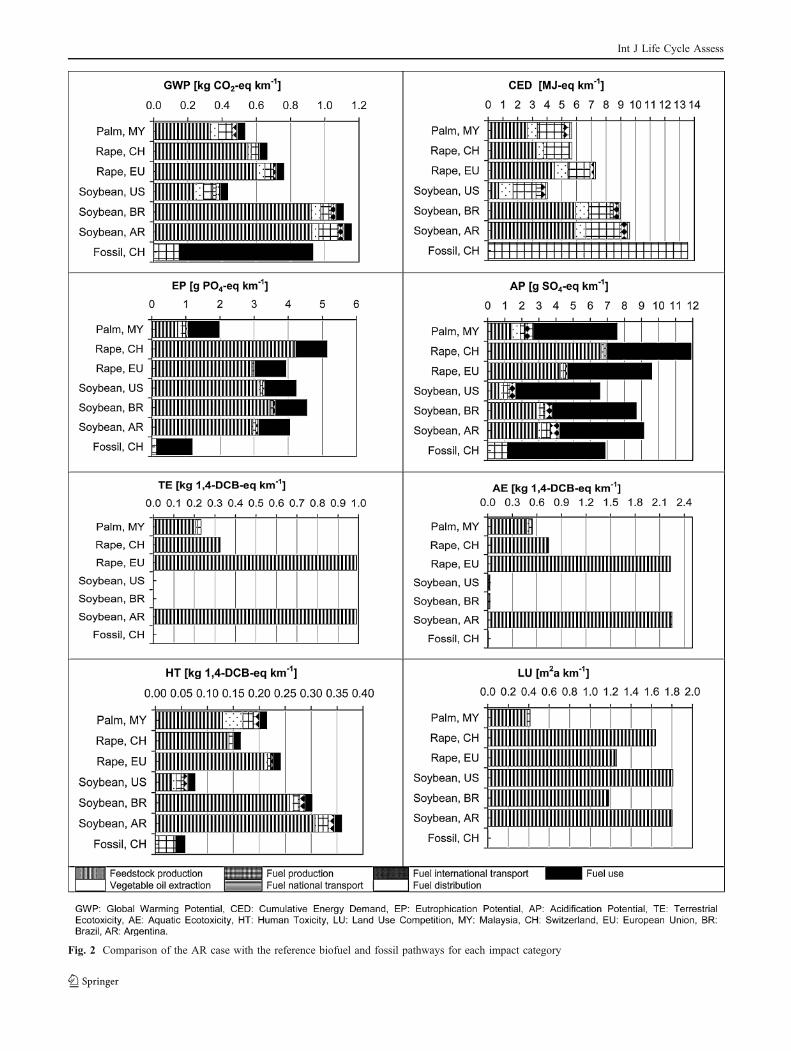
Fig. 2 Comparison of the AR case with the reference biofuel and fossil pathways for each impact category
Int J Life Cycle Assess
Amazonian deforestation for soybean cultivation inBrazil, tropical deforestation in Malaysia for palm treeproduction and deforestation of dry subtropical forest inArgentina for soybean cultivation significantly contribute toan increase in GHG emissions. Emissions due to landpreparation for agricultural use (land provision) togetherwith carbon stock changes due to land use changerepresents 70%, 77% and 69% of the GWP of the feedstockproduction process, respectively, in the BR, AR and MYcases.
Apart from land use change emissions, N2O emissionis the other major contributor to the GWP. Nitrous oxideemissions are mainly due to the use of N-based fertilisersin the EU, CH and MY cases for rapeseed and palm oilproduction. However, in the case of soybean production,N2O comes mainly from BNF. N2O emissions accountsfor 16%, 53%, 38%, 22%, 75% and 16% of the GWP ofthe agricultural phase for Malaysia, Switzerland, theEuropean Union, Brazil, the United States and Argentina,respectively.
The generalised use of reduced tillage methods inArgentina (88% of the total soybean cultivation) explainsthe lower use of fossil fuels in the agricultural phase.However, the USA case gives lower values mainly becausedeforestation does not occur and because of the higher cropyields in US soybean (2,641 kg ha−1), the lower transportdistances and the lower use of pesticides in the agriculturalphase. The US logistic system is more efficient. InSwitzerland and the European Union, the same explanationcan be given. The use of fertilisers for soybean cultivationis lower in Brazil, whilst the use of pesticides is lower in
Argentina. Soybean yield in Brazil (2,544 kg ha−1) issimilar to that of the Argentinean case.
The transport to port phase is only significant in the caseof US (9%), as biodiesel is transported over 1,400 km bytrain and 100 km by truck to the port. Transport to theSwiss border is significant for the cases of US and MY (7%and 7% of the CED, respectively, and 5% and 4% of theGWP, respectively), mainly influenced by the transportdistances from the biodiesel-producing country to theservice station in Switzerland. Transoceanic transportrepresents 43%, 27%, 65% and 57% of the CED and43%, 27%, 67% and 55% of the GWP of the transportphase for the cases of BR, US, MY and AR, respectively.For the US, the main contribution is the rail transport ofVOME from the production site to the exportation port(34% and 31% of the CED and the GWP of the distributionand transport phase), followed by the transoceanic transport(21% and 22% of the CED and the GWP of the distributionand transport phase, respectively).
Comparing the environmental impact with the diesel(54.9 MJ-eq kg−1) and the low-sulphur diesel (55.1 MJ-eqkg−1) used in Switzerland, all the VOME pathways performworse than the fossil references for almost all thecategories, with the exception of CED and GWP (for somepathways). The GWP for diesel and low-sulphur dieselproduction are 0.59 and 0.60 kg CO2-eq kg−1, respectively.However, emissions from the utilisation phase in fossildiesel are not compensated by the biogenic carbon uptakeas in the case of biodiesel, significantly increasing the GWPof the fossil reference. Nonetheless, the AR and the BRcases results in higher GWP.
Table 2 Main factors contributing to the environmental impact of soybean-based VOME production in AR and used as B100 in CH, expressed aspercentage of the total impact
Inputs/outputs Unit process GWP (%) CED (%) EP (%) AP (%) TE (%) AE (%) HT (%) LU (%)
Ammonia, in air FP 0 0 6 13 0 0 0 0Carbon dioxide, land transformation,in air
FP 16 0 0 0 0 0 0 0
Cypermethrin, in soil FP 0 0 0 0 100 97 16 0Dinitrogen monoxide, in air FP 13 0 0 0 0 0 0 0heat, at industrial furnace VOE 6 10 0 3 0 0 3 0methanol, at plant VOE 2 12 0 0 0 0 1 0Nitrate, in ground water FP 0 0 52 0 0 0 0 0Nitrogen oxides, in air U 0 0 22 54 0 0 2 0Occupation, arable, non-irrigated FP 0 0 0 0 0 0 0 97provision, stubbed land FP 45 51 5 12 0 0 57 0transport, lorry 20-28t, fleet average OP 2 5 1 2 0 0 1 0transport, transoceanic tanker TB 2 3 1 4 0 0 3 0Others 14 20 14 11 0 2 17 3
GWP global warming potential, CED cumulative energy demand, EP eutrophication potential, AP acidification potential, TE terrestrialecotoxicity, AE aquatic ecotoxicity, HT human toxicity, LU land use competition, FP feedstock production, VOE vegetable oil esterification, OPoil production, U utilisation, TB transport to border
Int J Life Cycle Assess
3.2 Eutrophication and acidification potential
The eutrophication potential result is mainly due tofeedstock production and the utilisation of the fuel for allcases (72% and 22% for the AR case, respectively). Theacidification potential is explained mainly by emissions ofammonia to air, nitrates leaching to ground water and landprovision for soybean cultivation. Significant contributionof the utilisation phase (22% of the EP) is due to nitrogenoxide emissions to air at fuel combustion. Similar resultsare obtained for the AR, EU, BR and US cases. However,the EP of all biofuel pathways is higher than that of thefossil reference.
Acidification potential is mainly due to the utilisationphase (54% of the AP) as a consequence of nitrogen oxideemissions (54% of the utilisation phase). Significantcontribution of the feedstock production is due to ammoniaemissions to air in soybean cultivation and ammonia,nitrogen oxides and sulfur dioxide emissions during landprovision. All biofuel pathways result in a higher APcompared with the fossil reference, with the exception ofthe US case.
The impact of the utilisation phase on the EP and the APis the same for all the biofuel pathways, as it was assumedthat they all have the same properties.
3.3 Terrestrial, aquatic and human toxicity
Terrestrial and aquatic ecotoxicity results in similar relativevalues when comparing biofuel pathways. Cypermethrin isa potent pyretroid-based pesticides used in rape productionin CH and EU, in palm oil production in MY and insoybean production in AR for caterpillar control. Similaramounts are used in the EU and AR cases. This compoundis responsible for almost all the TE and the AE in all cases.In US and BR, other pesticides with lower toxicologicalimpact are used, giving almost no effect on TE and AE,similar to the fossil reference.
Human toxicity is 49% due to benzene emissions to airduring land provision (57% of the HT) and cypermethrinapplication for pest biological control in the agriculturalphase (16% of the HT). The same inputs are the cause ofhigh HT results for BR (only benzene), EU (onlycypermethrin) and MY. All biofuel pathways give higherimpacts than the fossil reference.
3.4 Land use competition
Arable land occupation for soybean cultivation is the mainsource contributing to the LU impact. Results for AR aresimilar to US values, as most of the soybean is cultivated asfirst-class soybean, giving no place for a second crop in anannual basis. Land occupation for rape cultivation in CH
and EU differs due to higher yield in EU. The BR caseresults in lower land occupation, as it was modelled as asecond-class soybean. Obviously, the fossil referenceperforms better than the biofuel pathways.
3.5 Co-products
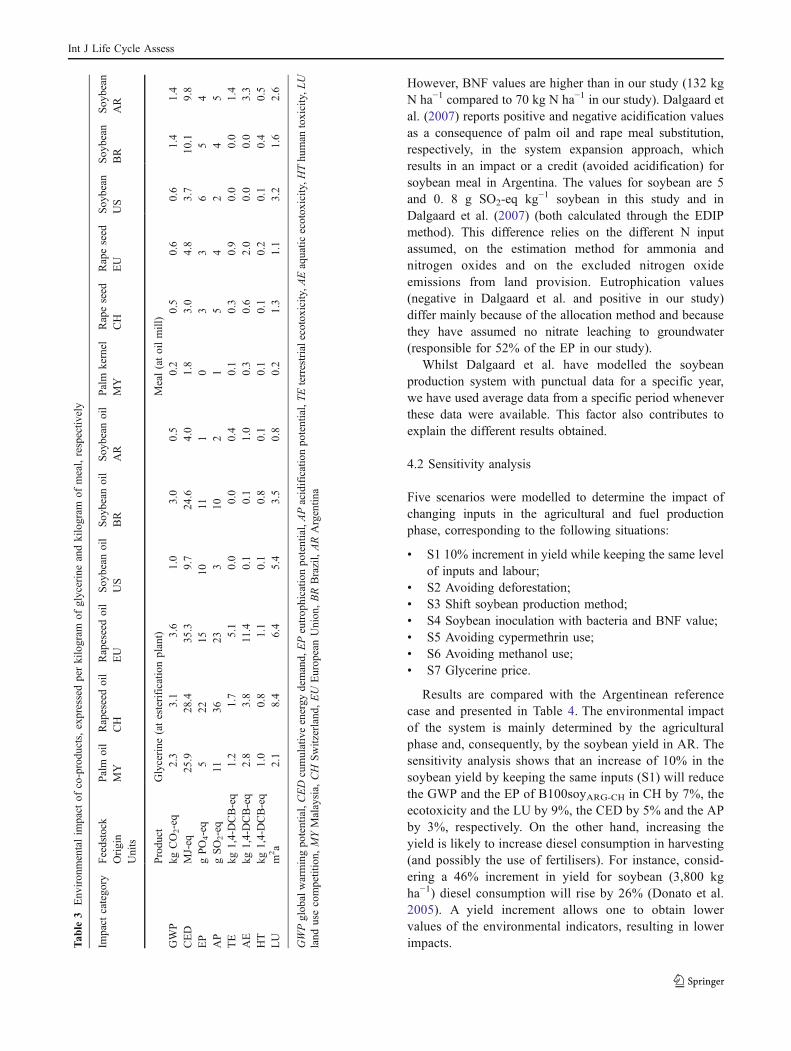
Impact results for the co-products of biodiesel productionare given in Table 3 based on economic allocation.Additional co-products processing to obtain marketableproducts are considered. Soybean meal drying and glycerinerefining are included, in coherence with allocation based onmarket prices.
The environmental impact of the products is determinedby the allocation of the environmental burden between co-products. Whilst palm kernel meal produced in MY has thebest performance in almost all impact categories, soybeanmeal produced in AR results in the highest impacts. Whilstglycerine production in EU from rapeseed oil results in thehighest impacts for almost all the categories, glycerine fromsoybean oil produced in AR is the best case.
4 Discussion
4.1 Previous studies
No previous LCAs were found for soybean-based biodieselin Argentina. However, a default value of GWP is given bythe English Renewable Transport Fuel Obligation (RTFO)to calculate GHG balance of imported biofuels (RFA 2008),including soybean-based biodiesel produced in Argentina.The conservative default value given by the RTFO is lessthan half the result of this study (4 kg CO2-eq kg−1 VOMEat esterification plant compared to 1.8 kg CO2-eq kg−1 fromthe RTFO). This discrepancy may be attributed to emis-sions from land use change. However, no data wasavailable about how the RTFO value was estimated.
Dalgaard et al. (2007) give values for GWP, AP and EPfor soybean and soybean meal production in Argentinabased on a consequential LCA approach. The GWP ofArgentinean soybean obtained by Dalgaard et al. (2007)differs from the value obtained in this study (0.6 and 1.6 kgCO2-eq kg−1 soybean, respectively). GWP values for theAR soybean meal are between 0.3 and 0.7 kg CO2-eq kg−1
depending on the reference system chosen for assigning theimpacts under a system expansion approach. These differ-ences are explained by the influence of the allocationmethod (system expansion vs. economic allocation) anddue to different assumptions in the LCA inventory. Mainly,deforestation for soybean production (and consequentlyemissions from land use change) was not considered and noN fertiliser use was assumed by Dalgaard et al. (2007).
Int J Life Cycle Assess
However, BNF values are higher than in our study (132 kgN ha−1 compared to 70 kg N ha−1 in our study). Dalgaard etal. (2007) reports positive and negative acidification valuesas a consequence of palm oil and rape meal substitution,respectively, in the system expansion approach, whichresults in an impact or a credit (avoided acidification) forsoybean meal in Argentina. The values for soybean are 5and 0. 8 g SO2-eq kg−1 soybean in this study and inDalgaard et al. (2007) (both calculated through the EDIPmethod). This difference relies on the different N inputassumed, on the estimation method for ammonia andnitrogen oxides and on the excluded nitrogen oxideemissions from land provision. Eutrophication values(negative in Dalgaard et al. and positive in our study)differ mainly because of the allocation method and becausethey have assumed no nitrate leaching to groundwater(responsible for 52% of the EP in our study).
Whilst Dalgaard et al. have modelled the soybeanproduction system with punctual data for a specific year,we have used average data from a specific period wheneverthese data were available. This factor also contributes toexplain the different results obtained.
4.2 Sensitivity analysis
Five scenarios were modelled to determine the impact ofchanging inputs in the agricultural and fuel productionphase, corresponding to the following situations:
& S1 10% increment in yield while keeping the same levelof inputs and labour;
& S2 Avoiding deforestation;& S3 Shift soybean production method;& S4 Soybean inoculation with bacteria and BNF value;& S5 Avoiding cypermethrin use;& S6 Avoiding methanol use;& S7 Glycerine price.
Results are compared with the Argentinean referencecase and presented in Table 4. The environmental impactof the system is mainly determined by the agriculturalphase and, consequently, by the soybean yield in AR. Thesensitivity analysis shows that an increase of 10% in thesoybean yield by keeping the same inputs (S1) will reducethe GWP and the EP of B100soyARG-CH in CH by 7%, theecotoxicity and the LU by 9%, the CED by 5% and the APby 3%, respectively. On the other hand, increasing theyield is likely to increase diesel consumption in harvesting(and possibly the use of fertilisers). For instance, consid-ering a 46% increment in yield for soybean (3,800 kgha−1) diesel consumption will rise by 26% (Donato et al.2005). A yield increment allows one to obtain lowervalues of the environmental indicators, resulting in lowerimpacts.T
able
3Env
iron
mentalim
pact
ofco-produ
cts,expressedperkilogram
ofglycerineandkilogram
ofmeal,respectiv
ely
Impact
catego
ryFeedstock
Palm
oil
Rapeseedoil
Rapeseedoil
Soy
bean
oil
Soy
bean
oil
Soy
bean
oil
Palm
kernel
Rapeseed
Rapeseed
Soy
bean
Soy
bean
Soy
bean
Origin
MY
CH
EU
US
BR
AR
MY
CH
EU
US
BR
AR
Units
Produ
ctGlycerine
(atesterificatio
nplant)
Meal(atoilmill)
GWP
kgCO2-eq
2.3
3.1
3.6
1.0
3.0
0.5
0.2
0.5
0.6
0.6
1.4
1.4
CED
MJ-eq
25.9
28.4
35.3
9.7
24.6
4.0
1.8
3.0
4.8
3.7
10.1
9.8
EP
gPO4-eq
522
1510
111
03
36
54
AP
gSO2-eq
1136
233
102
15
42
45
TE
kg1,4-DCB-eq
1.2
1.7
5.1
0.0
0.0
0.4
0.1
0.3
0.9
0.0
0.0
1.4
AE
kg1,4-DCB-eq
2.8
3.8
11.4
0.1
0.1
1.0
0.3
0.6
2.0
0.0
0.0
3.3
HT
kg1,4-DCB-eq
1.0
0.8
1.1
0.1
0.8
0.1
0.1
0.1
0.2
0.1
0.4
0.5
LU
m2a
2.1
8.4
6.4
5.4
3.5
0.8
0.2
1.3
1.1
3.2
1.6
2.6
GWPglob
alwarmingpo
tential,CEDcumulativeenergy
demand,
EPeutrop
hicatio
npo
tential,APacidificationpo
tential,TEterrestrialecotox
icity,A
Eaquatic
ecotox
icity,H
Thu
man
toxicity,L
Uland
usecompetition,
MYMalaysia,
CH
Switzerland
,EU
Europ
eanUnion
,BRBrazil,ARArgentin
a
Int J Life Cycle Assess
Avoiding deforestation (S2) and allocating the futureland expansion to other set-aside and marginal arable landsignificantly decreases the environmental performances ofthe system, as follows: GWP is reduced by 61% as CO2
emissions from soil and biomass are avoided; CEDdecreases on 51% as biomass energy use from primaryforest is avoided; AP is reduced by 12% as ammonia,nitrogen oxides and sulfur dioxide emissions are avoided;HE decreases on 57% as benzene emissions are avoided;EP is reduced on 5% for avoided ammonia and nitrogenoxides emissions during land provision. No effect on TEand AE occurs and an insignificant increase on LU isobtained. Deforestation for soybean cultivation was as-sumed to be 64% of the deforested area in the Northernprovinces of Argentina. However, other land use changeshave occurred due to soybean expansion, such as conver-sion of other cropland (mainly wheat, corn, sunflower andsorghum) and conversion of pastureland (Pengue 2006). Adefault value of 0.05 kg CO2-eq kg−1 of biodiesel is givenby the RTFO for grassland conversion (RFA 2008).Nevertheless, consistent data to account for these changeswere not available. Uncertainty is linked to carbonemissions, as the used data were estimated as accumulatedemissions. Consequently, the emissions do not only account
for the carbon loss of a specific year but also for thedecaying emission of previous years calculated during25 years. This has resulted in an overestimation of theemissions in an annual basis.
The soybean production method has a strong influenceon the results (S3). When shifting to conventional tillage,the ecotoxicity of the system increased significantly, mainlyfor TE and AE, due to the higher input of cypermethrin andthe lower yields in conventional soybean production. LU isalso increased, as FCCT soybean production does not allowcrop succession. When shifting to reduced tillage methods,the impact of the system is reduced. FCRT soybeanproduction allows reducing the ecotoxicity impact due toa reduction in cypermethrin input and reducing GWP andCED due to lower diesel consumption in agriculturalprocesses. SCRT method allows reducing the ecotoxicityeffect for the same reason and the LU due to soybean–wheat succession whilst EP is increased.
Soybean production in AR, BR and US was modelledwith a N fixation value of 70 kg ha−1. However, the BNFdepends on the N content in the grain, the type of soil andthe agricultural practices in each country, and consequently,different values are expected to be obtained in each countryand production system. For the AR case, BNF varies
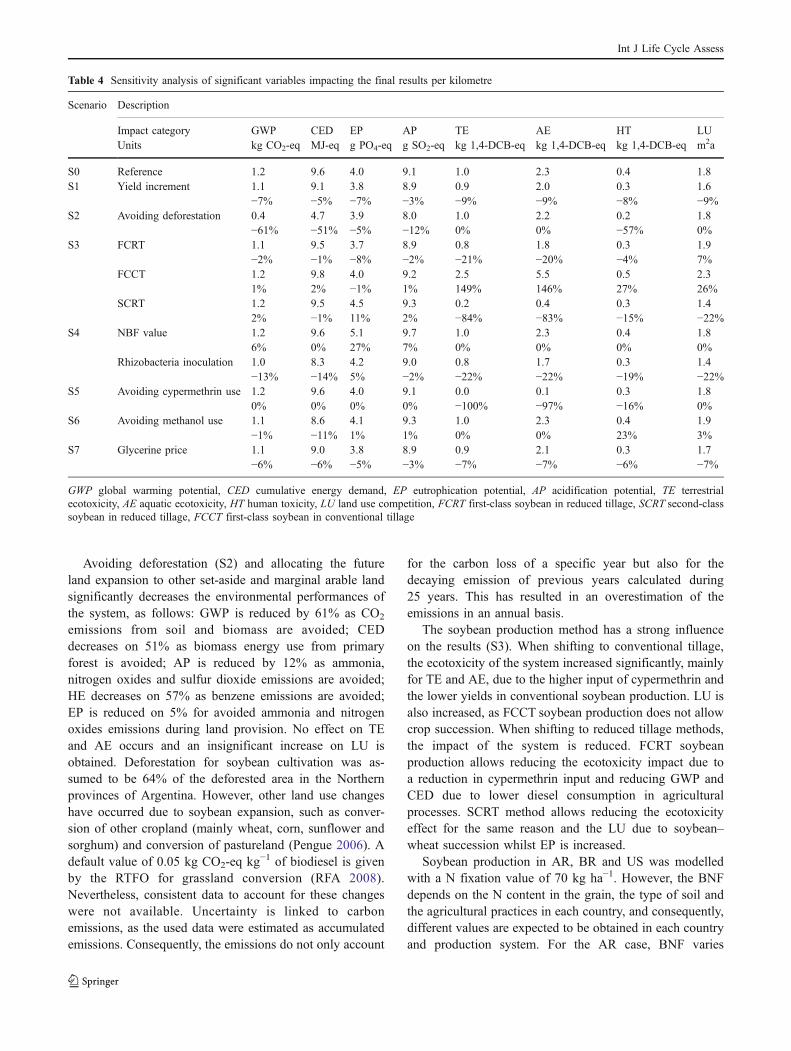
Table 4 Sensitivity analysis of significant variables impacting the final results per kilometre
Scenario Description
Impact category GWP CED EP AP TE AE HT LUUnits kg CO2-eq MJ-eq g PO4-eq g SO2-eq kg 1,4-DCB-eq kg 1,4-DCB-eq kg 1,4-DCB-eq m2a
S0 Reference 1.2 9.6 4.0 9.1 1.0 2.3 0.4 1.8S1 Yield increment 1.1 9.1 3.8 8.9 0.9 2.0 0.3 1.6
−7% −5% −7% −3% −9% −9% −8% −9%S2 Avoiding deforestation 0.4 4.7 3.9 8.0 1.0 2.2 0.2 1.8
−61% −51% −5% −12% 0% 0% −57% 0%S3 FCRT 1.1 9.5 3.7 8.9 0.8 1.8 0.3 1.9
−2% −1% −8% −2% −21% −20% −4% 7%FCCT 1.2 9.8 4.0 9.2 2.5 5.5 0.5 2.3
1% 2% −1% 1% 149% 146% 27% 26%SCRT 1.2 9.5 4.5 9.3 0.2 0.4 0.3 1.4
2% −1% 11% 2% −84% −83% −15% −22%S4 NBF value 1.2 9.6 5.1 9.7 1.0 2.3 0.4 1.8
6% 0% 27% 7% 0% 0% 0% 0%Rhizobacteria inoculation 1.0 8.3 4.2 9.0 0.8 1.7 0.3 1.4
−13% −14% 5% −2% −22% −22% −19% −22%S5 Avoiding cypermethrin use 1.2 9.6 4.0 9.1 0.0 0.1 0.3 1.8
0% 0% 0% 0% −100% −97% −16% 0%S6 Avoiding methanol use 1.1 8.6 4.1 9.3 1.0 2.3 0.4 1.9
−1% −11% 1% 1% 0% 0% 23% 3%S7 Glycerine price 1.1 9.0 3.8 8.9 0.9 2.1 0.3 1.7
−6% −6% −5% −3% −7% −7% −6% −7%
GWP global warming potential, CED cumulative energy demand, EP eutrophication potential, AP acidification potential, TE terrestrialecotoxicity, AE aquatic ecotoxicity, HT human toxicity, LU land use competition, FCRT first-class soybean in reduced tillage, SCRT second-classsoybean in reduced tillage, FCCT first-class soybean in conventional tillage
Int J Life Cycle Assess
between 80 and 120 kg ha−1 (Díaz Zorita 2003; Racca2002), and reduced tillage systems allow fixing more Nthan conventional tillage systems (González 2007). BNFvalues of 120, 80, 100 and 70 kg N ha−1 are assumed forFCRT, SCRT, FCCT and SCCT, respectively (S4). BNFvalues are estimated in function of crop yields and as 50%of the soybean N requirements (Melgar, personal commu-nication).The new BNF values have mainly increased the EP.Soybean inoculation with rhizobacteria allows increasingBNF and this results in reducing fertiliser inputs andincreasing yield. A yield increment between 500 and1,000 kg ha−1 can be obtained (González 2007). This variablewas added assuming a yield increment of 750 kg ha−1 andthe new BNF values. Even though N2O emissions perhectare are increased as more N is fixed, they arecompensated by the increased yield, resulting in a reductionof the environmental impact. Because assuming other BNFvalues would have resulted in an overestimation of the N2Oemissions in the Argentinean case, compared with thereference soybean-based biodiesel pathways, the sameassumption was used in this study.
Cypermethrin use can be avoided by replacing it bydeltamethrin, another pyretroid-based pesticide use in AR(S5). The ecotoxicity of deltamethrin is significantlylower than that of cypermethrin, resulting in reductionof the TE, the AE and the HT of 100%, 97% and 16%,respectively.
An alternative to reduce CED from methanol use is tosubstitute it by bioethanol (3.6 MJ-eq kg−1 Braziliansugarcane-based ethanol (Jungbluth et al. 2007) comparedto 37.4 MJ-eq kg−1 methanol; S6). Using ethanol as thealcohol in the transesterification reaction can significantlyimprove the energy balance of the Argentinean pathwaywhen this is proven technically feasible. When importingBR sugarcane-based ethanol, including 1,000 km transportin 28 t trucks from fermentation plant to the port of Foz doIguaçu, 1,000 km transport by barge tanker to the Rosarioport and 100 km transport in 28 t truck to the esterificationplant, the CED decreases by 11%. Nonetheless, HT isincreased due to emissions to air during bioethanoltransport. Domestic ethanol production can significantlyreduce this impact.
Best case includes higher productivity, no deforestation,reduced tillage, soybean inoculation, avoiding cypermethrinuse and avoiding methanol use in VOME transesterifica-tion. These measures should be undertaken in order to makeAR biodiesel more environmentally competitive.
Sensitivity analysis of allocation methods (economic,mass, energy and carbon content) did not result insignificant differences for the Argentinean case nor for thereference cases. The different vegetable oil extraction yieldand the higher oil content for rapeseed and palm fruitbunches in the EU, CH and MY (397 and 380 kg oil per ton
rapeseed and 242 kg oil per ton palm fruit bunches,respectively) than for soybean in AR, BR and the US(182, 182 and 188 kg oil per ton soybean) determinesdifferent allocation factors and consequently contributes toexplain the different results.
Allocation of glycerine results for AR was based onnational market price (US$0.1 per kilogram of glycerine).The reference cases were modelled assuming higher prices(US$0.66 per kilogram in the US and BR, US$1.66 perkilogram in CH, the EU and MY). The impact factors forglycerine are highly influenced by the low market value ofcommercial glycerine in Argentina. Increased production ofbiodiesel may generate export opportunities for glycerine.Performing the allocation based on US glycerine marketprice (S7) results in a 500% increase in the environmentalimpact of glycerine (results are similar to those of the BRcase for GWP, CED, EP, AP and LU and similar to the EUcase for ecotoxicity effects) and an average decrease of 6%of the impact of B100soyARG-CH for all categories.Consequently, even though the allocation method did notsignificantly affect the result, the price variation ineconomic allocation has a strong impact.
The impact of transportation and utilisation phase is afunction of transport distance and the type of vehicle usedin each country. When biodiesel is intended to be exportedto other country, the values “at Port” in Table 1 should beused and the impact of the transport and distribution to thechosen country and the assumptions related to the utilisa-tion phase should be added.
The AR case was modelled with a higher level of detailthan the reference cases, especially in the agricultural phasewhere four different production systems were considered.As shown in the sensitivity analysis, when assuming oneproduction system for all soybean production, results aresignificantly modified.
5 Conclusions
Argentinean biodiesel producers will need to study theenvironmental performance of their products in order tocomply with sustainability criteria being developed (Farrelland Sperling 2007a, b; Bauen et al. 2007; Cramer et al.2007). Due to the potential of Argentina to producebiodiesel for export, this work constitutes a baseline toanalyse the environmental impact of this feedstock andcountry-specific pathway by estimating the energy con-sumption, the GHG emissions, the acidification and theeutrophication potentials, the ecotoxicity effects and theland use competition of soybean-based biodiesel productionin Argentina for export. The position of Argentina as asoybean-based biodiesel exporter is proven to be notcompetitive from the environmental point of view unless
Int J Life Cycle Assess
specific measures are undertaken. These measures includeavoiding deforestation, applying reduced tillage and cropssuccessions, applying soybean inoculation methods, in-creasing yield, using low ecotoxicity pesticides and usingbiomass-based methanol or bioethanol in VOME produc-tion. Compared with the fossil reference, the AR pathwayhas a worse performance in all the impact categories withthe exception of energy consumption. The analysis of theexplanatory factors shows the significant influence of theland use change, the BNF and the use of fertilisers, theapplied pesticides, the soybean production method, the useof methanol and the transport system in the environmentalimpact.
6 Recommendations and perspectives
6.1 Modelling approach
Modelling of the agricultural phase is still too rigid. Moreefforts should be conducted to account for interactionsbetween input and output variables (e.g. the impact ofprevious crop management, the correlation between appli-cation of fertilisers and yield increment, the influence ofsoybean inoculation on N2O emissions, the relationbetween tillage method and fertiliser use). Better knowl-edge of these correlations will allow improving agriculturalphase modelling.
Better accounting for land use changes, interactionbetween variables and previous crops in the agriculturalphase, future transesterification technologies and marketprices evolution are essential to improve modelling ofbiofuel pathways.
Soybean in Argentina is cultivated as monoculture aswell as in rotation with wheat. The management of theprevious crop will have an impact on the subsequentsoybean culture. Nitrogen fertiliser was allocated to thecrop to which it was applied. No residual effect to thesecondary crop was considered. However, in reality,second-class soybean, cultivated after wheat, is not addi-tionally fertilised as it uses the residual N from the wheatfertilisation. Similar consequences may apply to the use ofpesticides and the choice of the tillage method. Expandingthe system to account for crops succession will help tobetter model the system inputs in the agricultural phase.Moreover, the development of new transesterificationtechnologies, the choice of additives and process optimisa-tion may influence the impact of the system on theenvironment.
The level of detail of data inputs should be improvedin order to better account for regional specificities and togenerate consistent average data at the national level.Nonetheless, more efforts should be conducted to
harmonise LCA methodology for biofuel impact assess-ment in order to allow comparison between biofuelpathways.
The values for the fossil reference system are actually‘black box’ results. However, the same modelling concerns(i.e. allocation method) of the biofuel pathways applied tothe fossil reference (Guinée and Heijungs 2007). Furtherefforts are needed in this issue.
Based on the LASEN Biofuel’s Platform, perspectivesinclude the study of modelling choices in this pathway, theintegration of agricultural models and the improvement ofthe LCI data especially for the oil extraction and trans-esterification phases.
Carbon emissions from deforestation should be betteraccounted for when new data become available.
6.2 Data uncertainty
The process of land provision from deforestation should becharacterised for the AR case. Soybean cultivation data ondeforested areas should be improved and become moreconsistent, including the amount of soybean cultivated indeforested land, soybean cultivation period, soybean yieldsand the applied agricultural practices.
Grain drying is identified as an important contributor inthe rapeseed-based reference systems. This process shouldbe better modelled when more data become available. Dataon transesterification process should be developed and dataon oil production should be improved.
In order to assess more accurately biodiesel productionpathways, further consideration should be given to includeindirect land use changes. For example, US soybean isproduced in rotation with corn, and so, increased cornacreage in US will reduce soybean production and increasesoybean price. This may be encouraging soybean expansionin AR and BR and consequently encouraging deforestationprocesses in these countries. However, an attributional LCAcan not capture this kind of effects and further research isneeded to determine and allocate indirect land use changesto a biofuel pathway.
Data on soybean production methods and agriculturalpractices should be harmonised, georeferenced and officiallyvalidated. Data at the county level should be developed,integrated and become consistent with national averagevalues to account for production scale effects and logisticalconstraints in biodiesel production.
Acknowledgements We kindly acknowledge Luciana Moltoni andJorge Hilbert from the Institute of Rural Engineering at the NationalInstitute of Agricultural Technology in Argentina (IIR-INTA) for dataprovision. We are grateful to Andres Leone from the National BiofuelsProgram at the Secretary of Agriculture, Livestock, Fishery and Food(SAGPyA) in Argentina for his useful comments and Ignacio Gasparri
Int J Life Cycle Assess
from the University of Tucumán (LIEY-CONICET) for providing dataand validating hypotheses on deforestation and land use changeemissions. Finally, we are grateful to anonymous reviewers for theiruseful remarks to improve this paper.
References
ADEME (2002) Bilans énergétiques et gaz à effet de serre des filièresde production des biocarburants, rapport technique. ADEME,DIREM, PriceWaterhouseCoopers
Asal S, Marcus R (2005) An analysis of the obstacles to the developmentof a sustainable biodiesel industry in Argentina. Report. UniversitéParis-Dauphine. DU-Développement Durable & Organisations
Bauen A, Watson P, Howes J (2007) Carbon reporting within therenewable transport fuel obligation: methodology. E4tech
Benbrook CM (2005) Rust, resistance, run down soils and rising costs—problems facing soybean producers in Argentina. Ag BiotechInfoNet, Technical Paper no. 8. 20 January 2005
Bernesson S, Nilsson D, Hansson PA (2004) A limited LCAcomparing large- and small-scale production of rape methyl ester(RME) under Swedish conditions. Biomass Bioenerg 26:545–559
Cramer J et al (2007) Testing framework for sustainable biomass.Final report from the project group ‘Sustainable production ofbiomass’. Creative Energy
Ciani R, Esposito A (2005) Perfil descriptivo de la cadena deoleaginosos. SAGPyA. Available at: http://www.sagpya.gov.ar.Accessed 15 December 2006 (in Spanish)
CONCAWE-EUCAR-JRC (2007) Well-to-wheels analysis of futureautomotive fuels and powertrains in the European context. Well-to-wheels report, version 2c. Available at: http://ies.jrc.cec.eu.int/wtw.html. Accessed 10 March 2008
Dalgaard R, Schmidt J, Halberg N, Christensen P, Thrane M, PengueWA (2007) LCA of soybean meal. Int J Life Cycle Assess 13(3):240–254
Díaz Zorita, M (2003) Nuevas estrategias en el manejo de la soja.Fertilización en soja en Argentina. En: Simposio internacionalsobre soja. XI Congreso Nacional de AAPRESID. Tomo 2. pp113–127
Donato L, Moltoni L, Hilbert J (2005) La producción de biocombus-tibles empleando siembra directa en la Argentina: Implicanciaseconómicas y energéticas. Instituto de Ingeniería Rural-INTA (inSpanish)
Elsayed MA, Matthews R, Mortimer ND (2003) Carbon and energybalances for a range of biofuels options. Project No. B/B6/00784/REP URN 03/836. Available at: http://www.berr.gov.uk/files/file14925.pdf. Accessed 10 March 2008
Fargione J, Hill J, Tilman D, Polasky S, Hawthorne P (2008) Landclearing and the biofuel carbon debt. Science 319(5867):1235–1238
Farrell AE, Plevin RJ, Turner BT, Jones AD, O’Hare M, Kammen DM(2006) Ethanol can contribute to energy and environmental goals.Science 311(5781):506–508
Farrell AE, Sperling D (2007a) A low-carbon fuel standard forCalifornia, Part 1: technical analysis. University of California
Farrell AE, Sperling D (2007b) A low-carbon fuel standard forCalifornia, part 2: policy analysis. University of California
Food and Agriculture Organization of rhe United Nations (2004) Fertilizeruse by crop in Argentina. Land and Plant Nutrition ManagementService, Land and Water Development Division, Rome
Franco D (2005a) Aceite de soja: Análisis de Cadena Alimentaria.SAGPyA. Available at: http://www.alimentosargentinos.gov.ar.Accessed 15 December 2006 (in Spanish)
Franco D (2005b) Logística en la cadena de oleaginosas. SAGPyA,Dirección de Industria Alimentaria. Revista Alimentos ArgentinosN° 30, Oct. 2005. Available at: http://www.alimentosargentinos.gov.ar. Accessed 8 December 2006 (in Spanish)
Frischknecht R (2005) Ecoinvent data v1.1 (2004): from heterogenousdatabases to unified and transparent LCI data. Int J Life CycleAssess 10(1):1–2
Frischknecht R, Jungbluth N, Althaus HJ, Doka G, Dones R, Heck T,Hellweg S, Hischier R, Nemecek T, Rebitzer G, Spielmann M(2004) The ecoinvent database: overview and methodologicalframework. Int J Life Cycle Assess 10(1):3–9
Gasparri NI, Grau H, Manghi E (2008) Carbon pools and emissionsfrom deforestation in extra-tropical forests of northern Argentinabetween 1900 and 2005. Ecosystems 11:1247–1261
Gasparri NI, Manghi E (2004) Estimación de volumen, biomasa ycontenido de carbono de las regions forestales argentines.Informe final, Unidad de Manejo del Sistema de EvaluaciónForestal, Dirección de bosques, Secretaría de ambiente ydesarrollo sustentable, Septiembre 2004 (in Spanish)
GM-LBST (2002) GM Well-to-wheel analysis of energy use andgreenhouse gas emissions of advanced fuel/vehicle systems: aEuropean study. General Motors, L-B-Systemtechnik
Gnansounou E, Dauriat A (2005) Energy balance of bioethanol: asynthesis. Proceedings of the 14th European Biomass Conference& Exhibition, Paris, France, Oct. 2005
Gnansounou E, Dauriat A, Panichelli L, Villegas JD (2008)Energy and greenhouse gas balances of biofuels: biasesinduced by LCA modelling choices. J Sci Ind Res (JSIR)67:885–897
González N (2007) Fijación de Nitrógeno en soja. Uso de inoculantes.Available at: http://www.planetasoja.com/trabajos/trabajos800.php?id1=3277&id2=3278&idSec=26. Accessed 22 February2008 (in Spanish)
Grau HR, Gasparri NI, Aide TM (2005) Agriculture expansion anddeforestation in seasonally dry forests of north-west Argentina.Environ Conserv 32(2):140–148
Guinée JB, Heijungs R (2007) Calculating the influence of alternativeallocation scenarios in fossil fuel chains. Int J Life Cycle Assess12(3):173–180
Houghton RA (2003) Revised estimates of the annual net flux ofcarbon to the atmosphere from changes in land use and landmanagement 1850–2000. Tellus 55B(2):378–390
IDIED (2004) Instituto de Investigación en Economía y Direcciónpara el Desarrollo, Universidad Austral. Indicadores económicosregionales, Septiembre 2004. Available at: http://www.austral.edu.ar/FCE/inst_idied.htm. Accessed 8 December 2006 (inSpanish)
ISO (2006a) Norma ISO 14040:2006. Environmental management.Life cycle assessment. Principles and framework
ISO (2006b) Norma ISO 14044:2006. Environmental management.Life cycle assessment. Requirements and guidelines
Johnston M, Holloway T (2007) A global comparison of nationalbiodiesel production potentials. Environ Sci Technol 41:23
Jungbluth N, Faist Emmenegger M, Dinkel F, Stettler O, Doka G,Chudacoff M, Dauriat A, Gnansounou E, Sutter J, Spielmann M,Kljun N, Schleiss K (2007) Life cycle inventories of bioenergy.Data v2.0 (2007), ecoinvent report No. 17, Swiss Center for LifeCycle Inventories, Uster
Kløverpris J, Wenzel H, Nielsen PH (2007) Life cycle inventorymodelling of land use induced by crop consumption. Part 1:conceptual analysis and methodological proposal. Int J LifeCycle Assess 13(1):13–21
Kløverpris J, Wenzel H, Banse M, Milà i Canals L, Reenberg A(2008) Conference and Workshop on Modelling Global LandUse Implications in the Environmental Assessment of Biofuels.Int J Life Cycle Assess 13(3):178–183
Int J Life Cycle Assess
Márgenes agropecuarios (2006) Costos y márgenes de producciónpara soja de primera y soja de segunda. Revista MárgenesAgropecuarios, 2/10/06, pp 57–59 (in Spanish)
Montenegro C, StradaM, Bono J, Gasparri NI, Manghi E, ParmuchiMG,Brouver M (2005) Estimación de la pérdida de superficie debosque nativo y tasa de deforestación en el norte de argentina. 3ercongreso forestal argentino y latinoamericano 6–9 Septiembre2005, Corrientes (in Spanish)
Nemecek T, Heil A, Huguenin O, Meier S, Erzinger S, Blaser S, Dux D,Zimmermann A (2007) Life Cycle Inventories of AgriculturalProduction Systems. ecoinvent report No. 15, v2.0. Agroscope FALReckenholz and FAT Taenikon, Swiss Centre for Life CycleInventories, Dübendorf
Paruelo JM, Guerschman JP, Verón SR (2005) Expansión agrícola ycambios en el uso del suelo. CienciaHoy Bs As 15(87):14–23 (inSpanish)
Pengue WA (2005) Transgenic crops in Argentina: the ecological andsocial debt. Bull Sci Technol Soc 25(NA):1–9
Pengue WA (2006) Increasing roundup ready soybean export fromArgentina. In: Trydeman Knudsen M, Halberg N, Olesen JE,Byrne J, Iyer V, Toly N (eds) Global trends in agriculture andfood systems. CEEP Publications, USA
Racca R (2002) Fijación biológica del nitrógeno. In: Actas 1er Simposiode Fertilidad de Suelos y Fertilización en Siembra Directa, XCongreso Nacional de AAPRESID, pp 197–208 (in Spanish)
Reijnders L, Huijbregts MAJ (2008) Palm oil and the emission ofcarbon-based greenhouse gases. J Clean Prod 16:477–482
RFA (2008) Carbon and sustainability reporting within the renewabletransport fuel obligation. Technical Guidance, Office of theRenewable Fuels Agency
Righelato R, Spracklen DV (2007) Carbon mitigation by biofuels orby saving and restoring forests. Science 317(5840):902–902
Russi D (2008) An integrated assessment of a large-scale biodieselproduction in Italy. Energ Policy 36:1169–1180
SAGPyA-IICA (2005) Secretaria de Agricultura, Ganadería, Pesca yAlimentos—Instituto Interamericano de Cooperación para laAgricultura. Perspectivas de los biocombustibles en la Argentinay en Brasil. Documento no. ISBN: 987-9159-07-1
SAGPyA (2006a) Estimaciones agrícolas. Available at: http://www.sagpya.gov.ar. Accessed 15 December 2006 (in Spanish)
SAGPyA (2006b) Panorama del uso y consumo de fertilizantes enArgentina. Available at: http://www.sagpya.mecon.gov.ar.Accessed 15 December 2006 (in Spanish)
SAGPyA (2006c) Evolución de los precios externos de oleaginosos.Available at: http://www.sagpya.mecon.gov.ar. Accessed 15December 2006 (in Spanish)
SAGPyA (2008) Más de 260 millones de dólares en exportaciones debiodiesel durante 2007. Press communication
Searchinger T, Heimlich R, Houghton RA, Dong F, Elobeid A,Fabiosa J, Tokgoz S, Hayes D, Yu TH (2008) Use of U.S.croplands for biofuels increases greenhouse gases throughemissions from land use change. Science 319(5867):1238–1240
SERP (Secretaría de Energía de la República Argentina) (2006)Cálculo del factor de emisiones de CO2 de la red argentina deenergía eléctrica. Available at: http://energia3.mecon.gov.ar.Accessed 4 October 2007
Sheehan J, Duffield J, Shapouri H, Graboski M, Camobrero V (1998)An overview of biodiesel and petroleum diesel life-cycles.National Renewable Energy Laboratory, US Department of Energy
Smith EG, Janzen HH, Newlands NK (2007) Energy balances ofbiodiesel production from soybean and canola in Canada. Can JPlant Sci 87(4):793–801
VIEWLS (2005) Environmental and economic performance ofbiofuels, vo I, main report. VIEWLS Project, SenterNovem
Zah R, Böni H, Gauch M, Hischier R, Lehmann M, Wäger P (2007)Ökobilanzierung von Bioenergie: Ökologische Bewertung derTreibstoffnutzung. Schlussbericht, Entwurf Version 1.3.0. EMPA,Abteilung Technologie und Gesellschaft, 2007 (in German)
Int J Life Cycle Assess