life cycle assessment study of starch products for the
TRANSCRIPT

Life Cycle Assessment study of starch products for the European starch industry association (AAF): sector study Vercalsteren An, Dils Evelien, Boonen Katrien
Study accomplished under the authority of the European starch industry association (AAF) 2011/TEM/R/104 August 2012

All rights, amongst which the copyright, on the materials described in this document rest with the Flemish Institute for Technological Research NV (“VITO”), Boeretang 200, BE-2400 Mol, Register of Legal Entities VAT BE 0244.195.916.

Table of Contents
3
TABLE OF CONTENTS
Table of Contents ________________________________________________________________ 3
List of Figures ___________________________________________________________________ 4
List of Tables ____________________________________________________________________ 5
CHAPTER 1 Introduction ________________________________________________________ 7
CHAPTER 2 Definition of goal and scope ___________________________________________ 9
2.1. Introduction 9
2.2. Goal definition 9
2.3. Scope definition 10
CHAPTER 3 Life cycle data inventory _____________________________________________ 15
CHAPTER 4 life cycle impact assessment __________________________________________ 19
4.1. LCIA methodology 19
4.2. Environmental profiles of starch products 20 4.2.1. Environmental profile of native starches _________________________________ 20 4.2.2. Environmental profile of liquid glucose (including Glucose and Fructose syrups) __ 20
4.3. Carbon uptake 21
4.4. sensitivity analyses 22 4.4.1. sensitivity analysis for electricity _______________________________________ 22 4.4.2. sensitivity analysis for agricultural data __________________________________ 22 4.4.3. sensitivity analysis for infrastructure ____________________________________ 23
CHAPTER 5 SUMMARY_________________________________________________________ 25
5.1. General conclusions 25
5.2. Improvements and recommendations 27
Glossary ______________________________________________________________________ 29
References ____________________________________________________________________ 30

List of Figures
4
LIST OF FIGURES
Figure 1: Stepwise approach as suggested for this LCA study for the European starch industry ___ 9 Figure 2: Generic presentation of system boundaries ___________________________________ 10 Figure 3: Environmental impacts of native starches production ___________________________ 20 Figure 4: Environmental impacts of liquid glucose production ____________________________ 20 Figure 5: Carbon footprint and biogenic carbon uptake for1 ton DS of the raw material mixture _ 21 Figure 6: relative contribution of different production inputs to the products environmental
impacts ___________________________________________________________________ 26

List of Tables
5
LIST OF TABLES
Table 1: Overview of the selected environmental impact categories for the complete sector study .................................................................................................................................................... 13
Table 2: Overview of transportation modes and distances for the raw materials ............................ 16


CHAPTER 1 Introduction
7
CHAPTER 1 INTRODUCTION
Recently, different initiatives have started that are related to the assessment of environmental impacts (a.o. carbon footprint) of products in general and food products in particular from a life cycle perspective. To be able to participate actively in these discussions and to be prepared for implementation of possible future legislation, the European starch industry association (AAF) decided to do a life cycle assessment (LCA) study for its products. The AAF decided to undertake the study in 2 phases:
- A pretesting phase that is based on a limited dataset and focuses on methodological issues (allocation rules, system boundaries, biogenic carbon, etc.). Due to the limited dataset, the absolute environmental impacts that result from this phase cannot be considered as representative for the entire European starch industry. This phase was finalized in February 2011.
- A more extensive sector study that follows the methodology as defined in the pretesting phase. This LCA is based on an extensive dataset that is representative for the European starch industry and results in environmental profiles for starch industry products.
This report is a summary of the second phase. The European starch industry association (AAF) can use the results of this LCA study for the following purposes:
- to focus improvement activities on the most important impact-generating process phases;
- for communication with various stakeholders and to exchange the knowledge gained through having done the exercise with national and sector initiatives;
- to anticipate future legislation regarding environment and certification (product development);
- to compose an EPD (Environmental Product Declaration), as described in ISO TR 14025 (ISO, 2006).
The methodology used to determine the environmental impacts of the starch products conforms to the LCA methodology, as prescribed in ISO standards 14040 and 14044 (ISO, 2006). According to these ISO standards, an LCA is carried out in 4 phases:
1. Goal and scope definition of the study; 2. Life cycle data inventory (LCI); 3. Life cycle impact assessment (LCIA); 4. Interpretation.
The design of this report complies with these 4 phases of the LCA, whereby the various chapters describe each phase of the LCA. All relevant ISO guidelines were implemented in compiling the present report (ISO 14044, paragraph 5.2).

CHAPTER 2 Definition of goal and scope
9
CHAPTER 2 DEFINITION OF GOAL AND SCOPE
2.1. INTRODUCTION
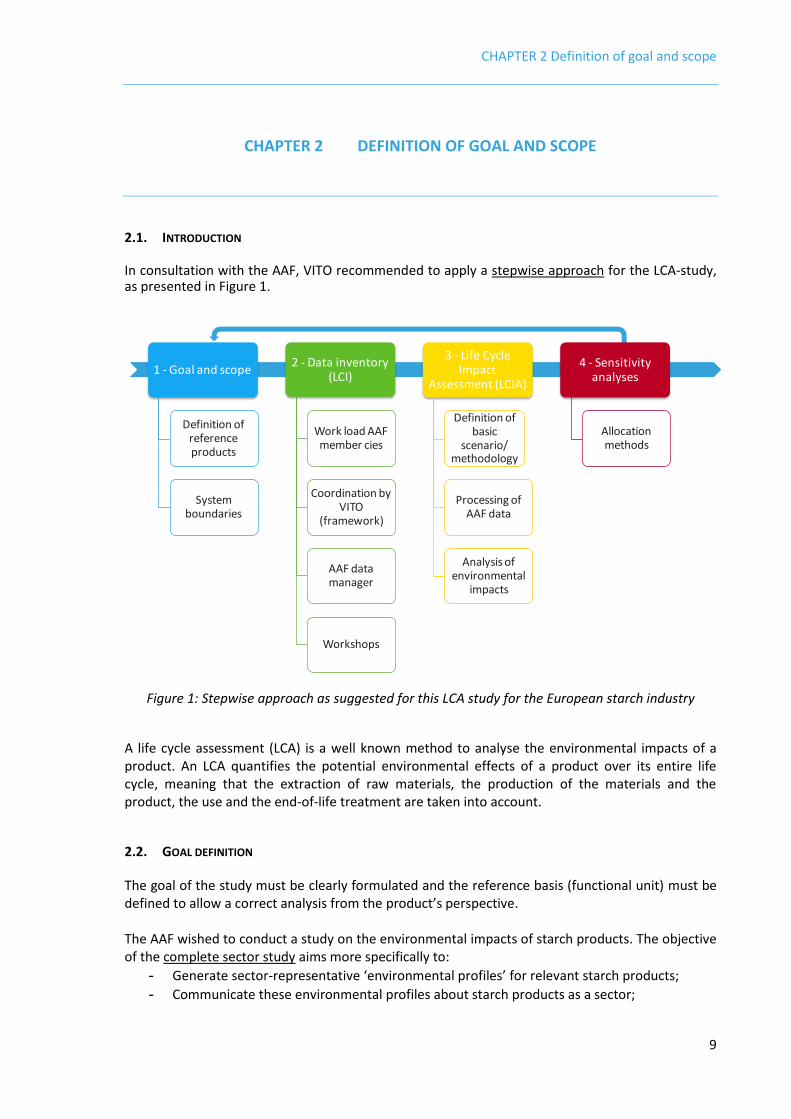
In consultation with the AAF, VITO recommended to apply a stepwise approach for the LCA-study, as presented in Figure 1.
Figure 1: Stepwise approach as suggested for this LCA study for the European starch industry
A life cycle assessment (LCA) is a well known method to analyse the environmental impacts of a product. An LCA quantifies the potential environmental effects of a product over its entire life cycle, meaning that the extraction of raw materials, the production of the materials and the product, the use and the end-of-life treatment are taken into account.
2.2. GOAL DEFINITION
The goal of the study must be clearly formulated and the reference basis (functional unit) must be defined to allow a correct analysis from the product’s perspective. The AAF wished to conduct a study on the environmental impacts of starch products. The objective of the complete sector study aims more specifically to:
- Generate sector-representative ‘environmental profiles’ for relevant starch products;
- Communicate these environmental profiles about starch products as a sector;
1 - Goal and scope
Definition of reference products
System boundaries
2 - Data inventory(LCI)
Work load AAF member cies
Coordination by VITO
(framework)
AAF data manager
Workshops
3 - Life CycleImpact
Assessment (LCIA)
Definition of basic
scenario/ methodology
Processing of AAF data
Analysis of environmental
impacts
4 - Sensitivityanalyses
Allocationmethods

CHAPTER 2 Definition of goal and scope
10
- Contribute proactively, through the knowledge gained in the development of the starch sector eco-profile, to stakeholders and other national/sectors initiatives .
2.3. SCOPE DEFINITION
The scope of the study includes a large review of products from the starch industry from native starch to polyols, including non starch products from wheat, maize or potatoes, such as gluten. Some of the reference products are intermediate products, which means that they mostly have no economic value. Starch slurries from maize, potatoes and wheat have different production processes but result in a comparable intermediate product. Different other products are produced during the production processes of starch slurry from maize, potatoes or wheat. The production of final products usually starts from intermediate products like starch slurry. The production processes for final products differ significantly and are independent of the raw material (maize, wheat, potatoes). The environmental profile of final products is divided in two:
- The contribution of agriculture; - The industrial processes for the production of final products.
The scope of the study is also defined by the functional unit. The functional unit is closely related to the function(s) fulfilled by the to-be-investigated product. The definition of the functional unit was agreed upon together with the AAF participating companies before performing the study as “the production of 1 ton d.s. (dry substance) of reference products”. In consultation with AAF it was decided to focus on the cradle-to-gate processes. The system boundary diagram shown in Figure 2 below generically outlines the different life cycle stages and the inputs and outputs that are included in the system boundaries of this study.
Figure 2: Generic presentation of system boundaries

CHAPTER 2 Definition of goal and scope
11
The following life cycle stages are included in our cradle-to-gate approach: - Cradle-to-raw materials: These are all the processes upstream of the starch production stage.
This includes the production of raw materials used (e.g. growing of maize, wheat or potatoes), the production of energy, the production of chemicals needed for starch production (caustic soda, hydrochloric acid etc.), ...;
- Factory alone/gate-to-gate: This focuses on the AAF member companies producing all reference products.
- Transport step: Transport of raw materials from the field/storage to the starch plants is included here. Transportation from the factory (AAF member companies) to customers is excluded.
A cradle-to-gate study is a solution foreseen in relevant standards in business-to-business situations, which is the case for the European starch industry. It must be kept in mind that the PAS 2050 as well as the draft ISO 14067 require a partial carbon footprint (cradle-to-gate) to end at the receiving gate of the next business. To fulfill this requirement also the transportation to the customers of the European starch industry should be taken into account. In the case of the starch industry it would have been particularly complicated given the number of products/destinations. In addition, it was deemed to have no significance compared to other impacts as customers are most often situated close to the production sites. Therefore, it was excluded of the scope of this study. To clearly define the system boundaries, some basic principles need to be denoted: Infrastructure (the use of the capital goods and the effects related to this) is defined in a
number of references: - PAS 2050: the Greenhouse Gas (GHG) emissions arising from the production of capital
goods used in the life cycle of the product shall be excluded from the assessment (par. 6.4.3).
- ILCD: A systematic exclusion of e.g. transport, infrastructure, services, administration activities, etc. is not appropriate unless necessary according to the specific goal of the LCI/LCA study (par. 6.6.2).
- ISO 14040: When setting the system boundaries, several life cycle stages should be taken into consideration … manufacture, maintenance and decommissioning of capital equipment (See sensitivity analysis in point 4.4.3 ).
For the purpose of the AAF study – the following decisions were taken with regards to infrastructures: Infrastructures, in this respect referring to transportation infrastructures (roads, railways …) and infrastructures for energy production (electricity plants, pipelines …) were excluded. Infrastructures related to the AAF sites are also excluded, but this is justified due to the fact that a huge volume of reference products can be produced during the life span of the infrastructures of AAF plants and as such the impact of their manufacture and maintenance is negligible related to the amount of products produced. The baseline scenario calculations include infrastructures. but In the sensitivity assessment infrastructures has been excluded in order to see the effect on the environmental profiles (calculation for liquid glucose from weighted average mixture of raw materials).
Accidental pollutions are often difficult to distinguish from emissions that occur under normal conditions (accidental pollutions are not measured and reported separately) and are therefore not considered in this study.
Environmental impacts caused by the personnel of the production plants and by infrastructures such as offices are neglected, e.g. waste from the cafeteria and sanitary installations or accidental pollution caused by human mistakes, or environmental effects caused by commuter traffic.
Allocation procedures are needed when dealing with systems involving multiple products. According to ISO 14040/44, allocation is defined as ‘partitioning the input or output flows of a

CHAPTER 2 Definition of goal and scope
12
process or a product system between the product system under study and one or more other product systems’. The materials and energy flows as well as associated environmental releases shall be allocated to the different products according to clearly stated procedures, which shall be documented and justified. Allocation is very important in the AAF study, since the starch industry produces a wide range of different reference products per specific raw material (either maize or wheat or potatoes). Many process steps in the starch industry produce more than one useful output. This is called by-product allocation. Allocation is also important for the correct modeling of High Efficiency Combined Heat and Power installations (CHP) that are used extensively by many starch producing companies. In the pretesting phase different allocation rules were applied under different boundaries and taking into account guidelines from the relevant standards and handbooks (e.g. ISO 14040/44, PAS2050, ILCD handbook, etc.). In the pretesting phase the following allocation rules were applied:
- Physical relation: o Mass basis (dry substance) o Energy content: Specifically requested in the Renewable Energy Directive but
mainly focusing on fuels (e.g. ethanol); - Economic relation:
o Market price per ton d.s. (100% d.s.): Estimation of market price in period mid 2009-mid 2010; For 100% dry products (although other products or intermediate products,
according to system boundaries, are often wet products so allocation rule is not 100% correct).
Based on the results of the pretesting, the AAF decided to use mass allocation in the second phase of the LCA study. Mass allocation was chosen because it offers the clearest picture throughout the process tree and is based on the best available data. This corresponds to the recommendation of the ISO 14040/44 standards and the ILCD Handbook, which both prefer allocation based on physical relationships. In theory, allocation should be done based on the product characteristics at the point of allocation. Since starch slurry production process in the starch industry are complex and considered as a ‘black box’, it is impossible to give data on that level of detail (each step in the production process). To allocate the environmental impact but also benefits of the CHP to either heat or electricity, different methods are available. Allocation can be based on i) operational activities (electricity only, heat only), ii) thermodynamic parameters (energy, exergy) or iii) final product prices. As the pretesting phase showed no significant difference in total carbon footprint calculated for energy and exergy allocation, allocation of emissions from CHP based on energy was chosen. The input- and output flows respectively of the CHP electricity and heat output are modeled according to energy allocation. These allocated impacts (of the CHP systems) are then distributed respectively to the amount of electricity and heat produced by High Efficiency CHP systems. As reg ards the carbon footprint, for now, the impact of Land Use Change (LUC) was not included, due to the lack of a generally accepted calculation method. In several other studies, this is not included either, which means that also for consistency reasons, the impact of land use change on carbon footprint was excluded here as well. However, despite the absence of ad hoc calculations, the supply of the starch industry is issued from local crops, from arable land that have existed for a long time. The agricultural sector is mature in Europe and we may well assume there is no direct LUC resulting from the starch

CHAPTER 2 Definition of goal and scope
13
industry’s raw materials cultivation. In addition, it could also be assumed that there is no more indirect LUC for food and feed products (food NEED to be produced – food and feed applications represent today more than 75% of the EU starch industry production volume). For this project, the AAF defined a selection of environmental impact categories to be included in the LCA. Life cycle impact assessment (LCIA) methods recommended by ILCD (2011) were chosen to calculate the impacts for each category. Not all recommended methods could be used, due to limitations of currently available databases and software. If another method was used, the table 1 gives the reason for this and indicates the method that was used instead.
Table 1: Overview of the selected environmental impact categories for the complete sector study
Environmental impact category
LCIA method recommended by ILCD for this environmental impact category - Indicator
Is the recommended method used for this study?
If not, which method has been used?
Global warming/ Climate change
Baseline model of 100 years of the IPCC - Radiative forcing as Global Warming Potential (GWP100)
Yes
Water depletion
Model for water consumption as in the Swiss Ecoscarcity (Frischknecht et al, 2008) - Water use related to local scarcity of water
it must be noted that it is not possible at the moment to take local scarcity of water into account (country of origin unknown). Therefore consumption figures were used.
Land use Model based on Soil Organic Matter
(SOM) (Milà i Canals et al,, 2007b) - Soil Organic Matter
For this study the ReCiPe Midpoint (H) impact category ‘Agricultural land occupation’ was chosen (m²a)
On request of the participating companies, an additional impact category ‘Non-treated final waste flow for landfill and incineration is included. This is an impact category on an inventory level and it is expressed in kg waste. It is important to select the data sources in line with the goal and scope of the study. Since the AAF study focuses on the starch industry processes in the first place, it is important to use specific data for these processes. Within this project different levels of data requirements exist. The following data sources are used for the different life cycle phases:
- Factory alone Primary (specific) data from AAF member companies;
- Cradle to raw material = supply chain, agriculture Secondary (generic) data from LCA databases, i.e. the Ecoinvent database;
- Transport from suppliers to the factory Secondary (generic) data from LCA databases. For all life cycle stages an input-output balance is made:
o Input data concern the consumption of energy and raw materials; o Output data are emissions (air, water, soil), waste, other (e.g. heat).
It is focused on EU 27 as a geographical boundary. It is assumed that only raw materials from EU 27 are used (in general, 95% of raw materials are). The generic data account for the period 2000-2010. Specific data from AAF member companies are representative for the period mid 2009 – mid 2010 or the complete year 2010. The data for the starch production processes refer to currently

CHAPTER 2 Definition of goal and scope
14
available, modern technology and to good standard operating practices. For raw materials and additives, fuels and power, average industry mix profiles from the Ecoinvent database are utilised.
Data need to be representative for the European starch industry and as such based on at least 3 company specific datasets per reference product. VITO assessed the representativeness of data sets per reference product on the basis of the completed questionnaires.
Regarding cut-off criteria, it was decided to at least include bulk chemicals as input flows for all reference products. As all materials (raw materials and chemicals) are supplied in bulk packaging, packaging of incoming materials is not significant and as such not taken into consideration. Sensitivity analyses assess the influence of the most relevant and most uncertain factors on the results of the study. The results of these sensitivity analyses are compared to the basic scenario. Sensitivity analyses do not make the basic data of a study more reliable, but allow assessing the effect of a change in inventory data on the results and conclusions of the study. In this study three sensitivity assessments are performed, all based on the same dataset:
Electricity mixes (from the grid) and its impacts;
agricultural data;
excluding infrastructure. When an LCA study is used to make a comparative assertion that is disclosed to the public, the ISO standards require a critical review by interested parties to be conducted. This is not an issue here as this study does not aim at comparing different products. Should third parties wish to use this study for the purpose of LCA comparisons with other products, it would be essential that a strictly comparable methodology be applied.

CHAPTER 3 Life cycle data inventory
15
CHAPTER 3 LIFE CYCLE DATA INVENTORY
In the inventory phase all data needed to analyse the environmental impacts associated with the reference products are gathered. In summary, this means that all of the input flows (materials, energy …) and all of the output flows (emissions, waste…) are described and quantified. This is done for all life cycle phases, from cradle-to-gate. The inventory phase is performed according to the ISO 14040 and ISO 14044 (data inventory) standards (ISO, 2006). The data inventory process is focused on the following life cycle phases:
1. Growing of the maize, wheat or potatoes (agriculture): 2. Production process of the starch slurry and other products, which is roughly subdivided in:
a. Production of additives and water; b. Production of electricity and heat; c. Transport steps; d. Production step.
3. Additional processes to produce the final reference products. For the phases that refer directly to the activities of the European starch industry association’s Member companies (2 and 3), specific data are gathered by a selection of companies (13), representing 33 sites. Per reference product, VITO converted the company-specific datasets into one aggregated dataset which is used for the analysis. Aggregation is based on a weighted average, according to the annual production volumes. For the agricultural production, the AAF decided to use the Ecoinvent records from Switzerland, because of the easy access to the data, the comparability for the three different raw materials and the transparency on what is or is not included. These data records are:
- Wheat: wheat grains IP, at farm/CH U
- Maize: grain maize IP, at farm/CH U
- Potatoes: potatoes IP, at farm/CH U Table 2 gives more details on the transport of wheat, maize and potatoes to the starch production plants.

CHAPTER 3 Life cycle data inventory
16
Table 2: Overview of transportation modes and distances for the raw materials – weighted average transportation distance for each raw materials and transportation mode
Raw material Transportation mode Average transportation distance (km)
Relative use of transportation mode
(%)
Wheat
Transport, freight, rail/RER U Transport, lorry >16t, fleet average/RER U Transport, barge tanker/RER U
122 87 92
33% 33% 34%
Maize Transport, freight, rail/RER U Transport, lorry Transport, barge tanker
121 86
393
25% 53% 22%
Potatoes Transport, lorry >16t, fleet average/RER U Transport, tractor and trailer/CH U
121 10
92% 8%
Figure 6 shows that the impact to be allocated to transport is relatively low in comparison to the impact attributable to other phases of starch production. The table 2 above shows that in average, transport from field/storage to the starch plants is limited and that the supply is mainly local. For wheat and maize the significant use of transport means like tankers and trains is also demonstrated by figures of table 2; these transport means are commonly considered to be environmentally friendly compared to truck/road transport1. For potatoes, the greater use of lorries is due to the origin of raw material supply which is exclusively local. Finally, the efficiency of supply chain, which is not shown through these figures, also contributes to a limited environmental impact , with no truck/train/boat leaving storage without being fully loaded. Both electricity and heat can be produced with a CHP generation system. In the average weighted dataset, 57% of the electricity input is produced with the CHP while 43% comes from the grid. This electricity from the grid is produced according to a specific mix for each country. Once again, a weighted average electricity production mix was calculated. This means that for each country the amount of kWh input to the processes was used to do the weighting. For heat, the weighted average amount produced with the CHP is 59%. This means that for the remaining heat, a boiler is assumed (heat, natural gas, at boiler modulating >100 kW, RER U). The CHP needs to be included in the modeling as well. To do this, the data provided by the participating companies were taken into account. An average electrical and thermal efficiency, in relation to primary energy input, is calculated based on these data:
- Electrical efficiency = 29%
- Thermal efficiency = 60% The thermal efficiency is quite high. This is because it takes into account the fact that heat can be recuperated from the CHP waste gases. On request of the participating companies, an additional impact category ‘Non-treated final waste flow for landfill and incineration’ is included. This is an impact category on an inventory level and it is expressed in kg waste. It was reported on company level and not related to the different products. Result shows that on average 7,7 kg of waste for landfill and incineration is produced per ton d.s. input of wheat, maize or potatoes. If presented as a ratio, wastes of the production
1 Many studies confirm this assumption, inter alia the following studies:
http://www.eco-logica.co.uk/pdf/WWFreport.pdf
http://www.americanwaterways.com/press_room/news_releases/NWFSTudy.pdf

CHAPTER 3 Life cycle data inventory
17
processes represent less than 0,8% of the raw materials used in weight. These 7,7kg represent process wastes coming from industrial cleaning and maintenance operations but are not a wasted part of the raw materials or products themselves.


CHAPTER 4 life cycle impact assessment
19
CHAPTER 4 LIFE CYCLE IMPACT ASSESSMENT
4.1. LCIA METHODOLOGY
Usually, the inventory process generates a long list of data, which may be difficult to interpret. The Life Cycle Impact Assessment (LCIA) is a tool to relate the large number of inventory values to a smaller number of environmental themes (environmental impact categories) so that the outcome of the assessment is possible to interpret. LCAs do not represent a complete picture of the environmental impacts of a system. They represent a picture of those aspects that can be quantified. Any judgments that are based on the interpretation of LCI data must bear in mind this limitation and, if necessary, obtain additional environmental information from other sources (hygienic aspects, risk assessment, etc.). The LCIA results are relative expressions and do not predict any exceeding of thresholds, safety margins or risks. Various methods are in use to assess the environmental impacts of products and systems. For this project, the AAF defined with VITO a selection of environmental impact categories to be included in the LCA. Life cycle impact assessment (LCIA) methods recommended by ILCD (2011) were chosen to calculate the impacts for each category. The profiles in this report present the following impact categories: carbon footprint, water depletion and agricultural land occupation. VITO used the LCA software package “SimaPro” for performing the Life Cycle Impact Assessment (LCIA) and generating the environmental profiles of the different starch products. In discussing the results of the individual profiles of the starch products it is important to know whether or not a process (or a life cycle phase) has a significant contribution to an environmental impact category. For that the ISO framework (ISO 14044 - Annex B) is used. According to the ISO 14044 Annex B the importance of contributions can be classified in terms of percentage. The ranking criteria are:
A: contribution > 50 %: most important, significant influence; B: 25 % < contribution ≤ 50 %: very important, relevant influence; C: 10 % < contribution ≤ 25 %: fairly important, some influence; D: 2,5 % < contribution ≤ 10 %: little important, minor influence; E: contribution < 2,5 %: not important, negligible influence.
In discussing the results of the comparison the rule-of-thumb is that a 20% difference is considered significant for impact categories that have sufficient scientific basis e.g. contribution to the carbon footprint.

CHAPTER 4 life cycle impact assessment
20
4.2. ENVIRONMENTAL PROFILES OF STARCH PRODUCTS
4.2.1. ENVIRONMENTAL PROFILE OF NATIVE STARCHES
Figure 3: Environmental impacts of native starches production
Figure 3 clearly shows that the agricultural phase makes the most important contribution to the environmental impacts. The use of energy, usually in the form of fossil fuels, is the most important element of the carbon footprint for the industrial process.
4.2.2. ENVIRONMENTAL PROFILE OF LIQUID GLUCOSE (INCLUDING GLUCOSE AND FRUCTOSE SYRUPS)
Figure 4: Environmental impacts of liquid glucose production

CHAPTER 4 life cycle impact assessment
21
Figure 4 clearly shows that the agricultural phase still makes the most important contribution to the environmental impacts for liquid glucose, even though the contribution of the industrial process here is higher than for native starches. Again here, the use of energy, usually in the form of fossil fuels, is the most important element of the carbon footprint for the industrial process.
4.3. CARBON UPTAKE
Since the main input for the products under research here are agricultural crops, the biogenic carbon uptake during the growing of the crops is also of interest. Since the European starch industry’s products are not only used for food and feed products but also for industrial products with a long life cycle (20 years and more), we additionally provide the “carbon credit” related to the CO2 uptake of the raw materials (wheat, maize, potatoes plants) in conformity with the rules as defined in the standards. It was agreed to report the biogenic carbon uptake separately. The figure 5 shown below indicates the carbon footprint of 1 ton DS average mixture of raw materials (wheat, maize, potatoes).
Figure 5: Carbon footprint and biogenic carbon uptake for1 ton DS of the raw material mixture
Conclusion: the cultivation of raw materials ends up in an excess in biogenic carbon uptake compared to the carbon emitted (therefore the carbon footprint). Looking at the figures, this means that any product with a long life cycle (e.g. bio-plastics) would, as long as its manufacturing process has a CFP of less than 1000kg CO2 eq / ton of processed raw materials, have a positive carbon footprint (more carbon sequestrated than emitted). The starch industry products that have a long life cycle today represent around 5% of the EU starch industry production, this share is increasing on a yearly basis.

CHAPTER 4 life cycle impact assessment
22
4.4. SENSITIVITY ANALYSES
Three sensitivity analyses were done to assess the influence of the most relevant and most uncertain factors on the results of the study:
electricity mixes (from the grid) and its impacts;
agricultural data;
excluding infrastructure.
4.4.1. SENSITIVITY ANALYSIS FOR ELECTRICITY
The production of electricity from the grid differs between all EU countries. Since the average weighted dataset should represent an ‘average’ European starch producing plant, the electricity from the grid should too. This is why, where electricity from the grid is concerned, a weighted average grid is made. When using another composition of the grid or using a country specific energy production, this can affect the results of the calculations. The following electricity production mixes are used in the sensitivity scenarios:
- EU electricity mix (Ecoinvent): an average of the electricity production mix over the whole of the European countries, according to their total electricity produced;
- French electricity mix: 78% nuclear, 10% hydro, 4,5% coal, 3% gas, 4,5% rest;
- Polish electricity mix: >90% of electricity comes from coal combustion. The effect of these scenarios and the comparison with the baseline scenario for the carbon footprint of dry proteins were calculated. The biggest total difference (10%) is caused when using the data from the Polish electricity production mix. Looking only at the contribution of energy use to the carbon footprint this is a difference of 19%. When taking into account all analysed impact categories, only for water depletion the difference is higher than 20%, which is mostly caused by the impact of coal mining (most important fuel in Poland). The differences between the weighted average mix for the starch producing companies and the Ecoinvent EU electricity mix are insignificant for all impact categories considered. Therefore, the weighted average mix for starch producing companies, originally chosen, was used for the final study.
4.4.2. SENSITIVITY ANALYSIS FOR AGRICULTURAL DATA
The cultivation of the three crops used as raw materials - wheat, maize and potatoes – all show a significant contribution to the environmental impact of starch products. In the second sensitivity assessment, the results were calculated using other datasets for the agricultural production. An example is the comparison of the results for liquid glucose from wheat, for the baseline scenario (Swiss data) with the records for Germany and Spain. The main differences between these records are due to a difference in the amount and type of fertilizers and pesticides. From this sensitivity analysis it shows that the choice of data for agriculture has a significant impact on the final result. Other data for the crops do not make the life cycle phase suddenly unimportant or more important, but do impact the total contribution which can differ significantly depending on the impact category. Given the average raw material supply of the starch industry, the chosen data set from Switzerland was deemed to be the most complete of available data for the study after this sensitivity analysis.

CHAPTER 4 life cycle impact assessment
23
4.4.3. SENSITIVITY ANALYSIS FOR INFRASTRUCTURE
In the last sensitivity assessment infrastructures were excluded. In the baseline scenario infrastructure is taken into account, except for the starch plant. To see whether this affects results in a significant way, calculations were made for liquid glucose. No significant difference between both scenarios was found for the impact categories analysed, hence the choice of excluding infrastructure from calculation was confirmed to be correct.


CHAPTER 5 SUMMARY
25
CHAPTER 5 SUMMARY
5.1. GENERAL CONCLUSIONS
From the individual environmental profiles of products produced by the EU starch industry, the importance of the agricultural life cycle phase becomes obvious. For the growing of the crops, the use of fertilizers, pesticides and energy during the process makes up for the largest part of the impact of the final products. For the production of native starch, agriculture is responsible for more than two thirds of the impact for both CFP and water depletion. The contribution of agriculture to the products’ impacts also remains the major contributor, though to a slightly lesser degree, when additional process steps are needed as shown by the liquid glucose profile. Though part of the life cycle of the starch products, the starch industry has very limited control on the agricultural phase and, therefore, on direct improvement possibilities. The cultivation of the three crops used as raw materials - wheat, maize and potatoes – all show this significant contribution to the environmental impact of starch products. The sensitivity analyses show, however, that data for agriculture have a significant impact on the final result. Any exact figure would depend on the raw material, the cultivation place and method, and as such a high level of uncertainty (25% at least) results from agricultural data choice. Since data are from 2000, the fact that agricultural practices have improved in the past twelve years would also have an impact on the final results. Given this significant importance, it will be important to monitor, in the future, available data for raw materials cultivation impacts and to update the results of this study if more relevant data are available. When looking only at the processes which occur at the starch plants, it is mostly the use of electricity and heat which creates impacts (depending on the impact category). As the starch process includes drying or concentrating the final products, the use of heat is important, hence this result is logical. The importance of the starch processes contribution is therefore the largest for CFP as opposed to water depletion or agricultural land occupation. CFP is either highly depending on combustion emissions or on the use of fossil fuels which of course also need to be mined. Per kWh, the impact related to electricity is not necessarily higher or lower than that related to heat: this depends on the impact category. Overall, the amount of heat needed as an input is higher than electricity and thus often the more important contributor. Several chemicals are used in the processes. However, overall these chemicals are not responsible for a major part of the impact although there are exceptions for some products. The Figure 6 below gives an example of the relative contribution to CFP and water depletion of different production inputs for native starch and liquid glucose:

CHAPTER 5 SUMMARY
26
Figure 6: relative contribution of different production inputs to the products environmental impacts
The results and analytical conclusions of this LCA study give rise to several interesting features of the European starch industry’s products and processes, some of which are highlighted here:
- There is a wide application of high efficiency Combined Heat & Power (CHP) generation in the European starch industry (57% of the electricity input and 59% of the heat input are produced by the mean of CHP system) whose processes need a significant amount of energy (especially heat and to a lesser extent electricity).The use of high efficiency CHP however highly mitigates the effects of energy consumption, as “cogeneration (…) offers energy savings ranging between 15-40% when compared against the supply of electricity and heat from conventional power stations and boilers.”2
- The impact of transport is relatively low compared to other inputs contribution (cf Figure 6). This is because the European starch industry has suppliers located close to the starch production plants when possible and makes use of train and ship (besides truck) as most environmentally friendly transportation modes for bulk materials.
- The starch industry is typically an industry which causes little waste production. All side streams are used to produce useful products that have an economic value and waste sent to landfill or incineration are almost nonexistent.
- When focusing on the carbon footprint (climate change) for final products with a long life cycle (representing approximately 5% of total starch production) the carbon uptake of the crops (biogenic carbon uptake) largely offsets the greenhouse gas emissions during the total starch production process (agricultural and industrial part).
2 COGEN Europe –association representing European cogeneration industry actors – www.cogeneurope.eu,
section “knowledge center” “what is cogeneration”.

CHAPTER 5 SUMMARY
27
5.2. IMPROVEMENTS AND RECOMMENDATIONS
Since agriculture plays such a significant role in the impact of the starch products, the importance of good, reliable data is huge. Initiatives like the Agri-balyse may provide data of a better quality in the future. Since starch producers are an important customer to the agricultural sector, bilateral contacts between sector federations can make it clear to the sector that providing better data can also be of great importance to them. Because of the separate presentation of the agricultural life cycle phase in the profiles, it is quite easy to fine-tune the results in the future, based on better and more reliable data on agriculture. This life cycle assessment study for starch products forms a good basis for the European starch industry association to make Environmental Product Declarations (EPDs) for their products. The main goal of EPDs is to provide objective, comparable (provided that methodologies used for the LCA study are strictly comparable) and credible information about the environmental impacts of a product throughout its life cycle to customers and other stakeholders. Guidelines for the development of these declarations (in Product Category Rules (PCR)) are currently under development in a number of countries. For example in France, in the framework of the Grenelle several initiatives are on-going to develop PCR for different product groups. One third of companies who volunteered to participate in the trial program are from the food sector. As a result of this study coming up with EPDs would require only limited efforts. Since EPDs also present impacts split up per life cycle phase, this makes it a good tool for communication purposes as well. Finally, we would like to stress that this report was not produced with the intention to make LCA comparison between starch products and other products. Should third parties attempt such a comparison, it is essential that a strictly comparable methodology is used.


Glossary
29
GLOSSARY
Black box = main process during which multiple products are produced from one raw material, with no possibility to differentiate which input and output is related to a particular product. By “Other products” as opposed to starch products, we refer to so called “by-products” as usually named. Nevertheless, the term “by-products” was not retained because these products, derived from grains or potatoes, just like starch and its derivative products, are also products in their own rights. CPF - Carbon Foot Print DS - Dry Substance GHG - GreenHouse Gas LCA - Life Cycle Assessment LCI - Life Cycle Inventory LCIA - Life Cycle Impact Assessment Member cies - AAF member companies RER U - Revue d’économie Régionale et urbaine (international scientific journal)

CHAPTER 5 SUMMARY
30
REFERENCES
Ecoinvent, 2009 The cycle inventory data Swiss Centre for Life Cycle Inventories ISBN 3-905594-38-2 Ecoinvent Data v2.2, 2010 Swiss Centre for Life Cycle Inventories, Switzerland www.ecoinvent.org ILCD (2010), International Reference Life Cycle Data System (ILCD) handbook: General guide for Life Cycle Assessment – Detailed guidance, European Commission, Joint Research Centre, Institute for Environment and Sustainability ILCD (2011), International Reference Life Cycle Data System (ILCD) handbook: Recommendations for Life Cycle Impact Assessment in the European context - based on existing environmental impact assessment models and factors, European Commission, Joint Research Centre, Institute for Environment and Sustainability ISO 14025, (2006), Environmental labels and declarations – General principles. ISO 14040, (2006), Environmental management – Life cycle assessment – Principles and framework. ISO 14044, (2006) Environmental management – Life cycle assessment – Requirements and guidelines. PAS 2050 (2008), Specification for the assessment of the life cycle greenhouse gas emissions of goods and services. WBCSD – WRI, World Business Council for Sustainable Development – World Resources Institute, The Greenhouse Gas Protocol: A corporate Accounting and Reporting Standard, March 2004.