life cycle impact assessment methodology for environmental … · life cycle impact assessment...
TRANSCRIPT

SCS Global Services Report
2000 Powell Street, Ste. 600, Emeryville, CA 94608 USA +1.510.452.8000 main | +1.510.452.8001 fax
www.SCSglobalServices.com
Life Cycle Impact Assessment Methodology for Environmental Paper Network
Paper Calculator v4.0
May 14, 2018
Prepared by:
Tobias Schultz | Manager of Corporate Sustainability Services
Aditi Suresh | Life Cycle Assessment Practitioner 1 Corporate Sustainability Services
Contact Person:
Tobias Schultz, +1-510-452-6389, [email protected]

Life Cycle Impact Assessment Methodology for EPN Paper Calculator v4.0 May 14, 2018
May 2018 | ©SCS Global Services Page ii of xii
Table of Contents
List of Figures ............................................................................................................................................... iv
List of Tables ................................................................................................................................................ vi
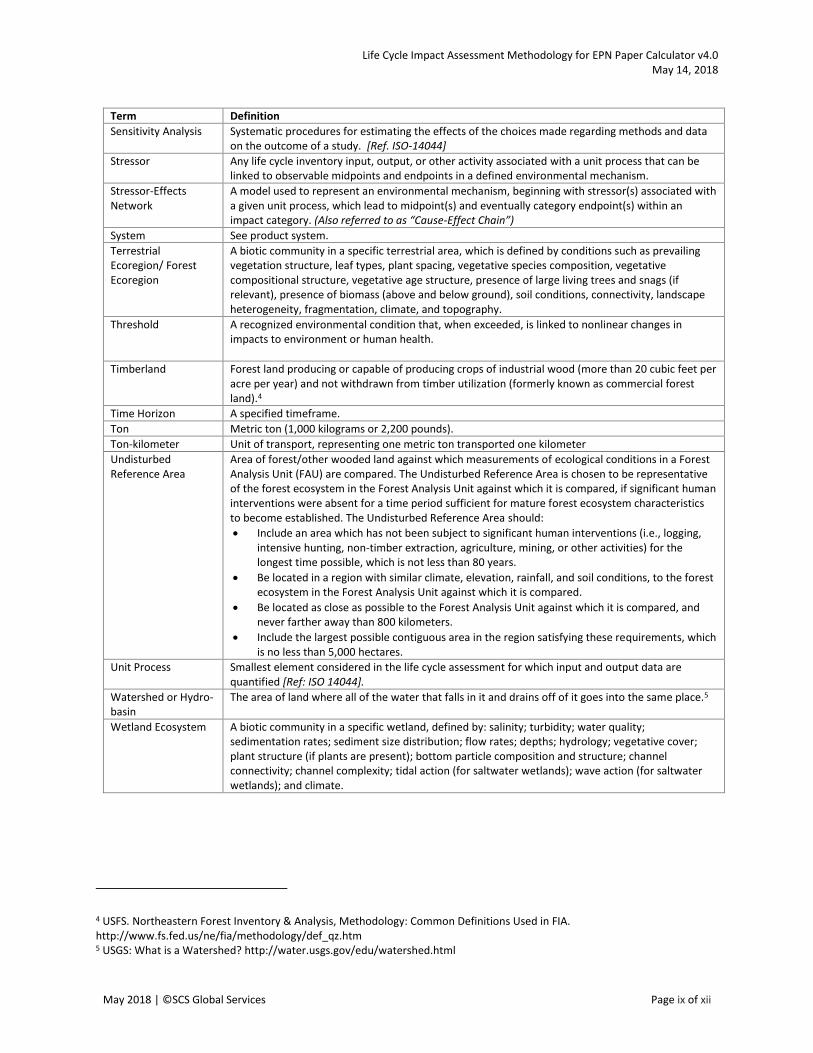
Terminology Used in this Report ................................................................................................................ vii
Acronyms ...................................................................................................................................................... x
1 Introduction ...................................................................................................................................... 2
2 Goal and Scope of the Study ............................................................................................................. 2
Key Limitations and Assumptions ................................................................................................. 7
Assumptions .......................................................................................................................... 7
Limitations ............................................................................................................................. 7
3 Methodology ..................................................................................................................................... 8
Functional Unit .............................................................................................................................. 8
System Boundary .......................................................................................................................... 9
Designating Recycled Content in Paper: ............................................................................. 10
User Inputs for Tissue Paper Grade: ................................................................................... 10
Allocation Procedures ................................................................................................................. 12
Allocation Method for Recycled Fiber Inputs in Recycled Papers ...................................... 13
Data Requirements ..................................................................................................................... 13
Approach for retrieving data from the RISI Mill Asset Database ........................................ 17
Calculation of toxic air emissions data ................................................................................ 22
Use of Ecoinvent and USLCI Datasets ................................................................................. 22
Waste output data per metric ton of paper- BOD, COD, TSS and Solid Waste .................. 22
LCI Analysis Summary ................................................................................................................. 24
Accounting for Biogenic Carbon Flows ............................................................................... 29
LCIA Methodology Summary ...................................................................................................... 30
Biotic/Abiotic Resource Depletion Indicators ..................................................................... 30
Climate System Impacts ...................................................................................................... 32
Ocean Ecosystem Impacts .................................................................................................. 34
Terrestrial and Freshwater Ecosystem Impacts (from Emissions) ...................................... 35
Impacts on Terrestrial and Freshwater Ecosystems (from Land Use and Conversion) ...... 37
Human Health Impacts (from Chronic Exposure to Hazardous Chemicals) ........................ 42

Life Cycle Impact Assessment Methodology for EPN Paper Calculator v4.0 May 14, 2018
May 2018 | ©SCS Global Services Page iii of xii
Additional Environmental Information ............................................................................... 44
Factors Applied to Determine Equivalencies for Impact Indicators ................................... 46
Sensitivity Analysis for Recycled Papers by Assigned Credit for Diversion of Wastepaper from Landfill .................................................................................................................................................... 49
4 Conclusions ..................................................................................................................................... 54
Appendix: Dispersion Models Used to Assess Regional Acidification, Ground Level Ozone and PM2.5 Impacts ........................................................................................................................................................ 55
A.1 Regional Acidification ........................................................................................................................... 57
A.2 Ground Level Ozone Exposures ............................................................................................................ 58
A.3 PM2.5 ............................................................................................................................................. 59

Life Cycle Impact Assessment Methodology for EPN Paper Calculator v4.0 May 14, 2018
May 2018 | ©SCS Global Services Page iv of xii
List of Figures
Figure 1. The system boundary depicts the key inputs, outputs and key processing steps associated with 100% virgin paper grades production from cradle-to-grave. ..................................................................... 11
Figure 2. The system boundary depicts the key inputs, outputs and key processing steps associated with 100% recycled paper grades production from cradle-to-grave. ................................................................. 12
Figure 3. Data collection for key processes (1 through 7) and flows (A through G) relative to the production of 1 metric ton of paper. .......................................................................................................... 14
Figure 4. Screenshot of format of data used to classify the mills as Integrated and Non-Integrated. The rows highlighted in yellow are examples of Non-integrated mills as they purchase 100% of the pulp. Note that the mill names and the table header names have been modified due to RISI’s purchase restrictions. Data here is strictly for demonstrative purpose only. ............................................................ 17
Figure 5. Screenshot of format of data used to classify mills with 100% recycled fiber inputs. The rows highlighted in yellow are examples of mills using only recovered fiber inputs (values indicated in red). Note that the mill names and the table header names have been modified due to RISI’s purchase restrictions. Data here is strictly for demonstrative purpose only. ............................................................ 18
Figure 6. Screenshot of format of data used to classify mills with 100% virgin fiber inputs. The rows highlighted in yellow are examples of mills using only virgin fiber inputs (values indicated in red). Note that the mill names and the table header names have been modified due to RISI’s purchase restrictions. Data here is strictly for demonstrative purpose only. ................................................................................ 18
Figure 7. Screenshot of format of data used to classify mills with mixed fiber inputs. The rows highlighted in yellow are examples of mills using mixed fiber inputs (values indicated in red). Note that the mill names and the table header names have been modified due to RISI’s purchase restrictions. Data here is strictly for demonstrative purpose only.......................................................................................... 18
Figure 8. The above figure illustrates the classification of pulp and paper mills in the RISI Mill Asset Database. 100% virgin and 100% recycled paper grades are produced in non-integrated paper mills (indicated in orange color) and integrated paper mills (indicated in purple color). Virgin pulp mills (indicated in red color) supply virgin pulp to non-integrated and integrated paper mills producing 100% virgin paper products. Similarly, recycled pulp mills (indicated in green color) supply recycled pulp to non-integrated and integrated paper mills producing 100% recycled paper products. Woody inputs are required during virgin pulp production as well as in integrated paper mills producing virgin paper products. Wastepaper inputs are required for recycled pulp production as well as in integrated mills producing recycled paper products. ........................................................................................................... 19
Figure 9. Snapshot of “Above and below ground carbon in live trees” dataset representing the forest carbon density for the states of California, Oregon, Washington, Wisconsin and Maine from the US Forest Services website. .............................................................................................................................. 39
Figure 10. The figure represents the terrestrial ecoregions across North America, as defined by WWF Wildfinder database. The red spots represent the location of the pulp and paper mills. ......................... 41

Life Cycle Impact Assessment Methodology for EPN Paper Calculator v4.0 May 14, 2018
May 2018 | ©SCS Global Services Page v of xii
Figure 11. Sensitivity analysis is explored for the GHG Impact indicator for 100% Recycled Papers, by providing a credit for the amount of waste paper diverted from the landfill. For the purpose of comparison, results for 100% Virgin Paper and 100% Recycled Paper (without the credit) are illustrated in the chart. ................................................................................................................................................. 51
Figure 12. Sensitivity analysis is explored for the Ocean Acidification indicator for 100% Recycled Papers, by providing a credit for the amount of waste paper diverted from the landfill. For the purpose of comparison, results for 100% Virgin Paper and 100% Recycled Paper (without the credit) are illustrated in the chart. ................................................................................................................................................. 52
Figure 13. Sensitivity analysis is explored for the Solid Waste indicator for 100% Recycled Papers, by providing a credit for the amount of waste paper diverted from the landfill. For the purpose of comparison, results for 100% Virgin Paper and 100% Recycled Paper (without the credit) are illustrated in the chart. ................................................................................................................................................. 53
Figure 14. Example concentration plume from single emission source (Source: http://www.arl.noaa.gov/HYSPLIT_info.php.) ............................................................................................ 57
Figure 15. Soil sensitivity class based on the HWSD for North America. Soils of sensitivity class 1 (most sensitive) through sensitivity class 4 are classified, while soils of class 5 are not classified. ..................... 58

Life Cycle Impact Assessment Methodology for EPN Paper Calculator v4.0 May 14, 2018
May 2018 | ©SCS Global Services Page vi of xii
List of Tables
Table 1. Types of paper grades included in the scope of the Paper Calculator v4.0 and the number of mills included in this assessment to present North American average results. ........................................... 3
Table 2. List of indicators presented as outputs in the Paper Calculator v4.0. ............................................ 4
Table 3. Default grammage values by tissue paper grade. ........................................................................... 9
Table 4. Data points and data sources used for modeling 100% virgin papers and 100% recycled papers based on Figure 3. ....................................................................................................................................... 15
Table 5. Classification of mills by paper grade in the RISI Mill Asset Database based on Figure 8. ........... 20
Table 6. Datasets used to determine the amount of BOD, COD, TSS and solid waste outputs during papermaking. (Note: “cut-off, U” refers to the classification of datasets used to model the paper grades in the Ecoinvent v3.3 LCA database. Letters US, CA and QC denote the region represented by the dataset. “US” refers to United States”, “CA” refers to Canada” and “QC” refers to Quebec province in Canada). ...................................................................................................................................................... 23
Table 7. List of background datasets used to model major inputs (see Figure 3) required for production of 14 paper grades.The representativeness and materiality of the data has been addressed qualitatively using the acronyms H=High, M=Medium and L=Low. ................................................................................ 25
Table 8. GWP-20 values used for evaluating GHG/Climate Change Impacts indicator. ............................. 33
Table 9. M-CFs for 100% virgin and 100% recycled paper grades used to model North American average results for acidifying emissions/regional acidification indicator. ............................................................... 36
Table 10. M-CFs for 100% virgin and 100% recycled paper grades used to model North American average results for ground level ozone indicator. .................................................................................................... 42
Table 11. M-CFs for 100% virgin and 100% recycled paper grades used to model North American average results for PM2.5 Impacts. .......................................................................................................................... 43
Table 12. Equivalency Factors applied for Paper Calculator v4.0 Indicators. ............................................. 46

Life Cycle Impact Assessment Methodology for EPN Paper Calculator v4.0 May 14, 2018
May 2018 | ©SCS Global Services Page vii of xii
Terminology Used in this Report Term Definition
Background Unit Processes (or Background System)
Unit processes not specific to the product system under study, including those processes upstream and/or downstream where many suppliers are involved.
Biotic Resource A resource derived recently from living biomass.
Black Carbon The light-absorbing component of carbonaceous aerosols. Black carbon contributes to roughly 1 W/m2 of global radiative forcing, and is the second most important forcing agent after carbon dioxide.
Black Liquor A by-product of wood pulping, which can be combusted to generate electricity in integrated virgin pulp and paper mills.
Category Indicator Quantifiable representation of an impact category [Ref. ISO-14044] (Also referred to as “Impact Category Indicator,” or simply, “Indicator.”)
Core Impact Category
An impact category in which at least one unit process in the product system under study contributes measurably to observed midpoints or endpoints in the stressor-effects network. Defined independently by product system.
Cradle-to-gate A scope which includes the life cycle stages from raw material extraction through production of a product.
Cradle-to-grave A scope which includes all life cycle stages from raw material extraction through end-of-life.
Data Quality Characteristics of data that relate to their ability to satisfy stated requirements [Ref: ISO 14044].
Disturbance Average deviation in overall ecological conditions in a terrestrial ecoregion biome, when compared to undisturbed conditions (i.e., unaffected by anthropogenic activities since the pre-industrial era) and fully disturbed conditions (i.e., representing maximally disturbed areas) in an area within the same biome ecoregion type.
Effect See Impact
Environmental Mechanism
System of physical, chemical, radiological, and biological processes for a given impact category, linking stressor(s) to midpoints and to category endpoints. [Based on ISO 14044]
Exceedance of Threshold
For a given impact category, represents the surpassing of a threshold (defined below).
Fiber Basket Region supplying pulpwood to each dissolving pulp mill.
Foregone Growth The forest growth avoided as a result of ongoing harvests. In terms of carbon or forest condition, this is the “opportunity cost” associated with ongoing harvests.
Forest Analysis Unit An area of timberland used to represent forest ecosystem impacts resulting from forestry operations within a region.
Forest Inventory An accounting of trees and their related characteristics of interest over a well-defined land area.
Forest Type A classification of forest land based on the species that form a plurality of live-tree basal-area stocking. 1
Forestland Land that is at least 10 percent stocked with trees of any size, or that formerly had such tree cover and is not currently developed for a nonforest use. The minimum area for classification of forest land is one acre. The components that make up forest land are timberland and all noncommercial forest land. 2
Freshwater Ecosystem
An interconnected biotic community, including watercourses, lakes, wetlands, and adjacent riparian areas, within specific watershed boundaries, defined by: salinity; turbidity; water temperature; sedimentation rates; sediment size distribution; flow rates; depths; channel contours; hydrology and hydraulics; water quality; watershed area; tributary areas; stream lengths; presence of large woody debris; riparian canopy cover; riparian zone vegetative species composition; climate; and geology.
Functional Unit Quantified performance of a product system for use as a reference unit. [Ref. ISO 14044].
Impact An effect on human health or the environment.
1 USFS. Northeastern Forest Inventory & Analysis, Methodology: Common Definitions Used in FIA. http://www.fs.fed.us/ne/fia/methodology/def_ah.htm 2 Ibid.

Life Cycle Impact Assessment Methodology for EPN Paper Calculator v4.0 May 14, 2018
May 2018 | ©SCS Global Services Page viii of xii
Term Definition
Impact Category Class representing environmental issues of concern to which life cycle inventory analysis results may be assigned [Ref: ISO-14044]. The issues of concern are represented in a distinct environmental mechanism, which can be modeled with a stressor-effects network made up of observable stressors, midpoints, and endpoints.
Impact Group Impact categories with similar endpoints and environmental mechanisms.
Impact Profile See LCIA Profile. (Also referred to as “profile” or “eco-profile.”)
Indicator See Category Indicator.
Input Product, material or energy flow that enters a unit process. [Ref. ISO 14044].
Key Unit Process or Key Unit Operation
A unit process (or unit operation) contributing over 10% to any indicator result.
LCIA Profile A discrete compilation of the LCIA category indicator results for different impact categories. [Ref: ISO 14044, §4.4.2.5]
Life Cycle Consecutive and interlinked stages of a product system, from raw material acquisition or generation from providing environment to final disposal.
Life Cycle Assessment (LCA)
Compilation and evaluation of the inputs, outputs and the environmental and human health impacts of a product system throughout its life cycle. [Based on ISO 14044]
Life Cycle Impact Assessment (LCIA)
Phase of life cycle assessment aimed at determining the magnitude and significance of the environmental and human health impacts for a product system throughout the life cycle of the product. [Based on ISO 14044]
Life Cycle Interpretation
Phase of life cycle assessment in which findings of either the inventory analysis or the impact assessment, or both, are evaluated in relation to the defined goal and scope in order to reach conclusions and recommendations. [Ref: ISO 14044]
Life Cycle Inventory (LCI)
Phase of a life cycle assessment involving the compilation and quantification of inputs and outputs for a product throughout its life cycle. [Ref: ISO 14044]
Midpoint Characterization Factor (M-CF)
A factor which characterizes the actual effect on the receiving environment of emissions, resource uses, or land uses. Multiplied with Potency Potential Characterization Factors (PP-CFs) to calculate results.
Midpoint A distinct node in a stressor-effects network representing an observed chemical, physical, radiological or biological impact that is linked to the final category endpoint(s).
Node The modeled representation of an observed chemical, physical, radiological, or biological impact within a distinct stressor-effects network.
Organic Carbon The scattering component of carbonaceous aerosols, these emissions lead to a modest cooling effect globally due to their negative radiative forcing.
Output Product, material or energy flow that leaves a unit process. [Ref. ISO 14044].
Potency Potential Characterization Factor (PP-CF)
A factor which characterizes the relative potency of emissions, resource uses, or land uses, in causing impacts. Multiplied with Midpoint Characterization Factors (M-CFs) to calculate results.
Product Any good or service. [Ref: ISO 14025].
Product System Collection of unit processes with elementary and product flows, performing one or more defined functions, and which models the life cycle of a product. [Ref. ISO 14044]
Woody Inputs Includes roundwood, chips, and other mill residues used as inputs to produce pulp in pulping mills.
Radiative Forcing Expresses the change in energy in the atmosphere due to GHG emissions. It is expressed in watts per square meter (W/m2) or the rate of energy change per unit area of the globe measured at the top of the atmosphere.
Receiving Environment
The environment affected by stressor(s) including emissions, land use, or wastes.
Resource Depletion The degree to which the net consumption of a resource results in a reduction in its reserve base, taking into account the extent of reserve base and projected consumption.
Roundwood A length of cut tree generally having a round cross-section, such as a log or bolt.3
3 Stokes, Bryce J.; Ashmore, Colin; Rawlins, Cynthia L.; Sirois, Donald L. 1989. Glossary of Terms Used in Timber Harvesting and Forest Engineering. Gen. Tech. Rep. SO-73. New Orleans, LA: U.S. Dept. of Agriculture, Forest Service, Southern Forest Experiment Station. p.33
Life Cycle Impact Assessment Methodology for EPN Paper Calculator v4.0 May 14, 2018
May 2018 | ©SCS Global Services Page ix of xii
Term Definition
Sensitivity Analysis Systematic procedures for estimating the effects of the choices made regarding methods and data on the outcome of a study. [Ref. ISO-14044]
Stressor Any life cycle inventory input, output, or other activity associated with a unit process that can be linked to observable midpoints and endpoints in a defined environmental mechanism.
Stressor-Effects Network
A model used to represent an environmental mechanism, beginning with stressor(s) associated with a given unit process, which lead to midpoint(s) and eventually category endpoint(s) within an impact category. (Also referred to as “Cause-Effect Chain”)
System See product system.
Terrestrial Ecoregion/ Forest Ecoregion
A biotic community in a specific terrestrial area, which is defined by conditions such as prevailing vegetation structure, leaf types, plant spacing, vegetative species composition, vegetative compositional structure, vegetative age structure, presence of large living trees and snags (if relevant), presence of biomass (above and below ground), soil conditions, connectivity, landscape heterogeneity, fragmentation, climate, and topography.
Threshold A recognized environmental condition that, when exceeded, is linked to nonlinear changes in impacts to environment or human health.
Timberland Forest land producing or capable of producing crops of industrial wood (more than 20 cubic feet per acre per year) and not withdrawn from timber utilization (formerly known as commercial forest land).4
Time Horizon A specified timeframe.
Ton Metric ton (1,000 kilograms or 2,200 pounds).
Ton-kilometer Unit of transport, representing one metric ton transported one kilometer
Undisturbed Reference Area
Area of forest/other wooded land against which measurements of ecological conditions in a Forest Analysis Unit (FAU) are compared. The Undisturbed Reference Area is chosen to be representative of the forest ecosystem in the Forest Analysis Unit against which it is compared, if significant human interventions were absent for a time period sufficient for mature forest ecosystem characteristics to become established. The Undisturbed Reference Area should:
Include an area which has not been subject to significant human interventions (i.e., logging, intensive hunting, non-timber extraction, agriculture, mining, or other activities) for the longest time possible, which is not less than 80 years.
Be located in a region with similar climate, elevation, rainfall, and soil conditions, to the forest ecosystem in the Forest Analysis Unit against which it is compared.
Be located as close as possible to the Forest Analysis Unit against which it is compared, and never farther away than 800 kilometers.
Include the largest possible contiguous area in the region satisfying these requirements, which is no less than 5,000 hectares.
Unit Process Smallest element considered in the life cycle assessment for which input and output data are quantified [Ref: ISO 14044].
Watershed or Hydro-basin
The area of land where all of the water that falls in it and drains off of it goes into the same place.5
Wetland Ecosystem A biotic community in a specific wetland, defined by: salinity; turbidity; water quality; sedimentation rates; sediment size distribution; flow rates; depths; hydrology; vegetative cover; plant structure (if plants are present); bottom particle composition and structure; channel connectivity; channel complexity; tidal action (for saltwater wetlands); wave action (for saltwater wetlands); and climate.
4 USFS. Northeastern Forest Inventory & Analysis, Methodology: Common Definitions Used in FIA. http://www.fs.fed.us/ne/fia/methodology/def_qz.htm 5 USGS: What is a Watershed? http://water.usgs.gov/edu/watershed.html

Life Cycle Impact Assessment Methodology for EPN Paper Calculator v4.0 May 14, 2018
May 2018 | ©SCS Global Services Page x of xii
Acronyms
BOD Biochemical Oxygen Demand
C Carbon
CA Canada
CF Characterization Factor
CH4 Methane
CO2 Carbon Dioxide
COD Chemical Oxygen Demand
Eq. Equivalent
FAU Forest Analysis Unit
ft2 Square Feet
GHG Greenhouse Gas
GLO Ground Level Ozone
GWP Global Warming Potential
H2CO3 Carbonic Acid
HAP Hazardous Air Pollutant
HYSPLIT Hybrid Single Particle Lagrangian Integrated Trajectory
IPCC Intergovernmental Panel on Climate Change
IUCN International Union for the Conservation of Nature
kW Kilowatt
LCA Life Cycle Assessment
LCI Life Cycle Inventory
LCIA Life Cycle Impact Assessment
m Meters
m2 Square Meter
m3 Cubic Meter
M-CF Midpoint Characterization Factor
MJ Megajoule
MMBtu Million British thermal units
MSW Municipal Solid Waste
MWh Megawatt-hours
N2O Nitrous Oxide
NOx Nitrogen Oxides
NPRI National Pollutant Release Inventory
O3 Ozone
PCR Product Category Rule
PM Particulate Matter
PM2.5 Particulate Matter 2.5
ppb Parts Per Billion

Life Cycle Impact Assessment Methodology for EPN Paper Calculator v4.0 May 14, 2018
May 2018 | ©SCS Global Services Page xi of xii
PP-CF Potency Potential Characterization Factor
RF Radiative Forcing
RoW Rest of the World/Global
SO2 Sulfur Dioxide
TRI Toxic Release Inventory
TRS Total Reduced Sulfur
TSS Total Suspended Solids
UNEP United Nations Environment Program
UNFCCC United Nations Framework Convention on Climate Change
URA Undisturbed Reference Area
US United States
VOC Volatile Organic Compound
WHO World Health Organization
yr Year

Life Cycle Impact Assessment Methodology for EPN Paper Calculator v4.0 May 14, 2018
May 2018 | ©SCS Global Services Page xii of xii
This page left intentionally blank.

Life Cycle Impact Assessment Methodology for EPN Paper Calculator v4.0 May 14, 2018
May 2018 | ©SCS Global Services Page | 2
1 Introduction
The Paper Calculator, originally launched in 2005 by the Environmental Defense Fund (EDF), is an
innovative web-based tool that is publicly available and allows users to compare the environmental
impacts of different paper choices using a methodology based in life cycle assessment (LCA). LCA is a
tool that can be used to assess the environmental impacts associated with the life cycle of paper, from
raw material extraction and processing to end-of-life phase. LCA provides a unique, quantified approach
for comparing the environmental performance of different sources of fiber.
The Environmental Defense Fund owned and operated the Paper Calculator from 2005 until 2011, at
which time it was transferred to the ownership and management of the Environmental Paper Network.
The Paper Calculator has been updated regularly over its lifetime, including significant modernizations
completed in 2009 and 2011, and routine updates completed on an annual or biennial basis.
In 2017, SCS Global Services (SCS) was commissioned by the Environmental Paper Network (EPN) to
undertake a major modernization to the Paper Calculator tool. This document outlines the methodology
used for updating the Paper Calculator to Version 4.0. An LCA was conducted to evaluate the life cycle
impact profile of 14 different paper grades, using a methodology conforming to ISO 14044,6 the draft
LEO-S-002 standard,7 the Product Category Rule (PCR) for Pulp and Paper (hereafter referred to as
Pulp/Paper PCR)8, the Product Category Rule (PCR) Module for Roundwood (hereafter referred to as
Roundwood PCR)9 and the LCIA Methodology for Roundwood and Pulp/Paper PCR Modules (hereafter
referred to as the LCIA Methodology for PCR Modules)10. The requirements of the draft LEO-S-002
standard ensure that LCA results are as complete, environmentally relevant, and accurate as possible.
2 Goal and Scope of the Study
The intended use of this LCA is to update the Paper Calculator tool, by quantitatively evaluating the
environmental performance of fourteen different paper grades, based on the methodology published in
the Pulp/Paper PCR, the Roundwood PCR and the LCIA Methodology for PCR Modules. The intended
audience of this Paper Calculator are procurement officials at different institutions, retail distributors,
consumers, sustainability managers at companies, LCA practitioners, and other stakeholders interested
in the environmental performance of different paper grades.
6 ISO 14044:2006 Environmental management – Life Cycle Assessment – Requirements and guidelines 7 LEO-SCS-002 Standard Draft Dated June 2014. Leonardo Academy. http://www.leonardoacademy.org/programs/standards/life-cycle.html 8 PCR Module for Pulp and Paper; https://www.scsglobalservices.com/files/program_documents/pcr_final_pulp_paper_101816.pdf 9 PCR Module for Roundwood Production: https://www.scsglobalservices.com/files/resources/pcr_final_wood-products_101816.pdf 10 Life Cycle Impact Assessment Methodology for PCR Modules for Roundwood and Pulp/Paper; https://www.scsglobalservices.com/files/program_documents/pcr_final_lcia-methodology_101816.pdf

Life Cycle Impact Assessment Methodology for EPN Paper Calculator v4.0 May 14, 2018
May 2018 | ©SCS Global Services Page | 3
The scope of this LCA is cradle-to-grave, for each type of paper based on the user-specified recycled
content, excluding the printing and use phase of papers (this is consistent with previous versions of the
Paper Calculator). The technological scope includes 14 different paper grades listed in Table 1. The
geographical scope includes production of 14 different paper grades in North America (USA and
Canada). The life cycle impacts of 14 paper grades are assessed from the extraction and processing of
all raw materials through the disposal of paper (end-of-life). The pulp and paper mills included for each
paper grade were identified based on data from Resource Information System, Inc (RISI).These mills
were selected based on location, capacity and grade of paper products produced, and factoring in the
representativeness of the mills to present North American average results for all indicators in the Paper
Calculator. The temporal scope includes production of paper in 2016. The latest available data were
used in all cases (see Section 3.4 for summary of data sources).
Table 1. Types of paper grades included in the scope of the Paper Calculator v4.0 and the number of mills included in this assessment to present North American average results.
Type of Paper Grade
Number of mills
included in the
assessment
1. Coated Freesheet 9
2. Uncoated Freesheet 41
3. Coated Groundwood 10
4. Uncoated Groundwood 13
5. Supercalendered 10
6. Paperboard: Solid Bleached Sulfate 13
7. Paperboard: Coated Unbleached Kraft 3
8. Paperboard: Coated Recycled Board 16
9. Paperboard: Uncoated Bleached Kraft 1
10. Paperboard: Uncoated Unbleached Kraft 3
11. Paperboard: Uncoated Recycled Board 48
12. Linerboard 37
13. Corrugated product* 33
14. Tissue (included in the Paper Calculator: paper towels, napkins, bathroom tissue and facial tissue) 47
*Corrugated product is a mix of linerboard (70.1%) and corrugating medium (29.9%).
The Paper Calculator v4.0 currently functions to present results for the following indicators (see table
below).

Life Cycle Impact Assessment Methodology for EPN Paper Calculator v4.0 May 14, 2018
May 2018 | ©SCS Global Services Page | 4
Table 2. List of indicators presented as outputs in the Paper Calculator v4.0.
Paper Calculator v4.0 Outputs
Impact Name Description Unit of Measurement
Wood Use Wood use measures the amount of wood required to produce a given amount of paper.
Fresh/green tons
Total Energy The total energy required over the paper's life cycle, including all renewable and nonrenewable resource use, including black liquor and all wood sources.
BTUs
Greenhouse Gases/Climate Change Impacts
Greenhouse gases (includes carbon dioxide or CO2 from burning fossil fuels and methane from paper decomposing in landfills) and short-lived climate pollutants (includes black carbon and organic carbon) which contribute to climate change by trapping energy from the sun in the earth's atmosphere. This impact category also includes forest carbon storage loss from logged forests.
pounds CO2 equiv.
Water Consumption Water consumption measures the amount of process and cooling water that is consumed or degraded throughout the life cycle of the paper product.
gallons
Solid Waste Solid waste includes sludge and other wastes generated during pulp and paper manufacturing, and used paper disposed of in landfills and incinerators.
pounds
Nitrogen Oxides (NOx) forming ground level ozone/Ground Level Ozone
Nitrogen oxides (NOx, which includes NO and NO2) are products of the combustion of fuels that contain nitrogen. NOx can react with volatile organic compounds and sunlight in the lower atmosphere to form ozone, a key component of urban smog. NOx forms ozone and can also, in parallel, lead to acid rain.
persons*hrs.*pounds O3 eq/m3
Purchased Energy A subset of total energy, purchased energy measures how much energy comes from purchased electricity and other fuels.
million BTUs
Particulates/PM2.5 Impacts
Particulates are small particles generated during combustion, and pose a range of health risks, including asthma and other respiratory problems, when inhaled. This impact category considers the effect of particulate matter (PM) emissions from pulp/paper production, contributing to smog.
persons*hrs.*pounds PM2.5 eq/m3
Sulfur Dioxide (SO2) and other acidifying emissions/Regional Acidification
Acidifying emissions are chemical compounds such as sulfur dioxide, nitrogen oxides, and other acids (e.g. ammonia) that are produced when boilers burn fuel containing sulfur and other acid-producing substances. Of the fuels used in the paper industry, oil and coal generally contain the highest quantities of sulfur. These acidifying emissions contribute to air pollution problems like acid rain and smog. This category includes SO2 emissions, but also other acids and emissions like NOx.
pounds SO2 eq
Volatile Organic Compounds (VOCs)
Volatile organic compounds (VOCs) are a broad class of organic gases, such as vapors from solvent and gasoline. VOCs react with nitrogen oxides (NOx) in the atmosphere to form ground-level ozone, the major component of smog and a severe lung irritant.
pounds

Life Cycle Impact Assessment Methodology for EPN Paper Calculator v4.0 May 14, 2018
May 2018 | ©SCS Global Services Page | 5
Paper Calculator v4.0 Outputs
Impact Name Description Unit of Measurement
Total Reduced Sulfur (TRS)
Total reduced sulfur (TRS) compounds cause the odor associated with kraft pulp mills. Exposure to TRS emissions has been linked to symptoms including headaches, watery eyes, nasal problems, and breathing difficulties.
pounds
Hazardous Air Pollutants (HAPs)
Hazardous air pollutants (HAPs) include any of a group of 188 substances identified in the 1990 U.S. Clean Air Act amendments because of their toxicity. Two of the most common occurring in air are formaldehyde and acrolein.
pounds
Chemical Oxygen Demand (COD)
Chemical oxygen demand (COD) measures the amount of oxidizable organic matter in the mill's effluent. Since wastewater treatment removes most of the organic material that would be degraded naturally in the receiving waters, the COD of the final effluent provides information about the quantity of more persistent substances discharged into the receiving water.
pounds
Biochemical Oxygen Demand (BOD)
Biochemical oxygen demand (BOD) measures the amount of oxygen that microorganisms consume to degrade the organic material in the wastewater. Discharging wastewater with high levels of BOD can result in oxygen depletion in the receiving waters, which can adversely affect fish and other organisms.
pounds
Total Suspended Solids (TSS) / Freshwater Eutrophication
Total suspended solids (TSS) measure solid material suspended in mill effluent, which can adversely affect bottom-living organisms upon settling in receiving waters and can carry toxic heavy metals and organic compounds into the environment.
pounds
Forest Disturbance Forest disturbance measures the degree to which activities affect forest ecosystems and biodiversity. The indicator compares the ecosystem integrity of a harvested site to intact forests over 80 years old in the region, using on-the-ground measurements. It also considers the recovery potential which would be possible on the site if harvesting were halted, reflecting the long-term implication of forest management at suppressing ecosystem integrity.
acres of disturbed area
Freshwater Disturbance Freshwater disturbance measures the number of freshwater systems possibly affected by logging. Logging can impact streams, rivers and creeks by increasing erosion, removing riverside vegetation and removing large woody debris that many fish species require for habitat. Although this impact is important and relevant, no data is currently available to calculate results. Reflecting the critical nature of this impact category, it is reported here as relevant to pulp/paper production, although results cannot be evaluated at this time.
Not Available
Threatened Species Threatened species measures the possible number of species affected by logging for paper production in the North American region that are listed as Critically Endangered, Endangered, or Vulnerable in the IUCN Red
# of species

Life Cycle Impact Assessment Methodology for EPN Paper Calculator v4.0 May 14, 2018
May 2018 | ©SCS Global Services Page | 6
Paper Calculator v4.0 Outputs
Impact Name Description Unit of Measurement
List of Threatened Species, though the exact impact will vary by forest of origin. The number of species is based on correlation with logging threats assessed by IUCN and the fiber basket of pulp and paper mills in the region.
Ocean Acidification Ocean acidification measures increased ocean acidity caused by CO2, which has detrimental consequences for many marine organisms. This indicator considers CO2 emitted during the production of pulp and paper, but also evaluates the amount of CO2 which could be sequestered in trees if forest harvests used for papermaking were halted.
pounds H2CO3
Mercury Emissions Mercury is a very toxic substance which persists in the environment for very long periods of time. Emissions can therefore lead to contamination in the environment, including freshwater bodies and oceanic systems, subsequently exposing flora and fauna to elevated concentrations. This result considers the amount of mercury during the production of pulp and paper.
milligrams
Dioxin Emissions Dioxin emissions measures the amount of toxic dioxin emissions that are released to air and water from pulp and paper mills. Dioxins are persistent and bioaccumulative, and even small amounts of emission can contaminate local waterways and bioaccumulate in fish.
micrograms
Herbicides Herbicides measures the amount of toxic herbicides used in growing trees for paper production. Herbicides are applied to control the spread of non-desirable species. Although this impact is important and relevant, no data is currently available to calculate results. Reflecting the critical nature of this impact category, it is reported as relevant to pulp/paper production, although results cannot be evaluated at this time.
Not Available
Ocean Warming Ocean warming measures increased ocean temperatures linked to emissions of greenhouse gases. Although this impact is important and relevant to emissions and foregone growth from logging, no algorithm is currently available to calculate results. Reflecting the critical nature of this impact category, it is reported as relevant to pulp/paper production, although results cannot be evaluated at this time.
Not Available
Wetland Disturbance Wetland disturbance measures the acreage of wetlands possibly affected by logging. Logging can increase erosion, which will cause changes in the sediment, temperature and other characteristics of wetlands. Although this impact is important and relevant, no data is currently available to calculate results. Reflecting the critical nature of this impact category, it is reported as relevant to pulp/paper production, although results cannot be evaluated at this time.
Not Available

Life Cycle Impact Assessment Methodology for EPN Paper Calculator v4.0 May 14, 2018
May 2018 | ©SCS Global Services Page | 7
Key Limitations and Assumptions
Assumptions
Assumptions were made as a result of data limitations or for other reasons. These assumptions are
important to understand, as some result in study limitations (discussed in Section 3.1.2). The
assumptions with the most important effects on final results are as follows:
The recycled content approach (also known as 100-0 cut off approach) is used to model impacts
for recycled papers, whereby the impacts from the prior and subsequent life cycles are not
included (see Section 3.3.2 for more detail).
For 100% recycled paper, the recycling of waste paper into recycled pulp does not provide any
credit associated with the avoidance of landfill impacts. However, the landfill avoidance credit is
reported in a sensitivity analysis in Section 3.7 of this document.
For the end-of-life phase, recycling rates for different paper grades are determined based on the
2014 US EPA Municipal Solid Waste (MSW) reports. Based on information from the MSW report,
80% of the materials not recycled are assumed to go to a municipal landfill and the remaining
20% are assumed to be incinerated.
Limitations
There are some key study limitations, resulting from limitations in the methodology used and data gaps,
as well as assumptions made. The main limitations in the study are as follows:
Lack of data to calculate Ocean Warming and Herbicide indicator. This indicator is relevant to
the product system considered in this study. Impacts from herbicides associated with forest
management are highly site variable. Consistent data on emissions and/or algorithms for
assessment of impacts were not available to assess impacts from all mills. These impacts are all
relevant to paper production and of major importance, but results could not be assessed.
Lack of data to calculate Freshwater and Wetland disturbance. The freshwater and wetland
disturbance conditions and trend could not be determined for all the paper grades due to lack
of data. Nor could the specific affected watersheds and wetlands be determined, as there was
no data of comparable quality across the paper grades which could be suitably used.
Lack of geographic representativeness for some paper grades for BOD, COD, TSS and solid
waste indicators: The Ecoinvent and USLCI databases are the main sources for secondary LCI
data. USLCI data was used in most cases to estimate the amount of BOD, COD, TSS and solid
waste emitted at the pulp and paper mills. However, USLCI data was only available for 5 virgin
paper grades. Thus, Ecoinvent data was used to estimate these indicators for other paper
grades. Although preference was given to ecoinvent datasets of Canadian origin to represent
North American production data for these indicators, it should be noted that most, though not

Life Cycle Impact Assessment Methodology for EPN Paper Calculator v4.0 May 14, 2018
May 2018 | ©SCS Global Services Page | 8
all, of the data within ecoinvent is of European origin and produced to represent European
industrial conditions and processes. The datasets that were the most representative of the
products and contexts being examined were selected.
Use of different mills for a given paper grade could influence results. The pulp and paper mills
producing 14 different paper grades were identified carefully, based on characteristics including
location of the mill and production capacities provided in the RISI database. The results
presented herein represent a national average for North America. It should be recognized that
the use of mills located in different regions for a given paper grade could influence the Paper
Calculator results.
Lack of geographic representativeness for modeling some background processes: For some
unit processes, Ecoinvent datasets may have limitations in terms of geographical
representativeness. These datasets include: sulfuric acid production; soda ash production;
hydrogen peroxide production, sodium sulfate production; starch production; coating and filler
production; waste treatment processes at pulp and paper mills.
3 Methodology
The sections below describe the key points of the LCA methodology used to generate the Paper
Calculator results. This LCA conforms to ISO 14044 and the draft LEO-S-002 standard,11 the Pulp/Paper
PCR12, the Roundwood PCR13 and the LCIA Methodology for PCR Modules14.
Functional Unit
The functional unit is the quantitative reference point of an LCA, which serves the purpose of providing a
common basis for calculating all the environmental impacts. All the environmental impacts occurring
across the life cycle of a product are analyzed and quantified in relation to the function of the product.
The paper grades defined in the Paper Calculator can be used in multiple applications (e.g. books,
magazines, newspapers, posters, etc.). Due to its potential use in various applications, a specific
functional unit cannot be clearly defined. Hence, a declared unit is used, in lieu of a functional unit in
11 LEO-SCS-002 Standard Draft Dated June 2014. Leonardo Academy. http://www.leonardoacademy.org/programs/standards/life-cycle.html 12 PCR Module for Pulp and Paper; https://www.scsglobalservices.com/files/program_documents/pcr_final_pulp_paper_101816.pdf 13 PCR Module for Roundwood Production: https://www.scsglobalservices.com/files/resources/pcr_final_wood-products_101816.pdf 14 Life Cycle Impact Assessment Methodology for PCR Modules for Roundwood and Pulp/Paper; https://www.scsglobalservices.com/files/program_documents/pcr_final_lcia-methodology_101816.pdf

Life Cycle Impact Assessment Methodology for EPN Paper Calculator v4.0 May 14, 2018
May 2018 | ©SCS Global Services Page | 9
this study. The declared unit clearly defines, quantitatively and qualitatively, the reference flow in the
study.15
The declared unit of 1 metric ton of paper produced is used as the basis of evaluation of all the
environmental indicators reported in the Paper Calculator. In case of tissue paper grade, there are four
types of tissue products (paper towels, napkins, bathroom tissue and facial tissue) and these products
are typically sold on an area basis (e.g. total square feet of bathroom tissue per roll). The results for
tissue products are presented in the Paper Calculator v4.0 relative to the total area of product
purchased. Average grammage values for tissue products16 were applied to convert the indicator results
from mass basis to an area basis (see Table 3 below). See Section 3.2.2 for more detail on user inputs for
tissue paper products.
Table 3. Default grammage values by tissue paper grade.
Tissue Paper Grade Average Grammage of tissue product
grams/ft2 grams/inch2
Paper towel 3.80 0.026
Paper napkins 2.85 0.020
Bathroom tissue 2.28 0.016
Facial tissue 2.47 0.017
System Boundary
A system boundary identifies the life cycle stages, processes and flows considered in the LCA. The
system boundary modeled for the Paper Calculator is cradle-to-grave for each type of paper based on
the user-specified recycled content, excluding the use phase of papers. The life cycle impacts of 14
North American paper grades are assessed from the extraction and processing of all raw materials
through the disposal of paper (end-of-life). The 14 paper grades reported in the Paper Calculator are
listed in Table 1.
Two versions were modeled for each paper grade, based on two types of fiber input:
(1) 100% Virgin Papers: Papers produced from 100% virgin fiber inputs including woody inputs such as
hardwood/softwood chips and hardwood/softwood roundwood.
The system boundary diagram presented in Figure 1 illustrates the key inputs, outputs and processing
steps which were included for 100% virgin paper grades. It includes all relevant impacts involved in
15 International Life Cycle Database Handbook: General Guide for Life Cycle Assessment – Detailed Guidance. Section 6.4.6. http://publications.jrc.ec.europa.eu/repository/bitstream/JRC48157/ilcd_handbook-general_guide_for_lca-detailed_guidance_12march2010_isbn_fin.pdf 16 Values in Table 3 are calculated based on Table 2.1.1 of the Green Seal Checklist. http://www.greenseal.org/Portals/0/Documents/Certification/Checklists%20(2013)/CCLGS1(2013).doc

Life Cycle Impact Assessment Methodology for EPN Paper Calculator v4.0 May 14, 2018
May 2018 | ©SCS Global Services Page | 10
wood extraction, production of chemical and energy inputs, pulp/paper production and paper disposal
(end-of-life management) for 14 paper grades produced in North America (USA and Canada).
(2)100% Recycled Papers: Papers produced from 100% recycled fiber inputs including recovered paper
or recovered paperboard inputs. The system boundary diagram presented in Figure 2 illustrates the key
inputs, outputs and processing steps for 100% recycled paper grades. It includes all relevant impacts
involved in waste paper collection and processing, production of chemical and energy inputs,
pulp/paper production and paper disposal (end-of-life management) for 14 paper grades produced in
North America (USA and Canada).
It is to be noted that the recycled content approach (also known as 100-0 cut off approach) is used to
model impacts for recycled papers, whereby the impacts from the prior and subsequent life cycles are
not included (see Section 3.3.2 for more detail). Due to the incorporation of only recovered paper
inputs, impacts to terrestrial and freshwater ecosystems from land use and conversion are not relevant
for these products. See Section 3.6.5 for more details.
Designating Recycled Content in Paper:
If the user designates a level of recovered fiber (recycled) content for a selected paper type, based on
the amount designated, the Paper Calculator allocates the environmental burdens accordingly between
virgin and recycled paper production. For example, if the recycled content of 1 metric ton of coated
freesheet paper grade designated by a user is 30%, the Paper Calculator will allocate the environmental
burden for this product in the following manner:
1 metric ton of coated freesheet paper (with 30% recycled content)= 700 kg of 100% virgin coated
freesheet paper+300 kg of 100% recycled coated freesheet paper.
User Inputs for Tissue Paper Grade:
For the tissue paper grade, the user is presented with an option to select the type of tissue product
among the following: (1) Paper towels; (2) Napkins; (3) Bathroom tissue; and (4) Facial tissue. Once the
user selects the tissue product type, the user enters the following details:
-User enters the size of each sheet
-User enters the total number of sheets
-User is provided with an option of changing the default grammage values (see Table 3).
Based on the inputs entered, the Paper Calculator will compute the results for tissue products relative to
the total area of the product purchased.

Life Cycle Impact Assessment Methodology for EPN Paper Calculator v4.0 May 14, 2018
May 2018 | ©SCS Global Services Page | 11
A description of the data requirements, LCI analysis, and LCIA, are provided in Sections 3.4, 3.5, and 3.6,
including the most important data sources used to evaluate all the indicators presented in the Paper
Calculator.
Figure 1. The system boundary depicts the key inputs, outputs and key processing steps associated with 100% virgin paper grades production from cradle-to-grave.

Life Cycle Impact Assessment Methodology for EPN Paper Calculator v4.0 May 14, 2018
May 2018 | ©SCS Global Services Page | 12
Figure 2. The system boundary depicts the key inputs, outputs and key processing steps associated with 100% recycled paper grades production from cradle-to-grave.
Allocation Procedures
Allocation is required when a single product system produces more than one good/product. In LCA,
allocation addresses the problem of how to divide resource use, energy use and emissions between
multiple products produced at the same production facility. Allocation guidelines in ISO 14044 state that
wherever possible, the use of allocation should be minimized. However, if allocation is required, ISO
14044 states that mass-based allocation should be used preferentially over economic allocation, and for
this reason, a mass-based allocation approach was used where necessary. Mass-based allocation takes a
physical approach by partitioning inputs and outputs in the product system, based on relative mass of
products and co-products generated.

Life Cycle Impact Assessment Methodology for EPN Paper Calculator v4.0 May 14, 2018
May 2018 | ©SCS Global Services Page | 13
Allocation Method to Determine Energy and Resource Inputs for All Papers
A mass-based allocation method was applied for each of the 14 paper grades to determine the amount
of energy and resource inputs relative to 1 metric ton of paper produced. Energy and resource use
(e.g.woody inputs, coatings, fillers, starch) at the pulp/paper mills were allocated to the product system
based on the total mass of paper grades produced annually at the mill. The RISI Mill-Asset database was
used to retrieve this information. Refer to Section 3.4.1 for more detail.
Allocation Method for Recycled Fiber Inputs in Recycled Papers
The most common approach for calculating the impacts of recycled paper is called the 100-0 cut-off
approach, which considers the environmental impacts of only one life cycle of the product (i.e., each
product should only be assigned impacts directly caused by that product). In the 100-0 cut-off approach
(also known as recycled content method), recovered fiber is not allocated any of the environmental
impacts associated with the original fiber source or processing; instead, the impact associated with the
paper recycling process (waste paper reprocessing into recycled pulp) is only accounted for on the input
side, depending on the recycled content of the paper. At the disposal (end-of-life) phase, the transport
to the recycling facility is the only process considered when materials are sent for recycling collection.
There is no credit attributed to the recycling processes at the end-of life for displacing virgin fiber inputs
in the next life cycle. The impacts of the recycling process will be allocated to the next life cycle using the
recycled materials.
The recycling of waste paper into recycled pulp does not provide any credit associated with the
avoidance of landfill impacts. However, the landfill avoidance credit is reported in a sensitivity analysis in
Section 3.7 of this document.
Data Requirements
Representative pulp and paper mills were identified across North America (USA and Canada) for each of
the 14 paper grades based on mill-level data purchased from Resource Information System, Inc (RISI).
The RISI Mill Asset database consists of data on 300+ pulp/paper mills in USA and Canada and this data
was used to characterize the paper grades produced at each mill. Data for each of the 14 paper grades
represents the average of data across all paper mills producing a particular paper grade in North
America.
To ensure the highest possible data quality for all the indicators reported in the Paper Calculator, data
collection efforts were focused on the “key” unit processes and flows for the product system (1 metric
ton of paper), as illustrated in Figure 3. In this figure, the “key” unit processes are represented by
numbers 1 through 7 in boxes and letters A through E are used to represent the input flows (A through
E) and output flows (F and G) relative to 1 metric ton of paper produced at the mill.

Life Cycle Impact Assessment Methodology for EPN Paper Calculator v4.0 May 14, 2018
May 2018 | ©SCS Global Services Page | 14
Figure 3. Data collection for key processes (1 through 7) and flows (A through G) relative to the production of 1 metric ton of paper.
Table 4 below presents the list of specific data points collected for pulp and paper mills producing all the
paper grades and the corresponding data source used to model all the paper grades. Life cycle inventory
data was used to model two sets of product systems (100% virgin papers and 100% recycled papers) for
each of the 14 paper grades in the LCA software used (openLCA v1.5). Datasets from the Ecoinvent v3.3
database were used for background processes along with data from RISI Mill Asset database and the
USLCI database.
An important dataset is related to the assessment of category indicator results for Terrestrial Ecosystem
Impacts (includes four indicators: forest disturbance, freshwater disturbance, wetland disturbance and
threatened species habitat disturbance) and forest carbon storage loss. The US Forest Service database,
Canadian National Forest Inventory database and the IUCN Red List database were used to assess these
category indicators. Data related to HAPs and dioxin emissions indicators were retrieved for all North

Life Cycle Impact Assessment Methodology for EPN Paper Calculator v4.0 May 14, 2018
May 2018 | ©SCS Global Services Page | 15
American pulp and paper mills from US EPA’s Toxic Release Inventory (TRI)17 database and Canada’s
National Pollutant Release Inventory (NPRI)18 database.
Table 4. Data points and data sources used for modeling 100% virgin papers and 100% recycled papers based on Figure 3.
Parameters/ Flows
Data Points Collected Data Source Used For the Assessed Paper Grades
100% Virgin Papers 100% Recycled Papers
General Information
Paper mills in North America
Number of pulp and paper mills, by grade in North America
Types of paper grade produced, by mill in North America
RISI database
Production Outputs
Annual production of all pulp and paper grades, by mill in North America
RISI database
1. Wood Inputs Specific to the Pulp and Paper Mills
(A) Wood Inputs
Pulpwood harvest locations for pulp/paper mills
To calculate national average results for all paper grades, it is assumed that pulpwood is sourced from within 150 miles19 of the location of pulp/paper mill
Not Applicable
Terrestrial ecosystem impacts and forest carbon storage loss, based on location of roundwood harvest
-US Forest Service20 and Canadian National Forest Inventory21 -IUCN Red List database22 for assessing species impacted by wood harvest
Not Applicable
Amount of wood input consumed per metric ton paper
RISI database for all paper grades Not Applicable
2. Waste Paper Input
(B) Recovered fiber input
(The user will enter a value from 0-100 to represent the
desired recycled content)
Amount of recovered fiber input consumed per metric ton paper
Not ApplicableRISI database
3. Energy Inputs
(C) Energy Inputs
Amount of fuel consumed, by type per metric ton paper
RISI database
Amount of electricity consumed per metric ton paper
RISI database
Amount of steam purchased per metric ton paper
RISI database
Black liquor generated and consumed
RISI database
Not Applicable
17 US EPA Toxic Release Inventory program; https://www.epa.gov/toxics-release-inventory-tri-program/tri-data-and-tools 18 National Pollutant Release Inventory(NPRI); Environment Canada; www.ec.gc.ca/npri 19 The Kimberly Clark LCA indicated that the Canadian Bioenergy Association evaluated 150 km as the average transport distance of Northern softwood. 20 US Forest Service FIA database; https://www.fia.fs.fed.us/tools-data/ 21 https://nfi.nfis.org/en/data_and_tools 22 IUCN Red List; http://www.iucnredlist.org/

Life Cycle Impact Assessment Methodology for EPN Paper Calculator v4.0 May 14, 2018
May 2018 | ©SCS Global Services Page | 16
Parameters/ Flows
Data Points Collected Data Source Used For the Assessed Paper Grades
100% Virgin Papers 100% Recycled Papers
4. Chemical Inputs
(D) Chemical Inputs
Amount of chemical inputs by type per metric ton paper
-USLCI data is used for the following paper grades: coated freesheet, uncoated freesheet, coated groundwood, uncoated groundwood -Ecoinvent v3.3 is used for the remaining paper grades
-Table 39 and Table 43 of a comparative LCA study on recycled coated freesheet paper and virgin coated freesheet paper 23 is used for modeling chemical inputs in a recycled pulp/paper mill -Ecoinvent v3.3 is used for the remaining paper grades
5. Other Inputs
(E) Other Inputs
Amount of other material inputs by type per metric ton paper
-RISI database for coatings, fillers and starch for all paper grades
Water consumption per metric ton paper
Ecoinvent v3.3 data used for all paper grades
6. Waste Outputs
(F) Waste Products
Air emissions, by substance per metric ton paper
-US EPA Toxic Release Inventory (TRI) database for all paper grades -Canada’s National Pollutant Release Inventory (NPRI) for all paper grades
Amount of BOD, COD and TSS emissions per metric ton paper
-USLCI data was used for the following paper grades: coated freesheet, uncoated freesheet, coated groundwood, uncoated groundwood, corrugating medium and linerboard -Ecoinvent v3.3 was used for the remaining paper grades
-Table 40 of a comparative LCA study on recycled coated freesheet paper and virgin coated freesheet paper 24 was used to model BOD, COD, and TSS in the recycled pulp mill -Ecoinvent v3.3 is used for all paper grades
Amount of hazardous waste per metric ton paper
-US EPA Toxic Release Inventory (TRI) database for all paper grades -Canada’s National Pollutant Release Inventory (NPRI) for all paper grades
Amount of solid waste per metric ton paper
-USLCI data was used for the following paper grades: coated freesheet, uncoated freesheet, coated groundwood, uncoated groundwood, corrugating medium and linerboard. -Ecoinvent v3.3 was used for the remaining paper grades
Ecoinvent v3.3
7. End-of-Life
(G.a) Recycling Amount of paper recycled per metric ton paper
For the end-of-life phase, recycling rates are assumed based on the 2014 US EPA Municipal Solid Waste (MSW) reports25. Based on information from the MSW reports, 80% of the materials not recycled are assumed to go to a municipal landfill and the remaining 20% are assumed to be incinerated. The following recycling rates were used for different paper grades: Coated freesheet, Uncoated freesheet, Coated groundwood, Supercalendered=44.4% Uncoated Groundwood= 68.2% All paperboards, linerboard and corrugating medium= 89%
(G.b) Landfilling
Amount of paper landfilled per metric ton paper
(G.c) Incineration
Amount of paper incinerated per metric ton paper
23 SCS Global Services, October 2015. Life Cycle Assessment of Reincarnation 100 Coated Freesheet Compared to Virgin Paper Products. 24 SCS Global Services, October 2015. Life Cycle Assessment of Reincarnation 100 Coated Freesheet Compared to Virgin Paper Products. 25 US EPA MSW (2014); https://www.epa.gov/sites/production/files/2016-11/documents/2014_smmfactsheet_508.pdf

Life Cycle Impact Assessment Methodology for EPN Paper Calculator v4.0 May 14, 2018
May 2018 | ©SCS Global Services Page | 17
Approach for retrieving data from the RISI Mill Asset Database
RISI data is commonly used in U.S. and global market modeling for the pulp and paper sector. RISI, the
data provider for pulp and paper mills, works with industry and trade associations to collect information
for their databases and is considered to be the leading information provider for pulp/paper industrial
sector. The RISI data included information on mill location, production capacities by product type,
energy inputs by fuel type and chemical inputs such as coatings, fillers and starch consumed in paper
production. The pulp and paper mill data is publicly available for purchase on the RISI website, but is not
shared in this document due to purchase restrictions. However, details on key specific aspects of the
approach used to retrieve data from the RISI database are summarized in the sections below.
3.4.1.1 Step 1: Classifying paper products/paper grades produced at each mill
The first step was to classify the paper grades produced at each mill. RISI data in the “assetData” sheet
was used to identify the products/paper grades produced at each mill. The mills were grouped by paper
grade. RISI data in the assetData sheet was used to sort out pulp-only mills.
3.4.1.2 Step 2: Classifying mills as Integrated or Non-integrated
The second step was to determine whether the mills are Integrated mills26 or Non-Integrated mills27
from the “pulpandpaperfurnishAnnualData” sheet. An integrated mill consists of a pulp mill and a paper
mill on the same site, whereas a non-integrated mill purchases pre-processed pulp (“market pulp”) in
either a slurry form or an air-dried and baled form from a market pulp mill, which most often is a
standalone pulp mill. Data in the “pulpandpaperfurnishAnnualData” sheet was used to identify mills that
purchase 100% of the pulp for paper production (i.e., mills that do not manufacture any pulp at the
facility), as per the screenshot below (see the highlighted rows in yellow). All remaining mills were
classified as integrated mills.
Figure 4. Screenshot of format of data used to classify the mills as Integrated and Non-Integrated. The rows highlighted in yellow are examples of Non-integrated mills as they purchase 100% of the pulp. Note that the mill names and the table header names have been modified due to RISI’s purchase restrictions. Data here is strictly for demonstrative purpose only.
26 A facility producing pulp and making paper with paper as the primary product is considered an integrated mill. 27 A facility that does not produce any pulp and purchases pre-processed pulp (“market pulp”) to make paper is considered as a non-integrated mill.

Life Cycle Impact Assessment Methodology for EPN Paper Calculator v4.0 May 14, 2018
May 2018 | ©SCS Global Services Page | 18
3.4.1.3 Step 3: Classifying mills based on fiber inputs: 100% Virgin, 100% Recycled and Mixed (Virgin + Recycled)
RISI data in the “naturalWoodData” and “recoveredPaperData” worksheets were used to classify mills
based on type of fiber inputs. As indicated in the snapshot below, mills which consume only recycled
pulp or recovered paper inputs and which do not consume any wood inputs (such as hardwood chips,
softwood roundwood and softwood chips) or pulp inputs (includes chemical pulp and mechanical pulp)
are classified as mills using “100% recycled” fiber inputs.
Figure 5. Screenshot of format of data used to classify mills with 100% recycled fiber inputs. The rows highlighted in yellow are examples of mills using only recovered fiber inputs (values indicated in red). Note that the mill names and the table header names have been modified due to RISI’s purchase restrictions. Data here is strictly for demonstrative purpose only.
Similarly, mills which do not consume any recycled pulp or recovered paper inputs are classified as mills
using “100% virgin” fiber inputs. These inputs include hardwood chips, softwood chips, roundwood,
chemical pulp and mechanical pulp.
Figure 6. Screenshot of format of data used to classify mills with 100% virgin fiber inputs. The rows highlighted in yellow are examples of mills using only virgin fiber inputs (values indicated in red). Note that the mill names and the table header names have been modified due to RISI’s purchase restrictions. Data here is strictly for demonstrative purpose only.
Mills consuming both virgin and recycled fiber inputs are classified as mills using “mixed” fiber inputs.
Figure 7. Screenshot of format of data used to classify mills with mixed fiber inputs. The rows highlighted in yellow are examples of mills using mixed fiber inputs (values indicated in red). Note that the mill names and the table header names have been modified due to RISI’s purchase restrictions. Data here is strictly for demonstrative purpose only.

Life Cycle Impact Assessment Methodology for EPN Paper Calculator v4.0 May 14, 2018
May 2018 | ©SCS Global Services Page | 19
Figure 8 illustrates the approach described above to classify mills based on type of fiber input (100%
virgin, 100% recycled and mixed). Table 5 presents the number of mills identified by mill type for each
paper grade.
Figure 8. The above figure illustrates the classification of pulp and paper mills in the RISI Mill Asset Database. 100% virgin and 100% recycled paper grades are produced in non-integrated paper mills (indicated in orange color) and integrated paper mills (indicated in purple color). Virgin pulp mills (indicated in red color) supply virgin pulp to non-integrated and integrated paper mills producing 100% virgin paper products. Similarly, recycled pulp mills (indicated in green color) supply recycled pulp to non-integrated and integrated paper mills producing 100% recycled paper products. Woody inputs are required during virgin pulp production as well as in integrated paper mills producing virgin paper products. Wastepaper inputs are required for recycled pulp production as well as in integrated mills producing recycled paper products.

Life Cycle Impact Assessment Methodology for EPN Paper Calculator v4.0 May 14, 2018
May 2018 | ©SCS Global Services Page | 20
Table 5. Classification of mills by paper grade in the RISI Mill Asset Database based on Figure 8.
Type of Paper Grade
Number of mills by Mill Type as shown in Figure 8
1.a 1.b 1.c 2.a 2.b 2.c
1. Coated Freesheet 7 2
2. Uncoated Freesheet 1 4 13 23
3. Coated Groundwood 9 1
4. Uncoated Groundwood 12 13 1
5. Supercalendered 9 1
6. Paperboard: Solid Bleached Sulfate 13
7. Paperboard: Coated Unbleached Kraft 3
8. Paperboard: Coated Recycled Board 16
9. Paperboard: Uncoated Bleached Kraft 1
10. Paperboard: Uncoated Unbleached Kraft 2 1
11. Paperboard: Uncoated Recycled Board 48
12. Linerboard 8 29 29
13. Corrugating Medium 2 18 31
14. Tissue 30 4 6 10 11
Corrugated product grade was calculated based on mix of linerboard and corrugating medium mills.
To calculate the North American average results for 100% virgin paper grades, the data was averaged
across the number of mills listed in 1.a and 2.a in Table 5. Similarly, to calculate the North American
average results for 100% recycled paper grades, the data was averaged across the number of mills listed
in 1.c and 2.c. For some paper grades (paper grades 1, 2, 3 and 5 in Table 5), mill data for 2.c was
unavailable. Thus, the results for these four paper grades were calculated based on data averaged
across the number of mills listed in 2.b.
3.4.1.4 Calculation of Emissions and Energy Input Data from RISI
RISI provides data on the total consumption of energy of all types at all pulp and paper mills in the USA
and Canada. This was first converted to total emissions for each mill, calculated using standard
emissions factors applied to each type of fuel.
The approaches to evaluate emissions and total energy use relative to the production of paper for
integrated mills and non-integrated differ, and are each described below.
For integrated mills, the total emissions of GHG i (where GHG i includes greenhouse gases such as
carbon dioxide, methane, nitrous oxide, etc.), per metric ton of product, are calculated by summing the
emissions from all fuels consumed by the mill, as per the equation below.
Total mill emissionsi
metric ton paper= ∑
Emissions/Energy Usei,j
metric ton pulp and paper capacities
all fuels 𝑗
𝑗
Where Total mill emissionsi is the total mill emissions of GHG i, given in metric tons of GHG per
metric ton of product produced.

Life Cycle Impact Assessment Methodology for EPN Paper Calculator v4.0 May 14, 2018
May 2018 | ©SCS Global Services Page | 21
For non-integrated paper mills, a national average figure for emissions from non-integrated pulp mills
was used to model emissions associated with pulp inputs to the paper mill. Emissions for non-integrated
paper mills were calculated using the equation below.
Total emissions (non integrated mills)i
metric ton paper
= ∑ [ (Pulp Mill Emissionsi,j
pulp capacity×
pulp inputs
metric ton paper) +
Paper Mill Emissionsi,j
paper mill capacity ]
all fuels j
𝑥
Where Pulp Mill Emissionsi,j
pulp capacity is a national average figure and
pulp inputs
metric ton paper and
Paper Mill Emissionsi,j
paper mill capacity are calculated for specific non-integrated paper mills.
For mills that produce multiple paper grades, the total mill energy consumption and total mill capacity
were used to calculate emissions for all products (i.e., emissions per metric ton of paper will be the
same across all products produced at the mill). RISI does not provide energy use broken down by paper
grade, so it was not possible to calculate energy consumption on a product-by-product basis for each
mill. The approach selected is the most transparent approach to calculating energy consumption and
associated emissions for each product at each mill.
3.4.1.5 Calculation of Pulp Inputs Data from RISI
RISI provides data on the total pulp manufactured and purchased by each mill, broken down by pulp
type. This data was used to calculate the pulp inputs, by pulp type, per metric ton of paper produced, for
each mill, distinguishing between integrated and non-integrated mills. The following equation was
applied:
Pulp Inputsk
metric ton paper=
Total Pulp Inputsk
total mill paper capacity
Where k represents the different pulp types consumed.
3.4.1.6 Calculation of Wood Inputs Data from RISI
RISI provides data on the total wood inputs at each mill, broken down by type of wood. This data was
used to calculate wood inputs, by wood type, per metric ton of paper produced for each mill. The
following equation was applied:
Wood Inputsk
metric ton paper=
Total Wood Inputsk
total mill capacity
Where k represents the different wood types consumed.

Life Cycle Impact Assessment Methodology for EPN Paper Calculator v4.0 May 14, 2018
May 2018 | ©SCS Global Services Page | 22
3.4.1.7 Calculation of Other Inputs Data from RISI
RISI provides data on the total other inputs (coatings, fillers, starch) at each mill. This data was used to
calculate other inputs, by input type, per metric ton of paper produced for each mill. The following
equation was applied:
Other Inputsk
metric ton paper=
Total Other Inputsk
total mill paper capacity
Where k represents the other input type (coating, filler, starch, etc.).
Calculation of toxic air emissions data
Pulp and paper mills report toxic releases to government bodies on an annual basis. Toxic air emissions
data was retrieved for all pulp and paper mills operating in North America in year 2015 from US EPA’s
Toxic Release Inventory (TRI) database and Canada’s National Pollutant Release Inventory (NPRI)
database. This data was cross-referenced with data in the RISI Mill Asset database to generate national
average toxic air emissions data for each of the 14 paper grades. The annual air emissions data was
normalized relative to 1 metric ton of paper, based on the production capacities of the paper grades at
the pulp and paper mills. This data was used to calculate results for HAPs, VOC, TRS, mercury emissions
and dioxin emission indicators.
Use of Ecoinvent and USLCI Datasets
The background processes associated with pulp and papermaking processes were modeled using LCA
database such as Ecoinventv3.3 and USLCI database. The Ecoinvent and USLCI datasets were used to
model the upstream impacts of all inputs (chemical inputs, material inputs and energy inputs) into the
pulp and papermaking processes. To the extent possible, datasets representing North American
production were selected to build the LCA model. European or global average datasets were used to fill
the remaining data gaps. A detailed list of datasets used for modeling all the paper grades is presented
in Table 7.
Waste output data per metric ton of paper- BOD, COD, TSS and Solid Waste
The EPA TRI database does not contain BOD, COD and TSS data for pulp/paper mills. A mix of USLCI and
Ecoinvent datasets was used to estimate the BOD, COD and TSS emissions (see Table 4 for more detail)
during papermaking. The Ecoinvent v3.3 data behind these processes for certain paper grades were
based on global average production data and thus not necessarily representative of the North American
context (see table below). These data were the only ones available that made the distinction between
virgin and recycled paper production for different paper grades and thus these data was used to report
the BOD, COD and TSS indicators.

Life Cycle Impact Assessment Methodology for EPN Paper Calculator v4.0 May 14, 2018
May 2018 | ©SCS Global Services Page | 23
Solid waste data on pulp and paper production is based on a mix of USLCI and Ecoinvent datasets (see
Table 6. for more detail). The amount of solid waste generated from discarding 1 metric ton of paper is
assumed to be the amount of paper that is disposed to a landfill and a municipal incinerator. The
amount of paper being recycled, landfilled and incinerated is based on MSW reports for 2014 (see Table
4).
Table 6. Datasets used to determine the amount of BOD, COD, TSS and solid waste outputs during papermaking. (Note: “cut-off, U” refers to the classification of datasets used to model the paper grades in the Ecoinvent v3.3 LCA database. Letters US, CA and QC denote the region represented by the dataset. “US” refers to United States”, “CA” refers to Canada” and “QC” refers to Quebec province in Canada).
Data Source
Dataset Name for Paper Grade by Type of Fiber Input Region, Year
US LCI Ecoinvent v3.3
Coated Freesheet: 100% virgin: Paper, freesheet, coated, average production, at mill 100% recycled: graphic paper28 production, 100% recycled | graphic paper, 100% recycled | cut-off, U
US, 2006 Global, 2016
US LCI Ecoinvent v3.3
Uncoated Freesheet: 100% virgin: Paper, freesheet, uncoated, average production, at mill, 2006 100% recycled: paper production, woodfree, uncoated, 100% recycled content, at non-integrated mill | paper, woodfree29, uncoated | cut-off, U -paper production, woodfree, uncoated, 100% recycled content, at integrated mill | paper, woodfree, uncoated | cut-off, U
US, 2006 CA, 2016 CA, 2016
US LCI Ecoinvent v3.3
Coated Groundwood: 100% virgin: Paper, mechanical, coated, average production, at mill 100% recycled: graphic paper production, 100% recycled | graphic paper, 100% recycled | cut-off, U
US, 2006 Global, 2016
US LCI Ecoinvent v3.3
Uncoated Groundwood: 100% virgin: Paper, mechanical, uncoated, average production, at mill 100% recycled: paper production, newsprint, recycled | paper, newsprint | cut-off, U
US, 2006 CA, 2016
US LCI Ecoinvent v3.3
Supercalendered: 100% virgin: paper production, woodcontaining, supercalendered | paper, woodcontaining, supercalendered | cut-off, U-CA 100% recycled: graphic paper production, 100% recycled | graphic paper, 100% recycled | cut-off, U
CA, 2016 Global, 2016
Ecoinvent v3.3 Ecoinvent v3.3
Paperboard: Solid Bleached Sulfate/Coated Bleached Kraft, Uncoated Bleached Kraft 100% virgin: solid bleached board production | solid bleached board | cut-off, U CA-QC 100% recycled30: chipboard production, white lined | folding boxboard/chipboard | cut-off, U
CA, 2016 Global, 2016
Ecoinvent v3.3 Ecoinvent v3.3
Paperboard: Coated Unbleached Kraft, Uncoated Unbleached Kraft 100% virgin: solid unbleached board production | solid unbleached board | cut-off, U 100% recycled30: chipboard production, white lined | folding boxboard/chipboard | cut-off, U
Global, 2016 Global, 2016
28 Note that graphical paper includes coated freesheet, uncoated freesheet, coated groundwood, uncoated groundwood and supercalendered paper grades. 29 Note that in the Ecoinvent databse, woodfree refers to paper that contains atleast 90% of the fibers in the form of chemical pulp. 30 Note that the recycled version of Paperboard: Coated Unbleached Kraft paper grade corresponds to Paperboard: Coated Recycled Board paper grade in the Paper Calculator. Similarly, recycled version of Paperboard: Uncoated Bleached Kraft/Uncoated Unbleached Kraft paper grades corresponds to Paperboard: Uncoated Recycled Board paper grades.

Life Cycle Impact Assessment Methodology for EPN Paper Calculator v4.0 May 14, 2018
May 2018 | ©SCS Global Services Page | 24
Data Source
Dataset Name for Paper Grade by Type of Fiber Input Region, Year
Ecoinvent v3.3
Paperboard: Coated Recycled Board, Uncoated Recycled Board Chipboard production, white lined | folding boxboard/chipboard | cut-off, U
Global, 2016
Ecoinvent v3.3 Ecoinvent v3.3
Linerboard 100% virgin: linerboard production, kraftliner | linerboard | cut-off, U CA-QC 100% recycled: treatment of recovered paper to linerboard, testliner| cut-off, U CA-QC
CA, 2016 CA, 2016
USLCI Ecoinvent v3.3
Corrugating Medium 100% virgin: Corrugated product, containerboard, average production, at mill, 2010 100% recycled: treatment of recovered paper to fluting medium, wellenstoff | fluting medium | cut-off, U
US, 2010 Global, 2016
Ecoinvent v3.3 Ecoinvent v3.3
Tissue 100% virgin: tissue paper production, virgin | tissue paper | cut-off, U 100% recycled: tissue paper production | tissue paper | cut-off, U
Global, 2016 Global, 2016
LCI Analysis Summary
A life cycle inventory (LCI) analysis was conducted in conformance with ISO 14044 and LEO-S-002. The
openLCA software31 was used to model and analyze the complete set of inputs and outputs associated
with all production stages in each product system, by unit process. As indicated in Table 7, the LCI of 14
paper grades is based on data from RISI Mill Asset database, and representative data from the Ecoinvent
v3.3 database32 and USLCI database33.
The data sources used for the LCI analysis are summarized by paper grade in Table 4. See Table 7 below
for more details on the background datasets used for modeling key inputs and outputs illustrated in
Figure 3. The table also provides the associated level of data quality including representativeness and
materiality of the data used for modeling. The data quality of the inventory, environmental
characterization, and parameter data used is required to be sufficient to differentiate results between
the environmental impacts of 14 paper grades. Indication on quality of data includes evaluation of the
reliability and completeness of the data itself, combined with the evaluation of the representativeness
(temporal, geographical and technological) of processes used to model it (indicated as high, medium or
low).
The table below also provides the materiality associated with the processes used to model the paper
grades. A process with a high materiality means that its relative contribution to the total Paper
Calculator indicator results are high, indicating that the data is likely to have a relatively big influence on
the indicator result. On the other hand, a process with low materiality means that it has lower
31 openLCA modeling software, version 1.5.beta1 By GreenDelta. 32 Ecoinvent v3.3 Swiss Center for Life Cycle Inventories, 2016. The system model used is based on the recycled content cut-off method. http://www.ecoinvent.org 33 USLCI database; https://uslci.lcacommons.gov/uslci/search
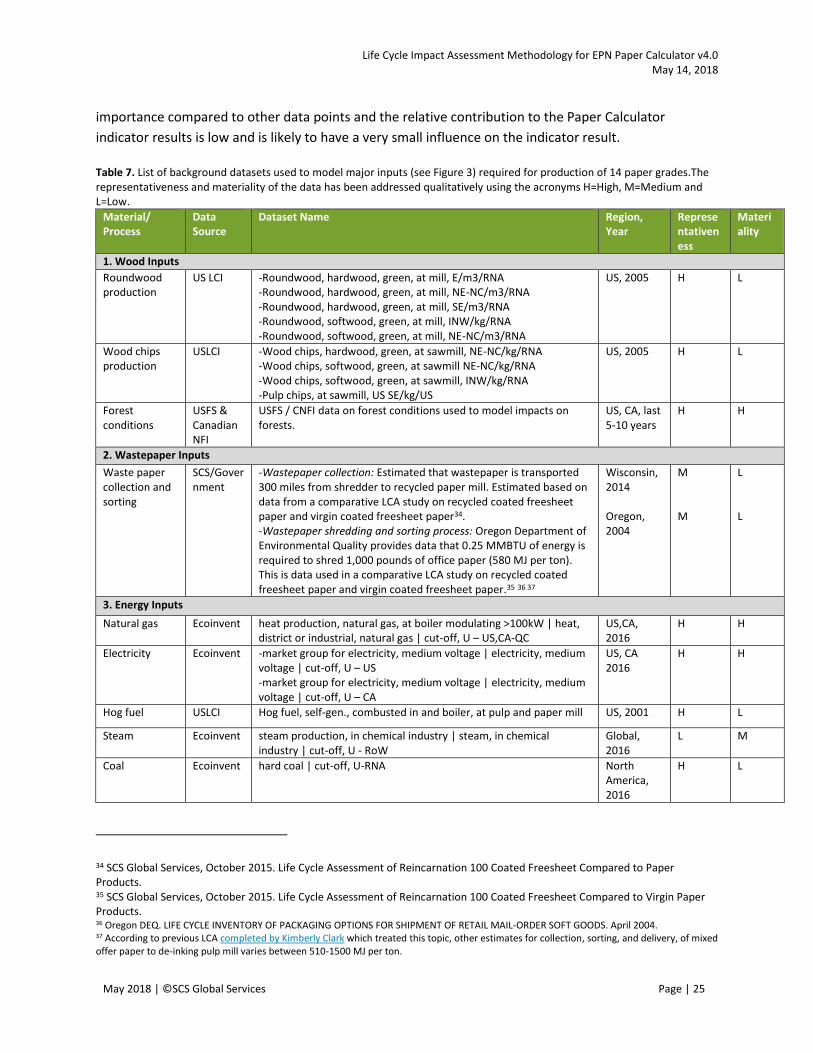
Life Cycle Impact Assessment Methodology for EPN Paper Calculator v4.0 May 14, 2018
May 2018 | ©SCS Global Services Page | 25
importance compared to other data points and the relative contribution to the Paper Calculator
indicator results is low and is likely to have a very small influence on the indicator result.
Table 7. List of background datasets used to model major inputs (see Figure 3) required for production of 14 paper grades.The representativeness and materiality of the data has been addressed qualitatively using the acronyms H=High, M=Medium and L=Low.
Material/ Process
Data Source
Dataset Name Region, Year
Representativeness
Materiality
1. Wood Inputs
Roundwood production
US LCI -Roundwood, hardwood, green, at mill, E/m3/RNA -Roundwood, hardwood, green, at mill, NE-NC/m3/RNA -Roundwood, hardwood, green, at mill, SE/m3/RNA -Roundwood, softwood, green, at mill, INW/kg/RNA -Roundwood, softwood, green, at mill, NE-NC/m3/RNA
US, 2005 H L
Wood chips production
USLCI -Wood chips, hardwood, green, at sawmill, NE-NC/kg/RNA -Wood chips, softwood, green, at sawmill NE-NC/kg/RNA -Wood chips, softwood, green, at sawmill, INW/kg/RNA -Pulp chips, at sawmill, US SE/kg/US
US, 2005 H L
Forest conditions
USFS & Canadian NFI
USFS / CNFI data on forest conditions used to model impacts on forests.
US, CA, last 5-10 years
H H
2. Wastepaper Inputs
Waste paper collection and sorting
SCS/Government
-Wastepaper collection: Estimated that wastepaper is transported 300 miles from shredder to recycled paper mill. Estimated based on data from a comparative LCA study on recycled coated freesheet paper and virgin coated freesheet paper34. -Wastepaper shredding and sorting process: Oregon Department of Environmental Quality provides data that 0.25 MMBTU of energy is required to shred 1,000 pounds of office paper (580 MJ per ton). This is data used in a comparative LCA study on recycled coated freesheet paper and virgin coated freesheet paper.35 36 37
Wisconsin, 2014 Oregon, 2004
M M
L L
3. Energy Inputs
Natural gas Ecoinvent heat production, natural gas, at boiler modulating >100kW | heat, district or industrial, natural gas | cut-off, U – US,CA-QC
US,CA, 2016
H H
Electricity Ecoinvent -market group for electricity, medium voltage | electricity, medium voltage | cut-off, U – US -market group for electricity, medium voltage | electricity, medium voltage | cut-off, U – CA
US, CA 2016
H H
Hog fuel USLCI Hog fuel, self-gen., combusted in and boiler, at pulp and paper mill US, 2001 H L
Steam Ecoinvent steam production, in chemical industry | steam, in chemical industry | cut-off, U - RoW
Global, 2016
L M
Coal Ecoinvent hard coal | cut-off, U-RNA North America, 2016
H L
34 SCS Global Services, October 2015. Life Cycle Assessment of Reincarnation 100 Coated Freesheet Compared to Paper Products. 35 SCS Global Services, October 2015. Life Cycle Assessment of Reincarnation 100 Coated Freesheet Compared to Virgin Paper Products. 36 Oregon DEQ. LIFE CYCLE INVENTORY OF PACKAGING OPTIONS FOR SHIPMENT OF RETAIL MAIL-ORDER SOFT GOODS. April 2004. 37 According to previous LCA completed by Kimberly Clark which treated this topic, other estimates for collection, sorting, and delivery, of mixed offer paper to de-inking pulp mill varies between 510-1500 MJ per ton.
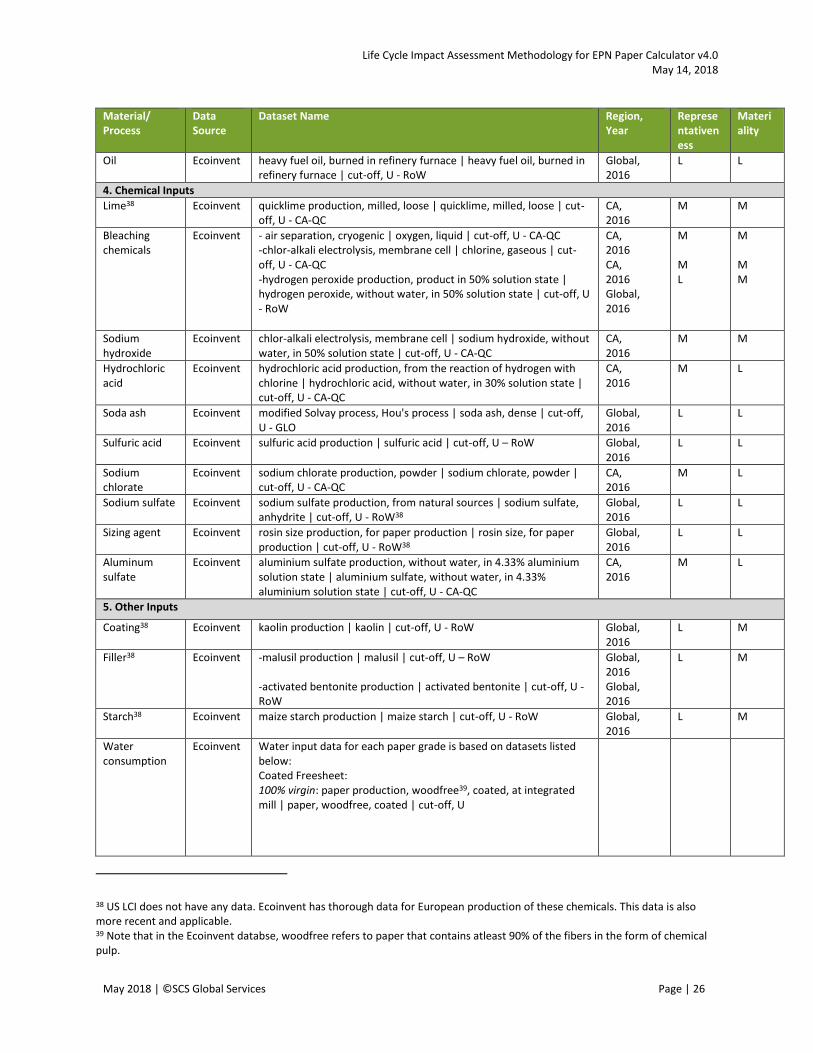
Life Cycle Impact Assessment Methodology for EPN Paper Calculator v4.0 May 14, 2018
May 2018 | ©SCS Global Services Page | 26
Material/ Process
Data Source
Dataset Name Region, Year
Representativeness
Materiality
Oil Ecoinvent heavy fuel oil, burned in refinery furnace | heavy fuel oil, burned in refinery furnace | cut-off, U - RoW
Global, 2016
L L
4. Chemical Inputs
Lime38 Ecoinvent quicklime production, milled, loose | quicklime, milled, loose | cut-off, U - CA-QC
CA, 2016
M M
Bleaching chemicals
Ecoinvent - air separation, cryogenic | oxygen, liquid | cut-off, U - CA-QC -chlor-alkali electrolysis, membrane cell | chlorine, gaseous | cut-off, U - CA-QC -hydrogen peroxide production, product in 50% solution state | hydrogen peroxide, without water, in 50% solution state | cut-off, U - RoW
CA, 2016 CA, 2016 Global, 2016
M M L
M M M
Sodium hydroxide
Ecoinvent chlor-alkali electrolysis, membrane cell | sodium hydroxide, without water, in 50% solution state | cut-off, U - CA-QC
CA, 2016
M M
Hydrochloric acid
Ecoinvent hydrochloric acid production, from the reaction of hydrogen with chlorine | hydrochloric acid, without water, in 30% solution state | cut-off, U - CA-QC
CA, 2016
M L
Soda ash Ecoinvent modified Solvay process, Hou's process | soda ash, dense | cut-off, U - GLO
Global, 2016
L L
Sulfuric acid Ecoinvent sulfuric acid production | sulfuric acid | cut-off, U – RoW Global, 2016
L L
Sodium chlorate
Ecoinvent sodium chlorate production, powder | sodium chlorate, powder | cut-off, U - CA-QC
CA, 2016
M L
Sodium sulfate Ecoinvent sodium sulfate production, from natural sources | sodium sulfate, anhydrite | cut-off, U - RoW38
Global, 2016
L L
Sizing agent Ecoinvent rosin size production, for paper production | rosin size, for paper production | cut-off, U - RoW38
Global, 2016
L L
Aluminum sulfate
Ecoinvent aluminium sulfate production, without water, in 4.33% aluminium solution state | aluminium sulfate, without water, in 4.33% aluminium solution state | cut-off, U - CA-QC
CA, 2016
M L
5. Other Inputs
Coating38 Ecoinvent kaolin production | kaolin | cut-off, U - RoW Global, 2016
L M
Filler38 Ecoinvent -malusil production | malusil | cut-off, U – RoW -activated bentonite production | activated bentonite | cut-off, U - RoW
Global, 2016 Global, 2016
L M
Starch38
Ecoinvent maize starch production | maize starch | cut-off, U - RoW Global,
2016 L M
Water consumption
Ecoinvent Water input data for each paper grade is based on datasets listed below: Coated Freesheet: 100% virgin: paper production, woodfree39, coated, at integrated mill | paper, woodfree, coated | cut-off, U
38 US LCI does not have any data. Ecoinvent has thorough data for European production of these chemicals. This data is also more recent and applicable. 39 Note that in the Ecoinvent databse, woodfree refers to paper that contains atleast 90% of the fibers in the form of chemical pulp.

Life Cycle Impact Assessment Methodology for EPN Paper Calculator v4.0 May 14, 2018
May 2018 | ©SCS Global Services Page | 27
Material/ Process
Data Source
Dataset Name Region, Year
Representativeness
Materiality
100% recycled: graphic paper40 production, 100% recycled | graphic paper, 100% recycled | cut-off, U Uncoated Freesheet: 100% virgin: paper production, woodfree, uncoated, at integrated mill | paper, woodfree, uncoated | cut-off, U 100% recycled: paper production, woodfree, uncoated, 100% recycled content, at non-integrated mill | paper, woodfree41, uncoated | cut-off, U -paper production, woodfree, uncoated, 100% recycled content, at integrated mill | paper, woodfree, uncoated | cut-off, U Coated Groundwood: 100% virgin: paper production, newsprint, virgin | paper, newsprint | cut-off, U 100% recycled: paper production, newsprint, recycled | paper, newsprint | cut-off, U Uncoated Groundwood: 100% virgin: paper, mechanical, uncoated, average production, at mill 100% recycled: paper production, newsprint, recycled | paper, newsprint | cut-off, U Supercalendered: 100% virgin: paper production, woodcontaining, supercalendered | paper, woodcontaining, supercalendered | cut-off, U-CA 100% recycled: graphic paper production, 100% recycled | graphic paper, 100% recycled | cut-off, U Paperboard: Solid Bleached Sulfate/Coated Bleached Kraft, Uncoated Bleached Kraft 100% virgin: solid bleached board production | solid bleached board | cut-off, U CA-QC 100% recycled42: chipboard production, white lined | folding boxboard/chipboard | cut-off, U Paperboard: Coated Unbleached Kraft, Uncoated Unbleached Kraft 100% virgin: solid unbleached board production | solid unbleached board | cut-off, U 100% recycled42: chipboard production, white lined | folding boxboard/chipboard | cut-off, U
CA, Global, 2016
H
L
40 Note that graphical paper includes coated freesheet, uncoated freesheet, coated groundwood, uncoated groundwood and supercalendered paper grades. 41 Note that in the Ecoinvent databse, woodfree refers to paper that contains atleast 90% of the fibers in the form of chemical pulp. 42 Note that the recycled version of Paperboard: Coated Unbleached Kraft paper grade corresponds to Paperboard: Coated Recycled Board paper grade in the Paper Calculator. Similarly, recycled version of Paperboard: Uncoated Bleached Kraft/Uncoated Unbleached Kraft paper grades corresponds to Paperboard: Uncoated Recycled Board paper grades.

Life Cycle Impact Assessment Methodology for EPN Paper Calculator v4.0 May 14, 2018
May 2018 | ©SCS Global Services Page | 28
Material/ Process
Data Source
Dataset Name Region, Year
Representativeness
Materiality
Paperboard: Coated Recycled Board, Uncoated Recycled Board Chipboard production, white lined | folding boxboard/chipboard | cut-off, U Linerboard 100% virgin: linerboard production, kraftliner | linerboard | cut-off, U CA-QC 100% recycled: treatment of recovered paper to linerboard, testliner| cut-off, U CA-QC Corrugating Medium 100% virgin: Corrugated product, containerboard, average production, at mill, 2010 100% recycled: treatment of recovered paper to fluting medium, wellenstoff | fluting medium | cut-off, U Tissue 100% virgin: tissue paper production, virgin | tissue paper | cut-off, U 100% recycled: tissue paper production | tissue paper | cut-off, U
6. Waste Outputs
Waste Treatment Processes from Pulping and Papermaking
Ecoinvent -Treatment of sludge from pulp and paper production, sanitary landfill | sludge from pulp and paper production | cut-off, U – RoW treatment of wood ash mixture, pure, sanitary landfill | wood ash mixture, pure | cut-off, U – RoW -Treatment of ash from paper production sludge, residual material landfill | ash from paper production sludge | cut-off, U – RoW -Treatment of hazardous waste, underground deposit | hazardous waste, for underground deposit | cut-off, U – RoW -Treatment of municipal solid waste, incineration | municipal solid waste | cut-off, U - CA-QC - Treatment of municipal solid waste, sanitary landfill | municipal solid waste | cut-off, U - CA-QC
Global, CA, 2016
L
L
7. End-of-Life
Recycling, Landfill and Incineration
Ecoinvent Recycling: transport, freight, lorry 16-32 metric ton, EURO4 | transport, freight, lorry 16-32 metric ton, EURO4 | cut-off, U - RoW Only the transportation impacts associated with transporting paper to the recycling facility are included in this assessment. Landfilling: -For coated freesheet, uncoated freesheet, coated groundwood and supercalendered paper grades: treatment of waste graphical paper, sanitary landfill | waste graphical paper | cut-off, U - Europe without Switzerland -For uncoated groundwood: treatment of waste graphical paper, sanitary landfill | waste graphical paper | cut-off, U - Europe without Switzerland
Global, 2016 Europe, 2016 Europe, 2016
L L L
L L L

Life Cycle Impact Assessment Methodology for EPN Paper Calculator v4.0 May 14, 2018
May 2018 | ©SCS Global Services Page | 29
Material/ Process
Data Source
Dataset Name Region, Year
Representativeness
Materiality
-For all paperboards, corrugating medium and linerboard: treatment of waste paperboard, sanitary landfill | waste paperboard | cut-off, U - RoW Incineration: -For coated freesheet, uncoated freesheet, coated groundwood and supercalendered paper grades: treatment of waste graphical paper, municipal incineration | waste graphical paper | cut-off, U - Europe without Switzerland -For uncoated groundwood: treatment of waste graphical paper, municipal incineration | waste graphical paper | cut-off, U - Europe without Switzerland - For all paperboards, corrugating medium and linerboard: treatment of waste paperboard, municipal incineration | waste paperboard | cut-off, U - RoW
Global, 2016 Europe, 2016 Europe, 2016 Global, 2016
L L L L
L L L L
This analysis shows that data quality for most relevant inputs is considered to be highly reliable and
complete. For most indicators, they are also representative of the temporal, geographical and
technological contexts. Processes with high and medium materiality in terms of environmental impacts
are all modeled using consistent data sources such as RISI data and LCA databases (Ecoinvent v3.3 and
USLCI), which make data uncertainties less significant. As the modelling was done with processes from
ecoinvent v3.3 database, the data behind some processes were global averages and thus not necessarily
representative of the North American context.
Accounting for Biogenic Carbon Flows
An important component of results related to changes in biogenic carbon is impacts from foregone
growth, which affect results for GHG emissions/ Climate Change and Ocean Acidification indicators. The
approach used to evaluate results is described conceptually in sections 3.6.2.1 and 3.6.2.2, while the
LCIA Methodology for PCR Modules43 contains more detail on the algorithms used.
Another important climatic effect is the emissions and absorption of climate pollutants at the time of
harvests, including:
Net forest regrowth, which is assumed to sequester atmospheric CO2 in the year that it occurs.
During logging, decay and/or combustion of aboveground logging residues (i.e., “slash”) and
carbon stored in tree roots were assumed to occur immediately, with all of the carbon assumed
to be converted into emissions of CO2. It is assumed that slash left on the site is 25% of the
43 Life Cycle Impact Assessment Methodology for PCR Modules for Roundwood and Pulp/Paper; https://www.scsglobalservices.com/files/program_documents/pcr_final_lcia-methodology_101816.pdf

Life Cycle Impact Assessment Methodology for EPN Paper Calculator v4.0 May 14, 2018
May 2018 | ©SCS Global Services Page | 30
harvest volume. Belowground roots are assumed to have a carbon mass same as in slash. These
fractions are considered typical of most forestry practices, and have been used in past LCAs.44
LCIA Methodology Summary
The LCA conforms to ISO 14044, the draft LEO-S-002 standard, the Roundwood PCR, the Pulp/Paper PCR
and the LCIA Methodology for PCR Modules. The LCIA methodology in the draft LEO-S-002 standard
requires that all impacts relevant to production of paper grades be accounted for, and that the metrics
used be environmentally relevant and based in a scientific and technically valid approach.
The final Paper Calculator results are based upon the compilation of category indicator results for all
core impact categories (see Section 1.3 for a list of core impact categories, and LCA results, for 14 paper
grades). Category indicators numerically represent the contribution of specific unit processes to
midpoints in the environmental mechanism for each core impact category.
Each category indicator result is calculated using characterization factors (CF) which are applied to LCI
data per flow. For some impact categories, two CF are used: potency potential characterization factors
(PP-CFs) and midpoint characterization factors (M-CFs). PP-CFs characterize the relative potency of
emissions, resource uses, or land uses in causing impacts. M-CFs characterize the actual effect on the
receiving environment of these emissions, resource uses, or land uses, which can vary on a site-specific
basis.
The significance of the indicators presented in the Paper Calculator, along with an overview of the
calculation approach, is summarized in the sections below. The in depth equations, and CFs, used to
calculate results, are given in the LCIA Methodology for PCR Modules.
Biotic/Abiotic Resource Depletion Indicators
3.6.1.1 Wood Use
Wood use measures the amount of wood required to produce a given amount of paper. Results are
reported in fresh/green tons of wood. The methodology used to estimate wood use only considers the
quantity of wood consumed during pulp and paper production and does not include the forest residues
left behind during pulpwood harvest in the forests (i.e., slash, roots). If forest residues are included it is
likely to be twice the value, as roughly 50% of biomass is left after harvest.
It should be noted that effects of loss of wood resources on forest ecosystems are treated in the impact
category group of Terrestrial and Freshwater Ecosystem Impacts (i.e., forest disturbance, freshwater
disturbance and threatened species indicators) and forest carbon loss is treated in the Greenhouse
44 SCS Global Services, October 2015. Life Cycle Assessment of Reincarnation 100 Coated Freesheet Compared to Virgin Paper Products.

Life Cycle Impact Assessment Methodology for EPN Paper Calculator v4.0 May 14, 2018
May 2018 | ©SCS Global Services Page | 31
Gas/Climate Change and Ocean Acidification indicators. These impact indicators are all linked to losses
of wood resources but nevertheless are distinct categories of impact.
Calculation Approach: This indicator was calculated based on the amount of wood chips and
roundwood consumed during paper production. This data was retrieved from the RISI database as
indicated in Table 4 in units of dry tons of wood. A conversion factor of 2 was applied to convert the
units from dry tons of wood to fresh/green tons of wood (1 fresh/green ton = 1 dry ton*2). This
indicator is not applicable to 100% recycled paper.
3.6.1.2 Total Energy and Purchased Energy
Total energy measures the total energy required over the paper’s life cycle, including all renewable and
non-renewable energy resources. It includes purchased electricity, hog fuel, steam, natural gas, black
liquor, coal, oil, etc. consumed during paper production. It also accounts for energy consumed in the
upstream sources such as production of pulping chemicals, coatings, fillers, etc.
Purchased energy is a subset of total energy, accounting for the amount of purchased electricity and
other fuels.
Calculation Approach: This indicator was calculated based on the energy content of the resources (using
lower heating value) and the energy consumption was aggregated across the paper’s life cycle from
cradle-to-grave. Purchased energy was calculated based on the amount of electricity and fuel purchased
by the pulp and paper mills. Data sources used for calculation of this indicator are presented in Table 4
and Table 7.
3.6.1.3 Water Consumption
Water consumption measures the amount of process and cooling water that is consumed throughout
the life cycle of the paper product. In general, water consumption indicator includes the water
withdrawn from surface water or groundwater source and not directly returned.45 Consumption of
saltwater is not included.
Calculation Approach: This indicator provides an aggregate of water consumed across the paper’s life
cycle from cradle-to-grave. The results also include the water consumed in upstream sources (e.g.
pulping chemicals, coatings, fillers) as well as water consumed in the end-of-life phase.
45 King, C. W., & Webber, M. E. (2008). Water intensity of transportation. Environmental Science & Technology, 42(21), 7866-7872.

Life Cycle Impact Assessment Methodology for EPN Paper Calculator v4.0 May 14, 2018
May 2018 | ©SCS Global Services Page | 32
Climate System Impacts
3.6.2.1 Greenhouse Gas (GHG)/ Climate Change Impacts
Greenhouse gases (includes carbon dioxide or CO2, methane or CH4, nitrous oxides or N2O, etc.) and
short-lived climate pollutants (includes black carbon and organic carbon) are emitted across the life
cycle of paper products (e.g. during energy generation, burning of biomass and fossil fuels in pulp/paper
mills, transportation, etc.). These pollutants contribute to climate change by trapping energy from the
sun in the earth's atmosphere. This impact category also includes forest carbon storage loss from logged
forests, which is the carbon that would have been sequestered in the forest had it not been harvested.
The results for this indicator were evaluated based on the “Global Climate Change” impact category. All
results for this impact category are calculated in terms of pounds carbon dioxide equivalent (pounds
CO2e) per mass of paper grade produced for 20 years, based on radiative forcing metrics (see calculation
approach below for more detail).
The production of virgin paper grades requires the harvesting of wood across large areas of forests (fiber
baskets). These harvests disturb the forest compositional structure, amount of biomass present, and
dominant species type. These disturbances results in forests with very different characteristics than
what can be found in undisturbed forestlands. In the fiber baskets of the mills,46 forestry activities have,
over many decades, led not only to ecosystem disturbances and key species impacts, but also reductions
in stored forest carbon, when compared to undisturbed forestlands. According to the IPCC,47 historic
CO2 emissions from land use changes are responsible for roughly 33% of the additional CO2 burden in
the atmosphere from anthropogenic activities. Most of the terrestrial ecoregions considered, if left
unharvested, would re-absorb a large portion of this CO2. IPCC estimates, for example, that afforestation
and reforestation could sequester 40-70 billion tons of carbon,48 indicating the large potential of
allowing disturbed ecosystems to re-sequester carbon which has been lost to the atmosphere. The
effect on ongoing harvest therefore suppresses the rate of forest carbon storage recovery in most
scenarios. 49
Calculation Approach: All results are calculated based on integrated radiative forcing (IRF) metrics in
terms of pounds of carbon dioxide equivalent (pounds CO2 e) for 20 years, based on radiative forcing
calculations specified in Section 5.2.1 of the LCIA Methodology for PCR Modules. Two effects on
radiative forcing (RF) are included:
46 The forests which supply wood to the pulp and paper mills are the fiber baskets of each mill. 47 Intergovernmental Panel on Climate Change. Working Group I Contribution to the IPCC Fifth Assessment Report. Climate Change 2013: The Physical Science Basis. Summary for Policymakers. 48 IPCC Fifth Assessment Report. Table 6.1.5. 2013. 49 Across the scenarios, the socio-economic implications of avoiding harvests will be different. For example, the socio-economic implications of regenerating forests in Europe are very different from forgoing harvesting in forests in Indonesia or Canada’s Boreal. These socio-economic considerations are outside the scope of this LCA.

Life Cycle Impact Assessment Methodology for EPN Paper Calculator v4.0 May 14, 2018
May 2018 | ©SCS Global Services Page | 33
(1) Emissions: This indicator considers climate pollutants causing warming and cooling, using
radiative forcing, which expresses the average heat increase per square meter of the Earth’s
surface. The emissions such as carbon dioxide (CO2), methane and other greenhouse gases,
short-lived climate pollutants occurring from industrial machinery (e.g., emissions from
transportation, energy generation, and burning biomass in pulp mills) and forest carbon fluxes
(e.g., net forest regrowth, decomposition of belowground biomass) are included in this
indicator. To calculate IRF effects from emissions, Global Warming Potential values evaluated
over 20 years (GWP-20) are used (see table below).
Table 8. GWP-20 values used for evaluating GHG/Climate Change Impacts indicator.
Pollutant GWP-20 value
Carbon Dioxide (CO2) 1
Methane (CH4)50 102
Nitrous Oxide (N2O)51 264
Sulfur Hexafluoride (SF6)52 17,500
HFC-134a53 3,710
Nitrogen Trifluoride (NF3)54 12,800
Black Carbon55 56 3,385
Organic Carbon57 -128
Sulfur Dioxide (SO2) 58 -274
Nitrogen Oxide (NOx)59 122
(2) Forest carbon storage loss calculations: carbon storage losses resulting from foregone growth
resulting from land use management activities lead to changes in atmospheric CO2
concentrations over the next 20 years.
50 Shindell, D.T., Faluvegi, G., Koch, D.M. et al. (2009). Improved Attribution of Climate Forcing to Emissions. Science. 326:716-718. Note that this paper states a GWP-20 value of 105 for methane based on IPCC AR4 report. The GWP-20 value was adjusted to 102 based on AGWP CO2 values provided in IPCC AR5 report in 2013. 51 IPCC Fifth Assessment Report. Table 8.A.1. 2013. 52 Ibid. 53 Ibid. 54 Ibid. 55 Bond, T., et al. Quantifying immediate RF by black carbon and organic matter with the Specific Forcing Pulse. Atmos. Chem. Phys., 11, 1505-1525, 2011. Value is based on the highest SPF value for black carbon. 56 Bond, T. C., et al. (2013), Bounding the role of black carbon in the climate system: A scientific assessment, J. Geophys. Res. Atmos., 118, 5380–5552, doi:10.1002/jgrd.50171. 57 Ibid. Value is based on the highest SPF value for organic carbon (i.e., lowest in magnitude). 58 W.J. Collins, et al. Temperature-change potentials for near-term climate forcers. Atmos. Chem. Phys., 13, 2471,2485, 2013. These are adjusted with a multiplier of 1.75 to include the aerosol indirect effect, using the approach in Shindell, et al., 2009, Improved Attribution of Climate Forcing to Emissions. 30 October 2009, Vol. 326, Science magazine. 59 Collins, W.J., et al (2010): How vegetation impacts affect climate metrics for ozone precursors. Journal of Geophysical Research, Vol. 115, 2010.

Life Cycle Impact Assessment Methodology for EPN Paper Calculator v4.0 May 14, 2018
May 2018 | ©SCS Global Services Page | 34
This forest carbon storage loss was calculated in conformance with the Roundwood PCR, the
Pulp/Paper PCR and Section 5.2.1.2 of the LCIA methodology for PCR Modules. Assessing
impacts from foregone growth is based on consideration of the forest growth trajectory under
two scenarios:
1. Harvest scenario, where the forests in the forest analysis unit (FAU)60 are maintained
according to the forecasted growth in FAU under planned logging activities.
2. No-harvest scenario: The lands in the forest analysis unit are not subjected to timber harvests,
but recover to the same conditions present in undisturbed forest areas (Undisturbed Reference
Areas, URA)61.
Data on forest biomass/carbon stored per hectare was retrieved from the US FIA database62 and
the Canadian National Forest Inventory database for the fiber baskets of mills considered in this
assessment. The forest carbon storage loss per hectare was computed based on guidelines
provided in Section 5.2.1.2 of the LCIA Methodology for PCR Modules and translated into carbon
dioxide equivalents (CO2e) using Equation 4 and Equation 9 of the document. This is converted
to IRF (in units which can be compared to the GWP-20 values) by dividing by 0.0249 mWm-2Tg-1
yrs., the Absolute Global Warming Potential over 20 years for CO2.
Ocean Ecosystem Impacts
This impact group generally deals with effects on ocean ecosystems. The only relevant impact category
is Ocean Acidification.
3.6.3.1 Ocean Acidification
Ocean acidification measures increased ocean acidity caused by CO2, which has detrimental
consequences for many marine organisms. This impact indicator represents the degree to which CO2
emissions lead to decreases in the pH of the ocean through the formation of carbonic acid, negatively
impacting coral reefs and other marine life by lowering both the aragonite and calcite saturation levels.
This indicator considers CO2 emitted during the production of pulp and paper, but also evaluates the
amount of CO2 which could be sequestered in trees if forest harvests used for papermaking were halted.
60 An area of timberland used to represent forest ecosystem impacts resulting from forestry operations within a region. 61 Area of forest/other wooded land against which measurements of ecological conditions in a Forest Analysis Unit (FAU) are compared. The Undisturbed Reference Area is chosen to be representative of the forest ecosystem in the Forest Analysis Unit against which it is compared, if significant human interventions were absent for a time period sufficient for mature forest ecosystem characteristics to become established. 62 US Forest Service FIA database; https://www.fia.fs.fed.us/tools-data/

Life Cycle Impact Assessment Methodology for EPN Paper Calculator v4.0 May 14, 2018
May 2018 | ©SCS Global Services Page | 35
This impact category is treated separately from Global Climate Change, as the impact categories are
linked but represent parallel environmental mechanisms; while CO2 retained in the atmosphere affects
the climate, the portion (roughly 25% of emissions) which is absorbed by the oceans increases ocean
acidity. Furthermore, the non-CO2 climate forcers (e.g. N2O, NOx, SO2, etc.) do not affect ocean
acidification. This approach is similar to other published LCA papers which have provided
characterization models for ocean acidification.63
Calculation Approach: The only considered emissions are carbon dioxide (CO2) and methane (CH4) from
cradle-to-grave. The conversion of these substances into carbonic acid (H2CO3) in the world’s oceans is
considered. There are two sources of oceanic H2CO3 to be considered, depending on the product
system: (1) The cradle-to-grave emissions of CO2 and CH4 occurring from paper production (e.g., net
forest regrowth, decomposition of belowground biomass), and (2) carbon storage losses resulting from
foregone growth resulting from logging. The PP-CF and M-CFs used to calculate results for this indicator
are available in Table 8 of Section 5.3.1 of the LCIA Methodology for PCR Modules.
3.6.3.2 Ocean Warming
Ocean warming measures increased ocean temperatures linked to emissions of greenhouse gases.
Although this impact is important and relevant to emissions and foregone growth from logging, no
algorithm is currently available to calculate results. Reflecting the critical nature of this impact category,
it is reported as relevant to pulp/paper production, although results cannot be evaluated at this time.
Terrestrial and Freshwater Ecosystem Impacts (from Emissions)
3.6.4.1 Sulfur Dioxide (SO2) and Other Acidifying Emissions/Regional Acidification
Acidifying emissions are chemical compounds such as sulfur dioxide, nitrogen oxides, and other acids
(e.g. ammonia) that are produced when boilers burn fuel containing sulfur and other acid-producing
substances. Of the fuels used in the paper industry, oil and coal generally contain the highest quantities
of sulfur. These acidifying emissions contribute to air pollution problems like acid rain and smog. This
category includes SO2 emissions, but also other acids and emissions like NOx. NOx forms ozone and can
also, in parallel, lead to acid rain. The impacts from acid rain are considered in the regional acidification
indicator; the health impacts from ozone are considered separately in the "Nitrogen Oxides (NOx)
forming Ground Level Ozone/Ground Level Ozone" indicator.
Calculation Approach: This impact category addresses cradle-to-grave impacts caused primarily from
acid rain on terrestrial and freshwater ecosystems. Some regions are much more sensitive to acid
deposition than others. The indicator characterizes the fraction of acidifying emissions which deposit
into sensitive soils. The results were calculated based on the potential release of hydrogen ions per kg of
acidifying emissions (PP-CF) and the fraction of acidifying emissions which deposit into sensitive soils
63 Bach, V., Möller, F., Finogenova, N. et al. Int J Life Cycle Assess (2016) 21: 1463. doi:10.1007/s11367-016-1121-x.

Life Cycle Impact Assessment Methodology for EPN Paper Calculator v4.0 May 14, 2018
May 2018 | ©SCS Global Services Page | 36
(M-CF). The fraction of emission which deposits into sensitive regions is determined from dispersion
plumes of acidifying emissions and differs by location of pulp and paper mill (see Appendix for details on
dispersion model used). The PP-CFs used to calculate results for this indicator are available in Table 9 of
Section 5.4.1 of the LCIA Methodology for PCR Modules64. The M-CFs applied for each paper grade differ
by location of the paper mill. To calculate the North American average results of paper grades for this
indicator, M-CFs were averaged across a representative sample of paper mills located in North America
for each of the 14 paper grades. Table 9 presents the average M-CFs applied for 100% virgin and 100%
recycled paper grades.
Table 9. M-CFs for 100% virgin and 100% recycled paper grades used to model North American average results for acidifying emissions/regional acidification indicator.
Type of Paper Grade
M-CF for 100% Virgin (fraction as a percent)
M-CF for 100% Recycled (fraction as a percent)
1. Coated Freesheet 49% 47%
2. Uncoated Freesheet 47% 46%
3. Coated Groundwood 63% 63%
4. Uncoated Groundwood 74% 47%
5. Supercalendered 66% 66%
6. Paperboard: Solid Bleached Sulfate 81% 40%
7. Paperboard: Coated Unbleached Kraft 95% 40%
8. Paperboard: Coated Recycled Board Not Applicable 40%
9. Paperboard: Uncoated Bleached Kraft 38% 48%
10. Paperboard: Uncoated Unbleached Kraft 54% 48%
11. Paperboard: Uncoated Recycled Board Not Applicable 48%
12. Linerboard 62% 36%
13. Corrugated 51% 51%
14. Tissue 58% 72%
3.6.4.2 BOD, COD and TSS Emissions
Biochemical oxygen demand (BOD) measures the amount of oxygen that microorganisms consume to
degrade the organic material in the wastewater. Discharging wastewater with high levels of BOD can
result in oxygen depletion in the receiving waters, which can adversely affect fish and other organisms.
Chemical oxygen demand (COD) measures the amount of oxidizable organic matter in the mill's effluent.
Since wastewater treatment removes most of the organic material that would be degraded naturally in
the receiving waters, the COD of the final effluent provides information about the quantity of more
persistent substances discharged into the receiving water.
Total suspended solids (TSS) measure solid material suspended in mill effluent, which can adversely
affect bottom-living organisms upon settling in receiving waters and can carry toxic heavy metals and
organic compounds into the environment.
64 Life Cycle Impact Assessment Methodology for PCR Modules for Roundwood and Pulp/Paper; https://www.scsglobalservices.com/files/program_documents/pcr_final_lcia-methodology_101816.pdf

Life Cycle Impact Assessment Methodology for EPN Paper Calculator v4.0 May 14, 2018
May 2018 | ©SCS Global Services Page | 37
Calculation Approach: Results consider cradle-to-gate estimates of BOD, COD and TSS, accounting for
BOD, COD and TSS generated in the production of pulping chemicals, coatings, fillers and other waste
treatment processes occurring in the upstream. They are reported as aggregated inventory results in
terms of pounds per mass of paper grade selected.
Note: The deinking and pulping processes for recycled paper can sometimes generate higher volumes of
wastewater discharges. Treatment of wastewater results in the formation of sludge waste. Sludge
generated from the deinking process contains minerals, coatings, fillers, ink particles and deinking
additives, resulting in BOD, COD and TSS generations. Therefore, the BOD and COD results for some
recycled paper grades are higher compared to virgin paper grades.
Impacts on Terrestrial and Freshwater Ecosystems (from Land Use and Conversion)
Four indicators (forest disturbance, freshwater disturbance, wetland disturbance and threatened
species disturbance) reported in the Paper Calculator belong to the group of impacts titled “Terrestrial
and Freshwater Ecosystem Impacts from Land Use” (see Section 7.2 of the Roundwood PCR65 and
Section 5.5 of the LCIA Methodology for PCR Modules66). These indicators account for land-use related
activities that can lead to physical disturbance which eventually leads to impacts to local or regional
ecosystems in terrestrial and freshwater settings. These impacts are inherently local, though the scale of
effects, both direct and indirect, can vary broadly.
Impacts to terrestrial and freshwater ecosystems from land-use activities around the world have
consequences on many scales. Impacts of concern to many stakeholders include loss of biodiversity,
changes in biosphere integrity, loss of endangered species, and more. In the production of paper, the
main contributing activity is logging. These activities directly alter ecological conditions in terrestrial and
freshwater ecosystems (i.e., lead to disturbances), which are measurable within ecosystems at many
different scales. It is critical to understand these impacts at the landscape scale, understanding not only
the impacts from direct harvest, but effects from fragmentation on adjacent forests.
3.6.5.1 Forest Disturbance
The forest disturbance indicator measures the degree to which activities affect forest ecosystems and
biodiversity. The indicator compares the ecosystem integrity of a harvested site to intact forests over 80
years old in the region, using on-the-ground measurements. It also considers the recovery potential
which would be possible on the site if harvesting were halted, reflecting the long-term implication of
forest management at suppressing ecosystem integrity. This is important to understand in terms of the
65 PCR Module for Roundwood Production: https://www.scsglobalservices.com/files/resources/pcr_final_wood-products_101816.pdf 66 Life Cycle Impact Assessment Methodology for PCR Modules for Roundwood and Pulp/Paper; https://www.scsglobalservices.com/files/program_documents/pcr_final_lcia-methodology_101816.pdf

Life Cycle Impact Assessment Methodology for EPN Paper Calculator v4.0 May 14, 2018
May 2018 | ©SCS Global Services Page | 38
“opportunity cost” of forest recovery suppression, which is salient both in understanding the effect of
current forest management on future disturbance levels, but also the possible carbon storage which
could be accrued in the forest.
Results of this indicator provide data on the current conditions of these impacts, within the fiber basket
for each paper grade. However, a critical component to understand ecosystem impacts is also the
duration and trend in conditions. Terrestrial and freshwater ecosystems, after significant and persistent
disturbance, can take decades to fully recover; and conversely, intact ecosystems can take long periods
of time to be converted into a highly disturbed state. For these reasons, it is critical to understand
whether the forest is improving or being further degraded in addition to the current state. Each affected
forest, if no longer subject to harvest, would recover over time.
Calculation Approach
Terrestrial systems are defined using the WWF Wildfinder database67 for ecoregions (see Figure 10);
within each terrestrial system, average ecological conditions such as average tree diameter, tree species
composition, and biomass are measured in specific Forest Analysis Units (FAUs) and compared to
undisturbed conditions. The deviation in ecological conditions is averaged to evaluate current terrestrial
disturbance, which provides a holistic and quantitative measure of understanding the severity of effects
on local terrestrial ecosystems. The site productivity is another parameter, which has a very important
effect on the embedded impact of fiber. For additional context, potential recovery, which could be
realized in forest ecosystems, is also provided. There was a high quality of data to evaluate terrestrial
disturbance for all paper grades. Figure 9 presents an example of the publicly available forest carbon
data on the US Forest Services website that was used for assessing this indicator.
67 WWF Wildfinder database; https://www.worldwildlife.org/science/wildfinder/

Life Cycle Impact Assessment Methodology for EPN Paper Calculator v4.0 May 14, 2018
May 2018 | ©SCS Global Services Page | 39
Figure 9. Snapshot of “Above and below ground carbon in live trees” dataset representing the forest carbon density for the states of California, Oregon, Washington, Wisconsin and Maine from the US Forest Services website68.
The foregone recovery of forest ecosystems was calculated in conformance with the Roundwood PCR,
the Pulp/Paper PCR and the guidelines specified in Section 5.5.1 of the LCIA Methodology for PCR
Modules. Based on the trend of disturbance (increasing, decreasing or recovering trend) determined
from historic data, the current level of terrestrial disturbance in the forest analysis unit was assumed to
continue with the same trend over the next 20 years, and then compared after 20 years to a
conservatively high estimate of rate of recovery (assuming that the forest system would recover by 2%
every year if the forests had not been harvested). Refer to Section 5.5.1.1 and 5.5.1.2 in LCIA
Methodology for PCR Modules69 for more details on equations and methodology. This indicator is not
applicable to 100% recycled paper.
3.6.5.2 Freshwater Disturbance
Logging can impact streams, rivers, and creeks, by increasing erosion, removing riverside vegetation,
and removing large woody debris which many fish species require for habitat. This indicator evaluates
the number of freshwater systems possibly affected by logging. This indicator is relevant to the product
system considered in this study and is highly variable across different regions. However, there was
insufficient data of comparable quality to identify affected freshwater systems across the scope of mills
68 https://apps.fs.usda.gov/fia/fido/ 69 Life Cycle Impact Assessment Methodology for PCR Modules for Roundwood and Pulp/Paper; https://www.scsglobalservices.com/files/program_documents/pcr_final_lcia-methodology_101816.pdf

Life Cycle Impact Assessment Methodology for EPN Paper Calculator v4.0 May 14, 2018
May 2018 | ©SCS Global Services Page | 40
considered in this assessment. Results could not be evaluated. This indicator is not applicable to 100%
recycled paper.
3.6.5.3 Wetland Disturbance
Logging can impact wetlands by increasing erosion, which will cause changes in sediment, temperature
and other characteristics of wetlands. Although this impact is important, no data is currently available to
calculate results. Reflecting the critical nature of this impact category, it is reported as relevant to
pulp/paper production, although results cannot be evaluated at this time. This indicator is not applicable
to 100% recycled paper.
3.6.5.4 Threatened Species Habitat Disturbance
Threatened species refers to effect on habitats of threatened species; the indicator evaluates the
possible species affected by harvesting of wood for paper production. Number of species sensitive to
logging operations in the fiber basket of the mill are included for all the paper grades. Guidelines
provided in Section 5.5.4 of the LCIA Methodology for PCR Modules70 document were used to assess this
indicator. Terrestrial systems are defined using the WWF Wildfinder database71 for ecoregions (see
Figure 10) in North America. The number of threatened species in fiber basket of the mills located in
these terrestrial ecoregions is estimated from the IUCN Red List database72.
70 Life Cycle Impact Assessment Methodology for PCR Modules for Roundwood and Pulp/Paper; https://www.scsglobalservices.com/files/program_documents/pcr_final_lcia-methodology_101816.pdf 71 WWF Wildfiner database; https://www.worldwildlife.org/science/wildfinder/ 72 IUCN Red List; http://www.iucnredlist.org/

Life Cycle Impact Assessment Methodology for EPN Paper Calculator v4.0 May 14, 2018
May 2018 | ©SCS Global Services Page | 41
Figure 10. The figure represents the terrestrial ecoregions across North America, as defined by WWF Wildfinder database. The red spots represent the location of the pulp and paper mills.
Calculation Approach: Included are all threatened categories of species affected by wood harvested for
pulp and paper production, based upon the definition of the “threatened categories” according to the
IUCN Red List Categories and Criteria Version 3.1 Second Edition73. This includes species (mammals,
amphibians, reptiles and birds) meeting the categories of Critically Endangered, Endangered, or
Vulnerable in the IUCN Red List database74. Only those species with habitats and/or populations
negatively affected by logging in the North American region were included. The number of species
included is based on correlation of logging threats assessed by IUCN and the fiber basket of pulp and
paper mills. This indicator is not applicable to 100% recycled paper.
73 IUCN Red List; http://www.iucnredlist.org/ 74IUCN Red List; http://www.iucnredlist.org/

Life Cycle Impact Assessment Methodology for EPN Paper Calculator v4.0 May 14, 2018
May 2018 | ©SCS Global Services Page | 42
Human Health Impacts (from Chronic Exposure to Hazardous Chemicals)
3.6.6.1 Nitrogen Oxides (NOx) Forming Ground Level Ozone/ Ground Level Ozone
Nitrogen oxides (NOx, which includes NO and NO2) are products of the combustion of fuels that contain
nitrogen. NOx emissions occur in pulp and paper mills due to the use of boilers and recovery furnaces to
produce the steam and electricity for pulp/paper production. NOx can react with volatile organic
compounds and sunlight in the lower atmosphere to form ozone, a key component of urban smog. NOx
can also, in parallel, lead to acid rain. The health impacts from ozone are considered here; the acid rain
impacts on the environment are considered separately in the "Sulfur Dioxide (SO2) and Other Acidifying
Emissions/Regional Acidification" category. Human health impacts are widely recognized to occur when
ozone near the Earth’s surface (ground level ozone, or “GLO”) is found at concentrations above critical
threshold concentrations, especially for prolonged periods of time.
Calculation Approach: This indicator addresses the cradle-to-grave human health impacts which can
occur when human populations are exposed to ground level ozone (GLO) at concentrations above the
safe health threshold defined by the World Health Organization (WHO). Based on guidelines provided in
Section 5.6.1 of the LCIA Methodology for PCR Modules, a PP-CF of 1 ton of ozone per ton of NOx
emission was used as default. The M-CF characterizes the exposure of human population to ground level
ozone at concentrations exceeding safe threshold defined by the WHO (see Appendix for details on
dispersion model used). The M-CFs applied for each paper grade differs by location of the paper mill.
The M-CFs were generated using air dispersion models of ground level ozone across a sample of
locations of pulp and paper mills. To calculate the North American average results of paper grades for
this indicator, M-CFs were averaged across a sample of representative paper mills located in North
America for each of the 14 paper grades. Table 10 presents the average M-CFs applied for 100% virgin
and 100% recycled paper grades.
Table 10. M-CFs for 100% virgin and 100% recycled paper grades used to model North American average results for ground level ozone indicator.
Type of Paper Grade
M-CF for 100% Virgin (persons * hrs. * ppb O3 / metric ton O3)
M-CF for 100% Recycled (persons * hrs.* ppb O3 /
metric ton O3)
1. Coated Freesheet 107 106
2. Uncoated Freesheet 189 185
3. Coated Groundwood 29.5 29
4. Uncoated Groundwood 68 69
5. Supercalendered 45 44
6. Paperboard: Solid Bleached Sulfate 60 324
7. Paperboard: Coated Unbleached Kraft 55 324
8. Paperboard: Coated Recycled Board Not Applicable 324
9. Paperboard: Uncoated Bleached Kraft 167 79
10. Paperboard: Uncoated Unbleached Kraft 558 79
11. Paperboard: Uncoated Recycled Board Not Applicable 79
12. Linerboard 60 387
13. Corrugated 102 103
14. Tissue 122 34

Life Cycle Impact Assessment Methodology for EPN Paper Calculator v4.0 May 14, 2018
May 2018 | ©SCS Global Services Page | 43
3.6.6.2 Particulates/PM 2.5 Impacts
Particulates are small airborne particles generated during combustion of fossil fuels and biomass in
boilers in pulp and paper mills. PM2.5 pose a range of health risks, including asthma and other
respiratory problems, when inhaled. This impact category considers the effect of particulate matter
(PM) emissions from pulp/paper production, contributing to smog. It addresses the health risks from
inhalation of particles less than 2.5 microns in diameter (PM2.5).
Calculation Approach: This indicator refers to human exposure to particulates smaller than 2.5 microns
at levels above human health thresholds. For indicator results, all primary particulate emissions are
included, as well as emissions which can convert into particulate matter in the atmosphere to form
secondary particulates. This impact category characterizes the mass of PM2.5 transported into the
atmosphere as the result of an emission (PP-CF) and characterizes the exposure of humans to fine
particulate matter, considering the local severity of health impacts linked to elevated levels of PM2.5.(M-
CF; see Appendix for details on dispersion model used). The M-CFs applied for each paper grade differs
by location of the paper mill. The PP-CFs used to calculate results for this indicator are available in Table
16 of Section 5.6.2 of the LCIA Methodology for PCR Modules. The M-CFs were generated using air
dispersion models of particulate emissions across a sample of locations of pulp and paper mills. To
calculate the North American average results of paper grades for this indicator, M-CFs were averaged
across a sample of paper mills located in North America for each of the 14 paper grades. Table 11
presents the average M-CFs applied for 100% virgin and 100% recycled paper grades.
Table 11. M-CFs for 100% virgin and 100% recycled paper grades used to model North American average results for PM2.5 Impacts.
Type of Paper Grade
M-CF for 100% Virgin (persons * hrs. *
microgram PM2.5 m-3 / metric ton PM2.5)
M-CF for 100% Recycled (persons * hrs. *
microgram PM2.5 m-3/ metric ton PM2.5)
1. Coated Freesheet 22 21
2. Uncoated Freesheet 60 58
3. Coated Groundwood 15 14
4. Uncoated Groundwood 39 501
5. Supercalendered 14 14
6. Paperboard: Solid Bleached Sulfate 19 560
7. Paperboard: Coated Unbleached Kraft 26 560
8. Paperboard: Coated Recycled Board Not Applicable 560
9. Paperboard: Uncoated Bleached Kraft 997 23
10. Paperboard: Uncoated Unbleached Kraft 77 23
11. Paperboard: Uncoated Recycled Board Not Applicable 23
12. Linerboard 25 117
13. Corrugated 20 20
14. Tissue 858 35
Life Cycle Impact Assessment Methodology for EPN Paper Calculator v4.0 May 14, 2018
May 2018 | ©SCS Global Services Page | 44
Note: In some instances, the M-CF for recycled mills are higher than M-CF of virgin mills, resulting in
higher ground level ozone and PM2.5 impacts for recycled papers compared to virgin papers. The M-CFs
are subject to the location of the paper mill and depends on the population exposure risk from
inhalation of ozone/particulates at the particular location. Generally, recycled paper mills emit lower
amount of particulates and nitrogen oxide emissions compared to virgin papers. However, the
population exposure to these emissions at levels above human health thresholds could be higher for
recycled paper mills compared to virgin paper mills depending on the population density surrounding
the location of the mill. Thus, use of mills located in different regions for a given paper grade could
influence results for PM2.5 and ground level ozone level impacts.
3.6.6.1 Hazardous Air Pollutants (HAPs), Total Reduced Sulfur (TRS) and Volatile Organic Compounds (VOCs) Indicators
Hazardous air pollutants (HAPs) include any of a group of 188 substances identified in the 1990 U.S.
Clean Air Act amendments because of their toxicity.
Total reduced sulfur (TRS) compounds cause the odor associated with kraft pulp mills. Exposure to TRS
emissions has been linked to symptoms including headaches, watery eyes, nasal problems, and
breathing difficulties.
Volatile organic compounds (VOCs) are a broad class of organic gases, such as vapors from solvent and
gasoline. VOCs react with nitrogen oxides (NOx) in the atmosphere to form ground-level ozone, the
major component of smog and a severe lung irritant.
HAPs, TRS and VOCs are mainly emitted from pulping process equipment such as recovery furnaces,
smelt dissolving tanks and industrial boilers.
Calculation Approach: Data for HAPs, TRS and VOC indicators were retrieved for all pulp and paper mills
operating in North America in year 2015 from US EPA’s Toxic Release Inventory (TRI) database75 and
Canada’s National Pollutant Release Inventory (NPRI) database76. Results for these indicators represent
cradle-to-grave aggregated inventory emissions of HAPs, TRS and VOC compounds.
Additional Environmental Information
In addition to the indicators reported above, the Paper Calculator provides aggregated inventory results for the following key indicators.
75 US EPA Toxic Release Inventory program; https://www.epa.gov/toxics-release-inventory-tri-program/tri-data-and-tools 76 National Pollutant Release Inventory(NPRI); Environment Canada; www.ec.gc.ca/npri

Life Cycle Impact Assessment Methodology for EPN Paper Calculator v4.0 May 14, 2018
May 2018 | ©SCS Global Services Page | 45
3.6.7.1 Mercury Emissions and Dioxins Emissions
Mercury is a very toxic substance which persists in the environment for very long periods of time.
Mercury emissions usually results from combustion of fuels containing trace amounts of mercury, which
subsequently transports in the atmosphere. Emissions can therefore lead to contamination in the
environment, including freshwater bodies and oceanic systems, subsequently exposing flora and fauna
to elevated concentrations. This result considers the amount of mercury emissions released across the
paper’s life cycle from cradle-to-grave.
Emissions of dioxins occur at pulp mills as a by-product of the chlorine bleaching process. Dioxin
emissions measures the amount of toxic dioxin emissions that are released to air and water from pulp
and paper mills. Dioxins are persistent and bioaccumulative, and even small amounts of emission can
contaminate local waterways and bioaccumulate in fish.
Calculation Approach: Data for mercury and dioxin indicators were retrieved for all pulp and paper mills
operating in North America in year 2015 from US EPA’s Toxic Release Inventory (TRI) database and
Canada’s National Pollutant Release Inventory (NPRI) database. Results for these indicators represent
cradle-to-grave aggregated inventory emissions of mercury and dioxins.
3.6.7.2 Solid Waste
Solid waste results are from cradle-to-grave and only include the amount of solid waste generated
during pulp and paper production, and amount of waste generated during the end-of-life phase. Solid
waste generated in upstream sources (e.g. pulping chemical production, electricity production,
coating/fillers, etc.) is excluded, consistent with the approach used in the previous version of the Paper
Calculator (V3.2).
Calculation Approach: Solid waste data on pulp and paper production is based on mix of USLCI and
Ecoinvent datasets (see Table 6 for more detail). During the end-of-life phase, a fraction of paper is
either recycled, landfilled or incinerated. Calculation for end-of-life are based on 2014 statistics
regarding municipal solid waste generation and disposal in the United States, from the US EPA77. These
data provide recycling rates for paper and packaging products. Based on information from the MSW
reports (see Table 4), 80% of the materials not recycled are assumed to go to a municipal landfill and the
remaining 20% are assumed to be incinerated. For the end-of-life phase, the amount of solid waste
generated from discarding 1 metric ton of paper is determined based on the fraction of paper that is
disposed in a landfill and a municipal incinerator. For example, according to the MSW report, the
recycling rate of newspaper is 68.2%, which means for 1 metric ton of paper disposed, 0.68 metric ton of
paper is recycled, and of the remaining 0.32 metric ton of paper, 80% is landfilled (i.e. 0.25 metric ton of
77 US EPA. Municipal Solid Waste Generation, Recycling, and Disposal in the United States: Tables and Figures for 2014. https://www.epa.gov/sites/production/files/2016-11/documents/2014_smmfactsheet_508.pdf

Life Cycle Impact Assessment Methodology for EPN Paper Calculator v4.0 May 14, 2018
May 2018 | ©SCS Global Services Page | 46
paper is landfilled) and 20% is incinerated (i.e. 0.07 metric ton paper is incinerated). Thus, the amount of
solid waste generated at the end-of-life of newspaper production would be 0.32 metric ton of paper.
3.6.7.3 Herbicides
Herbicides measures the amount of toxic herbicides used in growing trees for paper production.
Herbicides are applied to control the spread of non-desirable species. This indicator is relevant to the
product system considered in this study and is highly variable across different regions. However, there
was no data available to evaluate this indicator.
Factors Applied to Determine Equivalencies for Impact Indicators
Table 12 provides the equivalency factors used to determine equivalencies for Paper Calculator v4.0
indicator results. For the most part, the equivalencies applied in v4.0 are the same as in v3.2. However,
some equivalencies have been updated based on latest data made available by government agencies
such as the US EPA, Department of Energy, etc. These new equivalencies are indicated with an asterisk
(*) sign and heighted in blue text in the table below.
Table 12. Equivalency Factors applied for Paper Calculator v4.0 Indicators.
Paper Calculator v4.0 Outputs
Impact Indicator Name Unit of Measurement
Equivalency Used
Reference for Equivalency
Wood Use Fresh/green tons # of trees Approximately 6 trees per fresh ton of wood. The number of typical trees assumes a mix of hardwoods and softwoods 6-8" in diameter and 40' tall. Calculated collaboratively by Conservatree, Environmental Defense Fund, and Environmental Paper Network.
Total Energy BTUs # homes/year # residential refrigerators operated/year*
The average U.S. household uses 91 million BTUs of energy in a year78. Annual energy consumption is 0.84 million BTU for operating 1 refrigerator. This is based on estimates from the US Federal Standard79. The US Federal Standard is the maximum energy consumption in kWh/year allowed by the DOE for a residential refrigerator with a total volume of 7-15 cubic feet.
Greenhouse Gases/Climate Change Impacts
pounds CO2 equiv.
# of cars/year The average car emits 11,013 pounds of CO2e in a year80.
78 EIA (2016). 2016 Annual Energy Outlook, Table A4. 79 https://www1.eere.energy.gov/buildings/appliance_standards/pdfs/refrig_finalrule_frnotice.pdf 80 https://www.epa.gov/energy/greenhouse-gases-equivalencies-calculator-calculations-and-references

Life Cycle Impact Assessment Methodology for EPN Paper Calculator v4.0 May 14, 2018
May 2018 | ©SCS Global Services Page | 47
Paper Calculator v4.0 Outputs
Impact Indicator Name Unit of Measurement
Equivalency Used
Reference for Equivalency
Water Consumption gallons # swimming pools # of clothes washers operated/year*
1 Olympic-sized swimming pool holds 660,430 gallons81. The estimated annual water use of the washer under typical conditions is 1386 gallons per clothes washer. It is based on an annual usage of around 295 loads per year or around 6 loads per week, as referenced by Department of Energy (DOE) test procedure, Code of Federal Regulations Title 10, Section 430, Appendix J282.
Solid Waste pounds # of garbage trucks # people generating solid waste/day*
1 fully-loaded garbage truck weighs an average of 28,000 pounds (based on a rear-loader residential garbage truck). US EPA's 2012 Municipal Solid Waste (MSW) report83 estimates that an average of 4.38 pounds of solid waste is generated per person per day.
Nitrogen Oxides (NOx) Forming Ground Level Ozone/Ground Level Ozone
persons*hrs.*pounds O3 eq/m3
# of 18-wheelers/year # gasoline powered passenger cars/year*
The average 18-wheel truck emits 261 pounds of NOx per wheeler per year84. Based on GREET model's emissions factors85, the average gasoline powered car emits 3 pounds of NOx per car per year.
Purchased Energy million BTUs # homes/year # residential refrigerators operated/year*
The average U.S. household uses 91 million BTUs of energy in a year86. Annual energy consumption is 0.84 million BTU for operating 1 refrigerator. This is based on estimates from the US Federal Standard87. The US Federal Standard is the maximum energy consumption in kWh/year allowed by the DOE for a residential refrigerator with a total volume of 7-15 cubic feet.
Particulates/PM2.5 Impacts
persons*hrs.*pounds PM2.5 eq/m3
# of buses/year # gasoline powered passenger cars/year*
The average urban bus emits 11.2 pounds of particulate matter in a year.88 Based on GREET model's emissions factors89. The average gasoline powered car emits 0.17 pounds per car per year.
81 http://www.patagoniaalliance.org/wp-content/uploads/2014/08/How-much-water-does-an-Olympic-sized-swimming-pool-hold.pdf 82 https://energy.gov/sites/prod/files/2015/07/f24/clothes_washers_tp_finalrule.pdf 83 https://www.epa.gov/sites/production/files/2015-09/documents/2012_msw_fs.pdf 84 It is equivalent to 52,461 persons*hrs.*pounds O3 eq/m3 per wheeler per year. 85 Table A2 for passenger cars; https://greet.es.anl.gov/files/vehicles-13 86 EIA (2016). 2016 Annual Energy Outlook, Table A4. 87 Table A2 for passenger cars; https://www1.eere.energy.gov/buildings/appliance_standards/pdfs/refrig_finalrule_frnotice.pdf 88 It is equivalent to 1,680 persons*hrs.*pounds PM2.5/m3 per bus per year. 89 Table A2 for passenger cars; https://greet.es.anl.gov/files/vehicles-13

Life Cycle Impact Assessment Methodology for EPN Paper Calculator v4.0 May 14, 2018
May 2018 | ©SCS Global Services Page | 48
Paper Calculator v4.0 Outputs
Impact Indicator Name Unit of Measurement
Equivalency Used
Reference for Equivalency
Sulfur Dioxide (SO2) and Other Acidifying Emissions/Regional Acidification
pounds SO2 eq # of 18-wheelers/year
The average 18-wheel truck emits 3.1 pounds of SO2 in a year.
Volatile Organic Compounds (VOCs)
pounds # of passenger cars/year # number of miles driven in a car/year*
The average passenger car in the US emits 2.6 pounds of VOCs in a year. Based on GREET model's emissions factors90. The average gasoline powered car emits 0.0002 pounds of VOC per mile per year.
Hazardous Air Pollutants (HAPs)
pounds # of passenger cars/year
The average passenger car in the US emits 5 pounds of HAPs in a year.
Chemical Oxygen Demand (COD)
pounds # of homes/year The average home discharges 465 pounds of COD in a year91.
Biochemical Oxygen Demand (BOD)
pounds # of homes/year The average home discharges 186 pounds of BOD in a year92.
Total Suspended Solids (TSS) / Freshwater Eutrophication
pounds # of homes/year The average home discharges 207 pounds of TSS in a year93.
Forest Disturbance acres of disturbed area
# of equivalent football fields*
The average American football field occupies 1.32 acres94.
Ocean Acidification pounds H2CO3 # of cars/year The average car emits 11,013 pounds of CO2e in a year, which correlates to 3,881 pounds of H2CO3 per car per year.
Mercury Emissions milligrams of mercury
# of CFL lamps* According to EPA95, on average, CFLs contain about 4 milligrams of mercury sealed within the glass tubing.
*New equivalency introduced in Paper Calculator v4.0.
90 Table A2 for passenger cars; https://greet.es.anl.gov/files/vehicles-13 91 U.S. EPA NPDES Permit Writers’ Manual; https://www3.epa.gov/npdes/pubs/owm0243.pdf 92 U.S. EPA NPDES Permit Writers’ Manual; https://www3.epa.gov/npdes/pubs/owm0243.pdf 93 U.S. EPA NPDES Permit Writers’ Manual; https://www3.epa.gov/npdes/pubs/owm0243.pdf 94 Area calculated based on the standard dimensions of an American football field: 120 yards long and 53.33 yards wide. 95 https://www.epa.gov/cfl/what-are-connections-between-mercury-and-cfls

Life Cycle Impact Assessment Methodology for EPN Paper Calculator v4.0 May 14, 2018
May 2018 | ©SCS Global Services Page | 49
Sensitivity Analysis for Recycled Papers by Assigned Credit for Diversion of Wastepaper from Landfill
The current evaluation of results for the Paper Calculator (v4.0) uses a different allocation method for
modeling impacts of recycled paper compared to the previous version of the Paper Calculator (v3.2).
Overview of allocation method used in Paper Calculator v3.2
Paper Calculator v3.2 used an open loop recycling methodology, in which burdens for material
production, recovery and reprocessing and disposal were shared among the useful lives of the material,
reducing the burdens allocated to each use of the material. In the Paper Calculator v3.2, recycling of a
paper-based product was assumed to have an average of three useful lives: 1) pulp production and
paper-making and product use; 2) collection, fiber recovery, re-pulping, paper-making, and product use;
and 3) collection, fiber recovery, re-pulping, paper-making, product use, and disposal.
In the end-of-life phase, the impacts for recycling in Paper Calculator v3.2 included burdens for
collection and sorting of recovered paper and credits for waste diversion due to recycling—applied
twice, once after each of the first two useful lives—and final disposal impacts (from collection and
landfilling/incineration) after the third useful life. This open loop recycling methodology makes
assumptions about previous and subsequent life cycles, embedding a high degree of uncertainty. Hence
this approach was not used in the Paper Calculator v4.0.
Allocation method used in Paper Calculator v4.0: Paper Calculator v4.0 uses the recycled content
approach (also known as 100-0 cut off approach), whereby the impacts from the prior and subsequent
life cycles are not included (see Section 3.3.2 for more detail). In the current assessment, the recycling of
waste paper into recycled pulp does not provide any credit associated with the avoidance of landfill
impacts.
A sensitivity analysis was conducted for select indicators (GHG impacts, ocean acidification and solid
waste) by providing a credit for the amount of waste paper diverted from the landfill for making
recycled paper. The section below summarizes the calculation method used to assign the landfill
avoidance credit.
3.7.1.1 Calculation of the Landfill Avoidance Credit
The following landfill emissions are included: carbon dioxide (CO2) and methane (CH4), which would
have been emitted during paper decomposition in the landfill (also included is the combustion of
methane in some landfills). To calculate the credit, these emissions are considered to be “avoided” as a
result of the diversion of recycled wastepaper; these “avoided emissions” are attributed as a positive
environmental credit to recycled paper. The equation used to calculate the CO2 and CH4 emissions from
landfill are based on Equation 1, all evaluated per metric ton of carbon included in the wastepaper
diverted from landfill (itself roughly one third of the total mass of paper).

Life Cycle Impact Assessment Methodology for EPN Paper Calculator v4.0 May 14, 2018
May 2018 | ©SCS Global Services Page | 50
Equation 1. Calculation for avoided CO2 and CH4 from landfills. (A) Is the avoided CO2, in metric tons and
(B) is the avoided CH4, in metric tons. In both equations, C is the total mass of carbon in the wastepaper
diverted from landfill and used in the pulping process (in metric tons), while CH4 Combustion Fraction is
the fraction of methane combusted at the landfill site. 44/12 and 16.04/12 are respectively the molar
mass ratios of CO2 and methane CH4 to elemental carbon.
(𝐴) 𝐴𝑣𝑜𝑖𝑑𝑒𝑑 𝐶𝑂2 = 𝐶 × 0.5 ×44
12× (1 + 𝐶𝐻4 𝐶𝑜𝑚𝑏𝑢𝑠𝑡𝑖𝑜𝑛 𝐹𝑟𝑎𝑐𝑡𝑖𝑜𝑛)
(𝐵) 𝐴𝑣𝑜𝑖𝑑𝑒𝑑 𝐶𝐻4 = 𝐶 × 0.5 ×16.04
12× (1 − 𝐶𝐻4 𝐶𝑜𝑚𝑏𝑢𝑠𝑡𝑖𝑜𝑛 𝐹𝑟𝑎𝑐𝑡𝑖𝑜𝑛)
Example Calculation
The landfill avoidance credit for 1 metric ton of 100% Recycled Coated Freesheet Paper Grade was
calculated based on Equation 1 in the following manner:
C= Total mass of carbon in the wastepaper diverted from landfill = (34% carbon content96*1.1 metric ton
of wastepaper) = 0.374
CH4 combustion fraction = 100% (this is an assumption which results in a conservatively low positive
credit amount for recycled paper)
(a) Avoided CO2 = 0.374 x 0.5*x 44/12 x (1+ 100%) = 1.372 metric tons CO2e
(b) Avoided CH4= 0.374 x 0.5*x 16.04/12 x (1-100%) = 0 metric tons CO2e
Landfill avoidance GHG impact for 1 metric ton of 100% recycled coated freesheet paper = (a) + (b) =
1.372 metric tons CO2e per metric ton of paper = 3,019 pounds CO2e per metric ton of paper
GHG impacts for 1 metric ton of 100% recycled coated freesheet with landfill avoidance impacts = 8,249
pounds CO2e - 3019 pounds CO2e per metric ton of paper= 5,230 pounds CO2e per metric ton of paper.
Similarly, landfill avoidance credit was calculated for other paper grades. Figure 11 through Figure 13
presents results for select indicators (GHG Impacts, Ocean Acidification and Solid Waste) for 14 recycled
paper grades. These results include the application of a landfill avoidance credit for recycled papers. The
charts also illustrate the results for virgin paper grades and recycled paper grades (without credit) for a
basis of comparison with the results for recycled papers with a landfill avoidance credit.
96 Based on carbon content of materials tested in the following: (1) Barlaz, M.A. (1998). Carbon storage during biodegradation of municipal solid waste components in laboratory-scale landfills. Global Biogeochemical Cycles, 12 (2), 373–380 and (2) Wang, X., Padgett, J.M., De la Cruz, F.B., and Barlaz, M.A. (2011). Wood Biodegradation in LaboratoryScale Landfills. Environmental Science & Technology, 2011 (45), 6864-6871.

Life Cycle Impact Assessment Methodology for EPN Paper Calculator v4.0 May 14, 2018
May 2018 | ©SCS Global Services Page | 51
Figure 11. Sensitivity analysis is explored for the GHG Impact indicator for 100% Recycled Papers, by providing a credit for the amount of waste paper diverted from the landfill. For the purpose of comparison, results for 100% Virgin Paper and 100% Recycled Paper (without the credit) are illustrated in the chart.
20,86019,812 20,080
21,26520,424 20,988
20,326
17,103 17,070
20,181
15,085
26,184
8,249 8,390 8,161 7,681
9,640
3,773 3,773 3,773 3,293 3,293 3,293
5,271
3,516
8,124
5,230 5,449 4,942
2,698
6,182
-168 -168 -168
23
-648 -648
967
-822
4,123
-1,000
4,000
9,000
14,000
19,000
24,000
po
un
ds
CO
2e
pe
r to
n p
ape
r
Sensitivity Analysis : GHG Impacts100% Virgin Paper 100% Recycled Paper 100% Recycled Paper (with landfill avoidance credit)

Life Cycle Impact Assessment Methodology for EPN Paper Calculator v4.0 May 14, 2018
May 2018 | ©SCS Global Services Page | 52
Figure 12. Sensitivity analysis is explored for the Ocean Acidification indicator for 100% Recycled Papers, by providing a credit for the amount of waste paper diverted from the landfill. For the purpose of comparison, results for 100% Virgin Paper and 100% Recycled Paper (without the credit) are illustrated in the chart.
2,716
3,299
4,311
5,690
4,155
3,673
4,217
2,284
3,078
4,586
2,238
6,146
1,374 1,449 1,640 1,491
1,843
1,033 1,033 1,033 921 921 921
1,534
841
1,554
310 413 505
-265
624
-355 -355 -355 -467 -467 -467
18
-687
144
-1,000
0
1,000
2,000
3,000
4,000
5,000
6,000
7,000
po
un
ds
H2
CO
3 p
er
ton
pap
er
Sensitivity Analysis: Ocean Acidification100% Virgin Paper 100% Recycled Paper 100% Recycled Paper (with landfill avoidance credit)

Life Cycle Impact Assessment Methodology for EPN Paper Calculator v4.0 May 14, 2018
May 2018 | ©SCS Global Services Page | 53
Figure 13. Sensitivity analysis is explored for the Solid Waste indicator for 100% Recycled Papers, by providing a credit for the amount of waste paper diverted from the landfill. For the purpose of comparison, results for 100% Virgin Paper and 100% Recycled Paper (without the credit) are illustrated in the chart.
The application of a credit for diversion of wastepaper from landfills increases the differential between
results for 100% Virgin Papers and 100% Recycled Papers. The negative relative impact results are due
to the significant impact of paper disposal in landfills that is credited to deinked pulp. For example,
paper grades with high recycling rates such as paperboard (89% recycling rate according to US EPA)
receive larger credits at the end-of-life, resulting in negative results for some paper grades. The
sensitivity analysis results indicate that 100% Recycled Papers appear highly favorable compared to
100% Virgin Papers, even without the application of the landfill avoidance credit.
1,309 1,2981,216
874
1,182
517 517 557 517445 468
313
1,211 1,208 1,182
859
1,159
238 238 238 234 234 234
405 409
289 234 231 205300
18244 44 44 40 40 40
211 215
-688-750
-250
250
750
1,250
po
un
ds
pe
r to
n p
ape
rSensitivity Analysis: Solid Waste
100% Virgin Paper 100% Recycled Paper 100% Recycled Paper (with landfill avoidance credit)

Life Cycle Impact Assessment Methodology for EPN Paper Calculator v4.0 May 14, 2018
May 2018 | ©SCS Global Services Page | 54
4 Conclusions
This methodology document describes the factors used to update the Paper Calculator. In order to
update the Paper Calculator, the impact profile of 14 different paper grades manufactured in North
America were assessed using LCA in conformance with ISO 1404497, the draft LEO-S-002 standard98, the
Roundwood PCR99, the Pulp/Paper PCR100 and the LCIA Methodology for PCR Modules101. The data
sources, background datasets, assumptions, limitations and methodology used to assess 24 indicators
used in the Paper Calculator are included in this documentation.
97 ISO 14044:2006 Environmental management – Life Cycle Assessment – Requirements and guidelines 98 LEO-SCS-002 Standard Draft Dated June 2014. Leonardo Academy. http://www.leonardoacademy.org/programs/standards/life-cycle.html 99 PCR Module for Roundwood Production: https://www.scsglobalservices.com/files/resources/pcr_final_wood-products_101816.pdf 100 PCR Module for Pulp and Paper; https://www.scsglobalservices.com/files/program_documents/pcr_final_pulp_paper_101816.pdf 101 Life Cycle Impact Assessment Methodology for PCR Modules for Roundwood and Pulp/Paper; https://www.scsglobalservices.com/files/program_documents/pcr_final_lcia-methodology_101816.pdf

Life Cycle Impact Assessment Methodology for EPN Paper Calculator v4.0 May 14, 2018
May 2018 | ©SCS Global Services Page | 55
Appendix: Dispersion Models Used to Assess Regional Acidification, Ground Level Ozone and PM2.5 Impacts
Air quality models use mathematical and numerical techniques to simulate the physical and chemical
processes that affect air pollutants as they disperse and react in the atmosphere. Based on inputs of
meteorological data and source information (location, emission rates, stack height, etc.), these models
are designed to characterize primary pollutants that are emitted directly into the atmosphere and, in
some cases, secondary pollutants that are formed as a result of complex chemical reactions within the
atmosphere. The models are commonly used in regulatory applications by air quality management
agencies and others for a variety of purposes. For example, air quality models can be used during the
permitting process to verify that a new source will not exceed ambient air quality standards or, if
necessary, determine appropriate additional control requirements. In addition, air quality models can
also be used to predict future pollutant concentrations from multiple sources after the implementation
of a new regulatory program in order to estimate the effectiveness of the program in reducing harmful
exposures to humans and the environment.
Dispersion models use mathematical formulations to characterize the atmospheric processes that
disperse a pollutant emitted by a source. Based on emissions and meteorological inputs, a dispersion
model can be used to predict concentrations at selected downwind receptor locations. Within an LCIA,
typically simple dispersion models are used to estimate the geographic extent of pollutants dispersed
through the atmosphere from specific emission sources. Model outputs include the spatial extent,
concentration gradients, and pollutant depositions, of emitted chemical species based on locally-specific
meteorological conditions and emission source characteristics (stack locations, heights, temperatures,
flow-rates, etc.). In this LCA, these outputs are used to estimate human exposures to particulate matter
(PM) as well as to estimate pollutant depositions for regional acidification.
In the US, these air quality models are used to determine compliance with National Ambient Air Quality
Standards (NAAQS), and other regulatory requirements such as New Source Review (NSR) and
Prevention of Significant Deterioration (PSD) regulations. The USEPA provides guidance and support
(available at http://www.epa.gov/ttn/scram/guidanceindex.htm) for the use of numerous air quality
models which are periodically updated and revised to ensure the new model developments or expanded
regulatory requirements are incorporated. Access to, and descriptions, of air dispersion models and
more comprehensive photochemical transport models routinely used in air quality management studies
can be found at http://www.epa.gov/ttn/scram/. Included are primarily regulatory air quality models
and modeling systems recommended for use by the USEPA.
In addition to EPA regulatory models, the National Oceanic and Atmospheric Administration (NOAA) Air
Resources Laboratory (ARL) has developed a modeling system for trajectory, dispersion and deposition
which can be used to estimate air pollution concentrations, including ozone and PM, based on archive
meteorological data, regional emission inventories and a semi-empirical chemical mechanism for
atmospheric ozone formation. The Hybrid Single Particle Lagrangian Integrated Trajectory (HYSPLIT)

Life Cycle Impact Assessment Methodology for EPN Paper Calculator v4.0 May 14, 2018
May 2018 | ©SCS Global Services Page | 56
model and related input databases can be obtained from: http://ready.arl.noaa.gov/. A brief description
of the HYSPLIT air dispersion model is provided below.
The HYSPLIT model is a complete system for computing simple air parcel trajectories to complex
dispersion and deposition simulations. The initial development was the result of a joint effort between
NOAA and Australia's Bureau of Meteorology. Recent upgrades include enhancements provided by a
number of different contributors. New features include improved advection algorithms, updated
stability and dispersion equations, continued improvements to the graphical user interface, and the
option to include modules for chemical transformations. Without the additional dispersion modules,
HYSPLIT computes the advection of a single pollutant particle, or simply its trajectory.
Gridded meteorological data, on a latitude-longitude grid or one of three conformal (Polar, Lambert,
Mercator) map projections, are required at regular time intervals. The input data are interpolated to an
internal sub-grid. Calculations may be performed sequentially or concurrently on multiple
meteorological grids, usually specified from fine to coarse resolution.
The dispersion of a pollutant is calculated by assuming either puff or particle dispersion. In the puff
model, puffs expand until they exceed the size of the meteorological grid cell (either horizontally or
vertically) and then split into several new puffs, each with its share of the pollutant mass. In the particle
model, a fixed number of particles are advected about the model domain by the mean wind field and
spread by a turbulent component. The model's default configuration assumes a 3-dimensional particle
distribution (horizontal and vertical). Figure 14, shown below, presents an example of a concentration
plume resulting from the emission release from a single source calculated using the HYSPLIT model and
archived meteorological data fields.

Life Cycle Impact Assessment Methodology for EPN Paper Calculator v4.0 May 14, 2018
May 2018 | ©SCS Global Services Page | 57
Figure 14. Example concentration plume from single emission source (Source: http://www.arl.noaa.gov/HYSPLIT_info.php.)
A.1 Regional Acidification
Evaluation of the regional acidification impact category for LCIA requires the specification of the soil
sensitivity characteristics in order to determine the buffering capacity within the receiving environment
(area of deposition). The soil characteristics database used in the analyses presented herein are
described below. Inland water bodies are also included in the soils sensitivity mapping and indicator
calculations, as it is assumed that inland freshwater bodies are not buffered and are acid sensitive.
The Harmonized World Soil Database (HWSD) is a 30 arc-second raster database with over 15,000
different soil mapping units that combines existing regional and national updates of soil information
worldwide (SOTER, ESD, Soil Map of China, WISE) with the information contained within the 1:
5,000,000 scale FAO-UNESCO Soil Map of the World.
The resulting raster database consists of 21,600 rows and 43,200 columns, which are linked to
harmonized soil property data. The use of a standardized structure allows for the linkage of the attribute
data with the raster map to display or query the composition in terms of soil units and the
characterization of selected soil parameters. The global database includes the following relevant
parameters: organic carbon, pH, water storage capacity, soil depth, cation exchange capacity of the soil
and the clay fraction, total exchangeable nutrients, lime and gypsum contents, sodium exchange
percentage, salinity, textural class and granulometry. Links to access the GIS formatted digital databases

Life Cycle Impact Assessment Methodology for EPN Paper Calculator v4.0 May 14, 2018
May 2018 | ©SCS Global Services Page | 58
can be found at http://www.iiasa.ac.at/Research/LUC/External-World-soil-database/HTML/index.html.
Figure 15 displays the soil sensitivity class for North America based on the soil characterization
methodology of Kuylenstierna,102 derived from the Harmonized World Soil Database for the
conterminous US.
Figure 15. Soil sensitivity class based on the HWSD for North America. Soils of sensitivity class 1 (most sensitive) through sensitivity class 4 are classified, while soils of class 5 are not classified.
A.2 Ground Level Ozone Exposures
The accumulated AOT60 value expresses the hourly accumulated ozone concentration above 60 parts
per billion (ppb) during daytime hours throughout the ozone season, typically May through October, and
is expressed in ppb-hrs. Thus, the indicator represents the accumulated exposure risks, as the total
number of people exposed to an emission, multiplied by the hours of cumulative ozone exposure using
the AOT60 metric. Using this measurement, the category indicator result is scaled by the cumulative risk
factor (CRF) to reflect the severity of exceedance of threshold and accumulated risks from continued
multi-year exposures over this defined threshold.
However, in this study, which considered fiber production in regions around the world, a consistent
dataset containing information on ground level ozone concentrations was unavailable, presenting a
consistent assessment of all scenarios. This impact category could not be evaluated.
102 Kuylenstierna, J.C.I., Henning Rodhe, Steve Cinderby and Kevin Hicks. Acidification in Developing Countries: Ecosystem Sensitivity and the Critical Load Approach on a Global Scale. Ambio, Vol. 30, No. 1 (Feb., 2001), pp. 20-28.

Life Cycle Impact Assessment Methodology for EPN Paper Calculator v4.0 May 14, 2018
May 2018 | ©SCS Global Services Page | 59
A.3 PM2.5
The calculation of PM2.5 exposure risks requires the establishment of a Cumulative Risk Factor (CRF). In
the case of PM emissions, the CRF represents the increase in the severity of human exposure risks linked
to higher average ambient PM2.5 concentrations compared to a minimum ambient concentration level of
1 µg/m3. The category indicator result is scaled by the cumulative risk factor to reflect the severity of
PM2.5 exposure risks. Annual average ambient PM2.5 concentrations and CRF values across the world
were developed using monitored data from NASA.103
103 Global Annual PM2.5 Grids from MODIS, MISR and SeaWiFS Aerosol Optical Depth (AOD), v1 (1998 – 2012). http://sedac.ciesin.columbia.edu/data/set/sdei-global-annual-avg-pm2-5-modis-misr-seawifs-aod-1998-2012