life science journal 2014;11(11) › lsj › life1111 › 141_27255life111114_779_789.pdfas the rapd...
TRANSCRIPT
Life Science Journal 2014;11(11) http://www.lifesciencesite.com
779
Genetic divergence and phylogenetic relationship among five sparid species from the coastal waters of Egypt based on protein profiling and RAPD molecular markers
Safaa Ismaeil El-Deeb1, Ayman Salah El-Seedy2*, Ashgan Abdel Megeed Abo Gabal3, Hossam El-Din El-Wakeel3,
Nermin Abd El aziz Ibrahim1
1National Institute of Oceanography and Fisheries, Kayet Bey, Alexandria, Egypt. 2Department of Genetics, Faculty of Agriculture, Alexandria University, Aflaton St. 21545-EL-Shatby, Alexandria,
Egypt 3Agriculture Botany Department, Faculty of Agriculture, Saba-Bacha, Alexandria University,
*Corresponding author: [email protected]
Abstract: Genetic variations between five sparid species from the northern coastal waters of Egypt; namely Sparus aurata, Diplodus vulgaris, Diplodus sargus, Diplodus annularis and Lithognathus mormyrus; were analyzed using sodium dodecyl sulphate polyacrylamide gel electrophoresis (SDS-PAGE) of sarcoplasmic proteins and rondom amplified polymorphic DNA (RAPD) analyses. SDS-PAGE profiles of cellular sarcoplasmic proteins were diagnostic at the species level; clear cut interspecific variations were observed between the different species. The obtained results revealed a total number of 11 bands at relative front (RF) range from 0.17-0.87. There were four monomorphic bands, six polymorphic bands and one specific band in L. mormyrus at RF 0.83 and molecular weight between 17-30 kDa. The average of polymorphism among the different species was 54.5%. RAPD assays were performed using a 20 arbitrary decamer primer panel; however, only 16 primers yielded a total of 191 scorable bands, of which 139 (73℅) were polymorphic bands and 31 were specific markers. In addition, distinct bands (n = 5, 1 and 2) for D. sargus, L. mormyrus and S. aurata were obtained by using different primers, respectively. Similarity values ranged from 0.67 between L. mormyrus and D. annularis to 0.50 between D. sargus and S. aurata. The dendrogram showed that the five sparid species are separated from each other into two clusters: the first cluster included D. vulgaris and D. sargus, whereas the second cluster was divided into two groups, one included L. mormyrus and D. annularis, the other group S. aurata. In conclusion, these data serve as a useful tool for genetic identification and differentiation of these species in coastal water of Egypt and in the production of their interspecific hybrids. [Safaa Ismaeil El-Deeb, Ayman Salah El-Seedy, Ashgan Abdel Megeed Abo Gabal, Hossam El-Din El-Wakeel, Nermin Abd El aziz Ibrahim. Genetic divergence and phylogenetic relationship among five sparid species from the coastal waters of Egypt based on protein profiling and RAPD molecular markers Efficiency. Life Sci J 2014;11(11):779-789]. (ISSN:1097-8135). http://www.lifesciencesite.com. 141 Key words: Genetic variations, phylogenetic relationship, RAPD-PCR, sarcoplasmic protein, SDS-PAGE, Sparidae 1. Introduction
Species are the basic unit of fish biodiversity, since much of evolutionary biology focuses on species limits. An accurate estimate of species limits is a key factor in improving the accuracy and validity of biodiversity assessment (Puorto et al., 2001).
Family Sparidae, or sea breams, are demersal fishes distributed worldwide from temperate to tropical waters; many of them live in South African waters. They are chiefly marine, usually inshore, but some periodically enter estuaries (Hanel and Tsigenopoulos, 2011). Hermaphroditism, both protandrous and protogynous, is common in this family (Smith and Heemstra, 2003). There are about 112 species belonging to 35 genera (Fishbase, 2010). Most species of the family Sparidae, and especially those species native to the North Eastern Atlantic and Mediterranean coastal waters, are of high commercial importance as food and for recreational fishing (De la Herrán et al., 2001). The classification and the
phylogenetic relationships of these species, however, remain controversial because traditionally based mainly on the dentition and diet.
The family Sparidae is represented in the Mediterranean Sea by 11 genera) Dentex, Sparus, Diplodus, Pagellus, Pagrus, Lithognatus, Spondyliosoma, Oblada, Crenidens, Boops and Sarpa (and 24 species that usually inhabit coastal areas and produce pelagic eggs and larvae (Bauchot and Hureau, 1986). There are about 64 fish families present in Mediterranean waters of Egypt, which are represented by 202 species; of these, the family Sparidae is the most dominant, comprising 21 species (Ibrahim and Soliman, 1996). There are about 12 species of this family which are most frequent in the landed catch from Alexandria waters, on the northern coast of Egypt. Those with the highest economic value are Diplodus annularis, Diplodus sargus, Diplodus vulgaris, Lithognathus mormyrus and Sparus aurata. Seabreams represented about 15% of the landed catch
Life Science Journal 2014;11(11) http://www.lifesciencesite.com
780
in 2011 from Egyptian Mediterranean waters (GAFRD, 2008).
Genetic analysis of electrophoretically detectable variation is a useful mean of inferring the genetic structures of natural and farmed populations and for delineating taxonomic relationships (Hauser et al., 1998). There are a number of different molecular marker techniques which have been applied to study genetic variation and fingerprinting in fish populations. The use of biochemical methods, such as isozymes and protein banding patterns for species identification has been frequently applied in fish (Na-Nakorn et al., 1998; Na-Nakorn, 2001). Furthermore, the use of biomolecular methods, such as the RAPD technique (Qiubai et al., 2006), AFLP technique (Simmones et al., 2006), and microsatellite DNA analysis (Wachirachaikam and Na-Nakron, 2007) have been adopted to analyze the genetic divergence and phylogenetic relationship among fish species.
Considering the high economic value of the Egyptian Mediterranean sparid species and the uncertainties surrounding their phylogenetic relationships owing to limited research, the present study was carried out to estimate the genetic structure and diversity among the most important five species of the family Sparidae in Egypt and to construct their phylogenetic relationships, using SDS-PAGE and RAPD-PCR markers. Studies on the genetic diversification and evolutionary relationships of these species are limited. So, the objective of this study was, therefore, to resolve the taxonomic ambiguities and document inter-specific genetic variability among these species.
2. Materials and Methods Protein Isolation and SDS-PAGE
Five species of the family Sparidae: S. aurata, D. sargus, D. vulgaris, D. annularis and L. mormyrus were used in the present study. Hundred specimens (20 for each species) were collected from the Eastern Harbour of Alexandria, Egypt and samples of white skeletal muscles were dissected out and frozen. Samples were then homogenized for 2 min in appropriate volume of extraction solution (50 mM Tris-HCl, pH 7.6).The homogenate was centrifuged at 8000 rpm /15 min. The obtained supernatant for all samples was used to determine the protein concentration according to Bradford (1976), then placed at -20o C until use. Protein samples were prepared by mixing 100 mg proteins with 5X sample application buffer (0.6 M Tris-HCl, pH 6.8, 1% (w/v) SDS, 10% B-mercaptoethanol, 10% sucrose and 0.05% bromophenol blue) to give a final concentration of 1X. Protein samples (100 mg) were then boiled in water bath for 4 min at 95o C and then subjected to
10% SDS-PAGE gel, according to Laemmli (1970). The control well was loaded with an appropriate volume of standard protein markers with molecular weights (MW) of 80, 30 and 17 kDa. RAPD-PCR analysis DNA extraction
Whole blood samples were collected from 50 fish individuals (10 for each species). It was withdrawn from heart and then transferred to separate 5-ml tubes containing K3-EDTA as anticoagulant. DNA was isolated from samples samples with the Thermo Scientific Gene Jet Blood Genomic DNA Purification Mini Kit (Fermentas, EU) according manufacturer’s instructions. The purified DNA was stored at -20oC until use. DNA concentration (µg/µl) was evaluated using a spectrophotometer. DNA purity was measured at 260/280 nm, and a reading greater than 1.8 was taken to indicate a high degree of purity (Sambrook and Russel, 2001). Additionally, the quality and quantity of sample DNA was determined by electrophoresis on a 1.5% agarose gel containing a 1kb DNA Ladder (Fermentas, EU) as a standard. Primer selection
DNA samples from each species were screened using a panel of 20 decamer arbitrary primers synthesized by Operon Technologies (Operon Technologies Inc., Alameda, USA). Primer codes and sequences are shown in Table 1. Sixteen primers were selected, based on their distinct polymorphisms revealing patterns of identifiable amplified bands. RAPD-PCR conditions and electrophoresis
RAPD-PCR was performed with the selected primers on pooled DNA samples to assess genetic diversity and DNA polymorphisms among the five species of the family Sparidae, and the results were used to construct a dendrogram. PCR was carried out in 25-µl reaction volume, containing 12.5µl of PCR master mix (Fermentas, EU), 2.5µl of decamer primer (10 pmol ml-1), 2.5µl of genomic DNA (25ng/µl), and 7.5µl of sterile distilled water. DNA amplifications were performed using a Biometra thermal cycler (Biometra, Germany) under the following cycling conditions: 40 cycles of 94oC for 30 s, 38oC for 30 s, and 72oC for 1 min. PCR products were visualized on 1.5% agarose gels stained with ethidium bromide (0.5µg/µl) following electrophoresis in 1X TBE buffer for 2 h at 100V. A 1kb DNA ladder (O´ Gene Ruler™ 1kb; Fermentas, EU) was used as a molecular size marker. Gels with clear banding patterns were photographed under UV light for documentation and further analysis. Statistical analysis
Gels of protein electrophoresis were analyzed using gel analyzer software program (ver. 3) while gel photographs of DNA electrophoresis were analyzed using Total Lab (ver. 2.01) and SPSS (ver.15)
Life Science Journal 2014;11(11) http://www.lifesciencesite.com
781
software. The profiles were scored as binary data (1 if the band present and 0 if absent). Similarity indices between species were calculated using the formula: Sxy = 2Nxy / (Nx +Ny) where Nxy is the number of bands shared by x and y species, Nx and Ny are the number of bands scored for each species, and Sxy is the similarity index between x and y species. SPSS program was used to construct a dendrogram of the combined binary data derived from all DNA patterns to determine the phylogenetic relationships between the studied species, according to the methods of Sneath and Sokal, (1973); Bardakci and Skibinski, (1994), using the unweighted pair group method of analysis (UPGMA). 3. Results and Discussion
The family Sparidae is of significant importance for marine aquaculture, due to their wide geographic distribution, favourable growth rates and high market demand (Oliva-Teles, 2000; Mylonas et al., 2004). In the northern coastal waters of Egypt, there are five species of this family with high economic value, namely S. aurata, D. sargus, D. vulgaris, D. annularis and L. mormyrus. Cellular protein profile
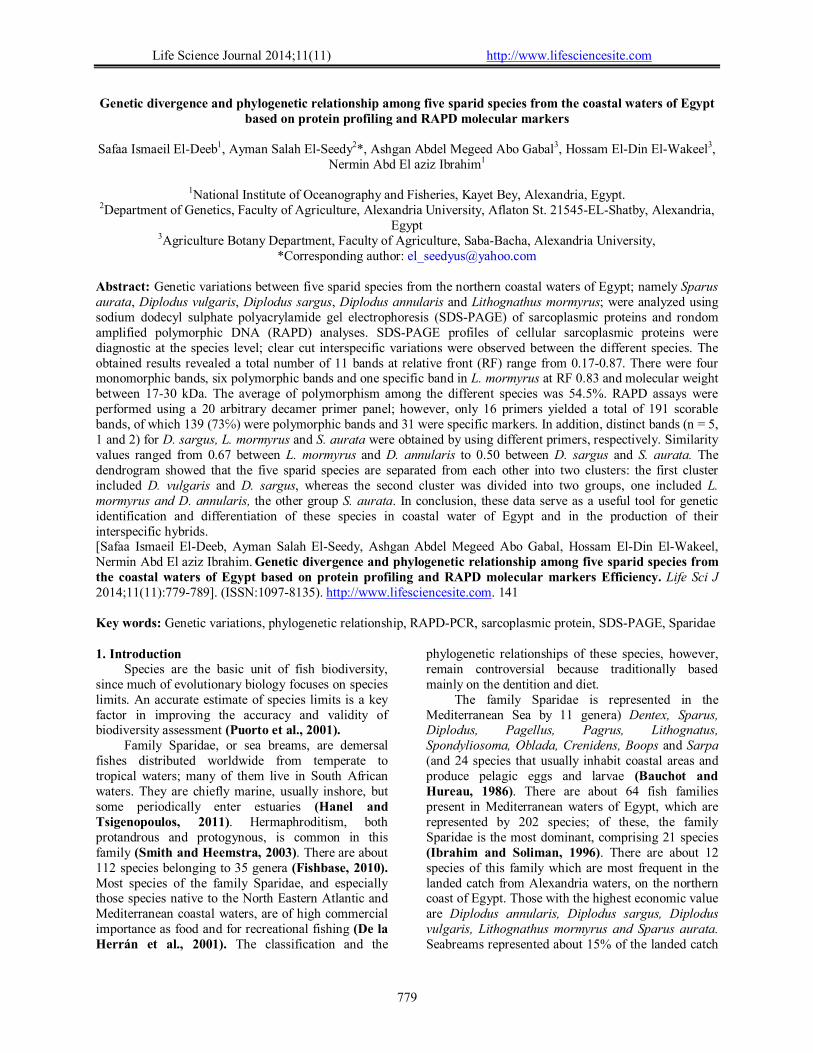
Electrophoretic analysis (SDS–PAGE) was carried out on sarcoplasmic proteins, whose patterns were diagnostic at the species level (Figure 1). The presence or absence of different bands in each species was illustrated as (1) for presence and (0) for absence. The total numbers of bands were 11 and ranged at relative front (RF) from 0.17-0.87 (Table 2). The total number of bands were: 10 in L. mormyrus and D. annularis, 8 in D. vulgaris and S. aurata, and 7 in D. sargus. There were 4 monomorphic bands, 6 polymorphic bands and a single specific band in L. mormyrus (at RF 0.83 and MW 17-30 kDa) which can be used as diagnostic genetic marker for species identification. The percentage of polymorphism among the different species was 54.5%.
Analysis of sarcoplasmic protein banding pattern had a value in fish characterization, since fish sarcoplasmic proteins are not denatured immediately after death unlike other proteins (Kjaersgård and Jessen, 2003). Furthermore, 25 to 35% of muscle protein is formed by sarcoplasmic proteins which include low MW (40-60 kDa) proteins, like myoalbumin, globulins and enzymes, that can be extracted from water and natural salt solutions and separated by electrophoresis methods (Huss, 1995 and Love, 1997).
On the other hand Basagalia, (1989) detected species specific electrophoretic and isoelectric focusing patterns in his study on the soluble proteins of the eye lens and white muscle of 4 species of the genus Diplodus (D. annularis, D. sargus, D. vulgaris,
and D. Puntazzo). Comparison of the protein profiles proved that D. annularis and D. sargus are closely related and distantly related to D.vulgaris. In addition, Basagalia and Marchetli (1991) examined the soluble proteins of white skeletal muscle tissue of 15 species of family Sparidae and detected species specific electrophoretic and isoelectric focusing patterns. They also found considerable similarity among species of the genera Sparus, Pagellus and Diplodus. RAPD profile
A panel of 20 decamer arbitrary primers was used to screen the DNA samples of each species. Only 16 primers: OPC20, OPA18, OPC08, OPC05, OPA7, OPA10, OPA14, OPB5, OPA15, OPAI, OPB12, OPC06, OPA1, OPB08, OPB10 and OPA16 produced distinct polymorphism with patterns of identifiable amplified bands. The results of RAPD profiles showed strongly differentiated fingerprints of the five sparid species, so their discrimination was easy. This coincides with the reports by Welsh and McClelland (1990); Hadreys et al., (1992). The RAPD-PCR results are shown in Figs. (2–9). DNA polymorphisms detected by RAPD were identified by two traits: first, by the presence (or absence) of one or more RAPD fragments of a particular size and second, by changes in the intensity of fragments of the same size. The RAPD technique has been widely used to estimate genetic variations within and among fish populations of D. sargus and D.vulgaris (Pereira et al., 2010) as well as Oreochromis niloticus (Rashed et al., 2008).
DNA fragments amplified with the 16 primers yielded a total of 191 scorable bands, out of which 139 (73%) were polymorphic bands, while 31 were specific markers and the rest common bands. The number of polymorphic bands was relatively high among the studied species and was acquired without any previous knowledge of the sparid genomes. All primers, except OPC20, OPA18, OPB12 and OPA1, generated species–specific markers as summarized in Table (3).
The RAPD-PCR technique, developed by Williams et al., (1990), was successfully used for the analysis of genetic similarities and for phylogeny reconstruction (Abdul Muneer et al., 2011; Bhati et al., 2012). Nevertheless, the effectiveness of RAPD markers in the detection of genetic polymorphisms within and among different species (random, un-characterized multiple genome loci; dominant nature of markers; and possibility of co-migrating, nonhomologus bands) can lead to limitations. Despite these limitations, RAPD analysis can be used effectively for the initial assessment of genetic variation among fish species (Barman et al., 2003).
Life Science Journal 2014;11(11) http://www.lifesciencesite.com
782
Figure 1. Protein bands for sarcoplasmic proteins of five sparid species obtained by SDS- PAGE and stained with coomassie blue: A= Lithognathus mormyrus (LM), B= Diplodus annularis (DA), C= Diplodus vulgaris (DV), D= Diplodus sargus (DS), E= Sparus aurata (SA), and E= bulked protein samples from each population. M= Protein Marker.
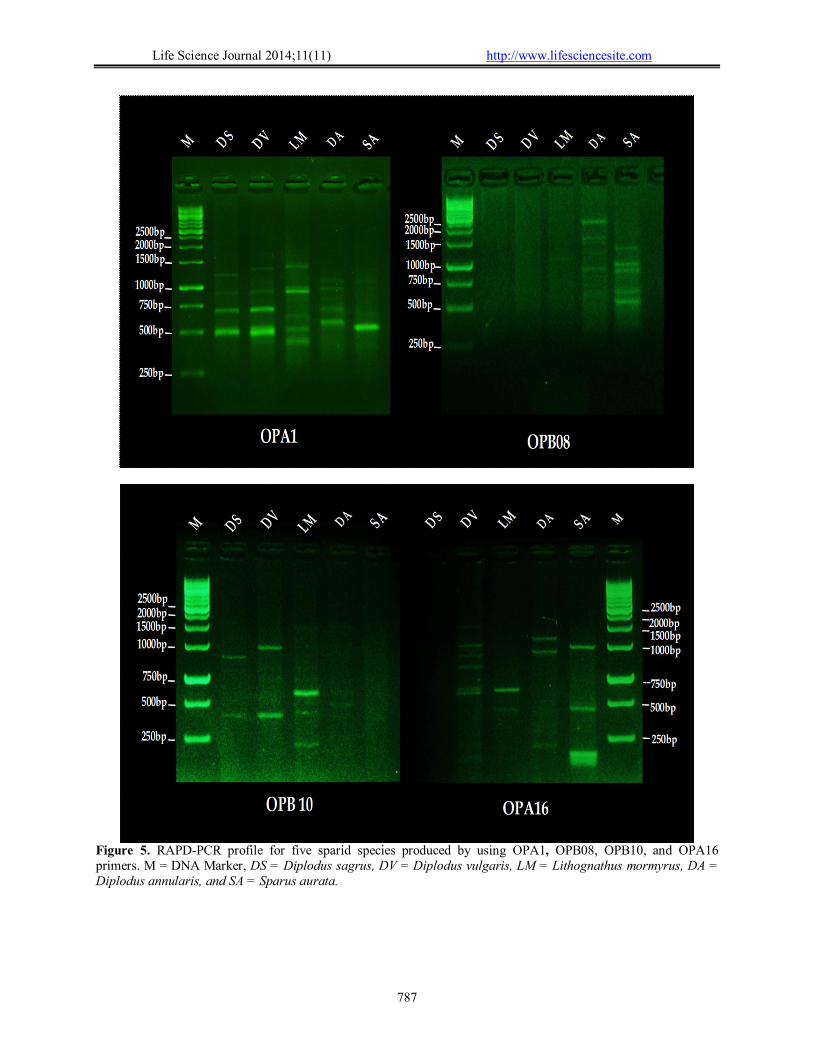
A number of distinguished bands, 5, 1 and 2, for the species D. sargus, L. mormyrus and S. aurata), respectively were obtained with different primers (OPA14 at MW 1134bp; OPA15 at MW 1426, 645, 514, 357 bp), (OPB10 at MW 213bp), and (OPB5 at MW 174 bp, OPC06 at MW 5621 bp) respectively. These bands are true genetic markers.
The similarity index among the sparid species was calculated according to band sharing. As shown in Table (4) and it is ranged from 0.672 between L. mormyrus and D. annularis to 0.502 between D. sargus and S. aurata.
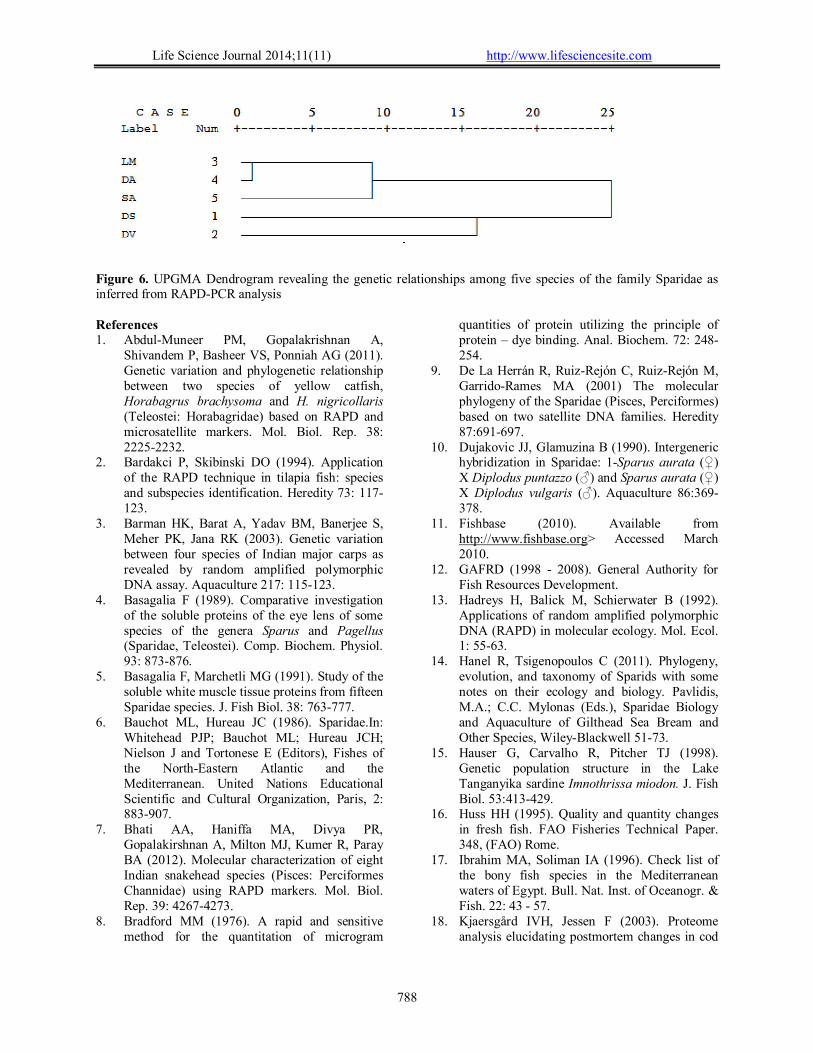
The analysis of RAPD data by the UPGMA cluster program divided the studied species into two
clusters, the first cluster included two closely related species (D. vulgaris and D. sargus), whereas the second cluster was divided to two groups, one group included another two closely related species (L. mormyrus and D. annularis), the other group contained S. aurata (Figure 10). Similar results were obtained by by De La Herrán et al., (2001), who studied the phylogenetic relationships of 16 sparid species by using two satellite DNA families. They found two major lineages: one including the species of the genera Diplodus, Sparus, Lithognathus, Spondilyosoma, Boops, Sarpa and Pagellus (P. bogaraveo), the other comprising the species of Dentex, Pagrus and Pagellus (P. erythrinus).
Life Science Journal 2014;11(11) http://www.lifesciencesite.com
783
Actually, Dujakovic and Glamuzina (1990) performed interspecific hybridization between Sparus aurata x Diplodus vulgaris and they obtained a successful hybrid.
In conclusion, our results suggest that, since Diplodus vulgaris is related to Diplodus sargus and
Lithognathus mormyrus to Diplodus annularis, these pairs might be crossed to generate successful hybrids. In addition, these data are valuable for both species characterization and breeding programs and we prospect the need for future research.
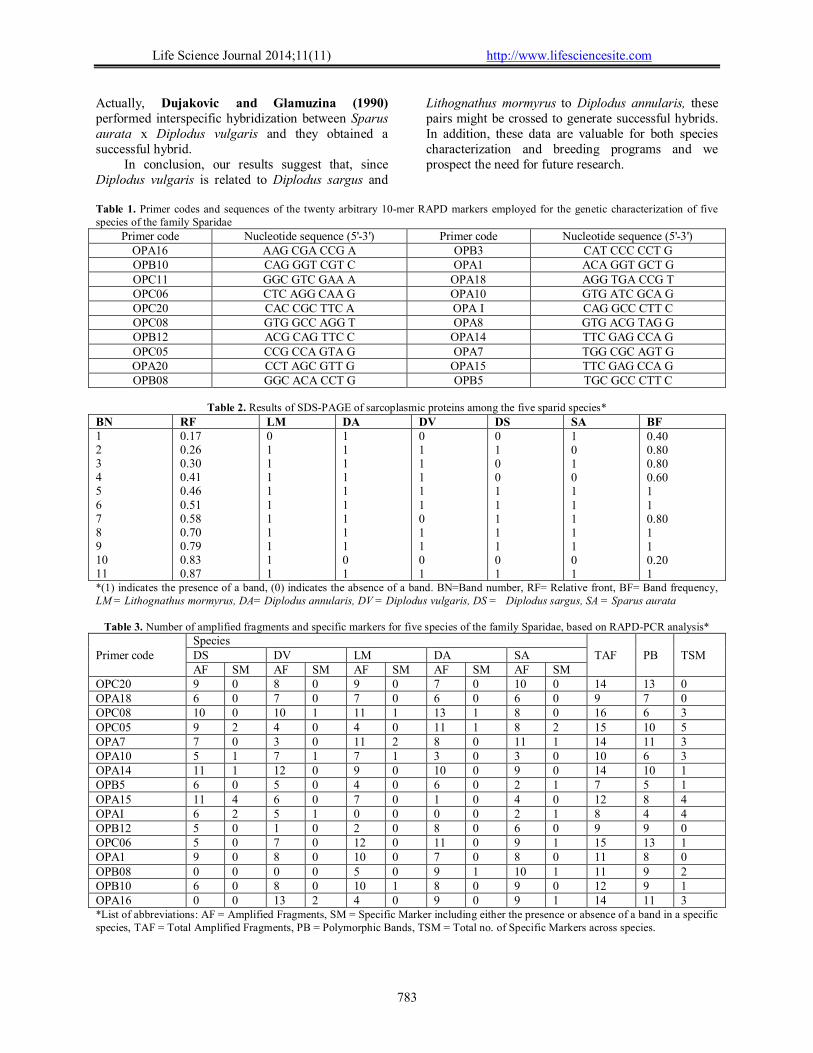
Table 1. Primer codes and sequences of the twenty arbitrary 10-mer RAPD markers employed for the genetic characterization of five species of the family Sparidae
Nucleotide sequence (5'-3') Primer code Nucleotide sequence (5'-3') Primer code CAT CCC CCT G OPB3 AAG CGA CCG A OPA16 ACA GGT GCT G OPA1 CAG GGT CGT C OPB10 AGG TGA CCG T OPA18 GGC GTC GAA A OPC11 GTG ATC GCA G OPA10 CTC AGG CAA G OPC06 CAG GCC CTT C OPA I CAC CGC TTC A OPC20 GTG ACG TAG G OPA8 GTG GCC AGG T OPC08 TTC GAG CCA G OPA14 ACG CAG TTC C OPB12 TGG CGC AGT G OPA7 CCG CCA GTA G OPC05 TTC GAG CCA G OPA15 CCT AGC GTT G OPA20 TGC GCC CTT C OPB5 GGC ACA CCT G OPB08
Table 2. Results of SDS-PAGE of sarcoplasmic proteins among the five sparid species*
BN RF LM DA DV DS SA BF 1 2 3 4 5 6 7 8 9 10 11
0.17 0.26 0.30 0.41 0.46 0.51 0.58 0.70 0.79 0.83 0.87
0 1 1 1 1 1 1 1 1 1 1
1 1 1 1 1 1 1 1 1 0 1
0 1 1 1 1 1 0 1 1 0 1
0 1 0 0 1 1 1 1 1 0 1
1 0 1 0 1 1 1 1 1 0 1
0.40 0.80 0.80 0.60 1 1 0.80 1 1 0.20 1
*(1) indicates the presence of a band, (0) indicates the absence of a band. BN=Band number, RF= Relative front, BF= Band frequency, LM = Lithognathus mormyrus, DA= Diplodus annularis, DV = Diplodus vulgaris, DS = Diplodus sargus, SA = Sparus aurata
Table 3. Number of amplified fragments and specific markers for five species of the family Sparidae, based on RAPD-PCR analysis*
Primer code Species
TAF PB TSM DS DV LM DA SA AF SM AF SM AF SM AF SM AF SM
OPC20 9 0 8 0 9 0 7 0 10 0 14 13 0 OPA18 6 0 7 0 7 0 6 0 6 0 9 7 0 OPC08 10 0 10 1 11 1 13 1 8 0 16 6 3 OPC05 9 2 4 0 4 0 11 1 8 2 15 10 5 OPA7 7 0 3 0 11 2 8 0 11 1 14 11 3 OPA10 5 1 7 1 7 1 3 0 3 0 10 6 3 OPA14 11 1 12 0 9 0 10 0 9 0 14 10 1 OPB5 6 0 5 0 4 0 6 0 2 1 7 5 1 OPA15 11 4 6 0 7 0 1 0 4 0 12 8 4 OPAI 6 2 5 1 0 0 0 0 2 1 8 4 4 OPB12 5 0 1 0 2 0 8 0 6 0 9 9 0 OPC06 5 0 7 0 12 0 11 0 9 1 15 13 1 OPA1 9 0 8 0 10 0 7 0 8 0 11 8 0 OPB08 0 0 0 0 5 0 9 1 10 1 11 9 2 OPB10 6 0 8 0 10 1 8 0 9 0 12 9 1 OPA16 0 0 13 2 4 0 9 0 9 1 14 11 3 *List of abbreviations: AF = Amplified Fragments, SM = Specific Marker including either the presence or absence of a band in a specific species, TAF = Total Amplified Fragments, PB = Polymorphic Bands, TSM = Total no. of Specific Markers across species.
Life Science Journal 2014;11(11) http://www.lifesciencesite.com
784
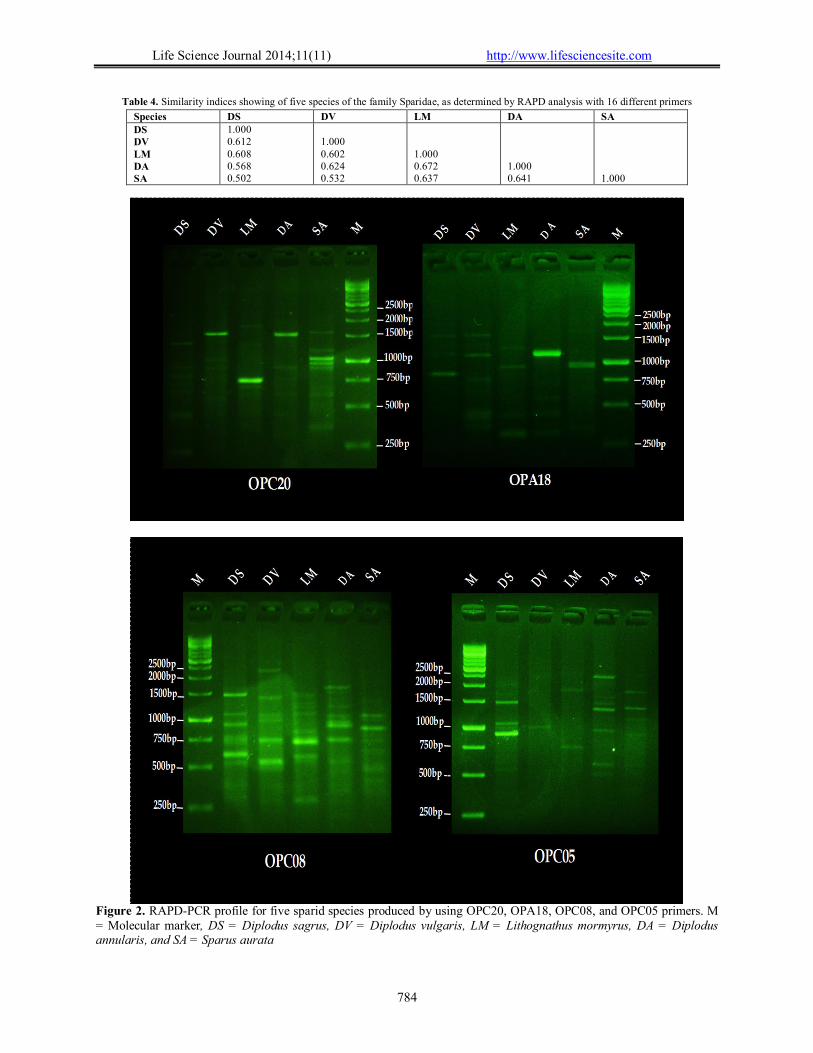
Table 4. Similarity indices showing of five species of the family Sparidae, as determined by RAPD analysis with 16 different primers
Figure 2. RAPD-PCR profile for five sparid species produced by using OPC20, OPA18, OPC08, and OPC05 primers. M = Molecular marker, DS = Diplodus sagrus, DV = Diplodus vulgaris, LM = Lithognathus mormyrus, DA = Diplodus annularis, and SA = Sparus aurata
Species DS DV LM DA SA DS DV LM DA SA
1.000 0.612 0.608 0.568 0.502
1.000 0.602 0.624 0.532
1.000 0.672 0.637
1.000 0.641
1.000
Life Science Journal 2014;11(11) http://www.lifesciencesite.com
785
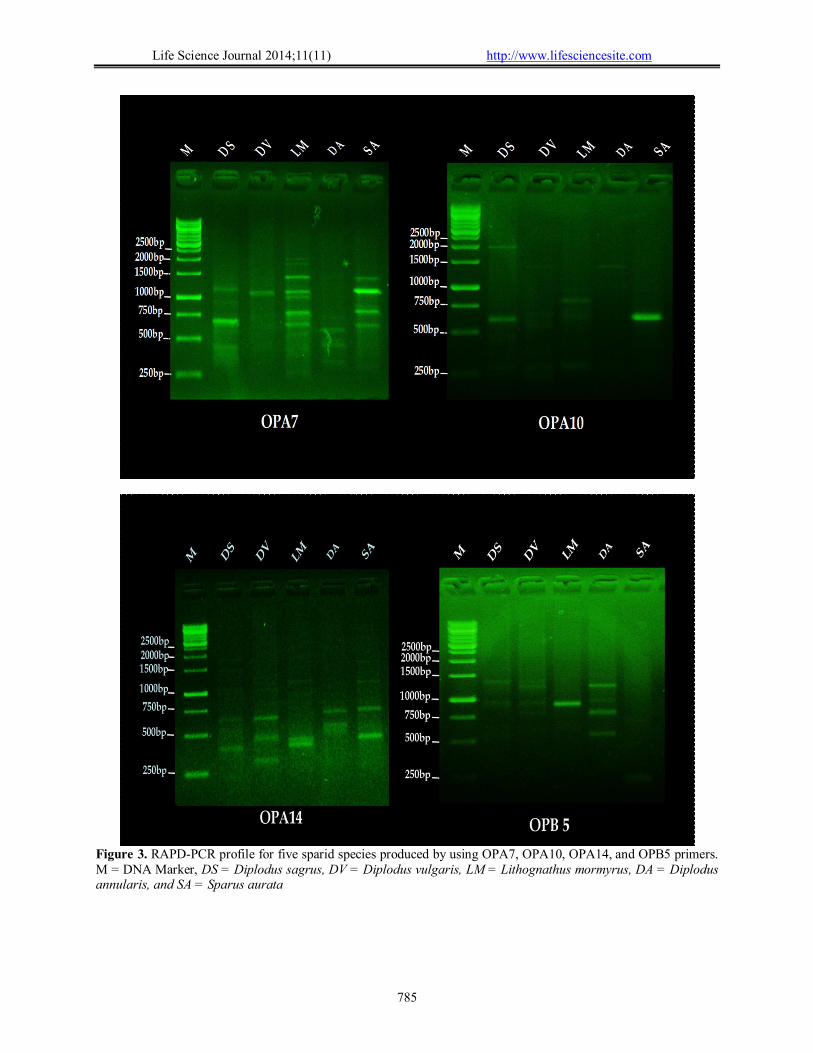
Figure 3. RAPD-PCR profile for five sparid species produced by using OPA7, OPA10, OPA14, and OPB5 primers. M = DNA Marker, DS = Diplodus sagrus, DV = Diplodus vulgaris, LM = Lithognathus mormyrus, DA = Diplodus annularis, and SA = Sparus aurata
Life Science Journal 2014;11(11) http://www.lifesciencesite.com
786
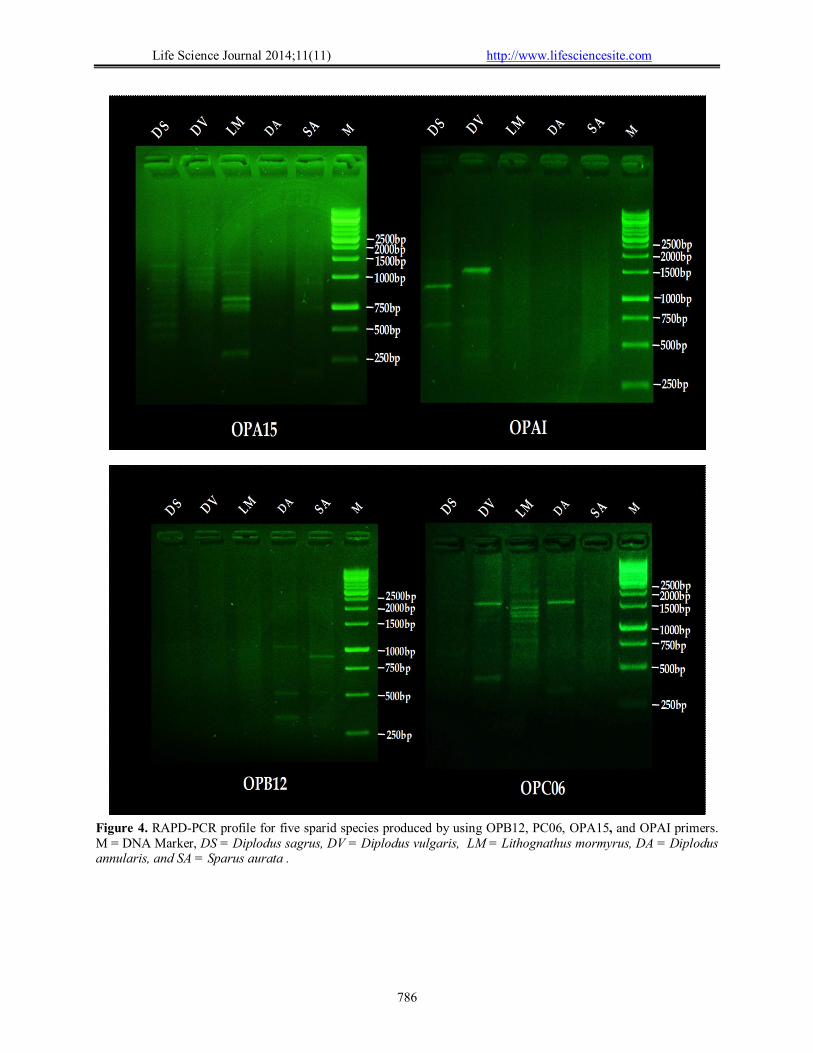
Figure 4. RAPD-PCR profile for five sparid species produced by using OPB12, PC06, OPA15, and OPAI primers. M = DNA Marker, DS = Diplodus sagrus, DV = Diplodus vulgaris, LM = Lithognathus mormyrus, DA = Diplodus annularis, and SA = Sparus aurata .
Life Science Journal 2014;11(11) http://www.lifesciencesite.com
787
Figure 5. RAPD-PCR profile for five sparid species produced by using OPA1, OPB08, OPB10, and OPA16 primers. M = DNA Marker, DS = Diplodus sagrus, DV = Diplodus vulgaris, LM = Lithognathus mormyrus, DA = Diplodus annularis, and SA = Sparus aurata.
Life Science Journal 2014;11(11) http://www.lifesciencesite.com
788
Figure 6. UPGMA Dendrogram revealing the genetic relationships among five species of the family Sparidae as inferred from RAPD-PCR analysis
References 1. Abdul-Muneer PM, Gopalakrishnan A,
Shivandem P, Basheer VS, Ponniah AG (2011). Genetic variation and phylogenetic relationship between two species of yellow catfish, Horabagrus brachysoma and H. nigricollaris (Teleostei: Horabagridae) based on RAPD and microsatellite markers. Mol. Biol. Rep. 38: 2225-2232.
2. Bardakci P, Skibinski DO (1994). Application of the RAPD technique in tilapia fish: species and subspecies identification. Heredity 73: 117-123.
3. Barman HK, Barat A, Yadav BM, Banerjee S, Meher PK, Jana RK (2003). Genetic variation between four species of Indian major carps as revealed by random amplified polymorphic DNA assay. Aquaculture 217: 115-123.
4. Basagalia F (1989). Comparative investigation of the soluble proteins of the eye lens of some species of the genera Sparus and Pagellus (Sparidae, Teleostei). Comp. Biochem. Physiol. 93: 873-876.
5. Basagalia F, Marchetli MG (1991). Study of the soluble white muscle tissue proteins from fifteen Sparidae species. J. Fish Biol. 38: 763-777.
6. Bauchot ML, Hureau JC (1986). Sparidae.In: Whitehead PJP; Bauchot ML; Hureau JCH; Nielson J and Tortonese E (Editors), Fishes of the North-Eastern Atlantic and the Mediterranean. United Nations Educational Scientific and Cultural Organization, Paris, 2: 883-907.
7. Bhati AA, Haniffa MA, Divya PR, Gopalakirshnan A, Milton MJ, Kumer R, Paray BA (2012). Molecular characterization of eight Indian snakehead species (Pisces: Perciformes Channidae) using RAPD markers. Mol. Biol. Rep. 39: 4267-4273.
8. Bradford MM (1976). A rapid and sensitive method for the quantitation of microgram
quantities of protein utilizing the principle of protein – dye binding. Anal. Biochem. 72: 248-254.
9. De La Herrán R, Ruiz-Rejón C, Ruiz-Rejón M, Garrido-Rames MA (2001) The molecular phylogeny of the Sparidae (Pisces, Perciformes) based on two satellite DNA families. Heredity 87:691-697.
10. Dujakovic JJ, Glamuzina B (1990). Intergeneric hybridization in Sparidae: 1-Sparus aurata (♀) X Diplodus puntazzo (♂) and Sparus aurata (♀) X Diplodus vulgaris (♂). Aquaculture 86:369-378.
11. Fishbase (2010). Available from http://www.fishbase.org> Accessed March 2010.
12. GAFRD (1998 - 2008). General Authority for Fish Resources Development.
13. Hadreys H, Balick M, Schierwater B (1992). Applications of random amplified polymorphic DNA (RAPD) in molecular ecology. Mol. Ecol. 1: 55-63.
14. Hanel R, Tsigenopoulos C (2011). Phylogeny, evolution, and taxonomy of Sparids with some notes on their ecology and biology. Pavlidis, M.A.; C.C. Mylonas (Eds.), Sparidae Biology and Aquaculture of Gilthead Sea Bream and Other Species, Wiley-Blackwell 51-73.
15. Hauser G, Carvalho R, Pitcher TJ (1998). Genetic population structure in the Lake Tanganyika sardine Imnothrissa miodon. J. Fish Biol. 53:413-429.
16. Huss HH (1995). Quality and quantity changes in fresh fish. FAO Fisheries Technical Paper. 348, (FAO) Rome.
17. Ibrahim MA, Soliman IA (1996). Check list of the bony fish species in the Mediterranean waters of Egypt. Bull. Nat. Inst. of Oceanogr. & Fish. 22: 43 - 57.
18. Kjaersgård IVH, Jessen F (2003). Proteome analysis elucidating postmortem changes in cod
Life Science Journal 2014;11(11) http://www.lifesciencesite.com
789
(Gadus morhua) muscle proteins. J. Agric. Food Chem. 51: 3985-3991.
19. Laemmli UK (1970). Cleavage of the structural proteins during the assembly of the head of the bacteriophage T4. Nature 227: 680-685.
20. Love RM (1997). Biochemical dynamics and the quality of fresh and frozen fish. In: Fish Processing Technology (Hall, G.M., ed.), Blackie Academic and Professional, Chapman & Hall, pp.1-26, London.
21. Mylonas CC, Papadaki M, Pavlidis M, Divanach P (2004). Evaluation of egg production and quality in the Mediterranean red porgy (Pagrus pagrus) during two consecutive spawning seasons. Aquaculture 232: 637–649.
22. Na-Nakorn U (2001). Genetic differentiation of fishes in the genera, Clarias and Prophagorus in Thailand, using protein electrophoresis and RAPD-PCR. In: Baimai, V, Kumhom R (Eds.), BRT Research Reports. Biodiversity Research Training Program. Jirawat Express, Bangkok, pp. 326–350.
23. Na-Nakorn U, Hara M, Taniguchi N, Seki S (1998). Isozymes variation of Clarias macrocephalus from four locations in Thailand. Fisheries Science 64:526–530.
24. Oliva-Teles A (2000). Recent advances in European sea bass and gilthead sea bream nutrition. Aquaculture International 8: 477–492.
25. Pereira JC, Lino PG, Leitão A, Joaquim S, Chaves R, Pousão-Ferreira P, Neves dos Santos M (2010). Genetic differences between wild and hatchery populations of Diplodus sargus and D. vulgaris inferred from RAPD markers: implications for production and restocking programs design. J. Appl. Genet. 51: 67-72.
26. Puorto G, Salmao M, Theakston R, Thorpe R, Warrell D, Wuster W (2001). Combining mitochondrial DNA sequences and morphological data to infer species boundaries:
phylogeography of lanceheaded pitvipers in the Brazilian Atlantic forest, and the status of Bothrops pradoi (Squamata: Serpentes: Viperidae). J. Evol. Biol. 14:527-538.
27. Qiubai Z, Fengbo I, Li Z, Jianfang G (2006). RAPD markers between yellow catfish (Pelteobagrus fulvidraco) and long whiskers yellow catfish (P. enpogen). ActaHydrobiol. Sinica 30: 482-485.
28. Rashed MA, Saad YM, Ibrahim MM, El-Seoudy AA (2008). Genetic structure of natural Egyptian Oreochromis niloticus evaluated using dominant DNA markers. Glob. Veterin. 2: 87-91.
29. Sambrook, J. and Russel, D. W. (2001) Molecular cloning: a laboratory manual. Cold Spring Harbor Laboratory press. Cold Spring Harbor, New York.
30. Simmones M, Mickett K, Kucuktas H, Li P, Dunham R, Lui J (2006). Comparison of domestic and wild channel catfish (Ictalurus punctatus) populations provides no evidence for genetic impact. Aquaculture 252: 133-146.
31. Smith MM, Heemstra PC (2003). Smiths’ Sea Fshes. Struik Publishers, Springer-Verlag.
32. Sneath PHA, Sokal RR (1973). Numerical taxonomy. W.H. Freeman, San Francisco.
33. Wachirachaikam A, Na-Nakorn U (2007). Application of population genetic improvement for African catfish (Claris gariepinus) Proceedings it. The 45thKasetstart University Annual Conference, 82-89, Kasetstart University, Bangkok, Thailand.
34. Welsh J, McClelland M (1990). Fingerprinting genome using PCR with arbitrary primers. Nucl Acid Res. 18: 7213-7218.
35. Williams JGK, Kubelik AR, Livak KJ, Rafalski JA, Tingey SV (1990). DNA polymorphisms amplified by arbitrary primers are useful as genetic markers. Nucl Acid Res. 18: 6531-6535.
10/28/2014