life support system technologies for nasa exploration missions · life support system technologies...
TRANSCRIPT

Life Support System Technologies for NASA Exploration Missions
Mike EwertDeputy Project Manager, Exploration Life Support Project
NASA Johnson Space Center
Army Research OfficeWorkshop on Base Camp Sustainability
September 12, 2007
https://ntrs.nasa.gov/search.jsp?R=20070030241 2018-06-13T00:25:20+00:00Z

National Astronautics and Space Administration

• Complete the International Space Station
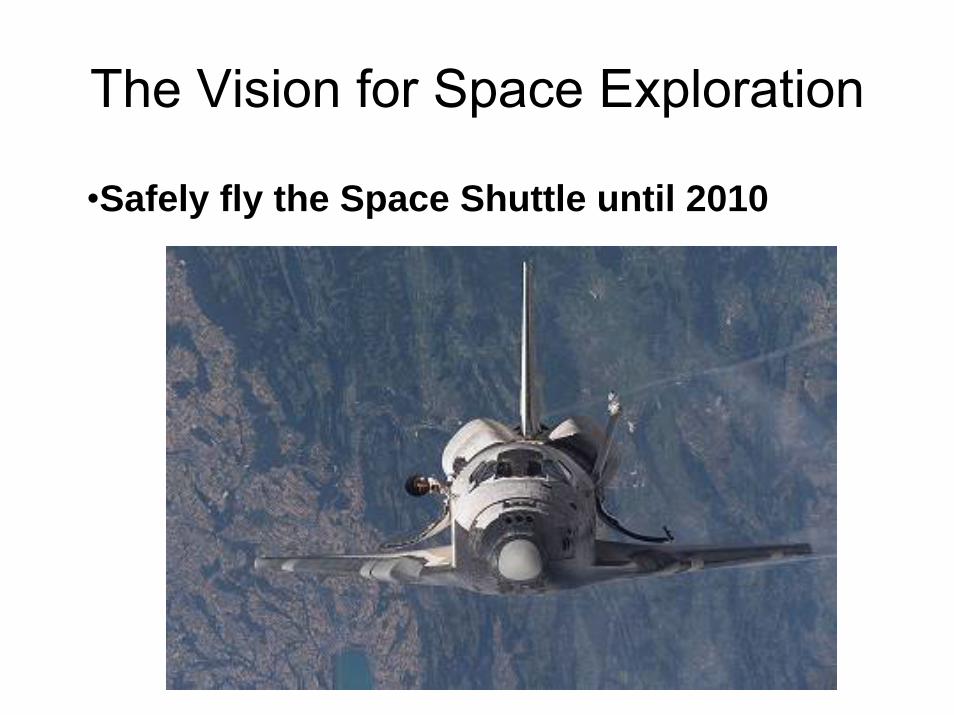
The Vision for Space Exploration
The Vision for Space Exploration
•Safely fly the Space Shuttle until 2010

The Vision for Space ExplorationDevelop and fly the Crew Exploration Vehicleno later than 2014
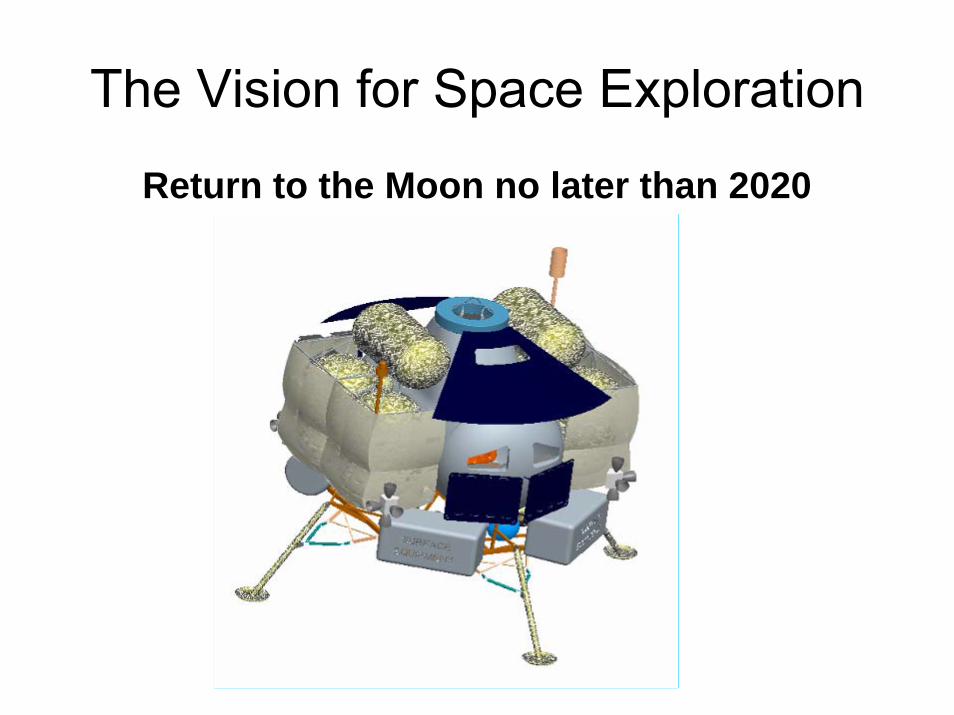
The Vision for Space Exploration
Return to the Moon no later than 2020

Human Life Support RequirementsOpen-Loop Life Support System
Resupply Mass - 12,000 kg/person-year(26,500 lbs/person-year)
Systems Maintenance 2.1%
Gases lost to space 2.1%
Crew Supplies 2.1%
Food (dry) 2.2%(Hydrated = 7%)
Oxygen 2.5%
Water 89%
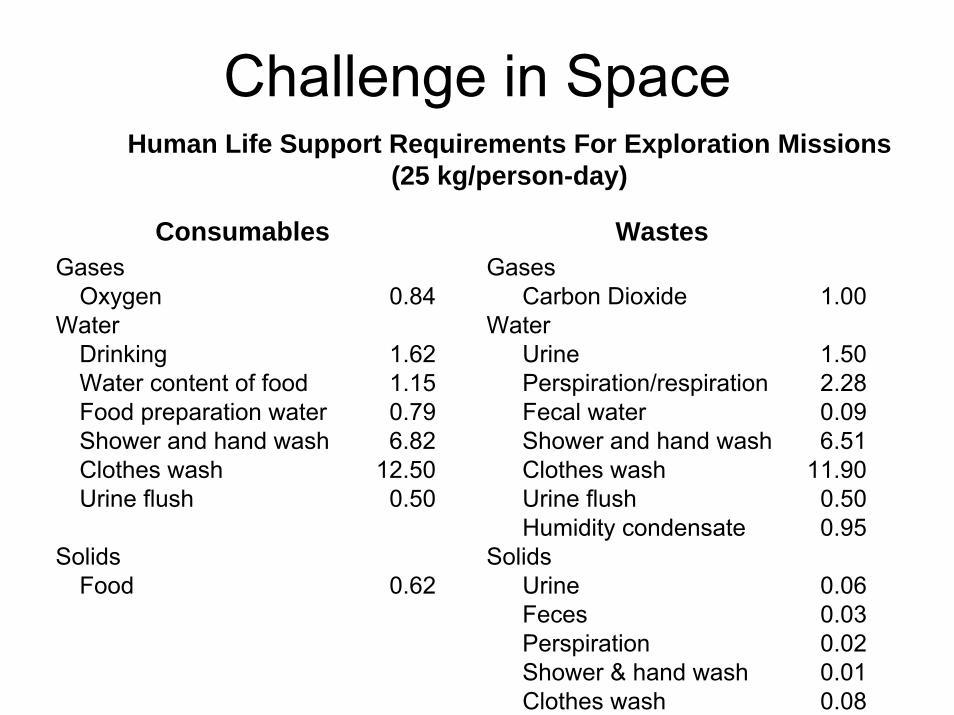
Challenge in SpaceHuman Life Support Requirements For Exploration Missions
(25 kg/person-day)
Gases GasesOxygen 0.84 Carbon Dioxide 1.00
Water WaterDrinking 1.62 Urine 1.50Water content of food 1.15 Perspiration/respiration 2.28Food preparation water 0.79 Fecal water 0.09Shower and hand wash 6.82 Shower and hand wash 6.51Clothes wash 12.50 Clothes wash 11.90Urine flush 0.50 Urine flush 0.50
Humidity condensate 0.95Solids Solids
Food 0.62 Urine 0.06Feces 0.03Perspiration 0.02Shower & hand wash 0.01Clothes wash 0.08
Consumables Wastes

Loop Closure• Desirable loop closure would minimize the supplied O2 and H2O as
well as recovery of resources from solid waste• The solution is sensitive to
– O2 and H2O resources consumed (not recovered) by EVA (large driver)– Moisture content in delivered food– Recycling technologies in terms of % recovery
8 May 2007; DHenninger/281-483-5034
Habitat
Supplied O2, H2O Air lost to leakage and airlock ops
Food with H2O food
H2O
O2 CO2
waste H2O
O2 and H2O to EVAwaste solids
Hygiene, Laundry, and
Cleaning
H2O waste H2ORepair parts

Exploration Life Support – Recycling & Closure
a Recycled wastewater was/will be electrolyzed; thus O2 is not re-supplied (hit to water closure, but some made up with water in stored food)
b Up to 69% if a Sabatier reactor is implemented to perform CO2 reduction CO2+4H2 CH4+ 2 H2O + CO2 + H2
c Complete CO2 reduction to C and O2 (assumes technology addition beyond Sabatier; e.g., Bosch reactor)
Recovery = mass recycled/ resources available
Closure = mass recycled & used/ total resources needed
91-Day LMLSTP
Phase 3 Test
ISS (complete)
Mars Technology Projections
Air Revitalization Systems% Recovery from CO2
% Closure56%
~ 100% a
Note: No EVA~ 100%~ 100%
92% g
100:1 g
Yes g
Yes
0% (≤69%?) b
~ 100 % a≥ 97% c
~ 100%
Water Recovery Systems% Recovery% Closure
93% d
63% a93 - ~ 100% e
See slide 7
Solid Waste Management% Recovery (H2O)Volume Reduction h
Waste StabilizationClothing Laundry
0 %0 %NoNo
90 to ~ 100 % f
10:1 to 100:1YesYes
8 May 2007; DHenninger/281-483-5034
d RISS Regenerative ECLSSe Add brine recovery to water or via solid waste system
to recover additional waterf Water Recovery g Only feces were incinerated, producing additional
waterg Reduced beyond hand compaction
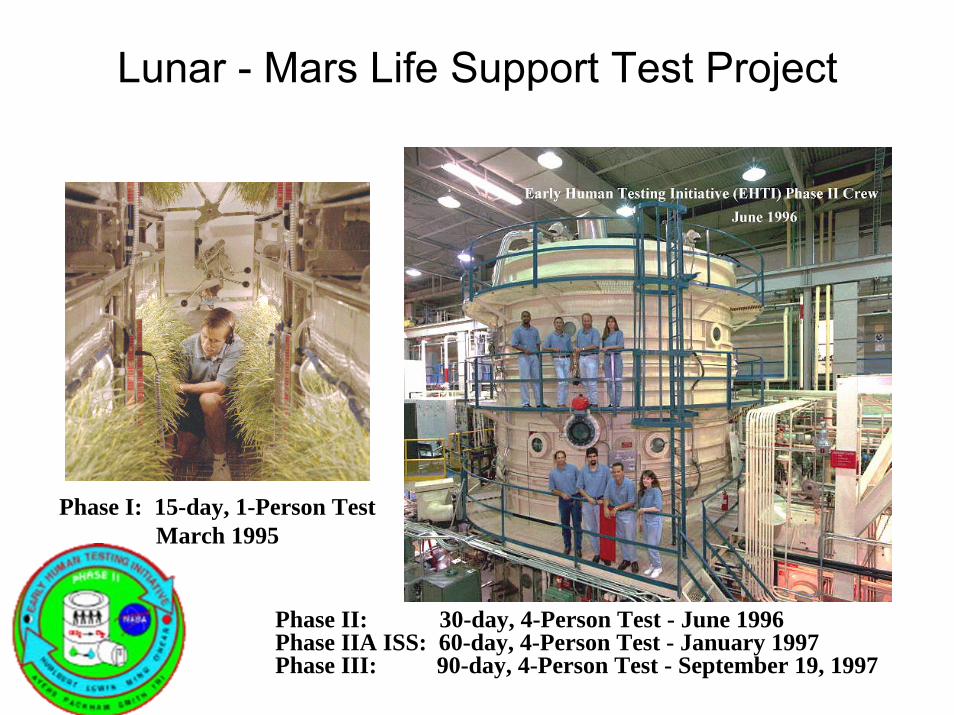
Lunar - Mars Life Support Test Project
Phase I: 15-day, 1-Person TestMarch 1995
Phase II: 30-day, 4-Person Test - June 1996Phase IIA ISS: 60-day, 4-Person Test - January 1997Phase III: 90-day, 4-Person Test - September 19, 1997

LMLSTP Phase II: Water Recovery System Requirements
Water Requirement (kg/person/day) kg
Wastes Generated (kg/person/day) kg
Shower water 6.36 Waste shower water 5.93Hand wash 3.64 Waste hand wash 3.53Clothes wash 12.50 Waste clothes wash 11.91Urine flush 0.50 Urine flush 0.50Food preparation water 0.68 Feces (solid) 0.03Drinking water 1.77 Fecal water 0.09Oral hygiene water 0.36 Sweat solids 0.02
Urine 1.91Urine solids 0.06Waste oral hygiene 0.36Condensate 3.01
Totals, per person 25.81 Totals, per person 27.35Totals, crew of four 103.24 Totals, crew of four 109.40

LMLSTP Phase II: Water Recovery System
Urine Treatment Subsystem
• Urine & Flush• Chemicals
Storage Tank
Primary Treatment Subsystem
• Hygiene Water (Sink & Shower)• Laundry• Condensate
Post Processing Subsystem
Brine Tank
Storage Tanks
Storage Tanks
Brine Tank
Potable Water Tanks
Urine Treatment SubsystemVapor Compression Distillation (VCD)
Primary Treatment SubsystemUltra Filtration/Reverse Osmosis (UF/RO)
Post Processing SubsystemVolatile Removal Assembly (VRA)Ion Exchange & Activated CarbonIodination

LMLSTP Phase II Test Results: Water Recovery System Performance
Subsystem Performance Over the 30-day test:• Urine Treatment Subsystem: Vapor Compression Distillation (VCD)
Mass of urine and flush water processed: 182 kg Mass of processed water produced: 179 kg Water recovery rate for the subsystem: 98.5 %
• Primary Treatment Subsystem: Ultra Filtration/Reverse Osmosis (UF/RO)
Mass of water processed: 3,090 kg Mass of purified water produced: 2,957 kg Water recovery rate for the subsystem: 95 %
Brines generated by both VCD and UF/RO over the 30 day test totaled ≈136 kg.
• Expected Quantities based on Nominal Human RequirementsUrine and flush water (4 crew * 30 d * 2.47 kg) = 296 kgWastewater (4 crew * 30 d * 24.88 kg) = 2986 kg

LMLSTP Phase III: Overview• 4 crew members for 91 days• Demonstrated an integration of advanced regenerative biological and physicochemical (P/C) technologies for life support.
• Two chamber facilities were interconnected• Air revitalization System
– Higher plants compliment P/C systems• Water Recovery System
– Microbial cell bioreactors were used for the primary treatment step
• Food System– The stored food system was supplemented with wheat grain for bread and fresh lettuce grown in situ
• Waste Management System (Demonstrations)– Incineration of human feces– Biodegradation of plant inedible materials

LMLSTP Phase III: Water Recovery System Requirements
Water Use/Waste Water Source
Water Allotment (kg/crew of 4/day)
Waste Water Generation
(kg/crew of 4/day)Laundry 50.00 47.64Shower 25.44 23.72Hand Wash 14.56 14.12Oral Hygiene 1.44 1.44Drinking 7.08 0.00Food Preparation 2.72 0.00Dish Washing 2.00 2.00Urine Flush 2.00 2.00Urine 0.00 7.64Condensate 0.00 12.04Total 105.24 110.6

LMLSTP Phase III: Water Recovery System
FeedTank
ICBAerationTank
Filters
ProductTank
ReverseOsmosis
AirEvaporationSubsystem
ROPermeate
Tank
AmmoniaRemoval
Subsystem
ProductTank
Post-Processor
APCOS
UV/IC0.2 µmFilter
MCV
TFB
Primary Treatment• Immobilized Cell Bioreactor (ICB)• Trickling Filter Bioreactor (TFB)Secondary Treatment• Reverse Osmosis (RO)• Air Evaporation Subsystem (AES)
Post Processing• Ammonium Removal Subsystem• Aqueous Phase Catalytic Oxidation (APCOS)• Ultraviolet/Ion Exchange (UV/IC)• Cold Sterilization (0.2 µm)• Microbial Check Valve - Iodination (MCV)
or
Brine
• A total of 8797 liters of potable water was produced by the system (96.7 L/day)• The starting volume of 878 L was cycled through the system 10 times• With the inclusion of the AES, recovery of water was essentially 100%

LMLSTP Phase III: Waste Management System Demonstrations
Biological Degradation of Inedible Biomass and Recovery of Nutrient Salts
• ½ of the wheat’s inedible biomass was mineralized using a stirred tank aerobic bioreactor.
• Recovered nutrient salts were returned to the plant growth systems.
• Wheat grown using recovered nutrient salts showed no difference in productivity compared to controls.
• Average degradation of total solids: 45% ( ≈ 26 kg biomass was treated)
• Average salt recovery: 80%.
Incineration of Human Feces and Recovery of Carbon Dioxide
• Human feces (8.2 kg total) were incinerated in a fluidized bed incinerator.
• Carbon dioxide exhaust was injected into the wheat chamber after treatment for trace contaminants

Summary & Lessons Learned• The Lunar Mars Life Support Test series successfully demonstrated
integration and operation of advanced technologies for closed-loop life support systems, including physicochemical and biological subsystems.
• Increased closure was obtained when targeted technologies, such as brine dewatering subsystems, were added to further process life support system byproducts to recover resources.
• Physicochemical and biological systems can be integrated satisfactorily to achieve desired levels of closure.
• Imbalances between system components, such as differences in metabolic quotients between human crews and plants, must be addressed.
• Each subsystem or component that is added to increase closure will likely have added costs, ranging from initial launch mass, power, thermal, crew time, byproducts, etc., that must be factored into break even analysis.
• Achieving life support system closure while maintaining control of total mass and system complexity will be a challenge.


ResourceUtilization
EnvironmentalQuality

Formation of the Sustainability Partnership at JSC
NASA/TM—2004–212069
Johnson Space Center’s Role in a Sustainable Future
Michael K. Ewert Lyndon B. Johnson Space Center Houston, Texas
• Partnership established in 2004 between Engineering and Center Operations– “ NASA…promotes technological
advances that can result in spin-off technologies“
– “NASA policy directives compel JSC to take action to reduce environmental impact”
– “The purpose of the Sustainability Partnership is to bring forward, coordinate and advertise innovative sustainability ideas and projects and to share the responsibility for environmental sustainability at JSC.”
www.

Antoine de-Saint-Exupery“As for the future, your task is not to foresee it, but to enable it.“

Backup Information

NASA’s Response• Administrator O’Keefe has endorsed an
Environmental Management System (EMS) at NASA and committed us to Sustainability principles
• Federal Executive Orders Require:– Solid waste reduction of 35% between 1997 and
2010– Energy reductions of 20-35% between 1990 and
2010– Installation of solar energy systems– Greenhouse gas reduction of 30% between 1990
and 2010– Reduction of toxic chemicals by 40%– Phase out of ozone depleting substances
Petroleum reduction of 20% between 1999 and 2005

Systems Engineering & Analysis Approach
• Ex. If energy saving lights and computers are used in a new building, the cooling system can be reduced, thus reducing the building volume, which saves more cooling and power
• Devised 15 Environmental Sustainability Indicators for JSC– Air Pollution: SO2 , NOx , Particulates, Carbon, Ozone depleting
substances– Resource Use and Waste: Solid waste, Water, Hazardous waste,
Paper, Aluminum cans– Energy: Electricity, Natural gas, Diesel, BTU/GSF, Non-renewable
energy %
• Ex. If a refrigerant additive can save JSC 3 million kWh/yr in energy, it also reduces– SO2 by 4,900 kg/yr– NOx by 3,400 kg/yr

Future Technologies Considered• Air
– Advanced air monitors• Agriculture & Food
• Crop based foods requiring little energy• Energy
– Higher efficiency motors– Clean coal & carbon sequestration– Nuclear fusion– Solar (inc. lunar PV power)– Bio-fuels– Various energy storage options
• Fuel Cells– PEM– Regenerative– Fuel cell landscape cart & mower
• Sustainable Habitats – LED lighting
• Thermal Control– Micro-electromechanical systems
(MEMS) cooling devices– Better refrigerants– High efficiency centrifugal chiller– Desiccant cooling systems– Solar powered refrigeration– Vacuum insulation– Refrigerator efficiency improvements
• Transportation– Fuel cell vehicles– Hypercar– Aerial vehicles
• Waste– Composting– Super-critical water oxidation– Disposable cup/utensil alternatives
• Water– Reuse for irrigation
Note: Those in blue were analyzed quantitatively

Recommendation:R&D Investment in
• Energy Efficient Habitability– Motors, computers, cooling, lighting, food
preparation and storage, “green building”• Waste Reduction/Reuse• Water Purification/Reuse• Renewable Energy Technologies
– Solar– Regenerative fuel cells
• Electric vehicles– Fuel cell & solar powered
We must move these from laboratory to daily life

Recommendation:Integrate Sustainability in Workplace
• Renewable Energy– Ex. Solar @ Mars field test site
• Energy Efficiency– Efficient air-conditioning– LED Stoplights– High reflectivity roofs
• Sustainable Buildings• Alternative Fuel Vehicles• Fuel Cell Cart for Landscaping
Commercial & Experimental
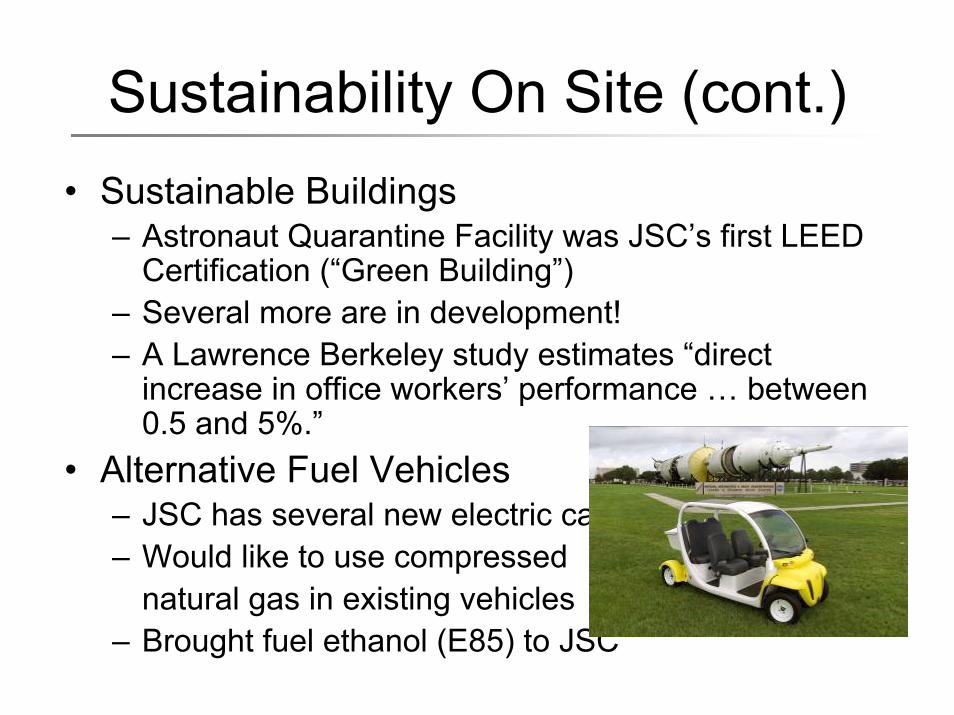
Sustainability On Site (cont.)• Sustainable Buildings
– Astronaut Quarantine Facility was JSC’s first LEED Certification (“Green Building”)
– Several more are in development!– A Lawrence Berkeley study estimates “direct
increase in office workers’ performance … between 0.5 and 5%.”
• Alternative Fuel Vehicles– JSC has several new electric carts– Would like to use compressed
natural gas in existing vehicles– Brought fuel ethanol (E85) to JSC

Education & Outreach
• Trying to increase Employee Awareness of Environmental Sustainability Issues– Environmental Management System (EMS)– Learn from NASA’s Earth Science Enterprise– Began a Natural Step training class
• Promote Community Awareness– Display at public events– Form partnerships (e.g. City)– Education outreach

THERMAL CONTROL
WATER
AIR
SOLID WASTE MANAGEMENT(RESOURCE RECOVERY)
THERMAL CONTROL
CROP PRODUCTION
RESEARCH AND TECHNOLOGY DEVELOPMENT
+ Fundamentals modeling
+ Basicresearch
+ Concept feasibility proven
+ Concept feasibility proven
+ Basicresearch
+ Model development
+ Operational envelope determination
+ Critical function verified
PAGE 1
+ Component/breadboard validation (laboratory
environment)
+ Scale-up parameters determined
FOOD PROCESSING

OxygenGeneration
System
Carbon Dioxide Reduction System
Carbon DioxideRemoval System
Solid Waste Incinerator
Biological WaterRecovery System
Control Room
VPGC Wheat Harvest
Phase III Crew (left to right, Nigel Packham, Laura Supra, John
Lewis, Vickie Kloeris)
TraceContaminant
Control System
Lunar-Mars Life Support Test ProjectPhase III 91-Day Test
September - December 1997

Air
&W
ater
Air
HP
O2
/ N2
H2
Urin
e
Unc
lean
Wat
erC
onde
nsat
e
Brin
e
Seal
ed,
Com
pact
edTr
ash
Con
dens
ate
Hyg
iene
Wat
er
Cle
anC
loth
ing
Hyg
iene
Wat
er
HP
O2
/ N2
Cle
an W
ater
CH
4
HP
CO
2
Vent
Outpost Option 2Spent Water, O2
Vent

Air
HP
O2
/ N2
HP
O2
H2
Urin
e
Con
dens
ate
Brin
e
Hyg
iene
Wat
er
Cle
anC
loth
ing
Hyg
iene
Wat
er
HP
O2
/ N2
Prod
uct
Wat
er
Cle
an W
ater
Vent
CO
2
Air &
Wat
er
Unc
lean
Wat
er
HTO
O2,
H2,
CO
2
Car
bon
H2,
O2,
Wat
er
Outpost Option 3 Spent Water, O2
Vent
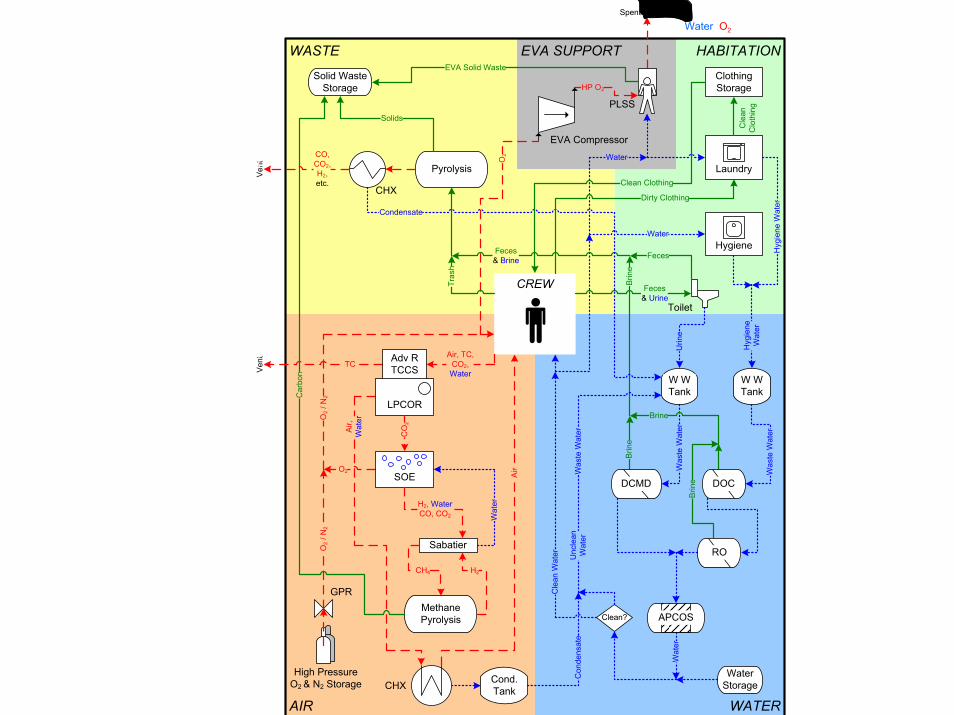
AIR WATER
HABITATIONEVA SUPPORTWASTE
CREW
Spent Water, O2
PLSS
Water Storage
Solid Waste Storage
Toilet
Feces& Urine
High PressureO2 & N2 Storage
GPR
EVA Compressor
HP O2
EVA Solid Waste
O2
Cond.Tank
W W Tank
CHX
Air,
Wat
er
Air
O2
/ N2
O2
Air, TC,CO2,Water
Clean?
Con
dens
ate
Wat
erW
aste
Wat
er
Brin
e
Cle
an W
ater
Brin
e
Feces& Brine
Tras
h
PyrolysisVent
Solids
Condensate
CO,CO2,H2,etc.
CHX
O2
/ N2
Unc
lean
Wat
erW
aste
Wat
er
Urin
e
W W Tank
APCOS
Was
te W
ater
Brin
e
Brine
DCMD DOC
RO
FecesHygiene
Water
Clothing Storage
Hyg
iene
Wat
er
Clean ClothingLaundry
Cle
anC
loth
ing
Water
Hyg
iene
Wat
er
Dirty Clothing
Sabatier
Methane Pyrolysis
Vent TC
Adv R TCCS
LPCOR
SOE
CO
2
CH4 H2
Car
bon
H2, WaterCO, CO2 W
ater
Outpost Option 4 Spent Water, O2
Vent
Vent